
General Linear Model, Fixed Factors, Global F Test, Partial Eta Squared and Residual Diagnostics
GLM ANOVA: General Linear Model ANOVA Formula, Fixed Factors, SPSS, Python, R and Excel Guide
GLM ANOVA means General Linear Model ANOVA. It extends ordinary ANOVA by allowing several fixed factors in the same model. In this worked example, G3 final grade is the numeric outcome, while studytime, school and sex are used as fixed factors. The supplied charts show group means, school-by-studytime cell means, F statistics by factor, global F distribution, partial eta squared, residuals versus fitted values, residual Q-Q plot, observed versus fitted values, Python report, R report and SPSS output.
Quick Answer: GLM ANOVA Result
The worked GLM ANOVA example shows that the model has a strong global result. The global F distribution chart reports observed F = 21.126, critical F = 2.228, df1 = 5 and df2 = 643. The observed F statistic is far to the right of the critical F value, so the combined fixed factors explain a statistically significant part of G3 variation.
The fixed-factor F statistic chart shows that school has the largest factor evidence, with an F statistic just above 50. Studytime is the next important source, with an F statistic around 9. Sex is smaller, with an F statistic around 7. The partial eta squared chart shows the same ranking: school has the largest partial eta squared near 0.073, studytime is near 0.041, and sex is near 0.011.
Final interpretation: The GLM ANOVA model is statistically significant. School is the strongest fixed factor in the supplied charts, studytime also contributes visible and statistical evidence, and sex contributes the smallest effect-size share. The model explains meaningful differences in G3, but the observed-versus-fitted and residual charts show that individual grades still vary widely around the model predictions.
Important reporting point: GLM ANOVA is not the same as a single one-way ANOVA. It tests multiple fixed factors in one general linear model, so each factor should be interpreted after controlling for the other fixed factors in the model.
Table of Contents
- What Is GLM ANOVA?
- GLM ANOVA Formula
- Fixed Factor Hypotheses
- Dataset and Variables Used
- Python Chart-by-Chart Interpretation
- R Chart-by-Chart Validation
- SPSS Output and Report PDFs
- SPSS, R, Python and Excel Workflows
- Code Blocks for GLM ANOVA
- APA Reporting Wording
- Common Mistakes
- When to Use GLM ANOVA
- Downloads and Resources
- Related Guides
- FAQs
What Is GLM ANOVA?
GLM ANOVA is an ANOVA fitted inside the General Linear Model framework. Ordinary one-way ANOVA compares one categorical factor. GLM ANOVA can include more than one fixed factor, interaction terms, covariates and planned model terms, depending on the design.
In this article, the GLM uses G3 final grade as the dependent variable and uses studytime, school and sex as fixed factors. The purpose is to test whether these fixed factors explain differences in mean G3 after accounting for the other factors in the same model.
The supplied charts show that the global model is strong. The global F statistic is 21.126 and the critical F value is 2.228. The factor-level chart shows that school has the strongest F statistic, studytime is also important, and sex has the smallest partial eta squared among the three fixed factors.
Simple definition: GLM ANOVA tests one numeric outcome against one or more fixed factors using the general linear model. It reports factor-level F statistics and effect sizes while controlling for the other terms in the model.
GLM ANOVA should be interpreted with ANOVA in Python, ANOVA in R, ANOVA in SPSS, ANOVA Assumptions, ANOVA Effect Size, Effect Size, Cohen’s F Formula, P Value and Null and Alternative Hypothesis.
GLM ANOVA Formula
A GLM ANOVA model expresses the numeric outcome as a linear combination of fixed factors and residual error.
For the supplied chart set, the outcome is G3. The fixed factors are studytime, school and sex.
The exact model may be expanded when interactions or covariates are included, but the supplied charts focus on fixed-factor evidence for studytime, school and sex.
Factor-Level F Statistic
Each fixed factor gets an F statistic. In the supplied fixed-factor F chart, school is the largest, studytime is second and sex is smallest. A larger F statistic means stronger evidence that the factor explains outcome variation after the other terms are included.
Global F Statistic
The global model chart reports observed F = 21.126 and critical F = 2.228. This means the full set of fixed factors explains more variation than expected from residual error alone.
Partial Eta Squared
Partial eta squared measures the practical size of each fixed factor while accounting for error variation. The supplied chart shows school as the largest effect-size source, studytime as the next source and sex as the smallest source.
| GLM ANOVA Component | Value or Pattern in This Output | Meaning | Reporting Interpretation |
|---|---|---|---|
| Global F statistic | 21.126 | Overall model evidence. | The fixed-factor model is statistically significant. |
| Critical F | 2.228 | Global model decision boundary. | Observed F is far above the boundary. |
| df1, df2 | 5, 643 | Model and residual degrees of freedom. | Used to judge the global F distribution. |
| Largest factor F | school | Strongest factor evidence in the chart. | School contributes the most visible fixed-factor signal. |
| Largest partial η² | school, near .073 | Largest practical fixed-factor effect. | School has the strongest effect-size share. |
Fixed Factor Hypotheses
GLM ANOVA tests a separate hypothesis for each fixed factor, and it can also test a global model hypothesis. The global hypothesis asks whether the model explains meaningful outcome variation. The fixed-factor hypotheses ask whether each factor contributes after the other model terms are considered.
| Hypothesis Area | Null Hypothesis | Alternative Hypothesis | Decision Pattern in the Charts |
|---|---|---|---|
| Global GLM model | The fixed-factor model does not explain G3 better than error alone. | The model explains a significant part of G3 variation. | Reject H0 because observed F = 21.126 is far above critical F = 2.228. |
| studytime | Studytime adjusted means are equal. | At least one studytime adjusted mean differs. | Studytime has clear factor evidence. |
| school | School adjusted means are equal. | School adjusted means differ. | School has the strongest F statistic and largest partial η². |
| sex | Sex adjusted means are equal. | Sex adjusted means differ. | Sex is smaller than school and studytime in the supplied charts. |
Decision for this example: The overall GLM ANOVA model is significant. School is the strongest fixed factor in the supplied F statistic and partial eta squared charts, studytime also contributes visible evidence, and sex has the smallest practical effect-size share.
Dataset and Variables Used
The worked example uses a student performance dataset. The dependent variable is G3 final grade. The fixed factors are studytime, school and sex. The cell means heatmap shows mean G3 for school-by-studytime combinations.
| Variable or Output | Role | Why It Matters | Where It Appears |
|---|---|---|---|
| G3 | Dependent variable | Final grade outcome being modelled. | All fitted values, residuals and means charts. |
| studytime | Fixed factor | Captures differences across studytime levels. | Group means and fixed-factor F chart. |
| school | Fixed factor | Captures differences between school groups. | Cell means heatmap and strongest F statistic. |
| sex | Fixed factor | Captures adjusted sex-group differences. | Fixed-factor F chart and partial eta squared chart. |
| F statistics | Significance evidence | Shows strength of each fixed factor. | F statistics chart and global F curve. |
| Partial eta squared | Effect size | Shows practical factor size after controlling for error. | Partial eta squared chart. |
| Residuals | Diagnostics | Shows unexplained model error. | Residuals vs fitted and Q-Q plot. |
For supporting concepts, review Descriptive Statistics, Mean Median and Mode, Standard Deviation, Variance, Standard Error, Confidence Interval, Effect Size and Cohen’s F Formula.
Python Chart-by-Chart Interpretation
The Python charts show the first GLM ANOVA workflow. They explain adjusted group means, school-by-studytime cell means, fixed-factor F statistics, global F decision, partial eta squared, residual diagnostics and observed-versus-fitted model fit.
Python Chart 1: Group Means with 95% Confidence Intervals
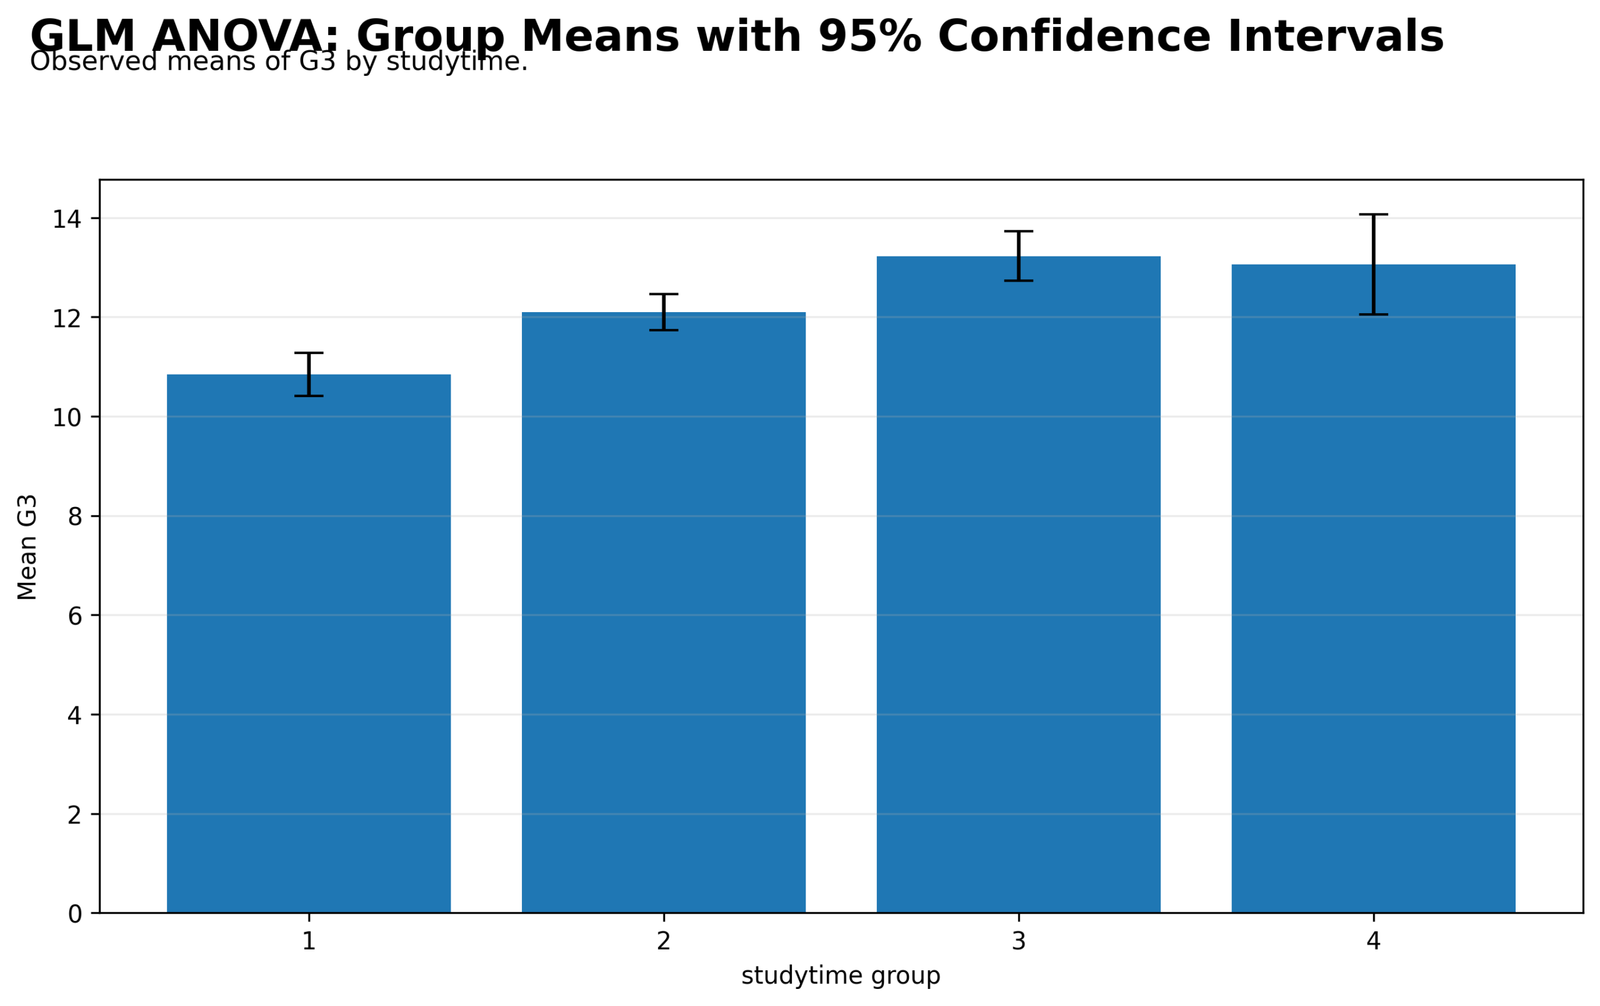
This chart shows the observed mean G3 score for each studytime group. Studytime group 1 is lowest, group 2 is higher, group 3 is highest and group 4 remains close to the high range.
The interval for group 4 is visibly wider than the intervals for the first three studytime groups. That wider interval means the estimate for group 4 is less precise, but the mean still stays around the higher G3 range.
This chart gives the practical direction behind the studytime part of the GLM ANOVA. The studytime means are not flat, so studytime contributes to the fixed-factor evidence in the model.
Python Chart 2: Cell Means Heatmap
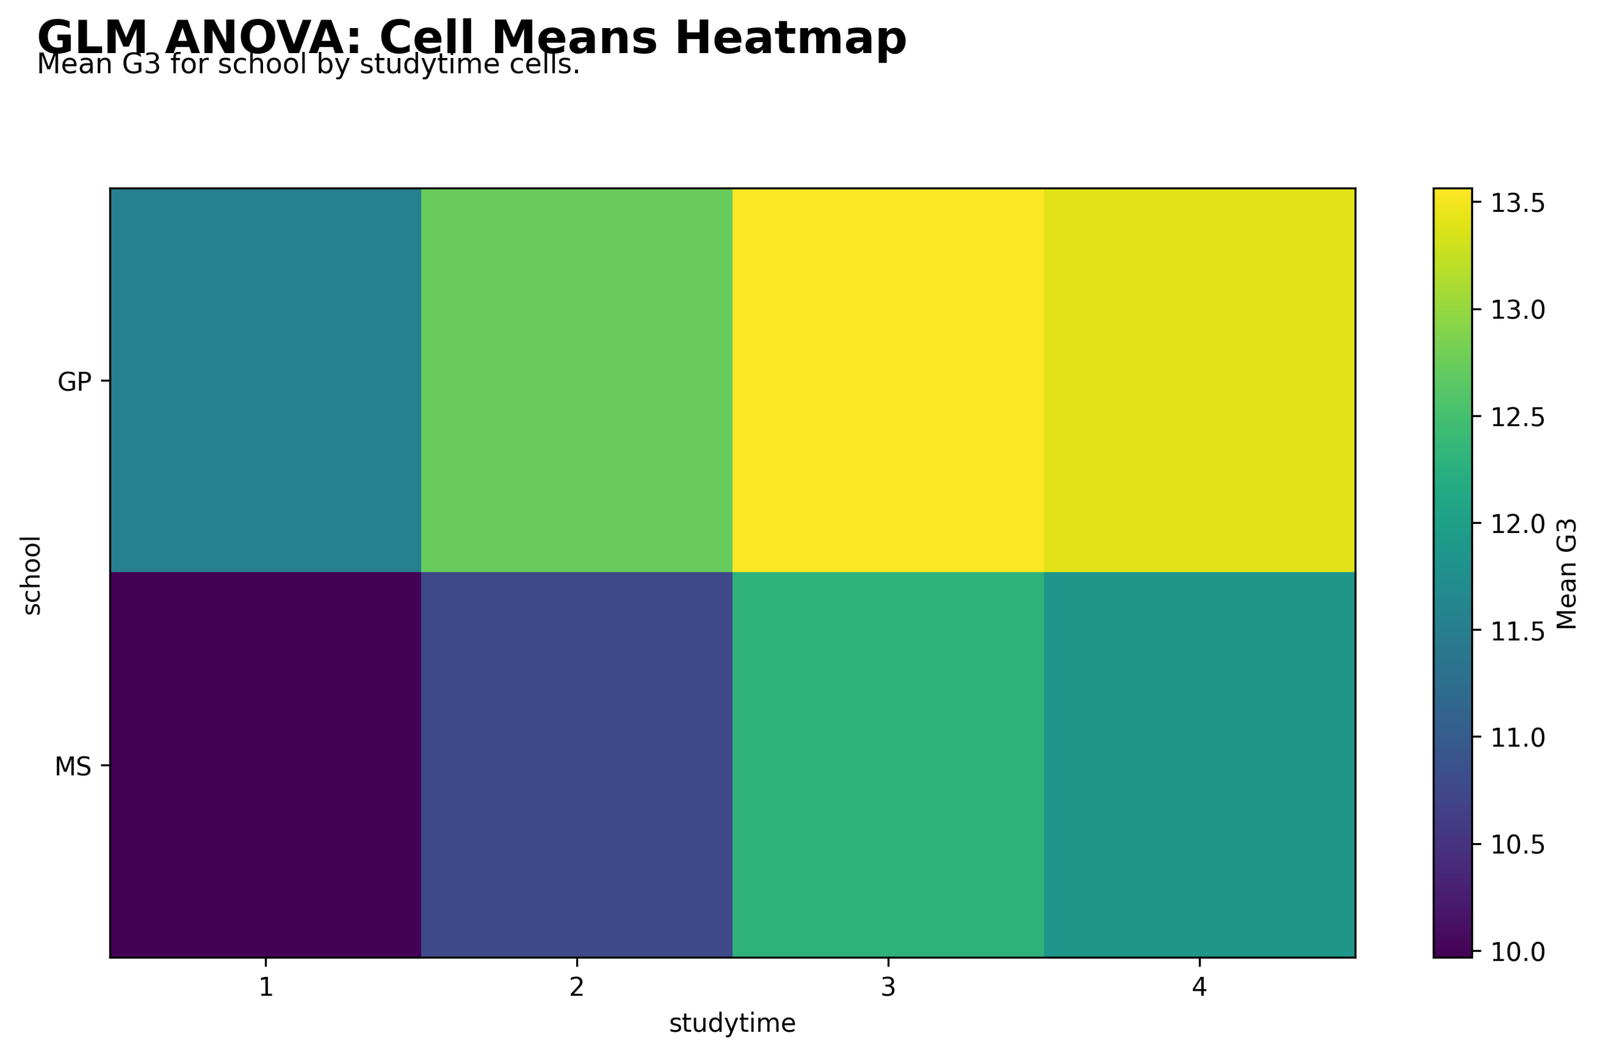
This heatmap compares mean G3 across school and studytime combinations. The GP row is consistently higher than the MS row across the studytime levels. The brightest cell appears for GP at studytime level 3, while the darkest cell appears for MS at studytime level 1.
The heatmap explains why school becomes the strongest fixed factor in the GLM ANOVA. Across the studytime columns, GP cells generally stay in the higher mean range, while MS cells stay lower.
This chart is important because GLM ANOVA can interpret more than one fixed factor in the same model. The heatmap shows the combined school-by-studytime pattern before the F statistic chart summarizes factor evidence.
Python Chart 3: F Statistics by Fixed Factor
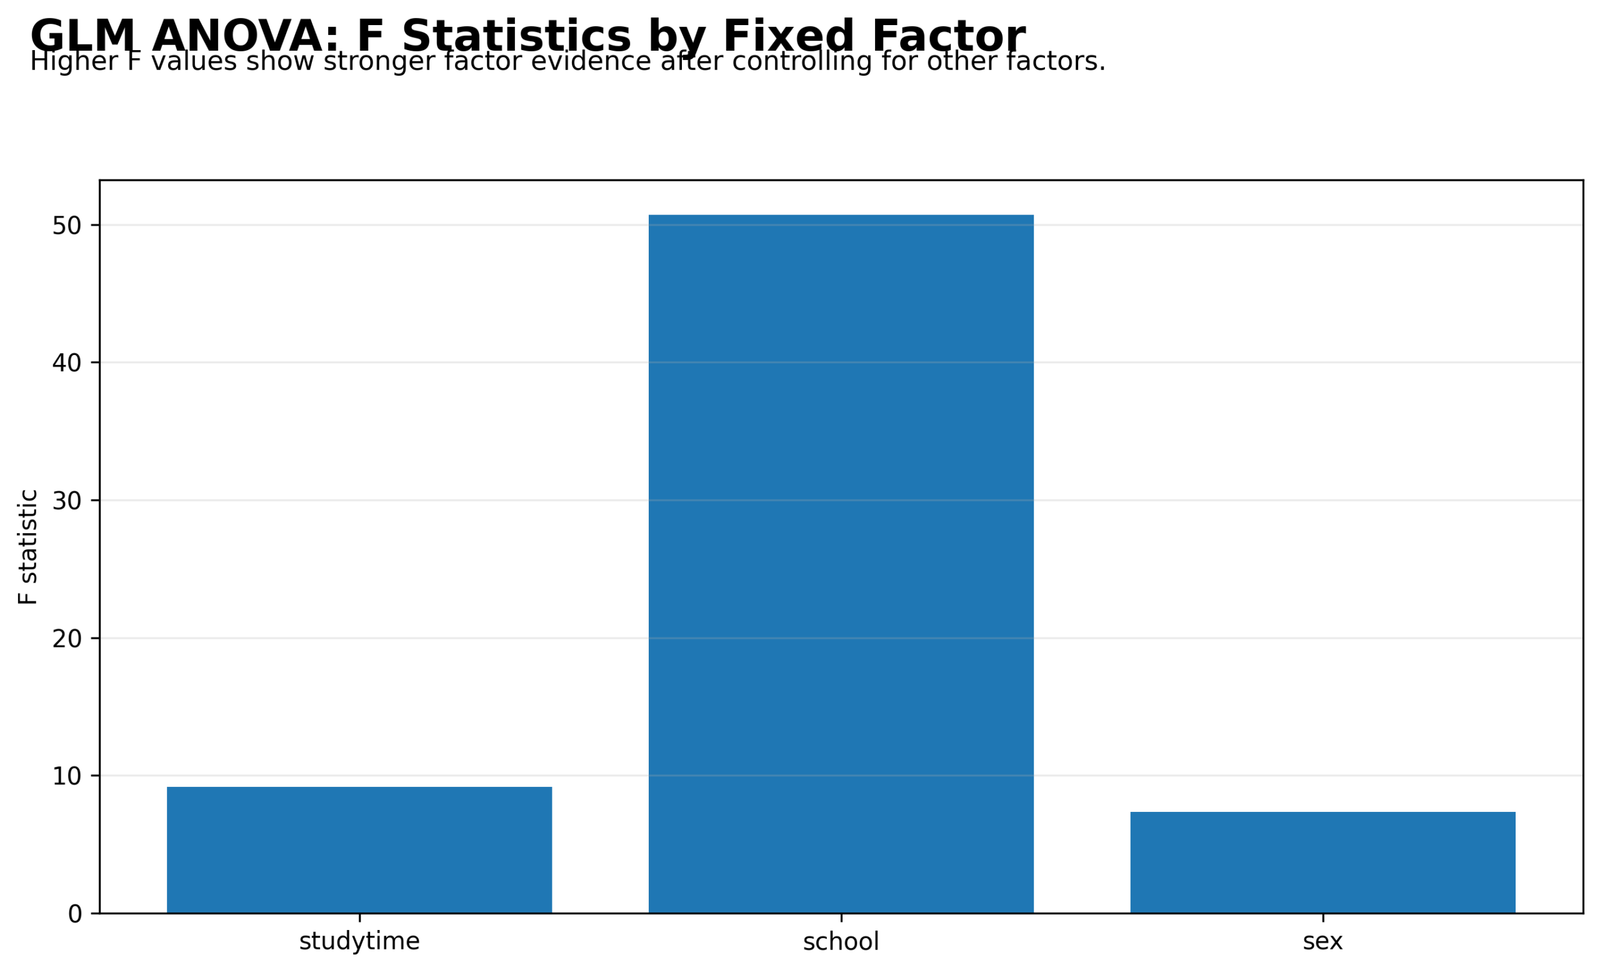
This chart compares the F statistic for each fixed factor after controlling for the other factors. School has the largest F statistic, just above 50. Studytime is much smaller but still visible around 9. Sex is the smallest of the three, around 7.
The chart shows that school is the strongest factor in this GLM ANOVA. Studytime still contributes evidence, but the school effect is visibly larger. Sex contributes the least factor evidence among the three fixed factors shown.
This chart should be reported carefully. It does not mean the variables have the same degrees of freedom or the same practical interpretation. It shows the relative strength of factor evidence in the fitted GLM ANOVA.
Python Chart 4: Global F Distribution
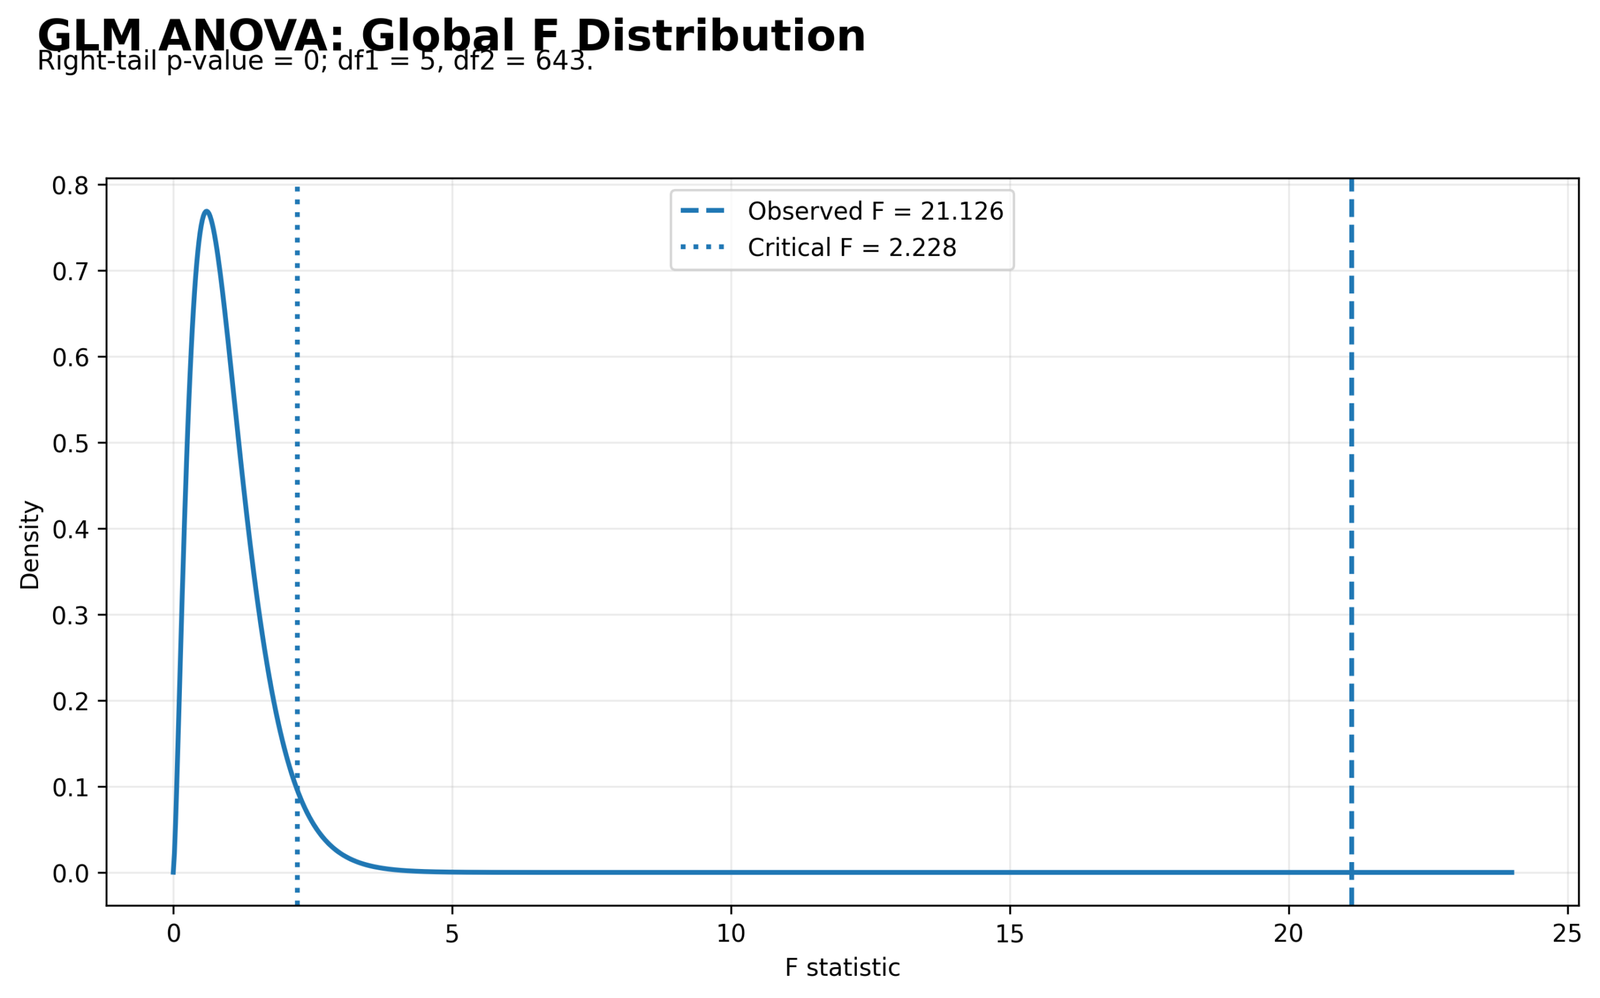
This chart shows the global F distribution for the GLM ANOVA model. The subtitle reports right-tail p-value = 0, df1 = 5 and df2 = 643. The legend shows observed F = 21.126 and critical F = 2.228.
The observed F line is far to the right of the critical F line. This means the full fixed-factor model explains G3 variation far beyond the rejection threshold.
This chart gives the main model-level decision. The GLM ANOVA model is statistically significant as a whole, even before interpreting each fixed factor separately.
Python Chart 5: Partial Eta Squared by Fixed Factor
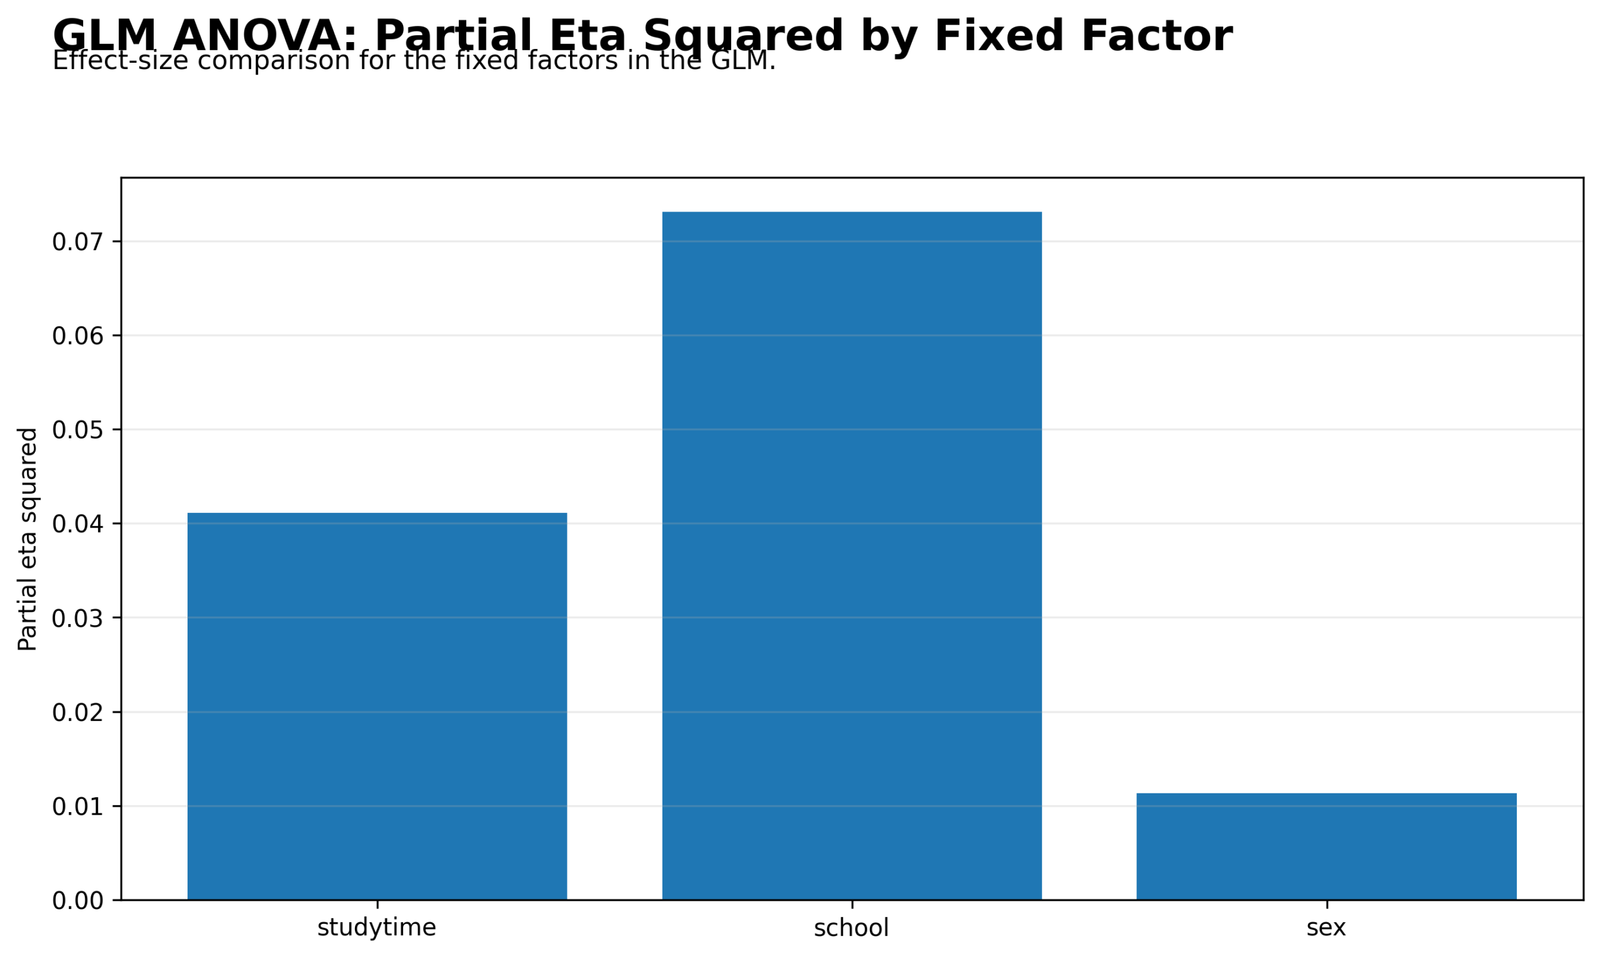
This chart compares the practical effect size of each fixed factor. School has the largest partial eta squared, near 0.073. Studytime is lower, near 0.041. Sex is much smaller, near 0.011.
The effect-size ranking matches the F statistic chart. School is the strongest practical source, studytime is the next source, and sex is the smallest source in the fitted model.
This chart is essential because significance and practical size are not identical. The GLM ANOVA is statistically strong, but partial eta squared shows how much practical contribution each fixed factor has.
Python Chart 6: Residuals vs Fitted Values
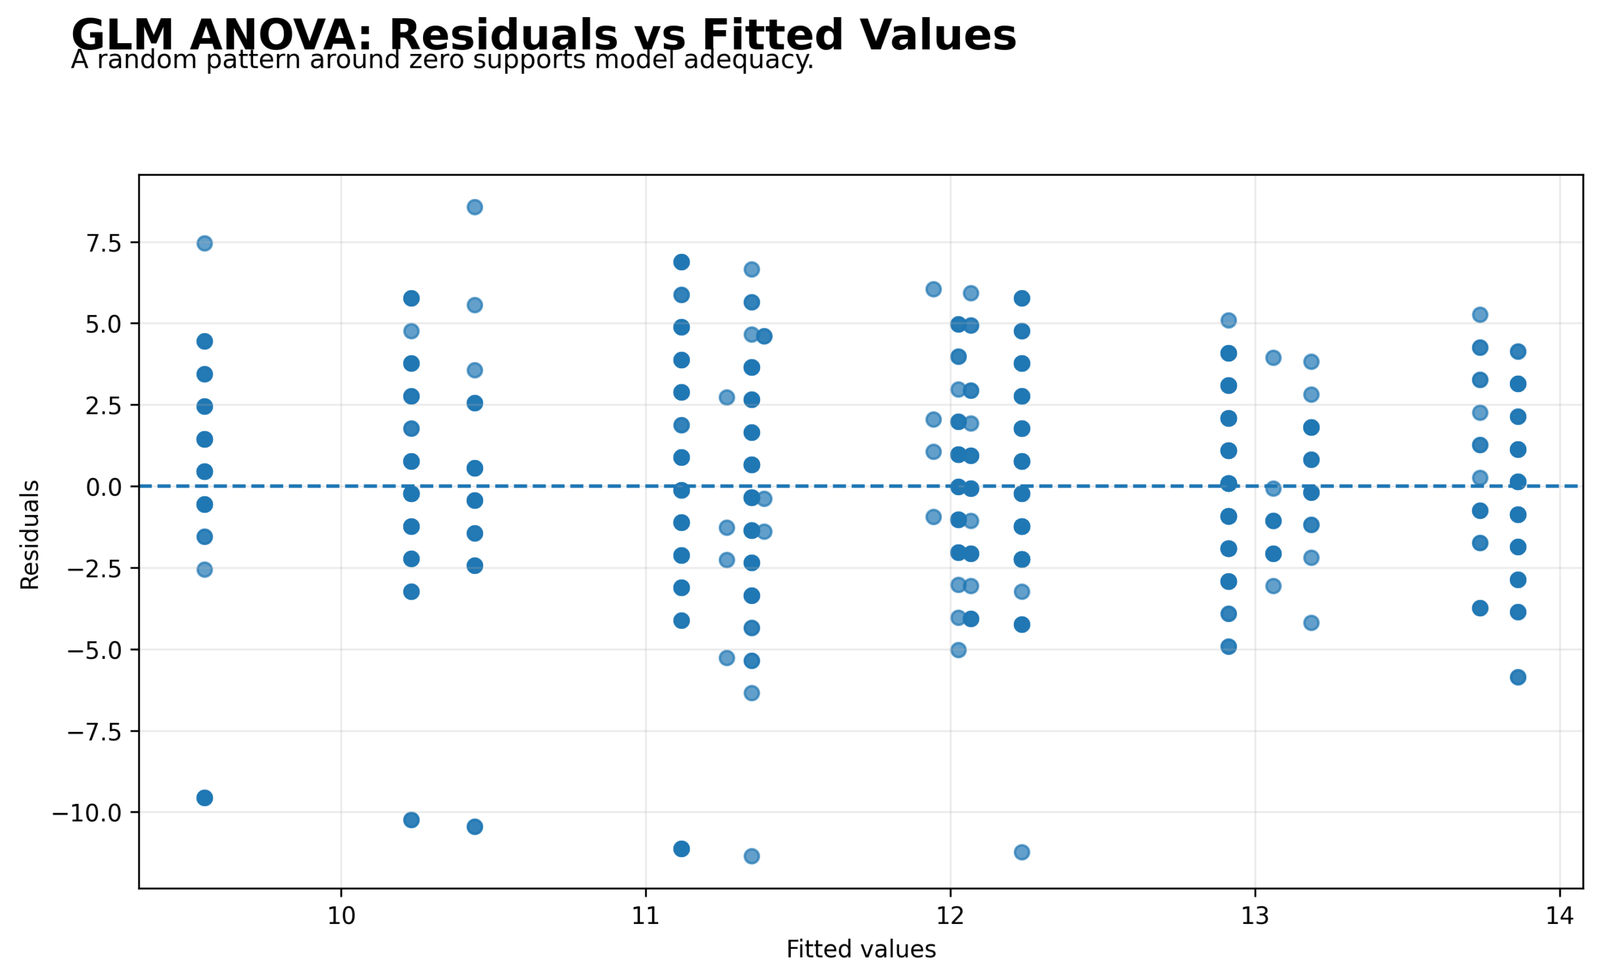
This chart shows residuals against fitted values. The points form vertical bands because GLM ANOVA produces fitted values for combinations of categorical factor levels. Most residuals are scattered around the zero line.
The residual range extends roughly from strong negative values below -10 to positive values above 7. Several negative residuals appear far below zero, showing cases where observed G3 was much lower than the model-fitted value.
This chart supports a balanced diagnostic conclusion. The model is statistically significant, but individual prediction errors remain visible. The residual pattern should be reported as part of the model-checking section.
Python Chart 7: Residual Q-Q Plot
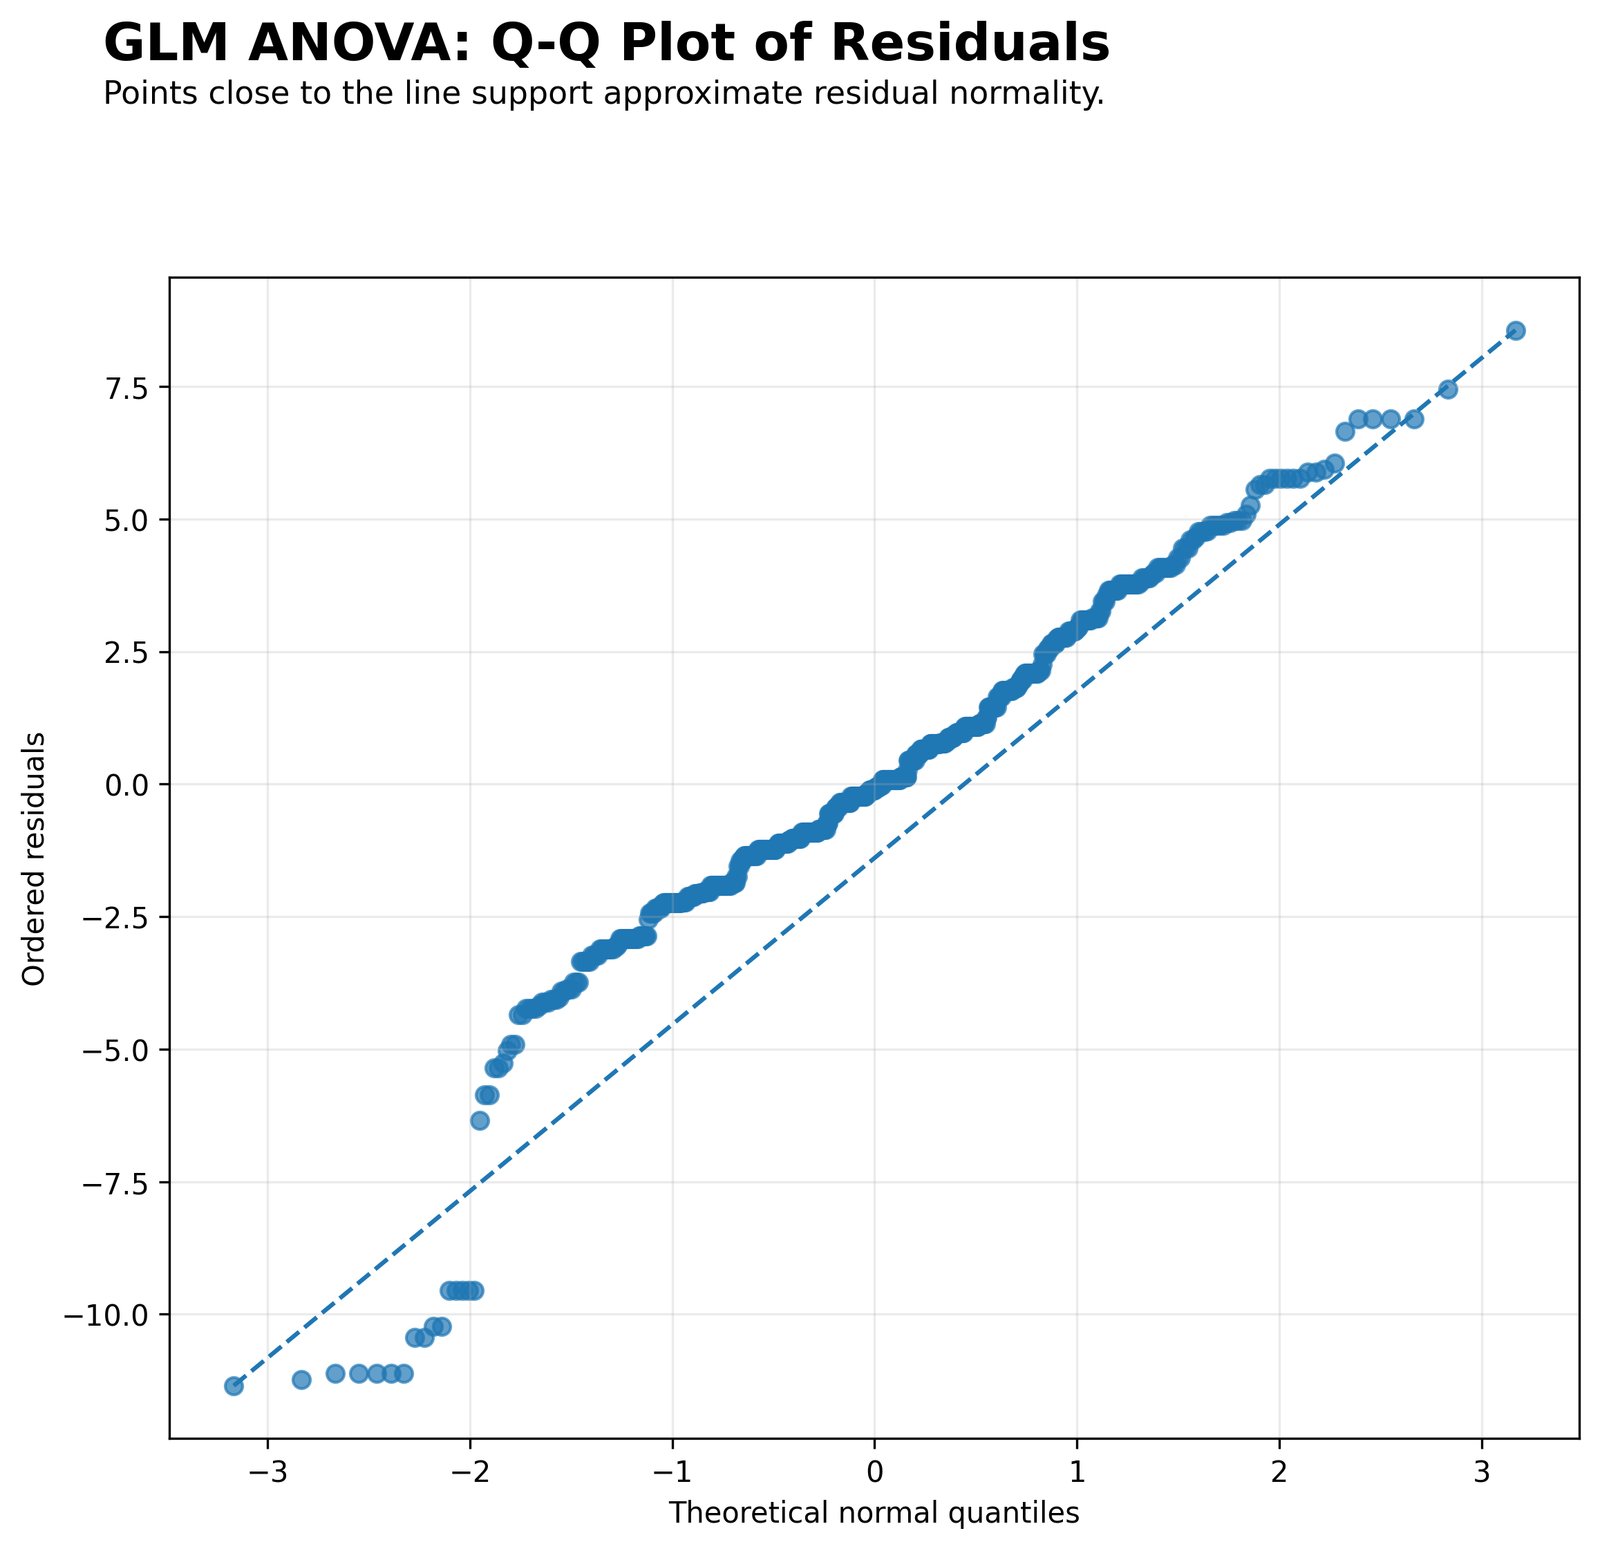
The Q-Q plot compares ordered residuals with a normal reference line. The middle part follows the general upward trend, but the lower tail departs strongly from the line.
The largest departure occurs in the negative residual tail, where several values are far below the reference pattern. The upper tail is closer to the line than the lower tail, although it also shows some spread.
The diagnostic conclusion is that residual normality is not perfect. The GLM ANOVA result remains strong, but the final report should mention lower-tail residual departures.
Python Chart 8: Observed vs Fitted Values
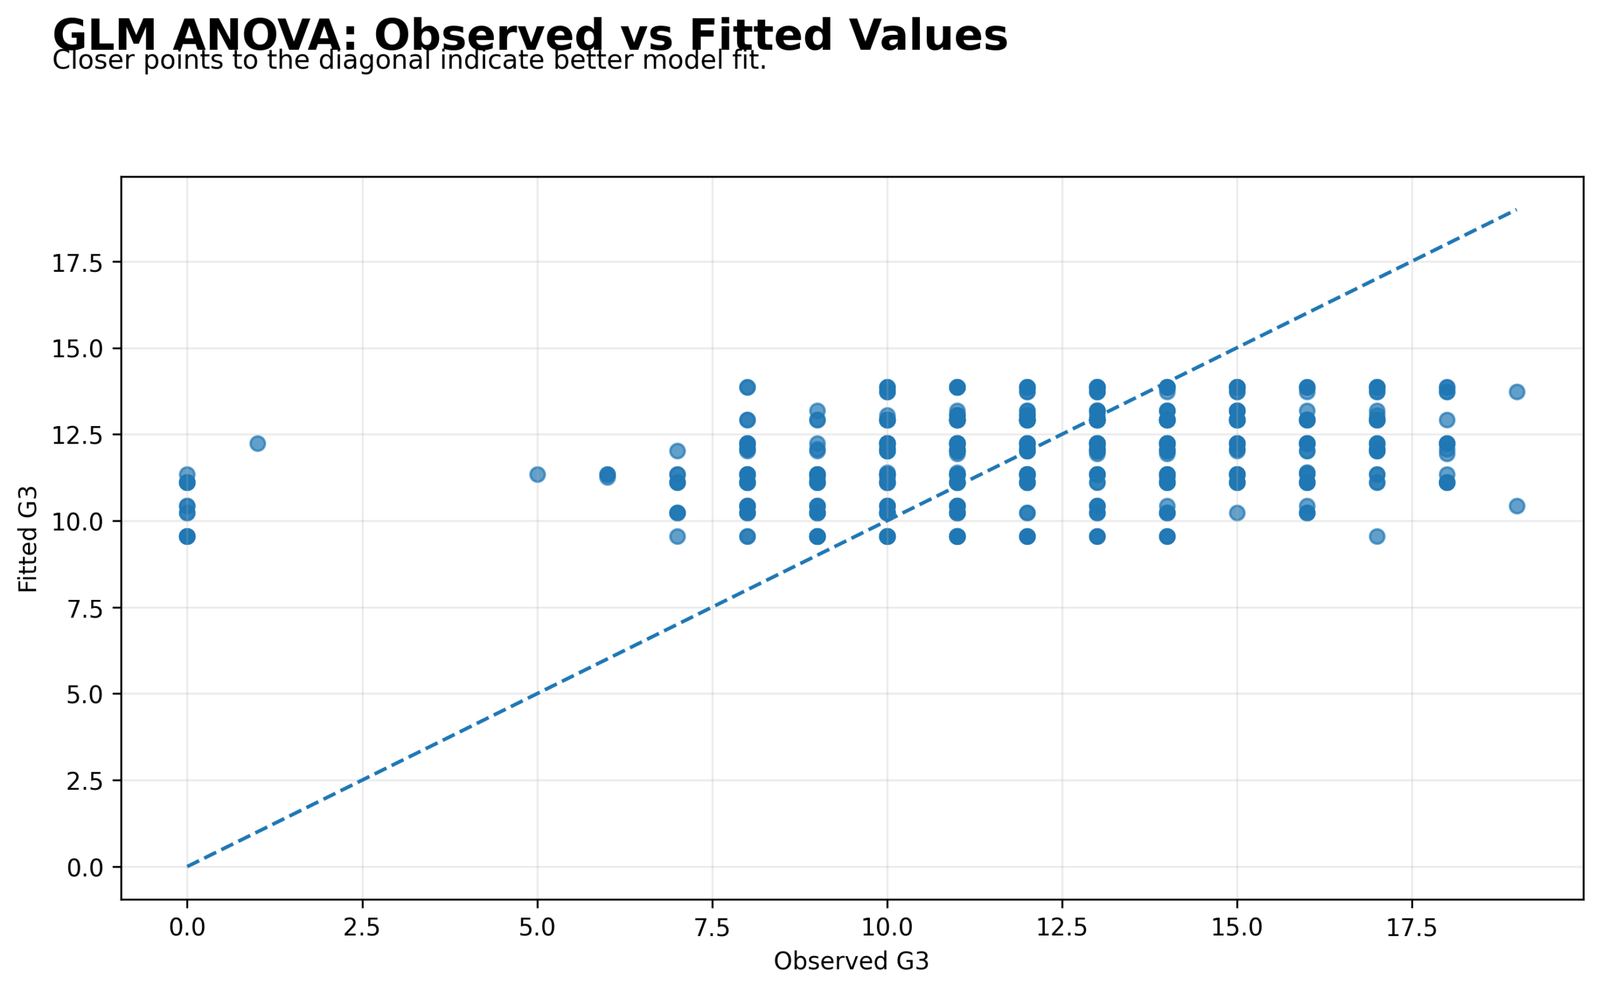
This chart compares observed G3 scores with fitted values. Fitted values are concentrated in a narrower range, roughly from about 9.5 to 14, while observed scores spread much more widely from very low scores to high scores.
The diagonal reference line marks perfect fit. Many points are not on the diagonal, showing that the model captures group-level mean patterns rather than perfectly predicting each individual student’s final grade.
This chart gives the best model-fit context. The fixed factors explain meaningful group differences, but individual G3 outcomes still contain substantial unexplained variation.
R Chart-by-Chart Validation
The R validation charts repeat the GLM ANOVA workflow in a second software environment. They confirm the group mean pattern, school-by-studytime cell means, factor-level F statistic ranking, global F decision, partial eta squared pattern and residual diagnostic behavior.
R Chart 1: Group Means with 95% Confidence Intervals
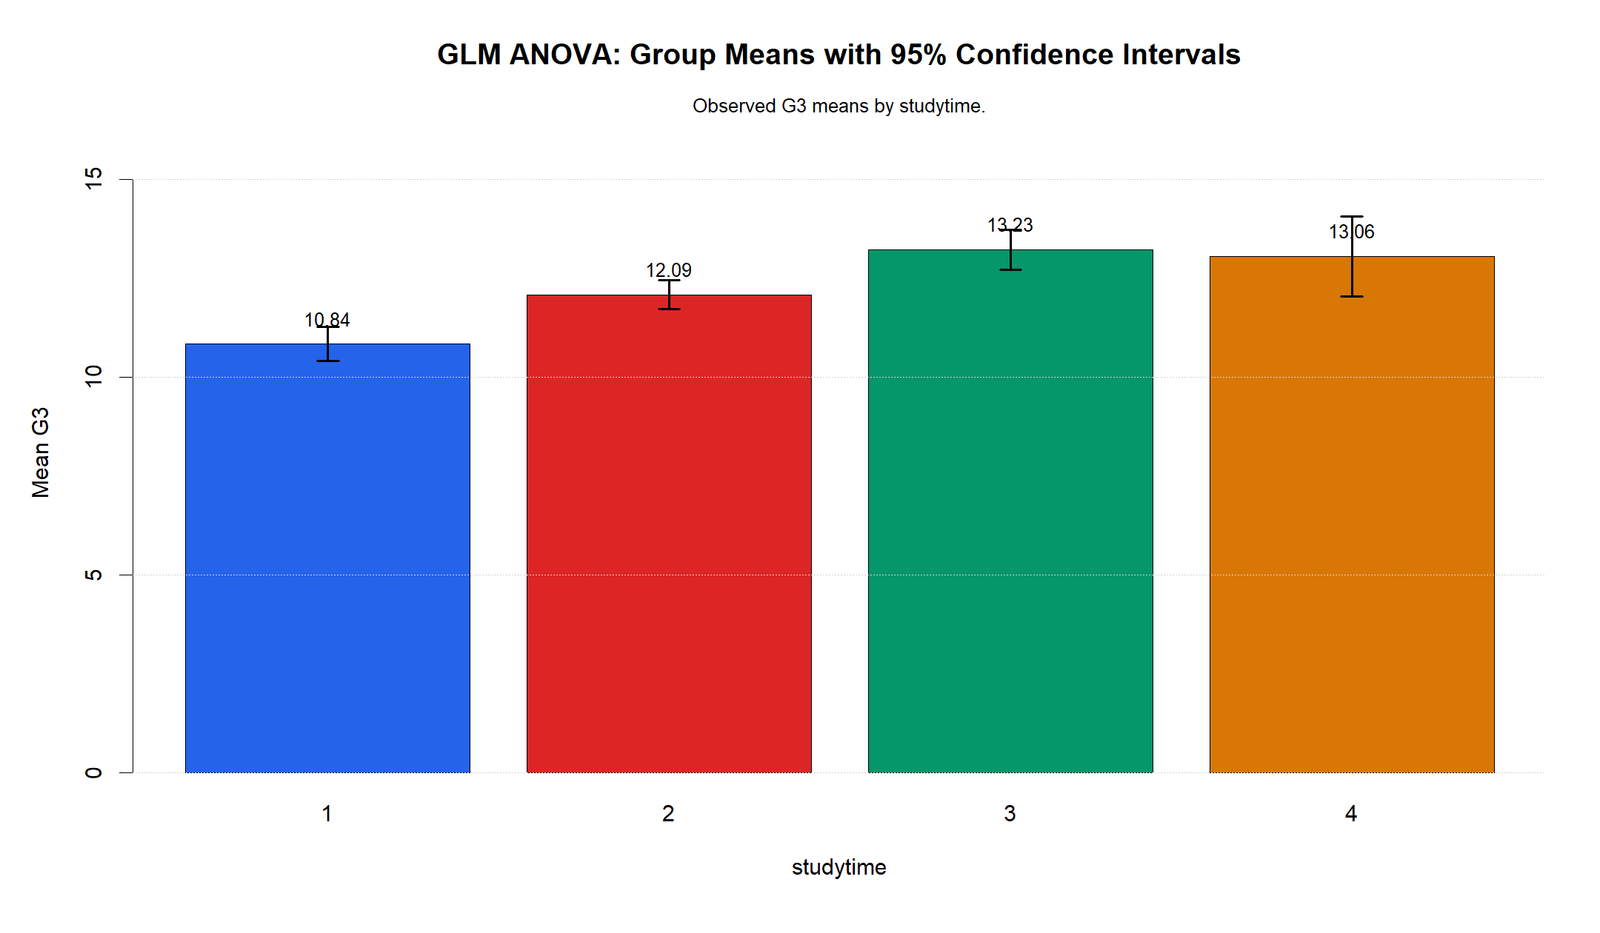
This R chart confirms the same studytime mean pattern. Mean G3 is lowest in studytime group 1, higher in group 2, highest in group 3 and still high in group 4.
The confidence interval pattern also matches the Python chart, with the fourth group showing wider uncertainty. The direction of the studytime pattern remains stable across software.
In reporting, this chart validates the studytime part of the GLM ANOVA result.
R Chart 2: Cell Means by School and Studytime
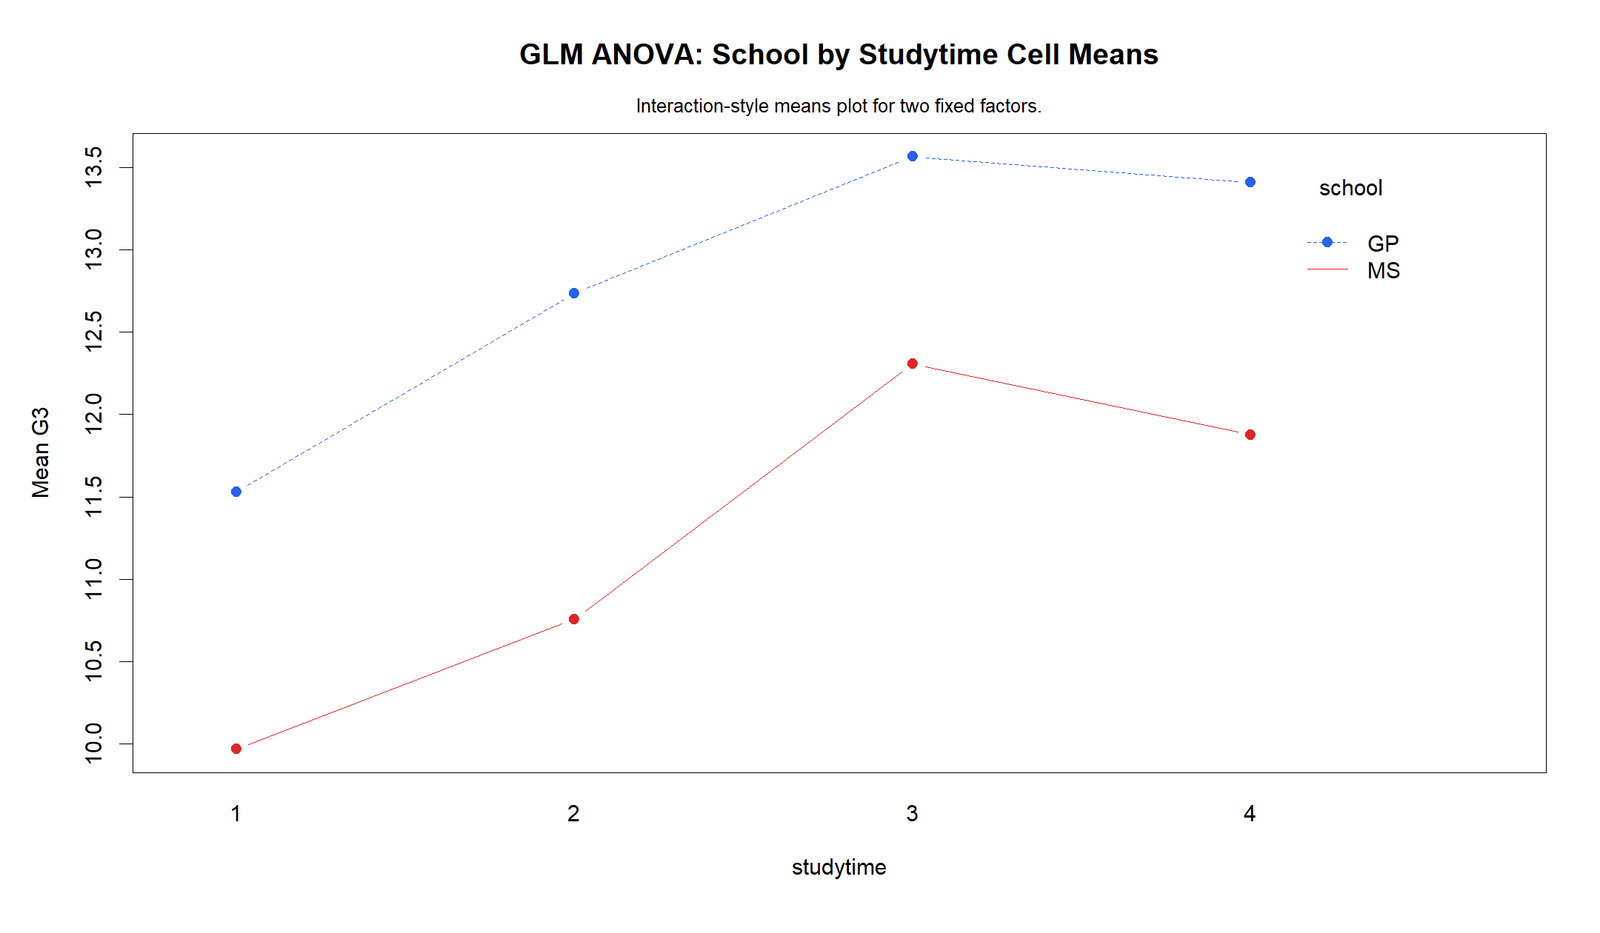
This R heatmap confirms the school-by-studytime pattern. GP cells are generally in the higher mean range, while MS cells are lower across the studytime levels.
The strongest high-value area remains in the GP row around studytime level 3. The lowest area remains in the MS row at studytime level 1.
The heatmap validates the reason school becomes the largest fixed factor in the F statistic and partial eta squared charts.
R Chart 3: F Statistics by Fixed Factor
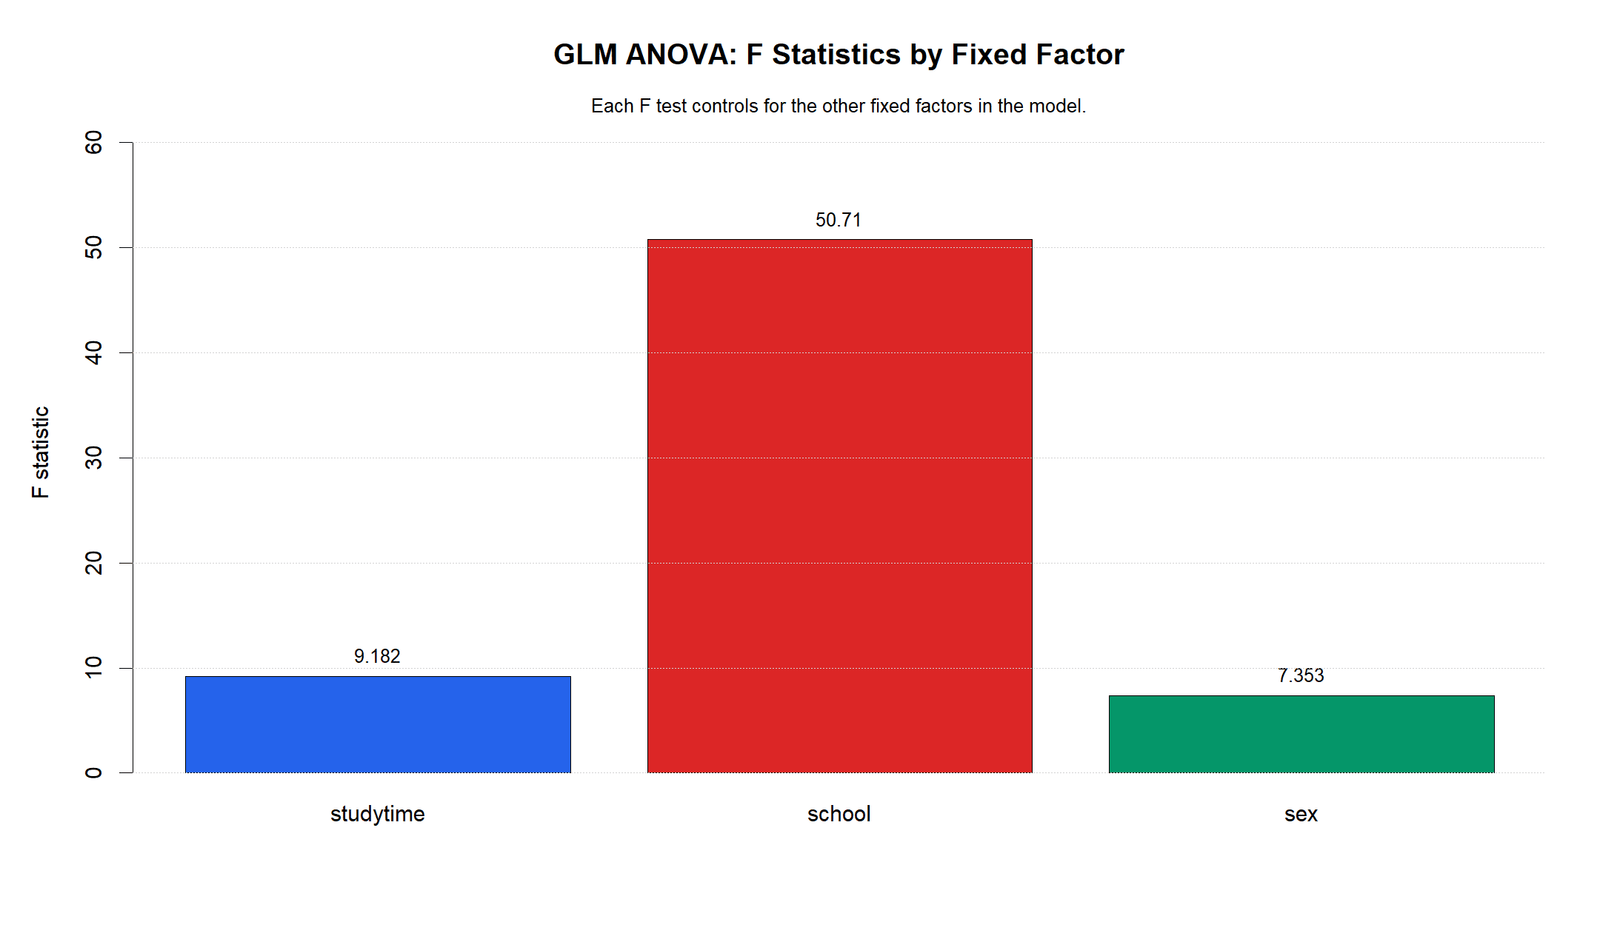
This R chart confirms the same fixed-factor ranking. School has the highest F statistic, studytime has the next strongest factor evidence, and sex has the smallest F statistic among the fixed factors.
The high school F statistic shows that school contributes a large part of the model-level evidence. Studytime remains meaningful, while sex is weaker in this model.
This chart should be used as a validation of the Python factor-level interpretation.
R Chart 4: Global F Distribution
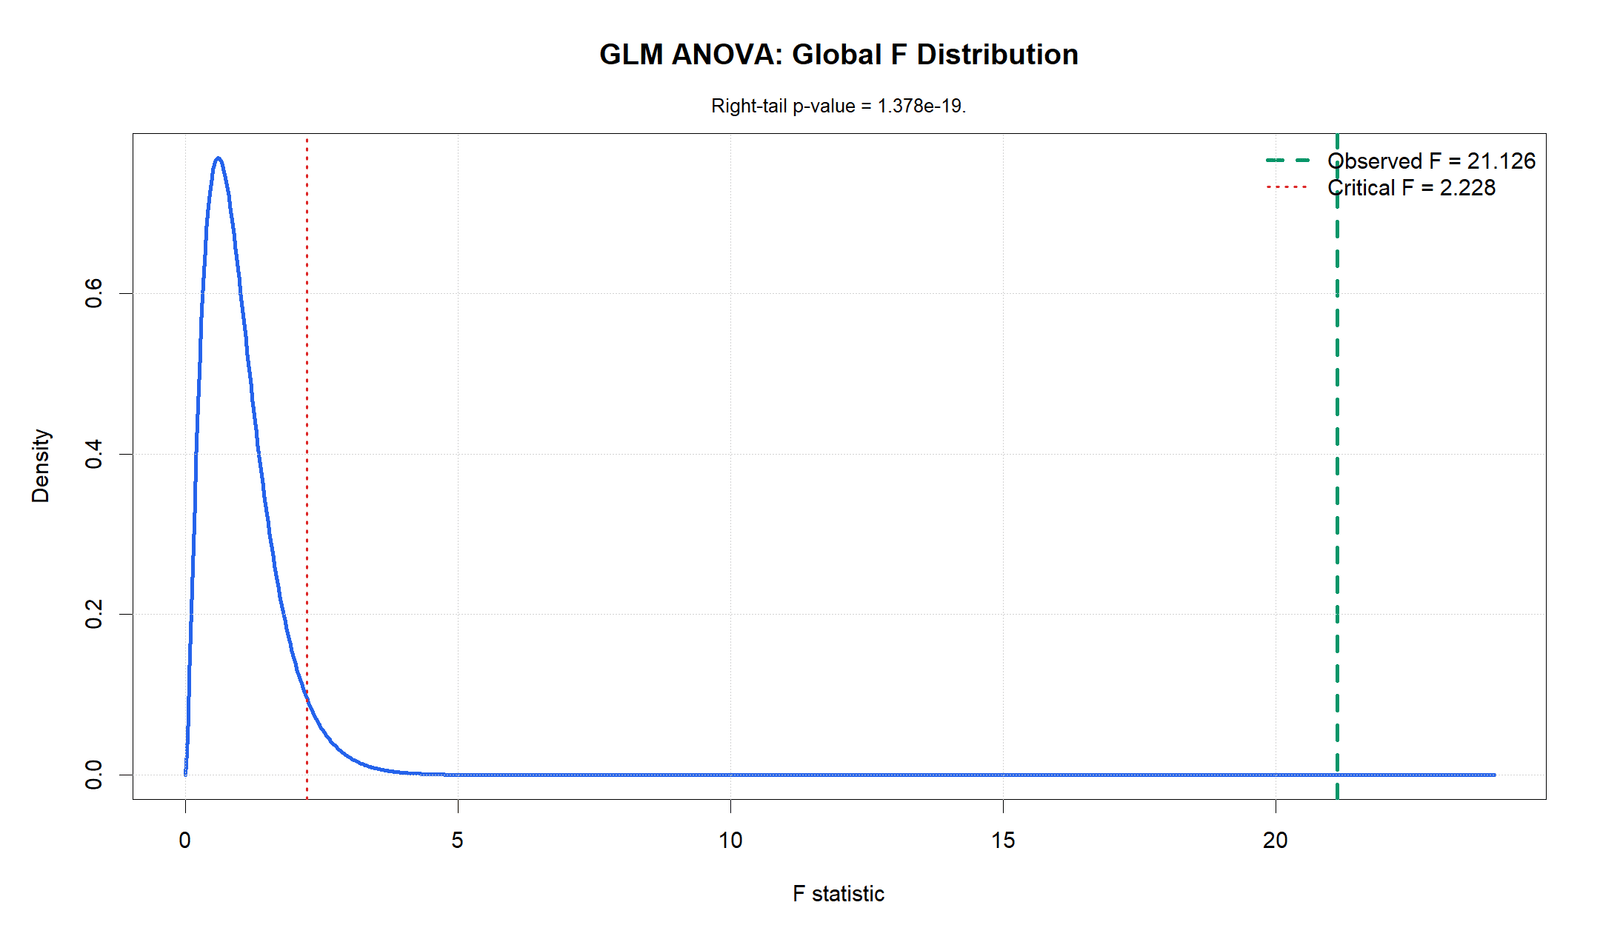
This R chart confirms the global model decision. The observed global F statistic is far to the right of the critical F value.
The model-level result is therefore statistically significant. The fixed factors together explain more G3 variation than expected from residual error alone.
In the final report, this chart supports the statement that the GLM ANOVA model is significant as a whole.
R Chart 5: Partial Eta Squared by Fixed Factor
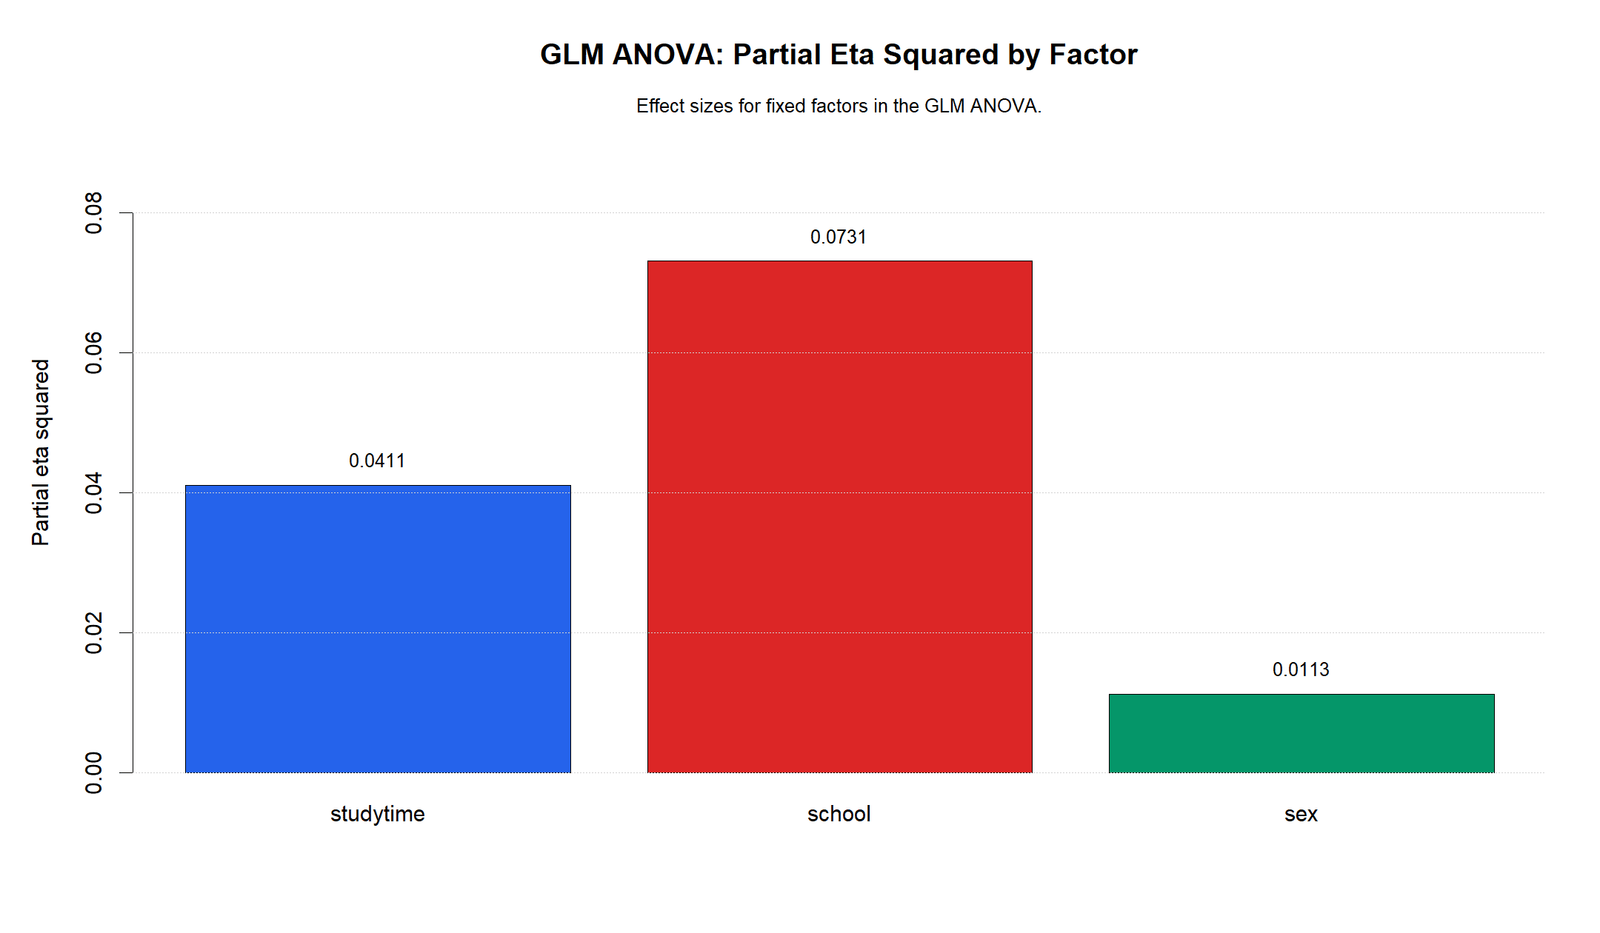
This R chart confirms the same practical effect-size ranking. School has the largest partial eta squared, studytime is second and sex is smallest.
The effect-size pattern supports a practical interpretation rather than only a significance interpretation. School contributes the most practical explanatory share in the fitted GLM ANOVA.
This chart should be used with the F statistics chart because both show the same ordering of factor importance.
R Chart 6: Residuals vs Fitted Values
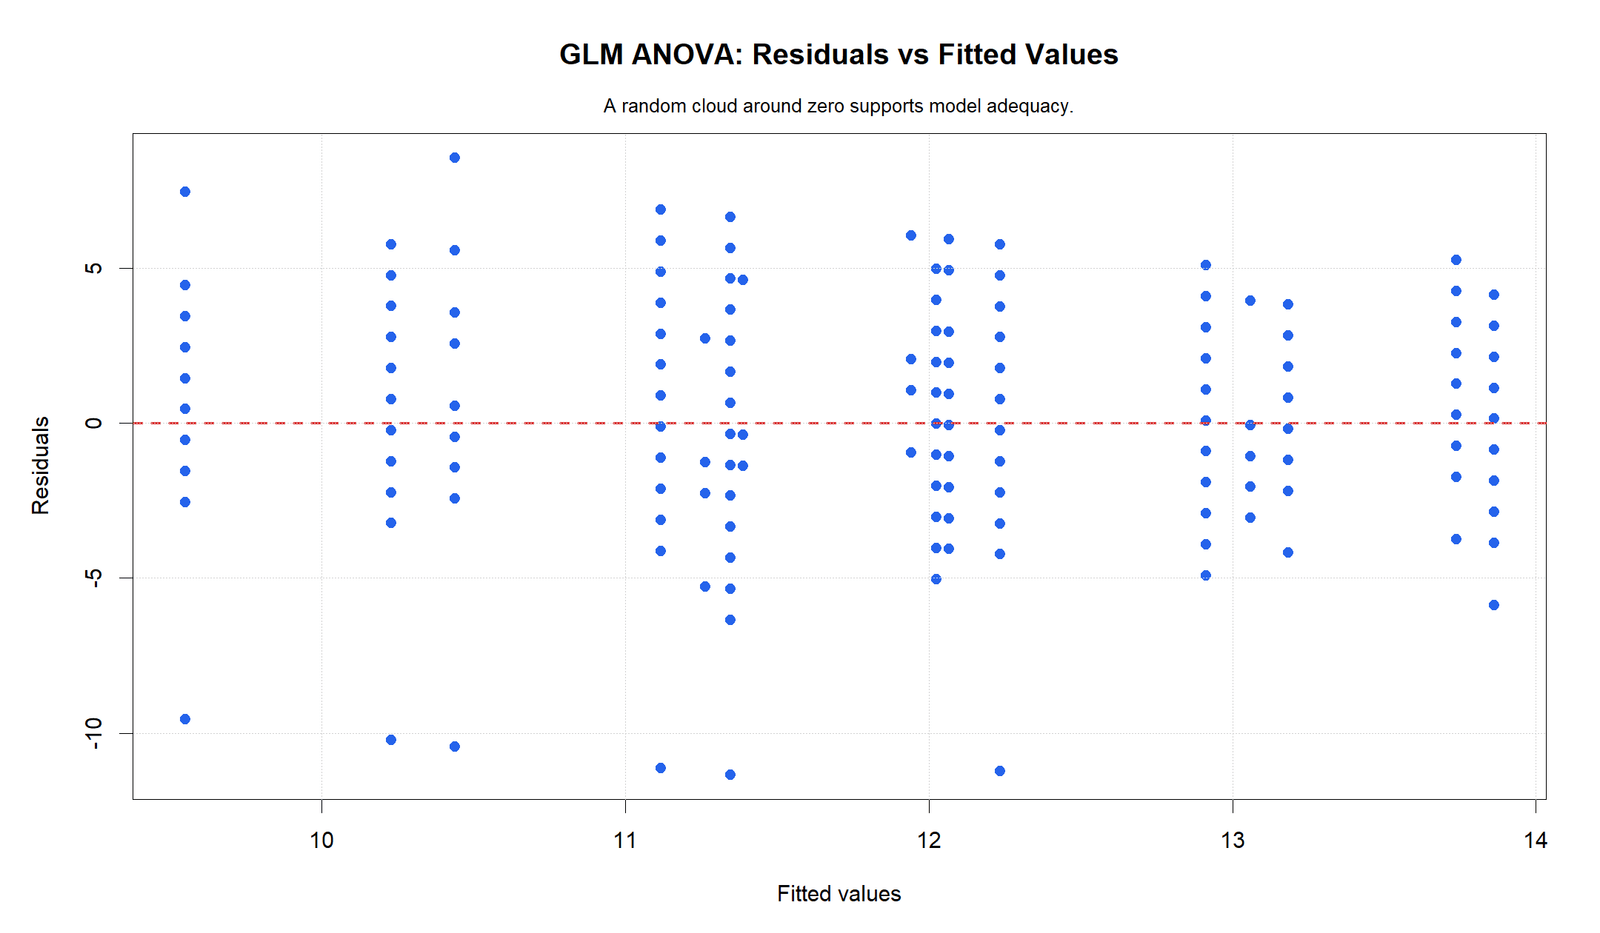
The R residual chart confirms the same fitted-value banding and residual spread. Most residuals cluster around zero, but several cases fall far below zero.
The negative residuals show students whose observed G3 was much lower than their fitted value. This pattern appears in both Python and R diagnostics.
The chart supports a careful conclusion: the model is statistically significant, but residual diagnostics should still be reported.
R Chart 7: Residual Q-Q Plot
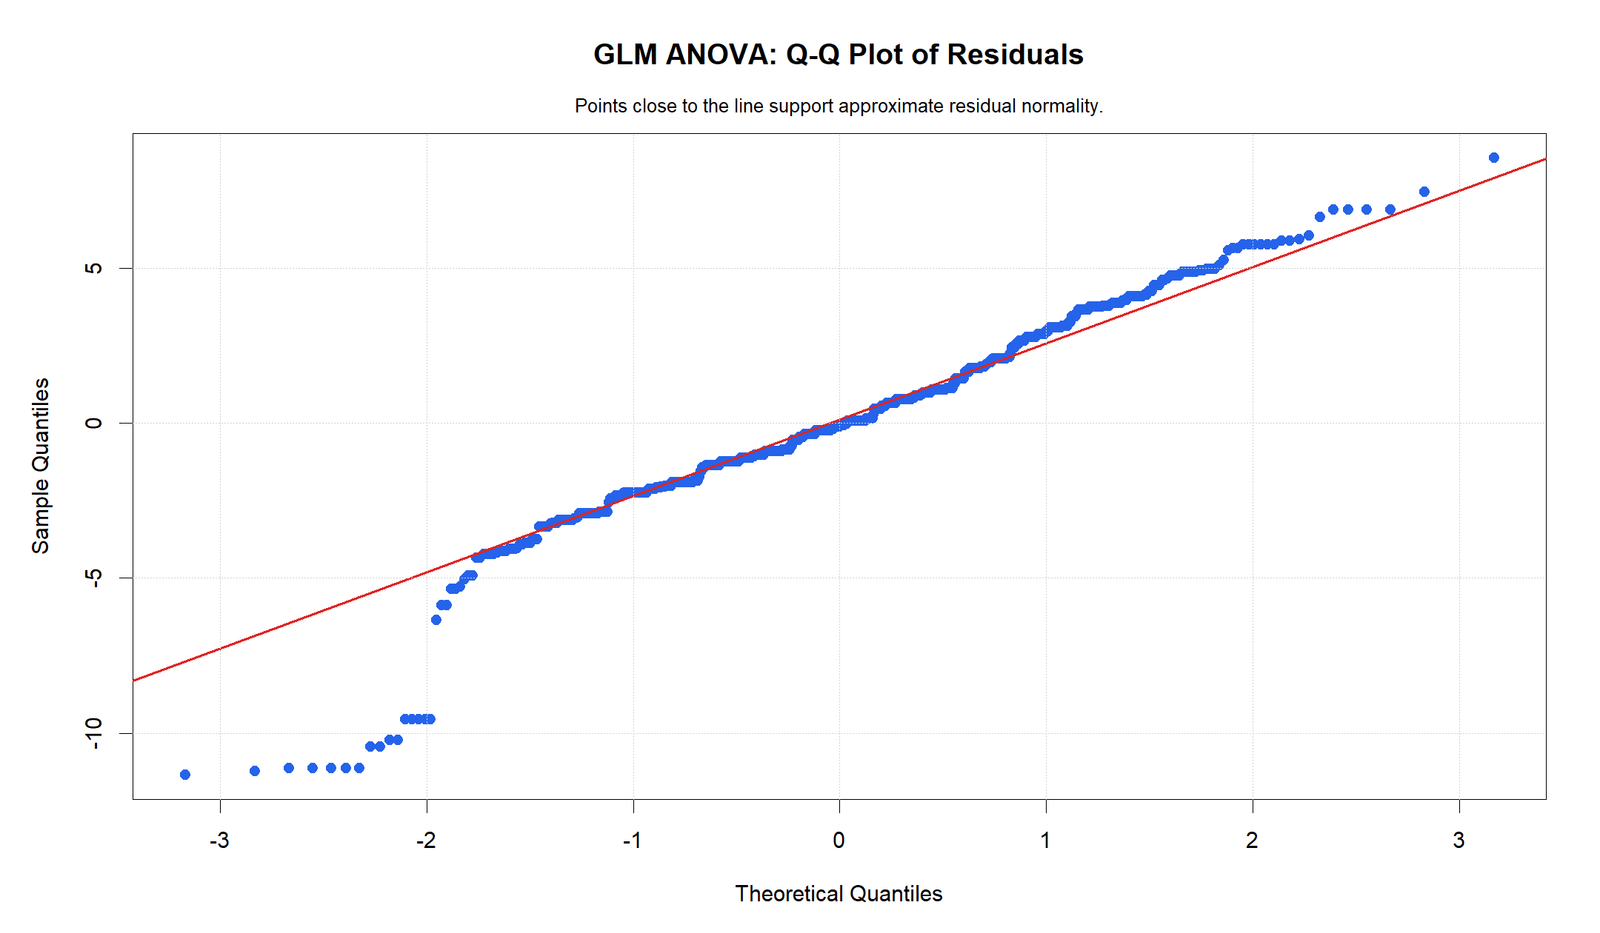
The R Q-Q plot confirms the same lower-tail departure from the normal reference line. The central part of the residual distribution is closer to the line than the negative tail.
This means residual normality is approximate, not perfect. The diagnostic pattern should be mentioned in the assumptions section.
The Q-Q plot does not cancel the GLM ANOVA result. It adds context about lower-tail residual behavior.
R Chart 8: Observed vs Fitted Values
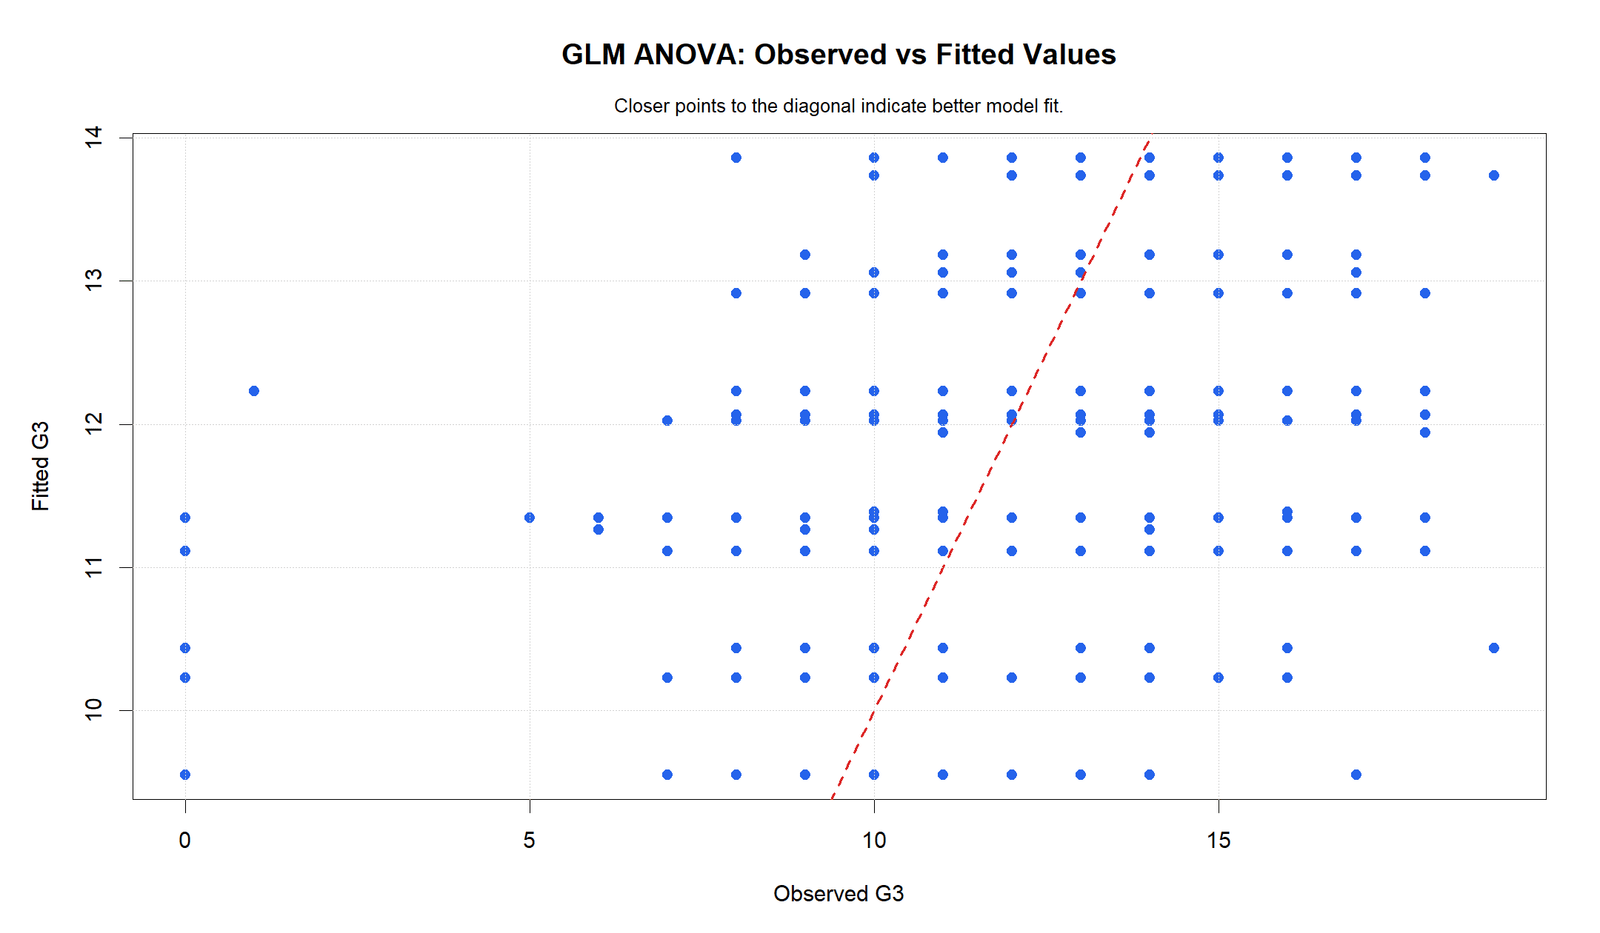
This R chart confirms that fitted values are more compressed than observed G3 scores. The model predicts group-level fitted means, while observed values vary widely across students.
Points away from the diagonal show individual prediction error. This is expected in ANOVA-style GLM because the model explains group patterns rather than every individual grade perfectly.
The chart supports a balanced fit statement: the model is significant and useful for group effects, but it does not fully explain individual performance differences.
SPSS Output and Report PDFs
The supplied report files provide downloadable support for the GLM ANOVA workflow. The Python report, R report and SPSS output PDF should be linked as verification resources for this article.
Download GLM ANOVA Python Report PDF
Download GLM ANOVA R Report PDF
Download GLM ANOVA SPSS Output PDF
Output Items to Read
| Output Item | What It Shows | How It Is Used | Reporting Meaning |
|---|---|---|---|
| Group means | Mean G3 by studytime. | Shows the direction of studytime differences. | Studytime group 1 is lowest; groups 3 and 4 are higher. |
| Cell means heatmap | Mean G3 by school and studytime cells. | Shows combined fixed-factor pattern. | GP cells are generally higher than MS cells. |
| F statistics by factor | Factor-level F values. | Compares strength of fixed factors. | School is strongest, followed by studytime, then sex. |
| Global F distribution | Observed F, critical F and model df. | Tests the full GLM model. | Observed F = 21.126 is far above critical F = 2.228. |
| Partial eta squared | Effect size by factor. | Compares practical factor contribution. | School has the largest partial eta squared. |
| Residual diagnostics | Residuals vs fitted and Q-Q plot. | Checks model assumptions. | Lower-tail residual departure should be reported. |
Report interpretation summary: The GLM ANOVA reports a significant global model. School is the strongest fixed factor, studytime is also meaningful, and sex has the smallest effect-size share. The diagnostics show visible residual spread and lower-tail departures, so the final report should include an assumptions note.
SPSS, R, Python and Excel Workflows for GLM ANOVA
The same GLM ANOVA workflow can be reproduced in SPSS, R, Python and Excel. The main steps are to define the dependent variable, enter the fixed factors, fit the general linear model, inspect factor-level F statistics, report partial eta squared and check residual diagnostics.
SPSS Workflow
| Step | SPSS Menu or Syntax | Purpose |
|---|---|---|
| Open data | File > Open > Data | Load G3, studytime, school and sex. |
| Run GLM | Analyze > General Linear Model > Univariate | Fit GLM ANOVA. |
| Set dependent variable | Dependent Variable: G3 | Define the numeric outcome. |
| Set fixed factors | Fixed Factors: studytime, school, sex | Define categorical predictors. |
| Request effect size | Options > Estimates of effect size | Display partial eta squared. |
| Request estimated means | Estimated Marginal Means | Interpret adjusted factor means. |
| Save residuals | Save > Residuals | Create diagnostic plots. |
| Export output | OUTPUT EXPORT | Save SPSS output PDF. |
R Workflow
| Step | R Action | Purpose |
|---|---|---|
| Read data | read.csv("dataset.csv") | Load the dataset. |
| Convert factors | as.factor() | Define studytime, school and sex as categorical. |
| Fit GLM ANOVA | aov(G3 ~ studytime + school + sex) | Fit fixed-factor model. |
| Read ANOVA table | summary(model) | Get factor F statistics and p values. |
| Cell means | aggregate(G3 ~ school + studytime) | Create school-by-studytime means. |
| Diagnostics | plot(model) | Check residual and fitted-value patterns. |
Python Workflow
| Step | Python Action | Purpose |
|---|---|---|
| Read data | pandas.read_csv() | Load dataset. |
| Fit model | ols("G3 ~ C(studytime)+C(school)+C(sex)") | Fit GLM ANOVA model. |
| ANOVA table | sm.stats.anova_lm(model, typ=2) | Read fixed-factor F statistics. |
| Global model test | Model mean square divided by error mean square | Evaluate full model significance. |
| Effect size | Partial eta squared formula | Compare practical factor size. |
| Diagnostics | Residual and fitted-value plots | Check assumptions and model fit. |
Excel Workflow
| Excel Task | Formula or Tool | Purpose |
|---|---|---|
| Arrange data | Columns for outcome and factor labels | Prepare G3, studytime, school and sex. |
| Pivot summaries | PivotTable | Create group means and cell means. |
| Two-factor layout | ANOVA: Two-Factor With Replication | Run simplified two-factor version where design allows. |
| Manual GLM summary | Use model output from SPSS, R or Python | Excel is limited for full multi-factor GLM. |
| Effect size | =SS_Factor/(SS_Factor+SS_Error) | Calculate partial eta squared. |
| Decision | =IF(p_value<0.05,"Reject H0","Fail to reject H0") | Report factor decisions. |
Code Blocks for GLM ANOVA
SPSS Syntax for GLM ANOVA
* GLM ANOVA in SPSS.
* Dependent variable: G3.
* Fixed factors: studytime, school, sex.

TITLE "GLM ANOVA: G3 by Studytime, School and Sex".

UNIANOVA G3 BY studytime school sex
  /METHOD=SSTYPE(3)
  /INTERCEPT=INCLUDE
  /PRINT=DESCRIPTIVE ETASQ HOMOGENEITY
  /EMMEANS=TABLES(studytime)
  /EMMEANS=TABLES(school)
  /EMMEANS=TABLES(sex)
  /EMMEANS=TABLES(school*studytime)
  /SAVE=PRED RESID
  /CRITERIA=ALPHA(.05)
  /DESIGN=studytime school sex.

OUTPUT EXPORT
  /CONTENTS EXPORT=VISIBLE
  /PDF DOCUMENTFILE="GLM-ANOVA-SPSS-Output.pdf".
Python Code for GLM ANOVA
import pandas as pd
import numpy as np
import scipy.stats as stats
import statsmodels.api as sm
from statsmodels.formula.api import ols

df = pd.read_csv("dataset.csv")

df["G3"] = pd.to_numeric(df["G3"], errors="coerce")
df["studytime"] = df["studytime"].astype("category")
df["school"] = df["school"].astype("category")
df["sex"] = df["sex"].astype("category")

df_model = df.dropna(subset=["G3", "studytime", "school", "sex"]).copy()

# GLM ANOVA with fixed factors
model = ols("G3 ~ C(studytime) + C(school) + C(sex)", data=df_model).fit()
anova_table = sm.stats.anova_lm(model, typ=2)

print(anova_table)

# Cell means for school by studytime
cell_means = (
    df_model
    .groupby(["school", "studytime"])["G3"]
    .mean()
    .reset_index()
)
print(cell_means)

# Partial eta squared by factor
ss_error = anova_table.loc["Residual", "sum_sq"]
partial_eta = {}

for source in anova_table.index:
    if source != "Residual":
        ss_factor = anova_table.loc[source, "sum_sq"]
        partial_eta[source] = ss_factor / (ss_factor + ss_error)

print("Partial eta squared:")
print(partial_eta)

# Global model F test
ss_model = anova_table.loc[anova_table.index != "Residual", "sum_sq"].sum()
df_model_terms = anova_table.loc[anova_table.index != "Residual", "df"].sum()

ss_resid = anova_table.loc["Residual", "sum_sq"]
df_resid = anova_table.loc["Residual", "df"]

ms_model = ss_model / df_model_terms
ms_error = ss_resid / df_resid

f_global = ms_model / ms_error
p_global = stats.f.sf(f_global, df_model_terms, df_resid)
f_critical = stats.f.ppf(0.95, df_model_terms, df_resid)

print("Global F:", f_global)
print("Global p:", p_global)
print("Critical F:", f_critical)

# Residual diagnostics
df_model["fitted"] = model.fittedvalues
df_model["residual"] = model.resid

print(df_model[["G3", "fitted", "residual"]].head())
R Code for GLM ANOVA
df <- read.csv("dataset.csv")

df$G3 <- as.numeric(df$G3)
df$studytime <- as.factor(df$studytime)
df$school <- as.factor(df$school)
df$sex <- as.factor(df$sex)

df_model <- na.omit(df[, c("G3", "studytime", "school", "sex")])

# GLM ANOVA with fixed factors
model <- aov(G3 ~ studytime + school + sex, data = df_model)

summary(model)

# Cell means
aggregate(G3 ~ school + studytime, data = df_model, mean)

# Fitted values and residuals
df_model$fitted <- fitted(model)
df_model$residuals <- residuals(model)

# ANOVA table components
anova_table <- summary(model)[[1]]

ss_error <- anova_table["Residuals", "Sum Sq"]

partial_eta_squared <- data.frame(
  factor = rownames(anova_table)[rownames(anova_table) != "Residuals"],
  partial_eta_squared = NA
)

for(i in seq_len(nrow(partial_eta_squared))){
  factor_name <- partial_eta_squared$factor[i]
  ss_factor <- anova_table[factor_name, "Sum Sq"]
  partial_eta_squared$partial_eta_squared[i] <- ss_factor / (ss_factor + ss_error)
}

partial_eta_squared

# Diagnostic plots
plot(model)
Excel Notes for GLM ANOVA
Excel can summarize GLM ANOVA data, but full multi-factor GLM is easier in SPSS, R or Python.

Useful Excel steps:
1. Create PivotTable for mean G3 by studytime.
2. Create PivotTable for mean G3 by school and studytime.
3. Use Data Analysis ToolPak for simpler ANOVA layouts.
4. Use SPSS, R or Python for full GLM ANOVA with multiple fixed factors.
5. Calculate partial eta squared when SS factor and SS error are available:

Partial eta squared:
=SS_Factor/(SS_Factor+SS_Error)

Decision:
=IF(p_value<0.05,"Reject H0","Fail to reject H0")

Global model interpretation:
Observed F > Critical F means the GLM model is statistically significant.
APA Reporting Wording
When reporting GLM ANOVA, include the dependent variable, fixed factors, global model result, factor-level findings and effect sizes. Also mention residual diagnostics when the Q-Q plot or residual plot shows visible departures.
APA-style report: A GLM ANOVA was used to examine G3 final grade as a function of studytime, school and sex. The overall model was statistically significant, with the global F distribution showing observed F = 21.126, critical F = 2.228, df1 = 5 and df2 = 643. Among the fixed factors, school showed the strongest F statistic and largest partial eta squared, studytime showed the next strongest contribution, and sex showed the smallest partial eta squared. Residual diagnostics indicated visible lower-tail departures, so the model was interpreted with diagnostic caution.
Short reporting version: The GLM ANOVA model for G3 was significant, observed F = 21.126, critical F = 2.228, df1 = 5, df2 = 643. School had the strongest fixed-factor effect, followed by studytime, while sex had the smallest effect-size share.
Common Mistakes
| Mistake | Why It Is Wrong | Correct Practice |
|---|---|---|
| Confusing GLM ANOVA with one-way ANOVA | GLM ANOVA can include several fixed factors in one model. | State all fixed factors and interpret each factor separately. |
| Reporting only the global F result | The global result does not show which factor contributes most. | Report factor F statistics and partial eta squared. |
| Ignoring effect size | F statistics show evidence, but not practical size alone. | Use partial eta squared or another effect-size measure. |
| Ignoring residual diagnostics | The Q-Q plot shows lower-tail departures. | Discuss residual normality and fitted-value patterns. |
| Overclaiming prediction accuracy | Observed values vary widely around fitted values. | State that GLM ANOVA explains group-level differences, not perfect individual prediction. |
| Skipping assumption checks | ANOVA results depend on reasonable residual and variance behavior. | Review ANOVA Assumptions, Levene Test, Q-Q Plot Normality Check and Outlier Detection. |
When to Use GLM ANOVA
Use GLM ANOVA when the dependent variable is numeric and the model includes one or more fixed categorical factors. GLM ANOVA is especially useful when the analysis needs adjusted factor effects, multiple fixed factors, estimated marginal means or effect sizes from one model.
| Situation | Use GLM ANOVA? | Reporting Note |
|---|---|---|
| One numeric outcome and several fixed factors | Yes | Fit a general linear model ANOVA. |
| Need adjusted factor effects | Yes | Interpret each factor after controlling for others. |
| Only one categorical factor | Use one-way ANOVA | GLM can still fit it, but one-way ANOVA is simpler. |
| Need to include a covariate | Use GLM ANCOVA | See the ANCOVA guide. |
| Outcome is binary or count | Use generalized linear model | Do not confuse general linear model with generalized linear model. |
For related guides, see ANOVA in Python, ANOVA in R, ANOVA in SPSS, ANOVA Assumptions, ANOVA Effect Size, Balanced ANOVA, Brown Forsythe ANOVA, Cohen’s F Formula, Effect Size and T Test vs ANOVA.
Downloads and Resources for GLM ANOVA
Use these resources to reproduce the GLM ANOVA workflow. The Python report, R report and SPSS output PDF are included as verification files. Script and workbook placeholders can be replaced after the final downloadable files are uploaded to the WordPress Media Library.
Download Dataset
Practice dataset with G3, studytime, school and sex variables.
Download GLM ANOVA Python Report PDF
Python report PDF for GLM ANOVA fixed factors, F statistics, effect sizes and diagnostics.
Download GLM ANOVA R Report PDF
R validation PDF for GLM ANOVA results and chart confirmation.
Download GLM ANOVA SPSS Output PDF
SPSS output PDF for GLM ANOVA interpretation and reporting.
Download Python Script
Python code for GLM ANOVA, partial eta squared, global F test and diagnostics.
Download R Script and Excel Workbook
R workflow and Excel support workbook for GLM ANOVA summaries.
FAQs About GLM ANOVA
What is GLM ANOVA?
GLM ANOVA is ANOVA fitted in the General Linear Model framework. It tests a numeric outcome against one or more fixed factors.
What was the dependent variable in this GLM ANOVA?
The dependent variable was G3 final grade.
What fixed factors were used?
The supplied charts use studytime, school and sex as fixed factors.
What was the global GLM ANOVA result?
The global model result was statistically significant, with observed F = 21.126 and critical F = 2.228.
Which fixed factor was strongest?
School was the strongest fixed factor in the supplied charts, with the largest F statistic and largest partial eta squared.
What did the cell means heatmap show?
The heatmap showed that GP school cells were generally higher than MS school cells across studytime levels, with the highest area around GP studytime level 3.
What is partial eta squared in GLM ANOVA?
Partial eta squared is an effect-size measure showing how much variation a factor explains relative to that factor plus error variation.
Were the residual diagnostics perfect?
No. The residual Q-Q plot showed lower-tail departures, and the residuals-versus-fitted plot showed several large negative residuals.
Can GLM ANOVA be done in SPSS?
Yes. In SPSS, use Analyze > General Linear Model > Univariate, set G3 as the dependent variable, and add studytime, school and sex as fixed factors.
How do I report this GLM ANOVA in APA style?
A concise report is: The GLM ANOVA model for G3 was significant, observed F = 21.126, critical F = 2.228, df1 = 5, df2 = 643. School had the strongest fixed-factor effect, followed by studytime, while sex had the smallest effect-size share.

