
Difference between t test and ANOVA, when to use each, and why t² equals F for two groups
T Test vs ANOVA: Difference, When to Use, Formula, Examples and Interpretation
T Test vs ANOVA is one of the most common questions in statistics. A t test is mainly used when comparing the means of two groups, while ANOVA is used when comparing the means of three or more groups. When there are exactly two groups, a two-group one-way ANOVA gives the same significance decision as the equal-variance independent samples t test because F = t². This guide explains ANOVA vs t test, when to use ANOVA vs t test, when to use t test vs ANOVA, one way ANOVA vs t test, p value comparison, method choice, formulas, charts, tables and common mistakes.
Quick Answer: T Test vs ANOVA
Use a t test when your main question compares the mean of one group with a value, two independent groups, or two paired measurements. Use ANOVA when your main question compares the means of three or more groups. If you have exactly two independent groups, the equal-variance t test and the two-group one-way ANOVA give the same p value because the ANOVA F statistic equals the t statistic squared.
In the worked example, the t test compares G3 final grade between two school groups, GP and MS. ANOVA is used when comparing G3 across multiple studytime categories. The t test answers a two-group question. ANOVA answers a multi-group question.
Final decision rule: Use t test for two means. Use ANOVA for three or more means. If the independent variable has exactly two groups, one-way ANOVA and the equal-variance t test are mathematically equivalent because F = t².
Important warning: Do not run many separate t tests just because you have more than two groups. Multiple t tests increase the chance of false positive results. Use one-way ANOVA first, then post hoc tests if the ANOVA is significant.
Table of Contents
- What Is T Test vs ANOVA?
- T Test vs ANOVA Formula
- Null and Alternative Hypotheses
- Dataset and Variables Used
- Result Interpretation
- Chart-by-Chart Interpretation
- When to Use ANOVA vs T Test
- Software Workflow Notes
- Code and Formula Blocks
- APA Reporting Wording
- Common Mistakes
- When to Use T Test vs ANOVA
- Downloads and Resources
- Related Guides
- FAQs
What Is T Test vs ANOVA?
T Test vs ANOVA compares two families of mean-comparison tests. A t test is used when the research question is about one mean, two independent means, or two paired means. ANOVA, short for analysis of variance, is used when the research question is about comparing means across three or more groups.
The keyword sheet shows that users search for anova vs t test, t test vs anova, student t test vs anova, anova test vs t test, one way anova vs t test, and when to use anova vs t test. The real answer is simple: use the method that matches the number of groups and the research design.
Simple definition: A t test compares one or two means. ANOVA compares three or more means. With exactly two independent groups, one-way ANOVA and the equal-variance t test give the same significance decision.
Use a t test if your independent variable has two groups, such as GP versus MS. Use ANOVA if your independent variable has more than two groups, such as several studytime categories. Related guides include T Test Assumptions, T Test for Difference Between Means, T Test for Unequal Variances, One Way ANOVA, ANOVA, Post Hoc Test, P Value, and Confidence Interval.
T Test vs ANOVA Formula
The t test and ANOVA both compare means, but they use different test statistics.
T Test Formula
The t statistic compares the difference between two means with the standard error of that difference. It is used for two-group mean comparisons.
ANOVA Formula
The ANOVA F statistic compares between-group variation with within-group variation. It is used when comparing three or more group means.
Two-Group Equivalence Formula
When there are exactly two independent groups and the same equal-variance model is used, the one-way ANOVA F statistic equals the squared t statistic. This is why the p value is the same in a two-group equal-variance t test and a two-group one-way ANOVA.
| Comparison | T Test | ANOVA |
|---|---|---|
| Number of groups | Usually 1 or 2 means | Usually 3 or more means |
| Test statistic | t statistic | F statistic |
| Distribution | t distribution | F distribution |
| Main output | Mean difference and t value | Between and within variation, F value |
| Two-group equivalence | t² | F |
Null and Alternative Hypotheses
The hypotheses differ because the t test usually compares two means, while ANOVA compares multiple means.
| Method | Null Hypothesis | Alternative Hypothesis |
|---|---|---|
| T test | H0: μ1 = μ2 | H1: μ1 ≠ μ2 |
| One-way ANOVA | H0: all group means are equal | H1: at least one group mean is different |
| Two-group ANOVA | H0: μ1 = μ2 | H1: μ1 ≠ μ2 |
Key interpretation difference: A significant t test tells which of the two means differs because there are only two means. A significant ANOVA with three or more groups tells that at least one mean differs, but it does not automatically tell which groups differ. For that, use post hoc tests.
Dataset and Variables Used
The worked example uses a student performance dataset. The dependent variable is G3 final grade. The t-test example compares G3 between two school groups, GP and MS. The ANOVA example compares G3 across multiple studytime categories.
| Variable | Role | Used In |
|---|---|---|
| G3 | Numeric dependent variable | T test and ANOVA |
| school | Two-group factor: GP vs MS | T test example |
| studytime | Multi-group factor | ANOVA example |
| GP and MS | Two independent groups | Shows t test versus two-group ANOVA equivalence |
Result Interpretation
The t test compares the two school groups and shows a statistically significant mean difference. GP has a higher mean G3 score than MS. The ANOVA example compares G3 across studytime levels and evaluates whether the variation between studytime groups is large relative to the variation within groups.
T Test Result
The t-test result focuses on two groups. The interpretation is direct: if the p value is below .05, the two means differ significantly. In this worked example, GP has a higher mean than MS.
ANOVA Result
The ANOVA result focuses on multiple group means. If the p value is below .05, at least one group mean differs from another. The ANOVA result should be followed by post hoc tests when there are three or more groups and the goal is to identify exactly which groups differ.
Two-Group Equivalence
If ANOVA is run with exactly two groups, it gives the same significance decision as the equal-variance independent samples t test. The relationship is F = t². This equivalence is useful for understanding why t tests and ANOVA are connected.
Chart-by-Chart Interpretation
The following images explain T Test vs ANOVA using group means, distributions, p value comparisons, method choice tables, t and F curves, and equivalence outputs.
Chart 1: T Test Two Group Means
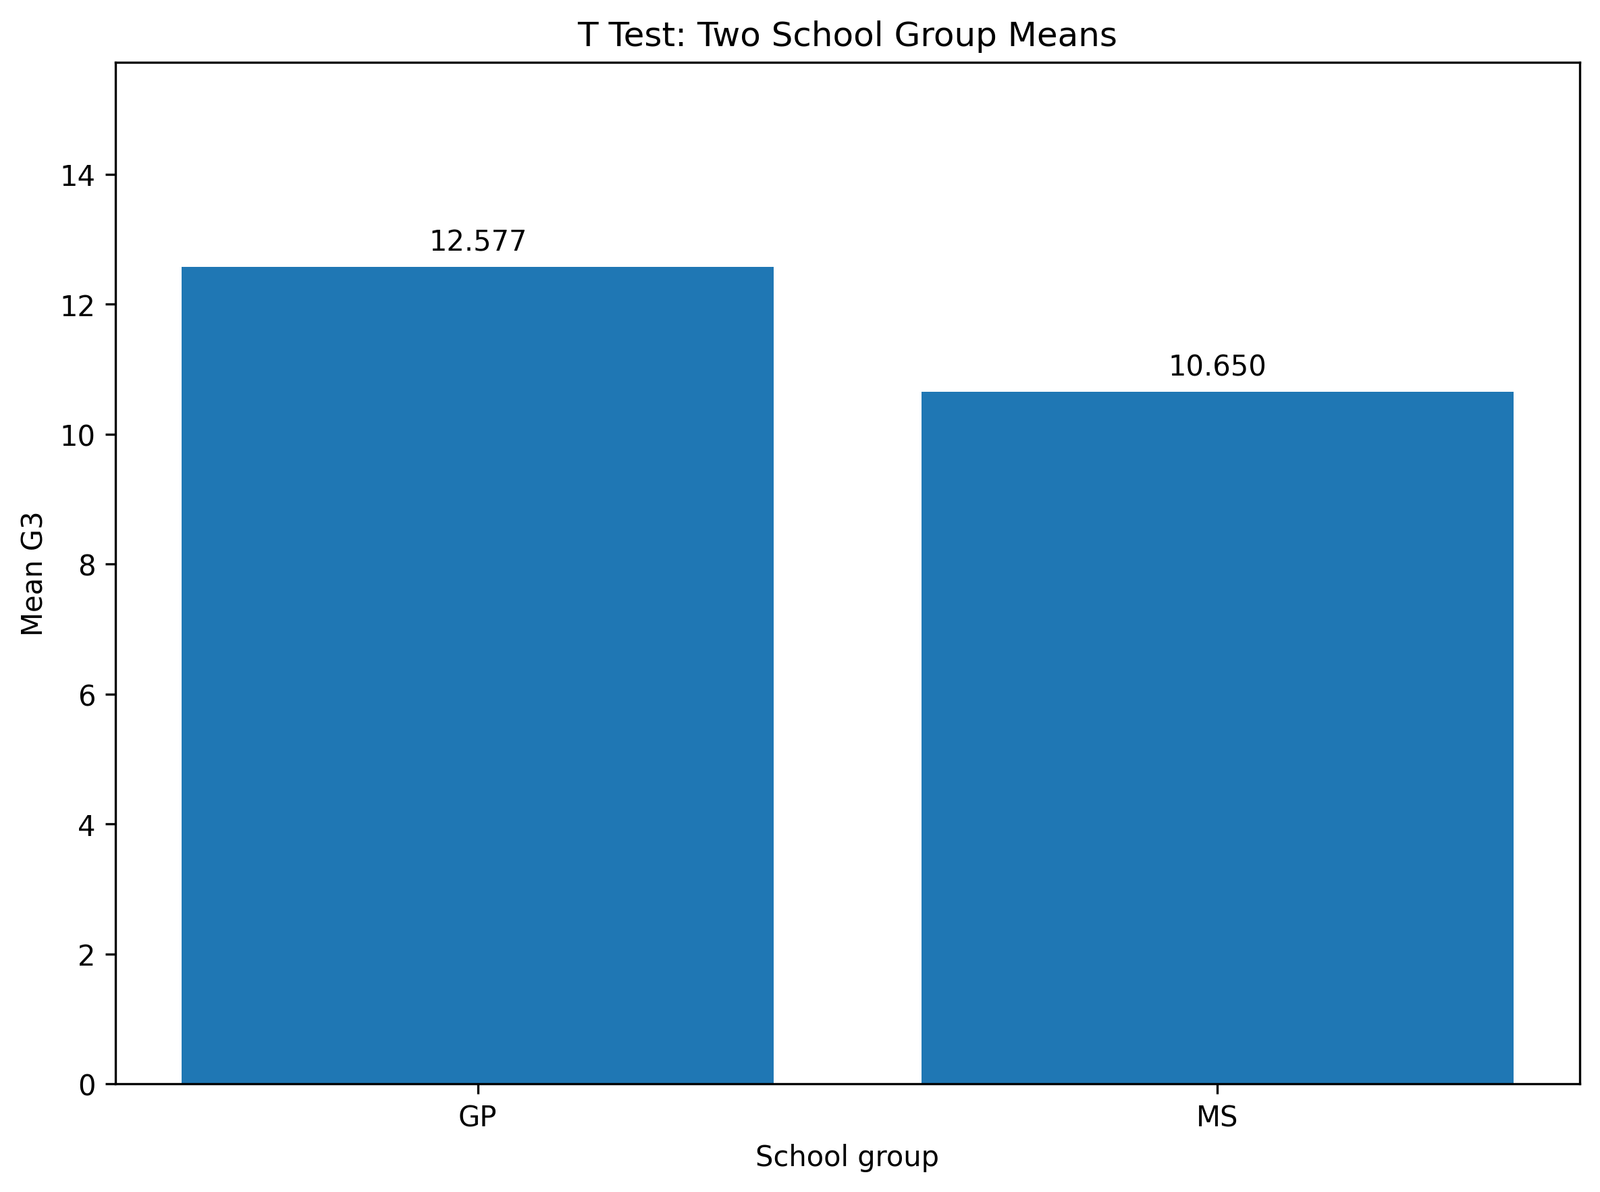
This chart shows why a t test is appropriate when only two group means are compared. The example compares GP and MS on G3 final grade.
The chart supports the key t-test rule: when the independent variable has two groups, a t test is a natural method for comparing means.
Chart 2: ANOVA Studytime Group Means
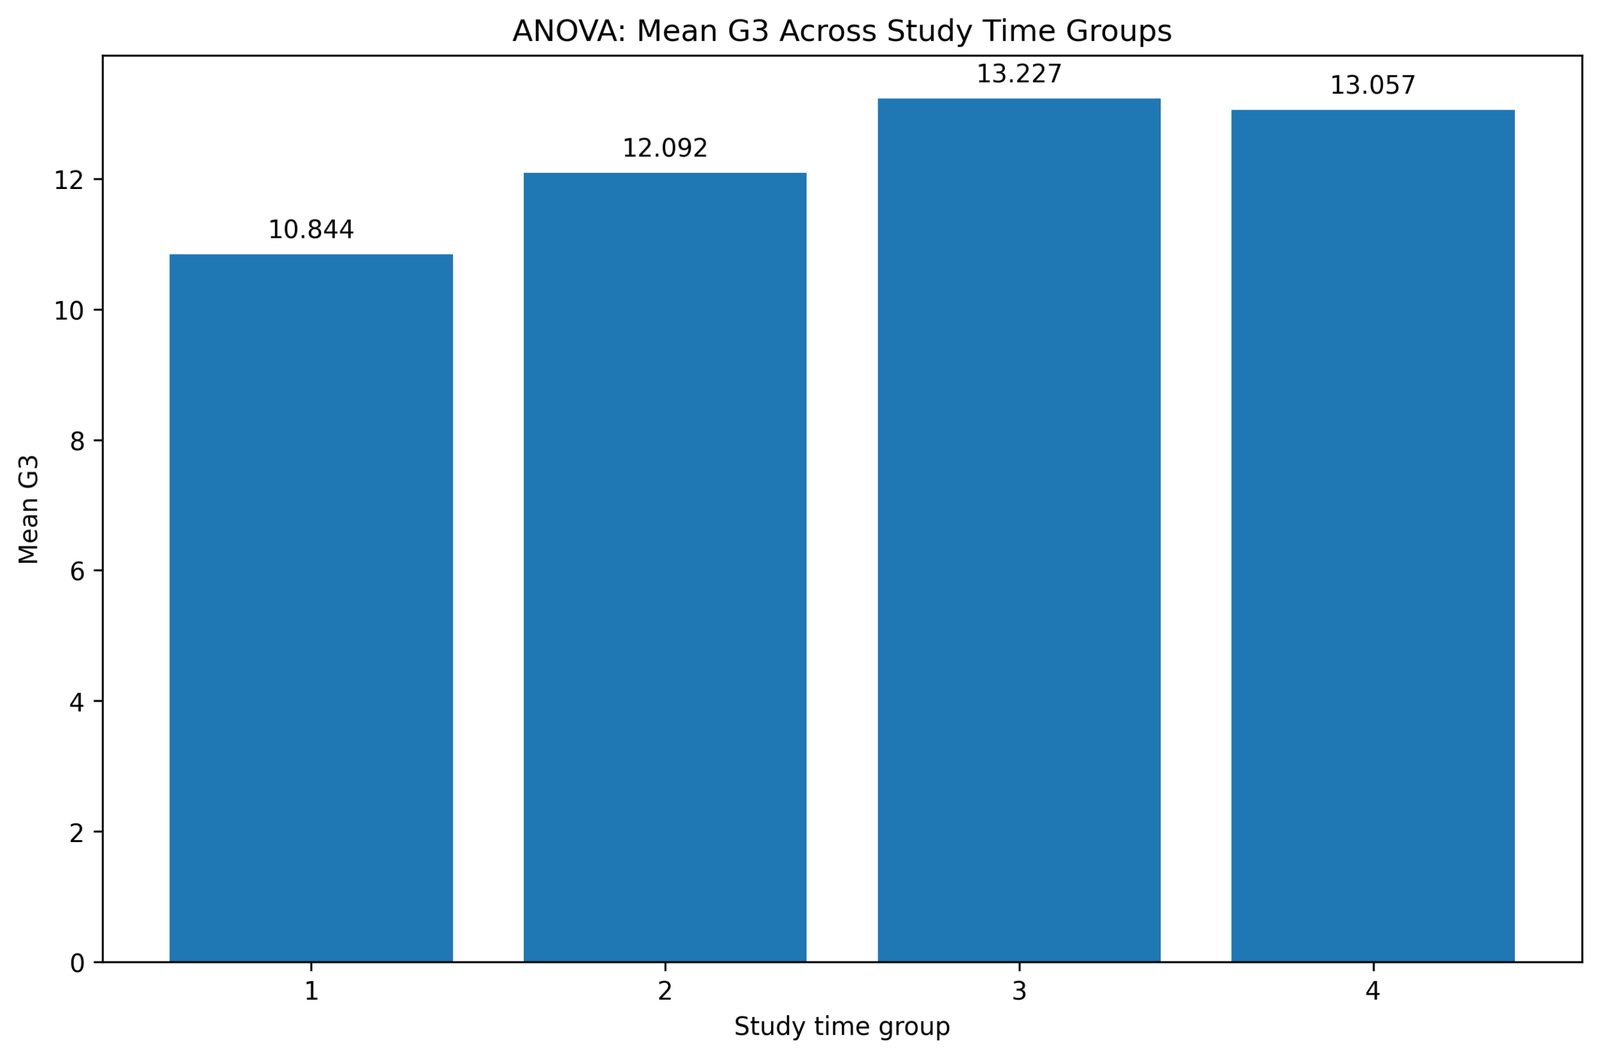
This chart shows why ANOVA is appropriate when more than two group means are compared. Studytime has multiple categories, so one-way ANOVA is the correct first test.
The chart explains the keyword when to use ANOVA vs t test: use ANOVA when the factor has three or more groups.
Chart 3: T Test Distribution for Two Groups
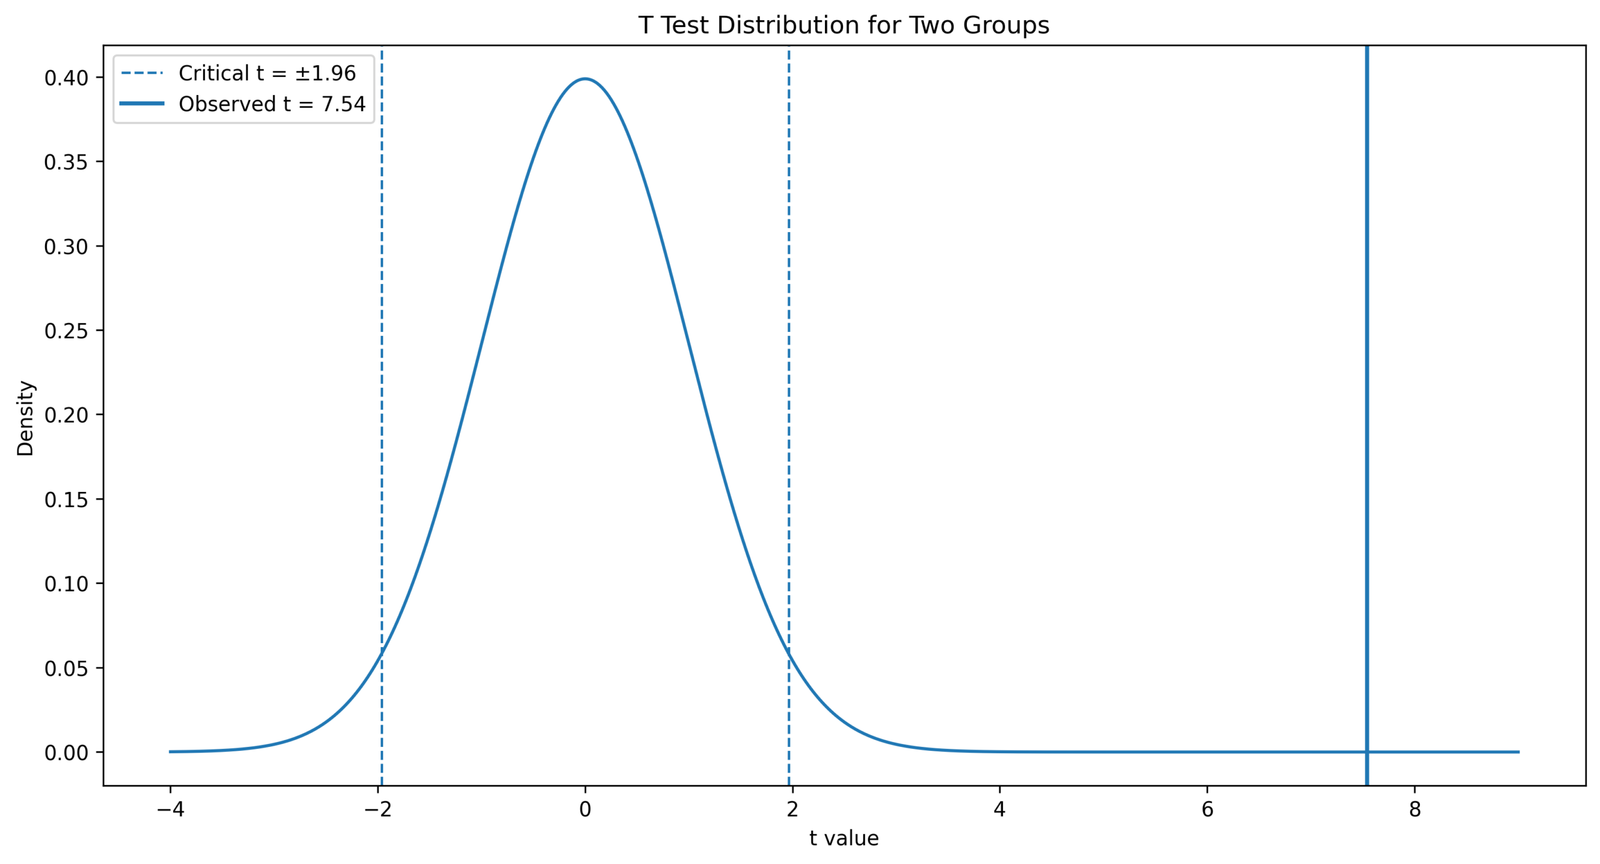
This chart shows the t statistic on the t distribution. The t test uses this distribution to calculate the probability of observing a mean difference under the null hypothesis.
The chart helps readers understand that the t test is designed around a two-mean comparison.
Chart 4: ANOVA F Distribution for Studytime
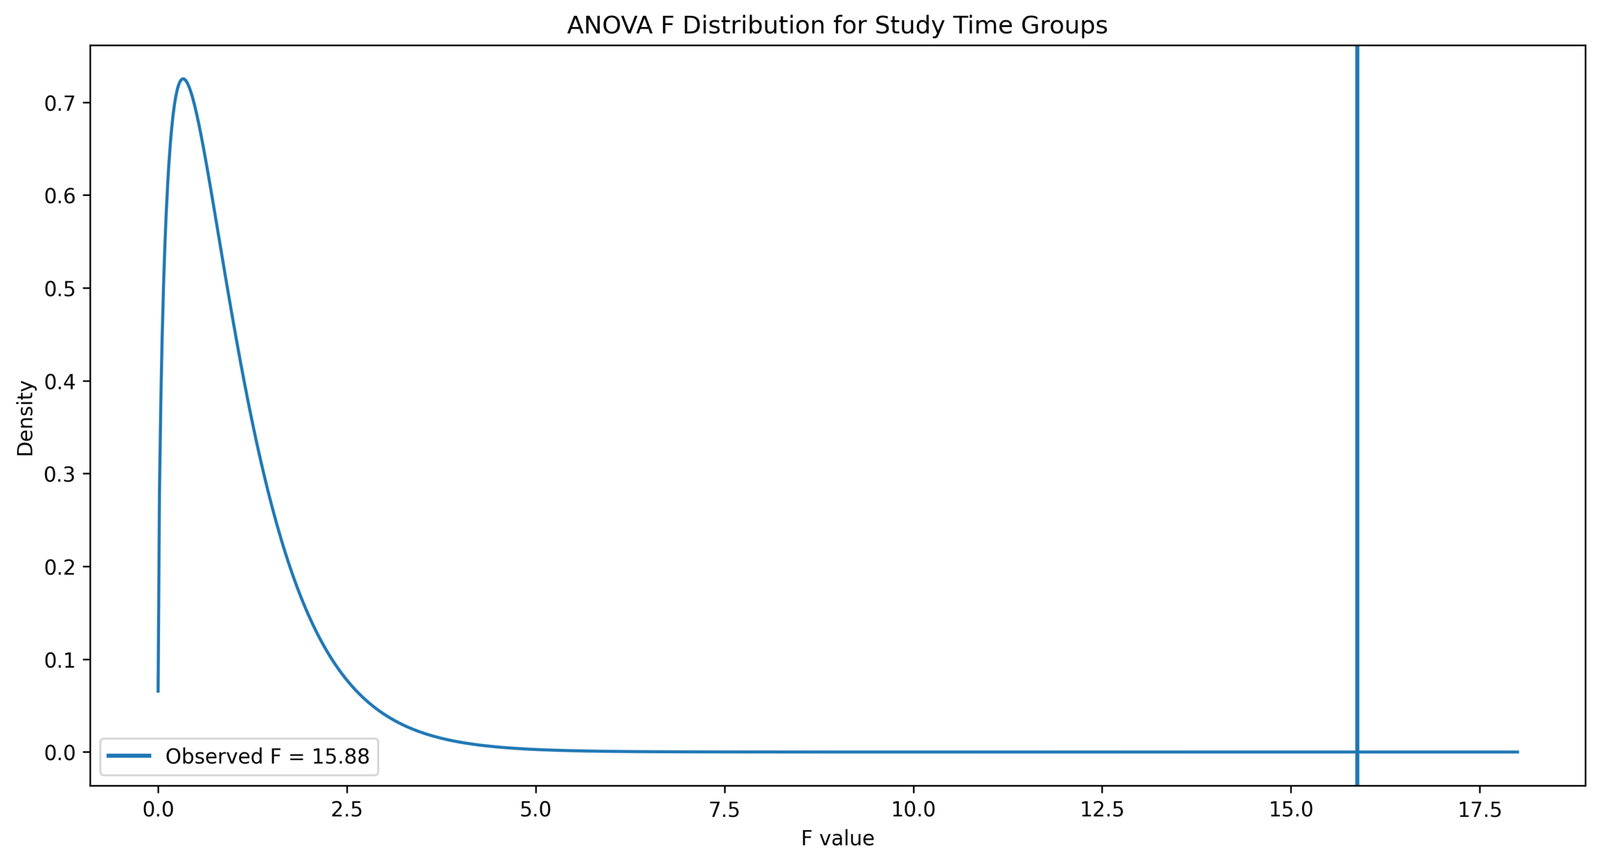
This chart shows the ANOVA F statistic on the F distribution. ANOVA uses the F distribution because it compares variance between groups with variance within groups.
The chart explains the main statistical difference between t test and ANOVA: t test uses t, while ANOVA uses F.
Chart 5: T Squared Equals Two Group ANOVA F
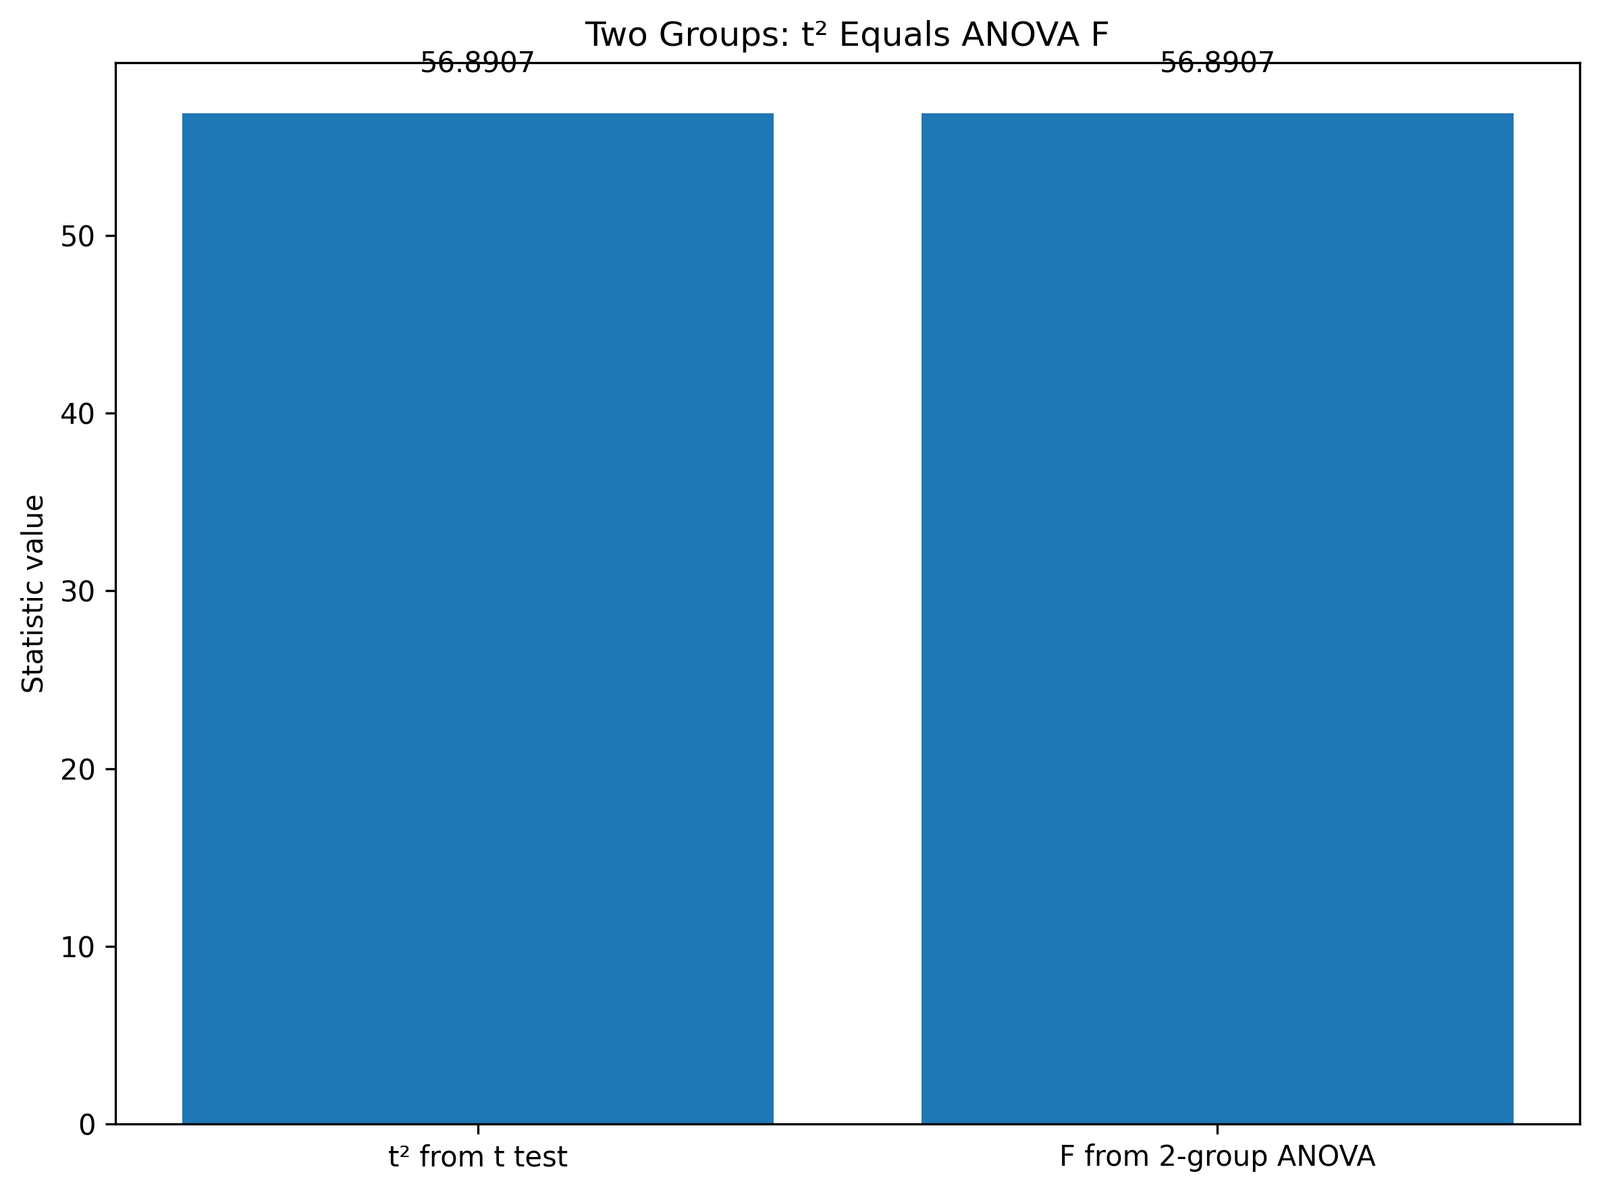
This chart explains the mathematical equivalence between a two-group equal-variance t test and a two-group one-way ANOVA.
The rule is simple: when the same two groups and the same equal-variance model are used, F = t². Therefore, the p value is the same.
Chart 6: T Test vs ANOVA P Value Comparison
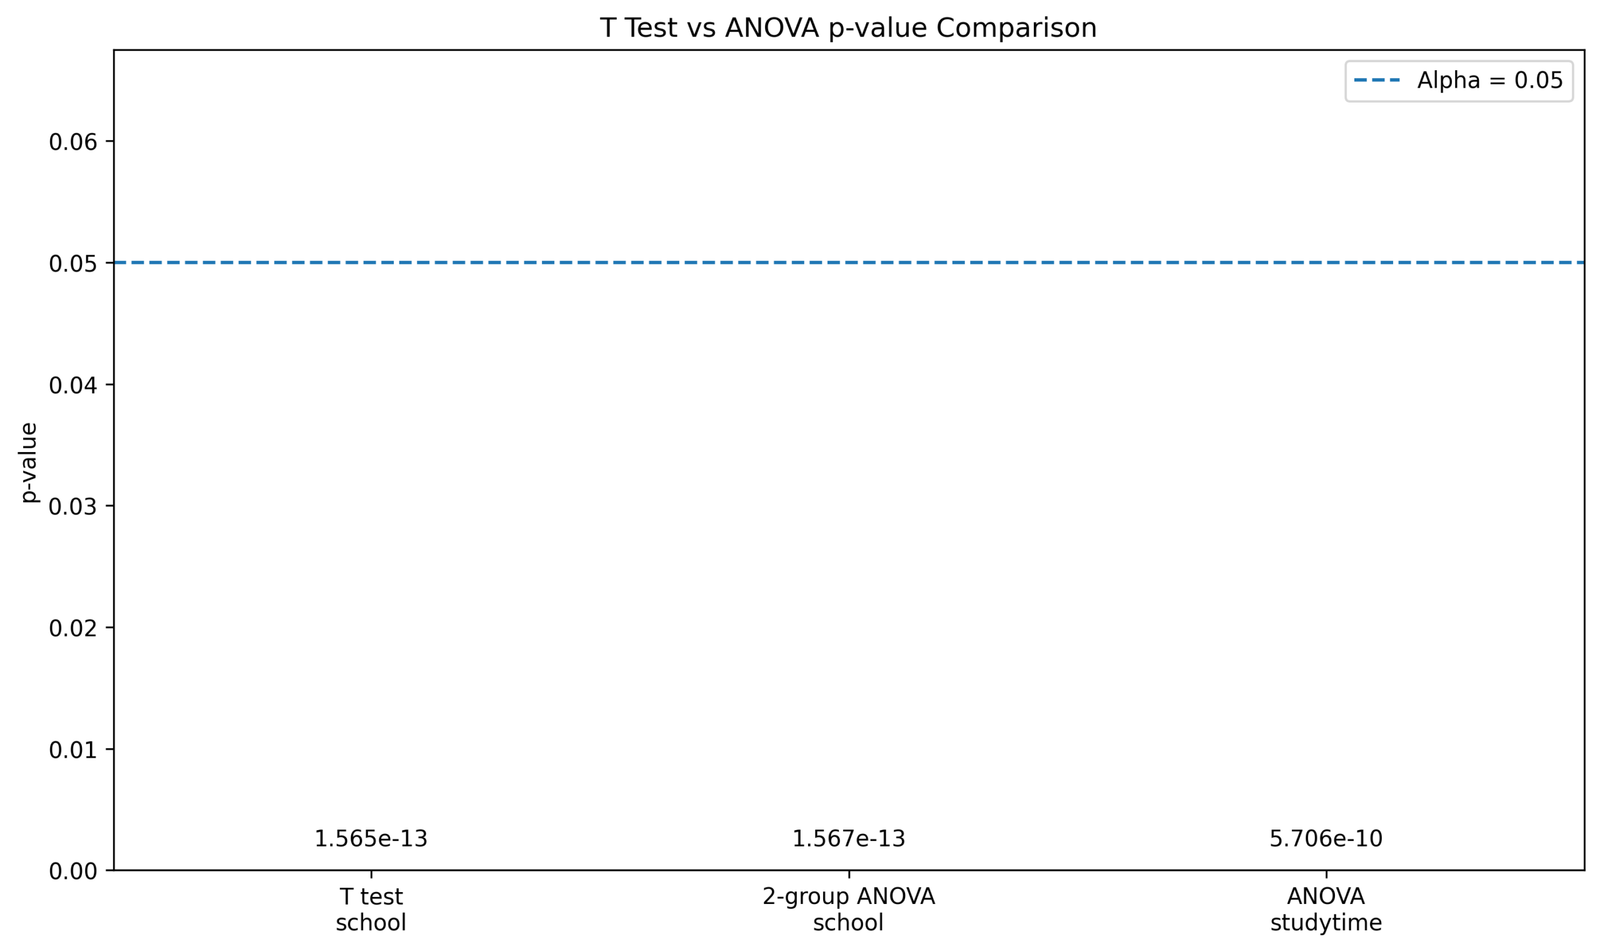
This chart compares p values from t-test and ANOVA workflows. It shows that the method choice should be based on research design, not on which test produces a smaller p value.
If there are two groups, use a t test or two-group ANOVA equivalently. If there are more than two groups, use ANOVA.
Chart 7: T Test vs ANOVA Method Choice
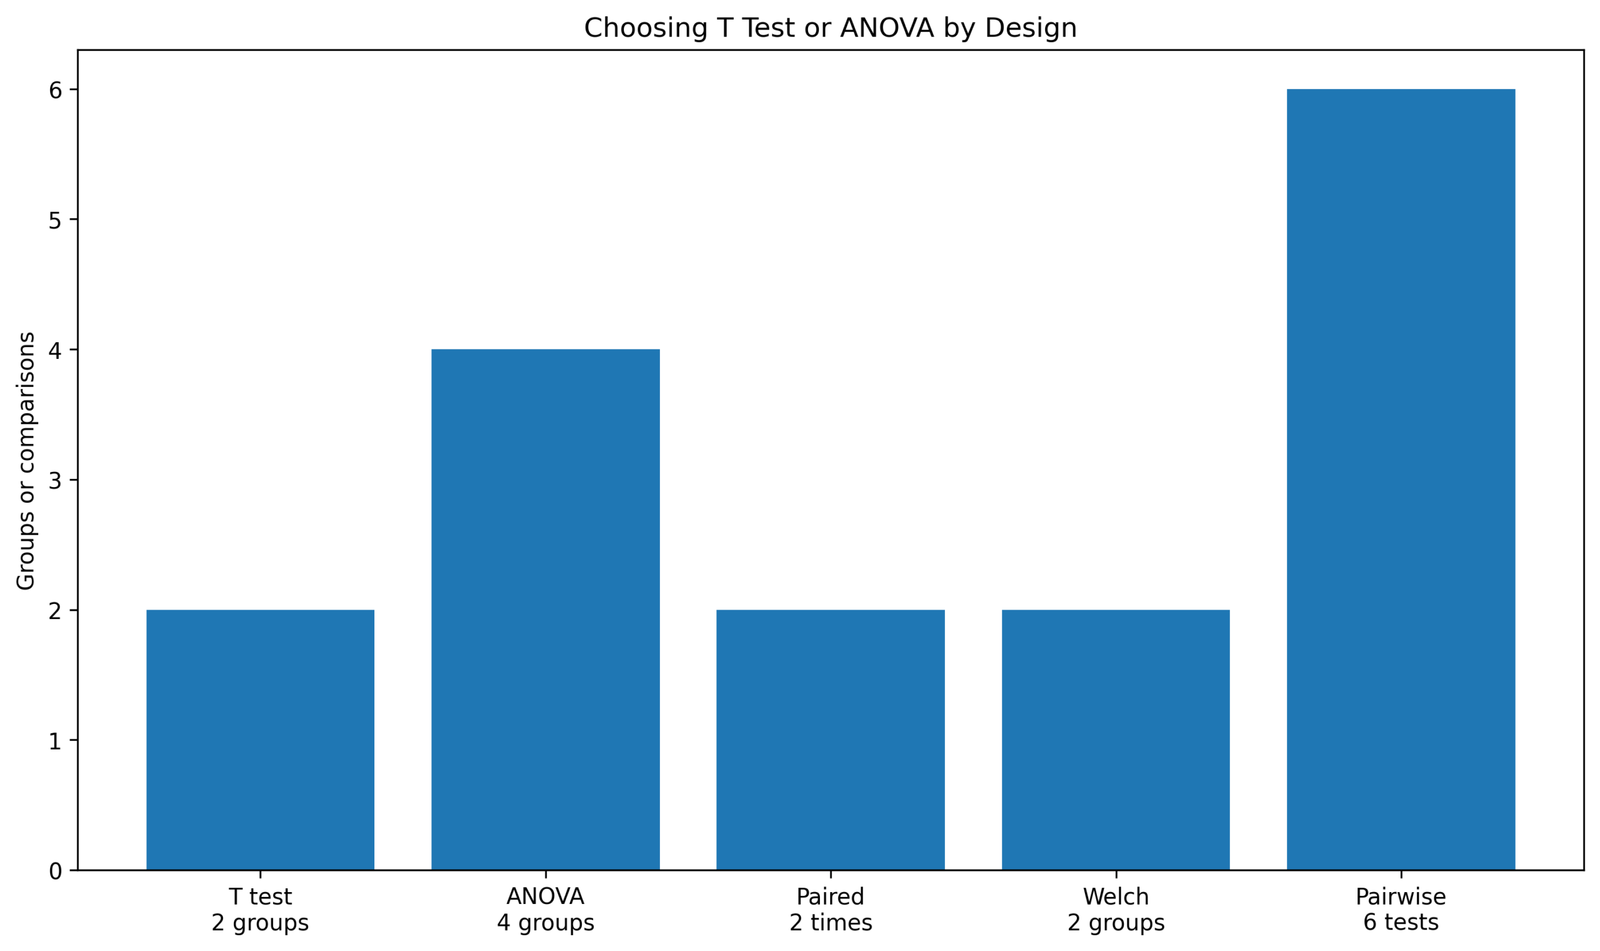
This chart gives the practical decision tree. Use a t test for one or two means, and use ANOVA for three or more means.
The chart directly answers when to use t test vs ANOVA and when to use ANOVA vs t test.
Chart 8: T Test Result Table
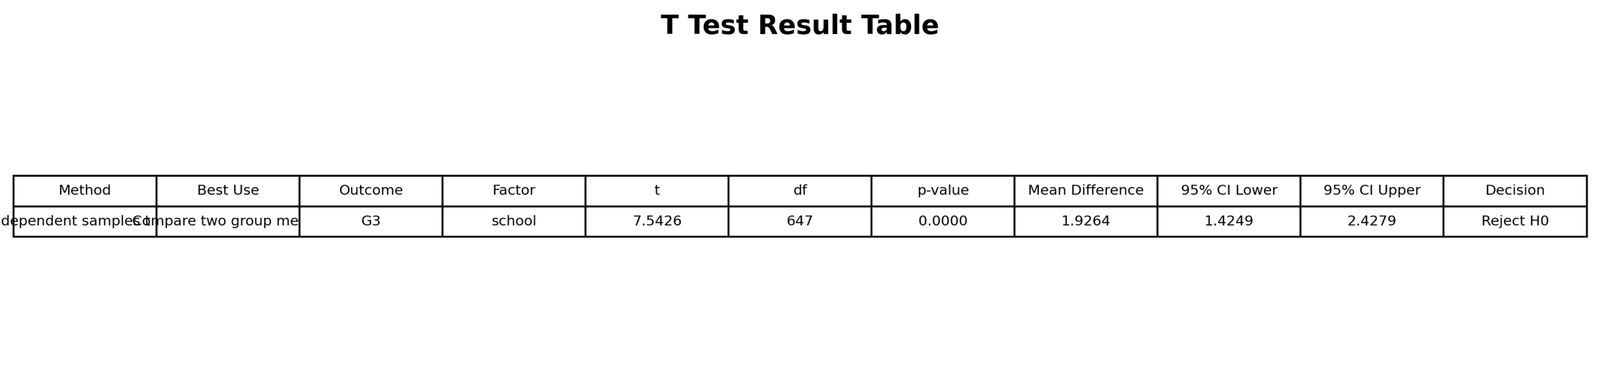
This table summarizes the two-group t-test result. It contains the t statistic, degrees of freedom, p value and decision.
The table confirms that the t test is suitable for the GP versus MS comparison because there are exactly two groups.
Chart 9: ANOVA Result Table
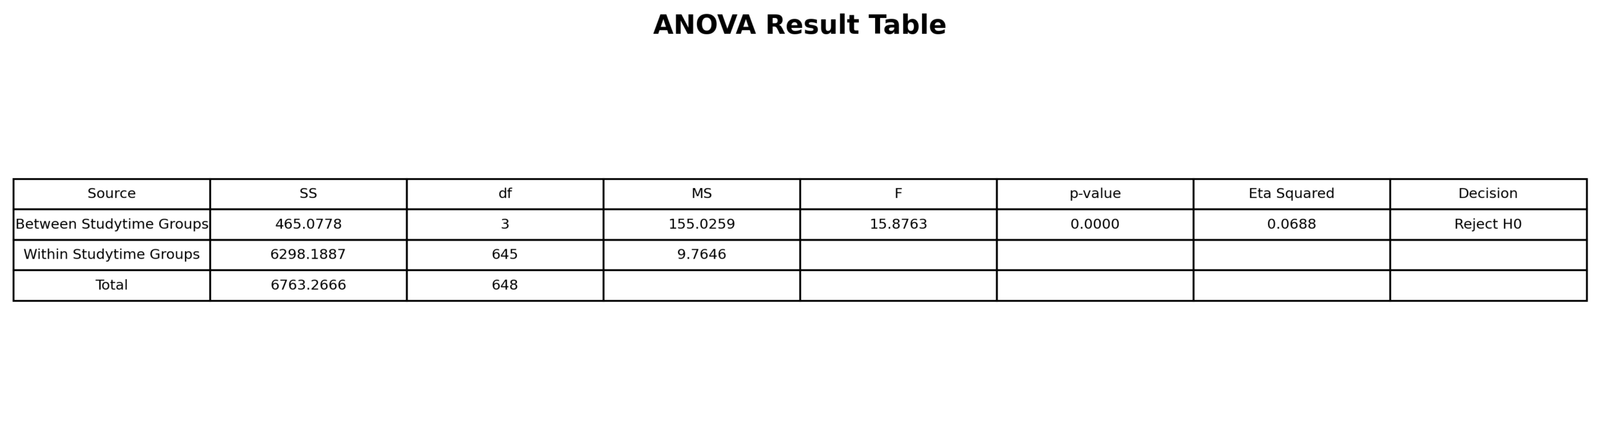
This table summarizes the ANOVA result. It reports between-group variation, within-group variation, F statistic and p value.
The table shows why ANOVA is used for multi-group comparisons: it tests whether at least one group mean differs.
Chart 10: T Test vs ANOVA Equivalence Table
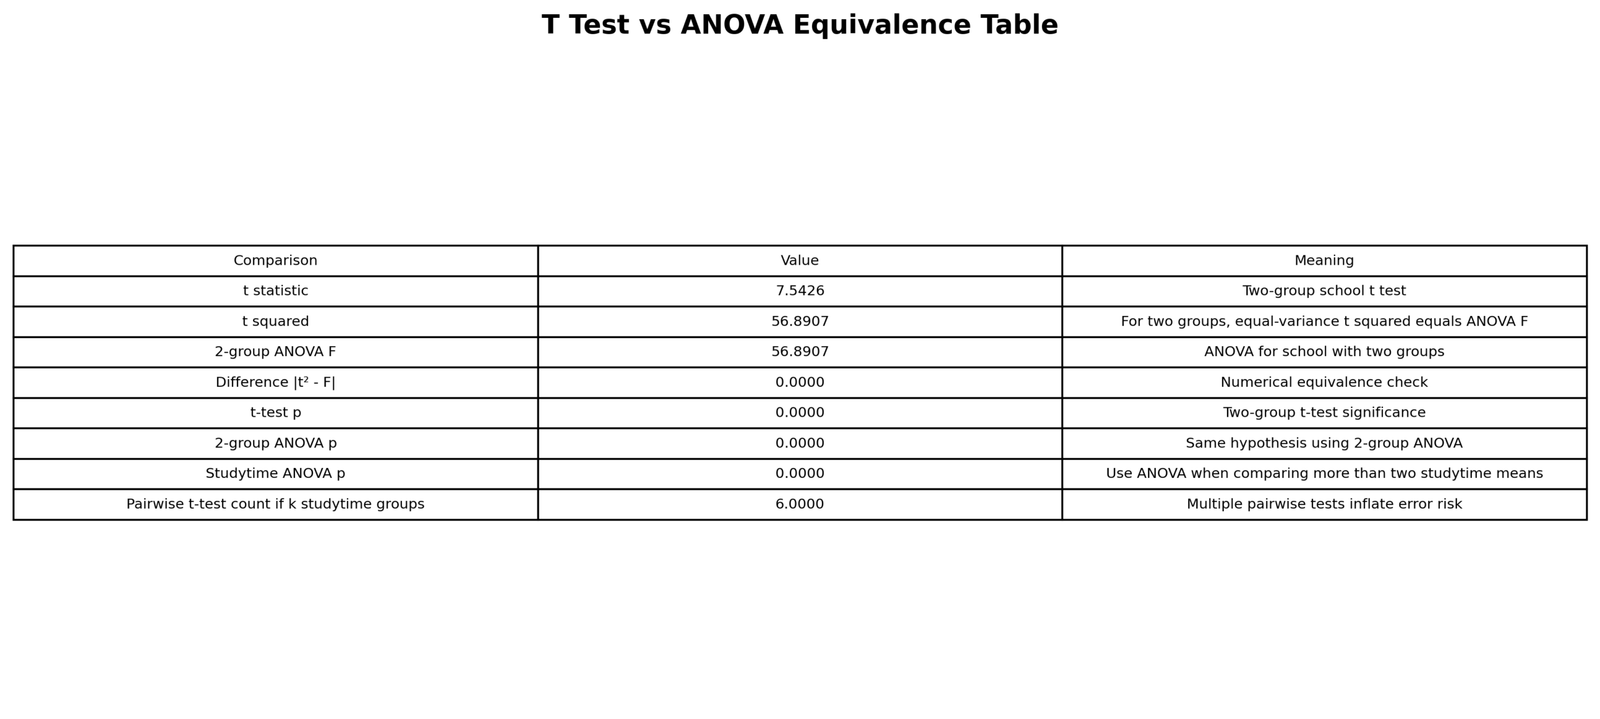
This table explains the equivalence between t test and ANOVA when there are exactly two groups.
The table is useful for students who ask why a t test and one-way ANOVA sometimes give the same result.
Chart 11: T Test vs ANOVA Method Choice Table
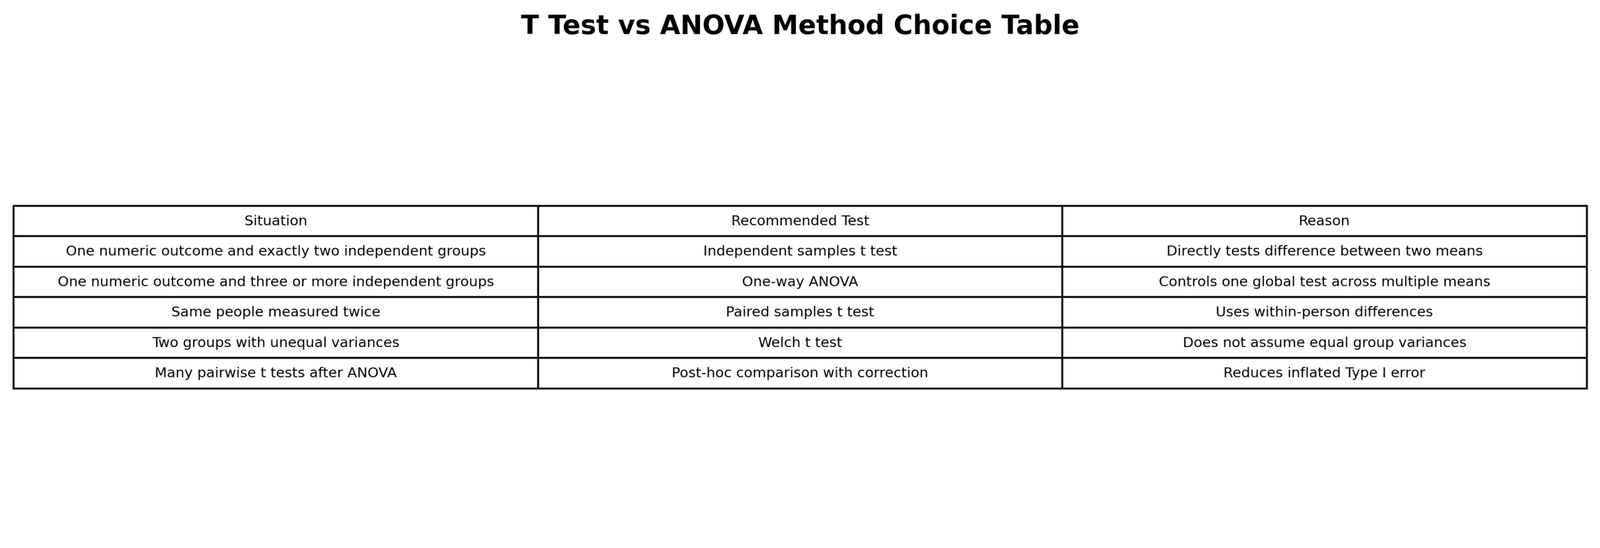
This table summarizes which method to choose. It separates one sample, two independent groups, paired measurements and three-or-more-group comparisons.
The table provides the clearest practical answer to the keyword when to use ANOVA vs t test.
Chart 12: T Test vs ANOVA Group Means
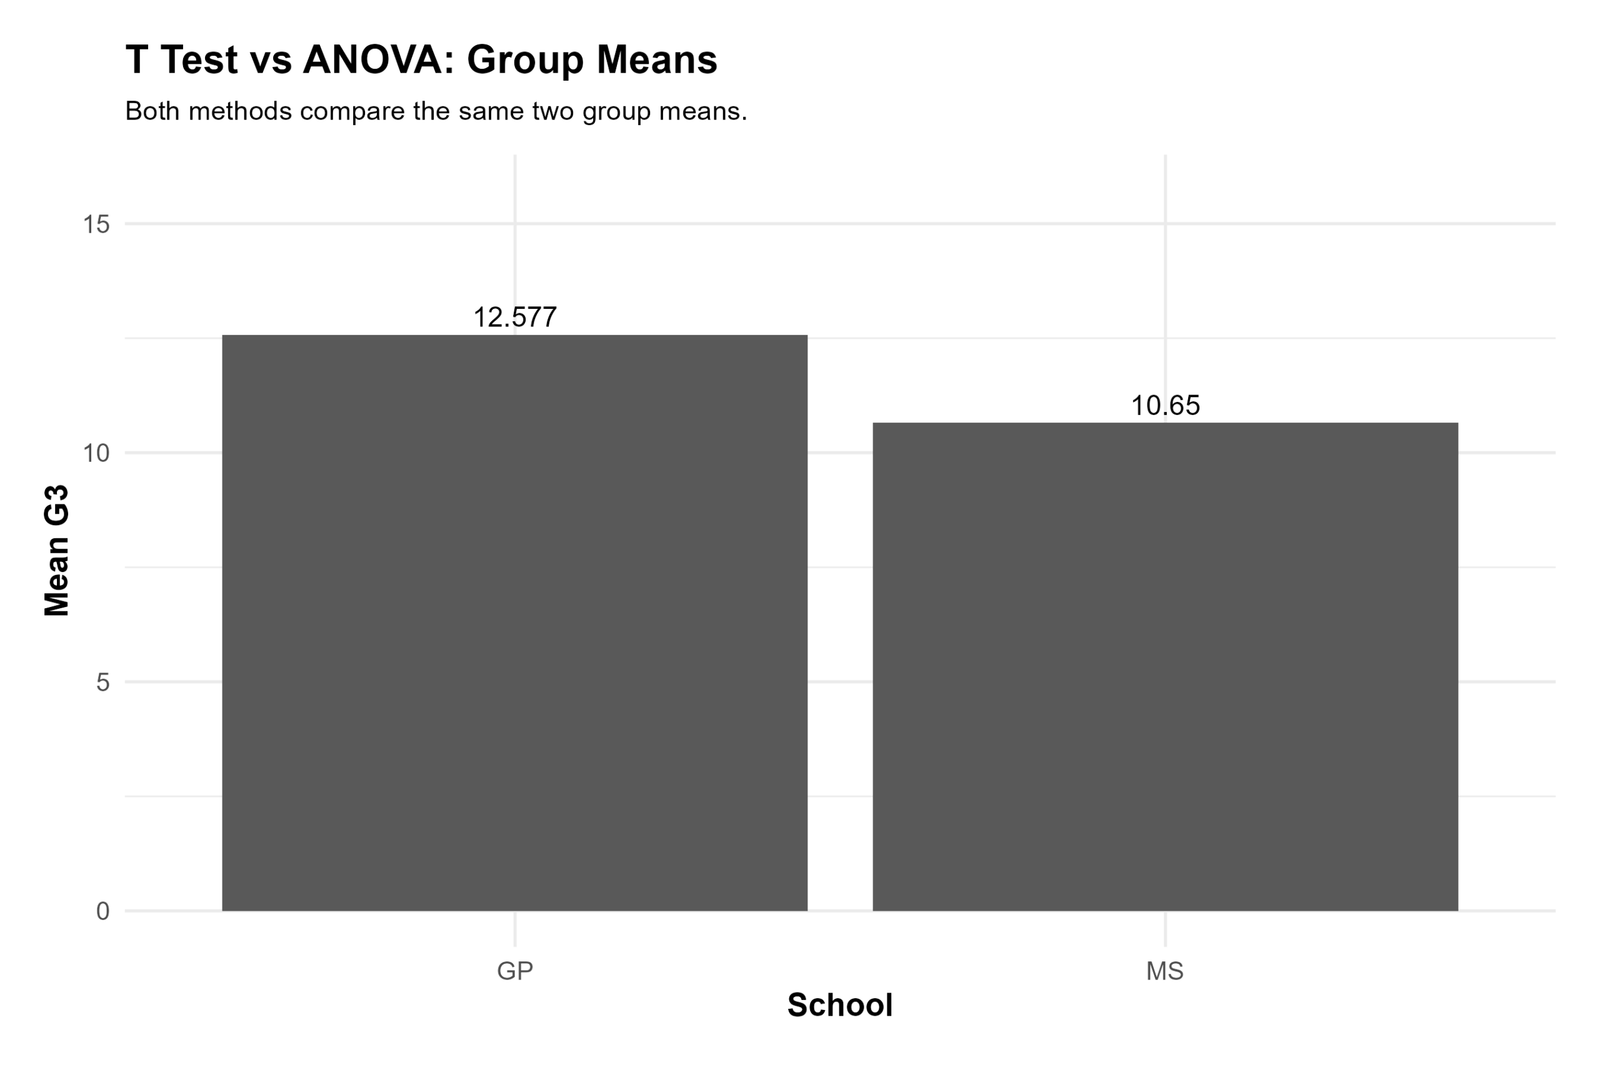
This chart shows group means in a format that connects the t test and ANOVA logic. Two groups can be handled by a t test, while more groups require ANOVA.
The chart helps readers see that both methods are mean-comparison tools, but they are used for different group structures.
Chart 13: G3 Distribution by School
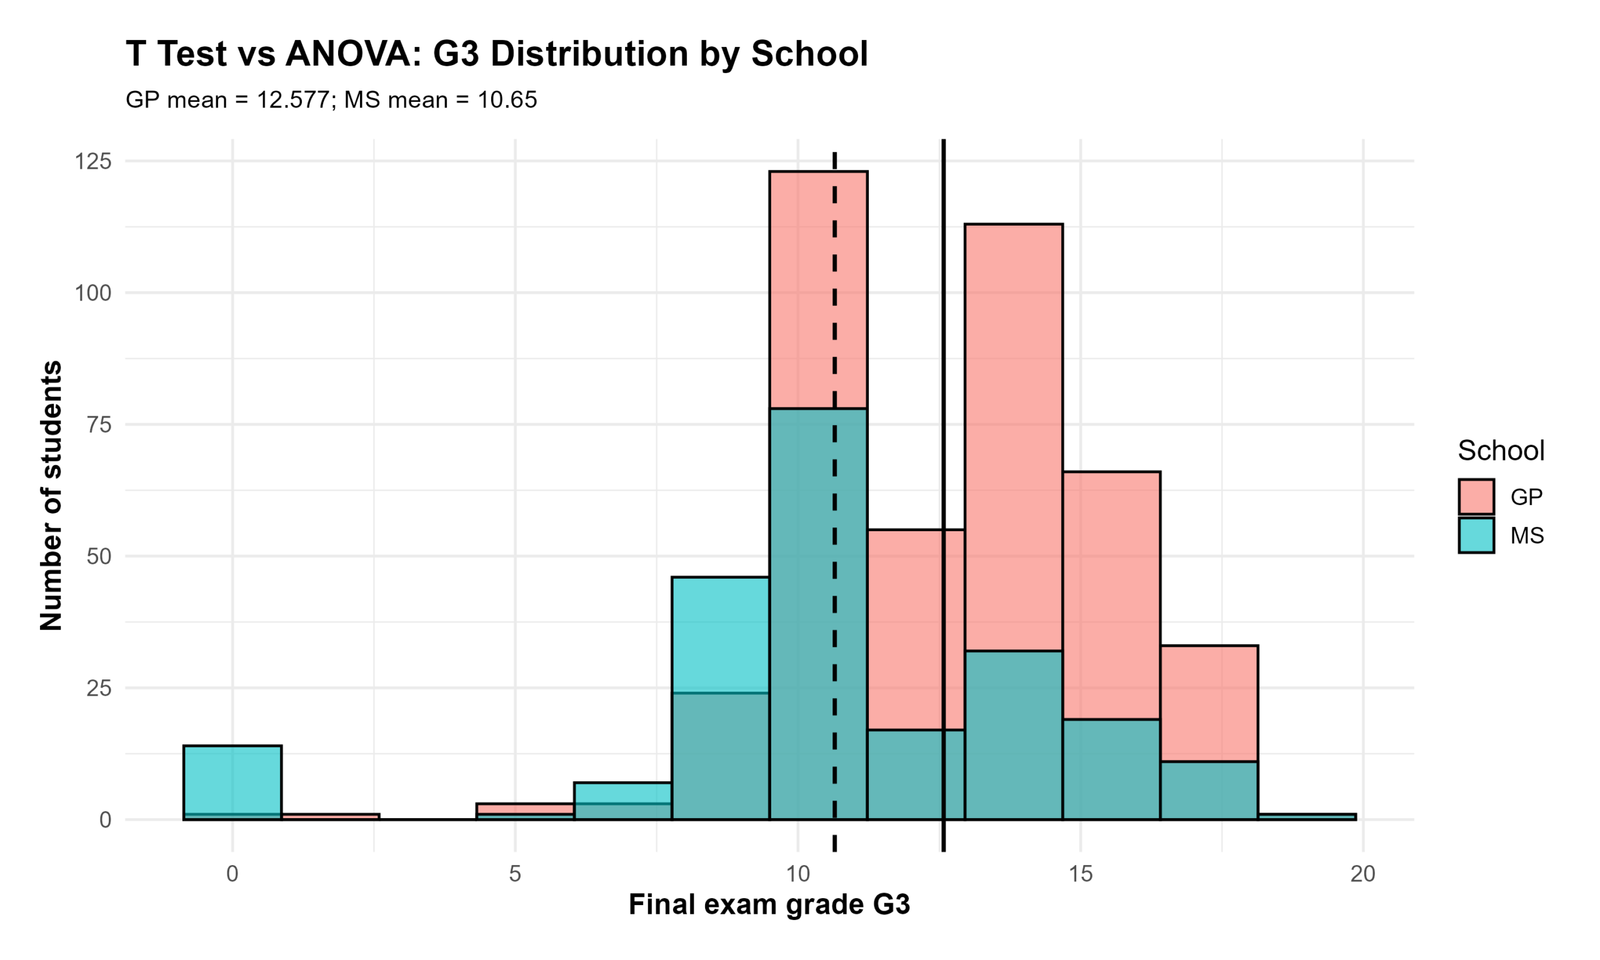
This chart shows the distribution of G3 scores for GP and MS. It supports the two-group t-test example.
The chart is useful because it shows the raw distribution pattern behind the mean comparison.
Chart 14: T Test Mean Difference Confidence Interval
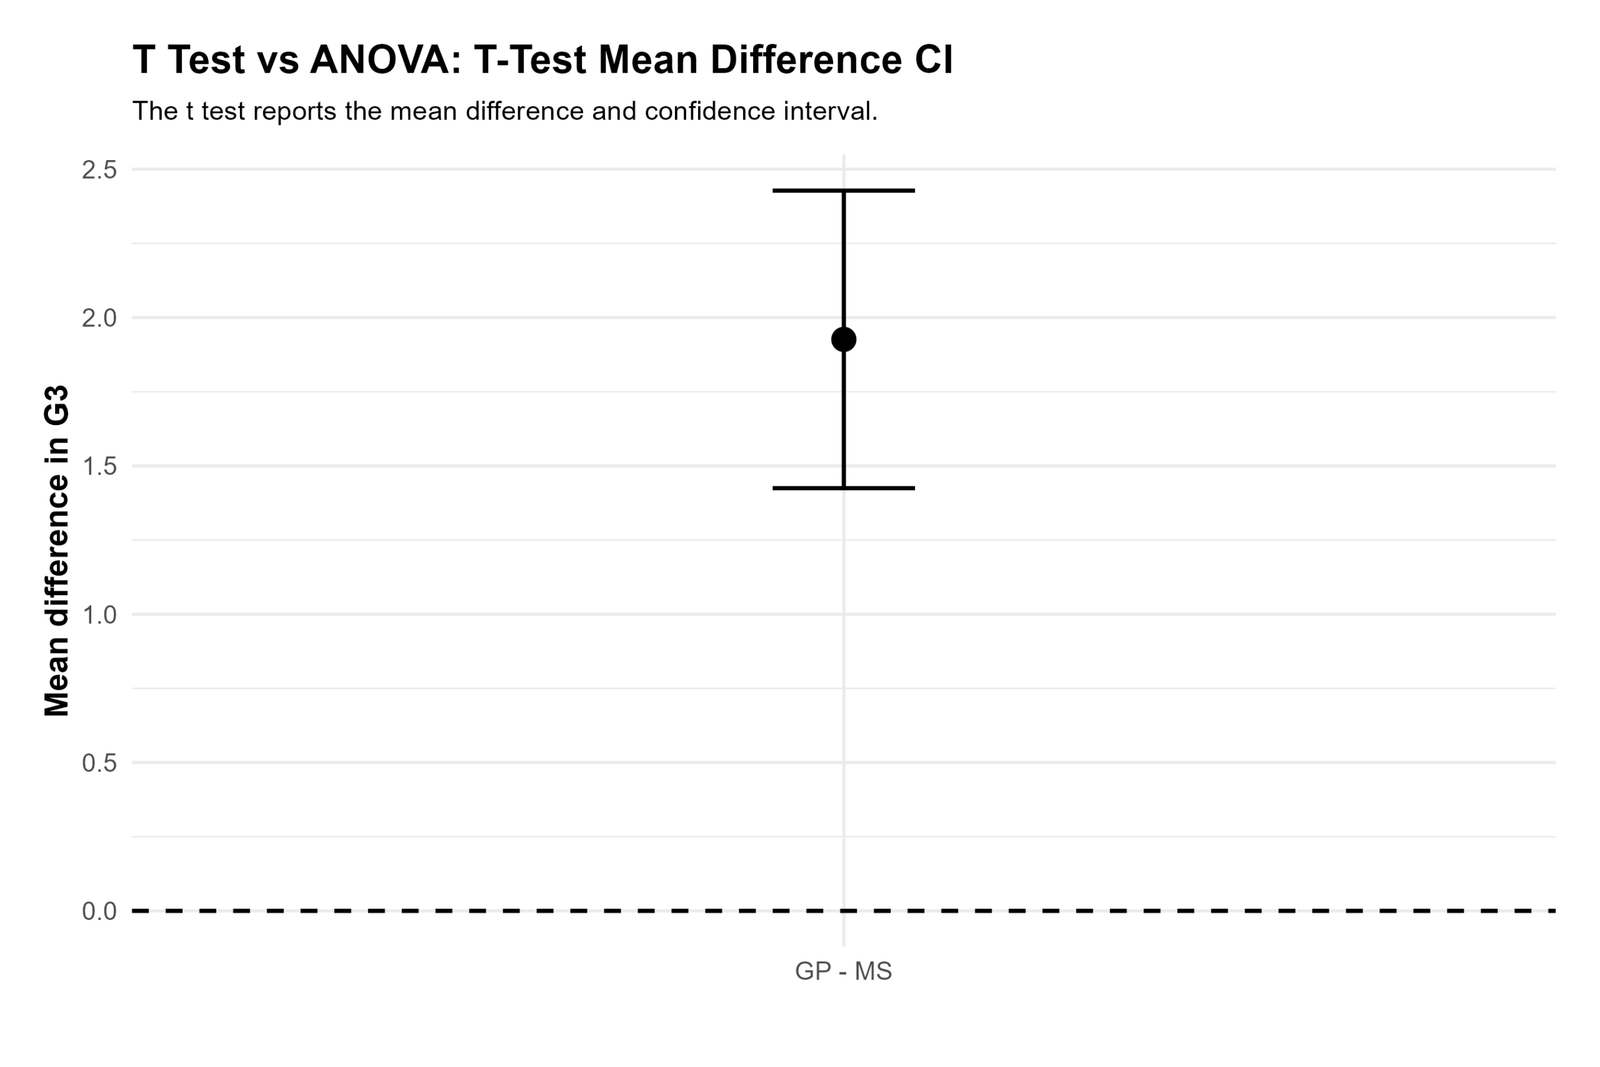
This chart focuses on the t-test mean difference. If the confidence interval does not include zero, the two means differ significantly.
The chart shows why confidence intervals are more informative than p values alone.
Chart 15: T Statistic T Distribution Curve
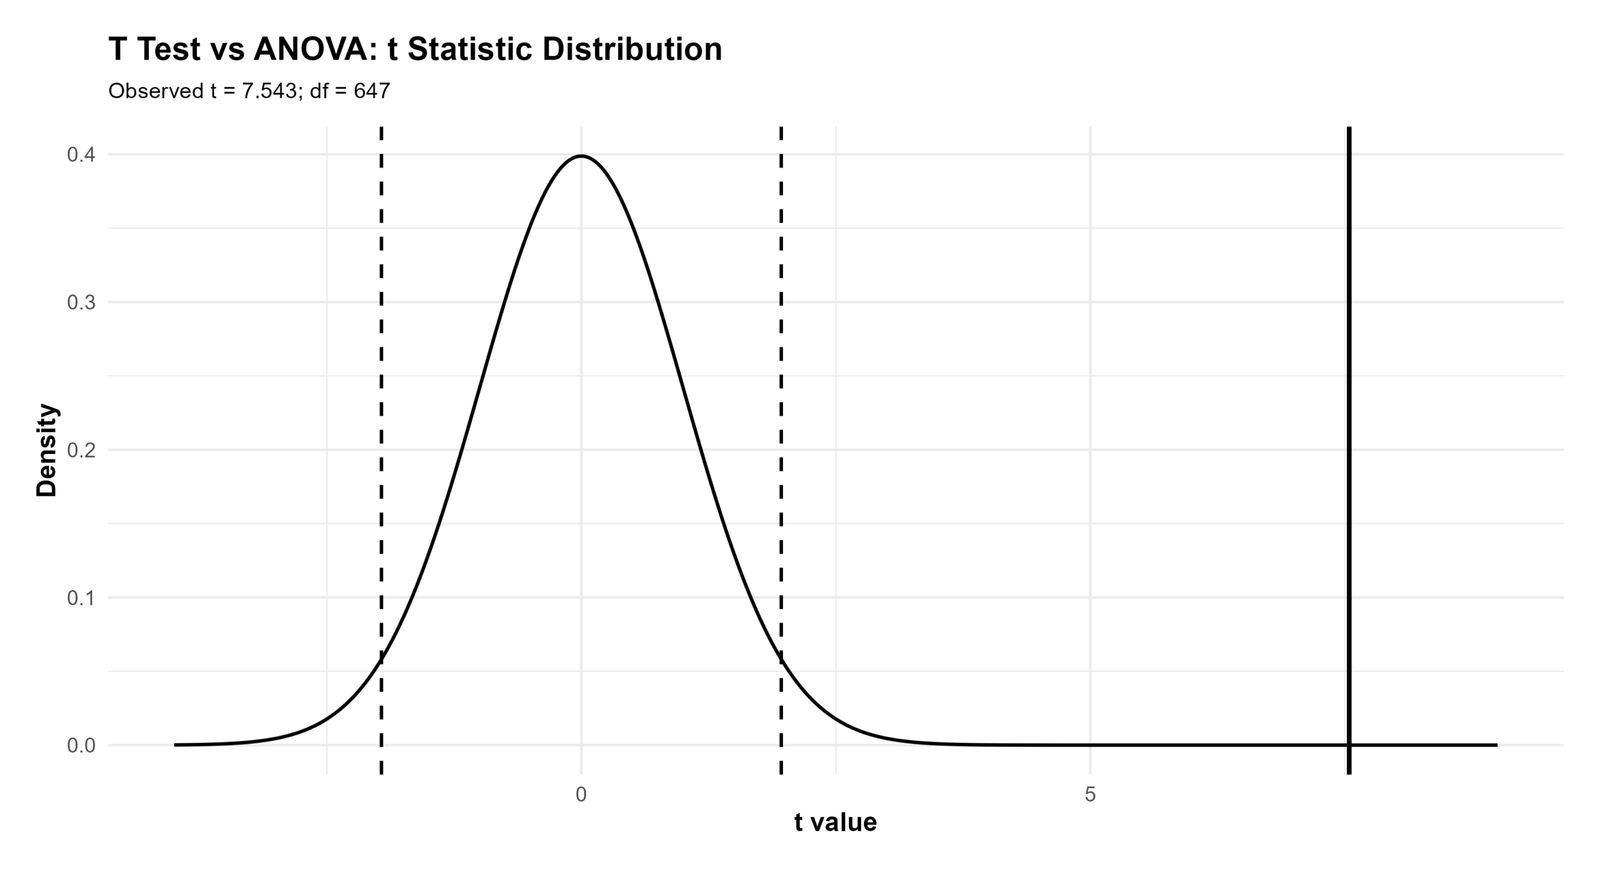
This chart shows how the t statistic is interpreted under the t distribution.
It helps students distinguish the t-test output from the ANOVA F-test output.
Chart 16: ANOVA F Distribution Curve
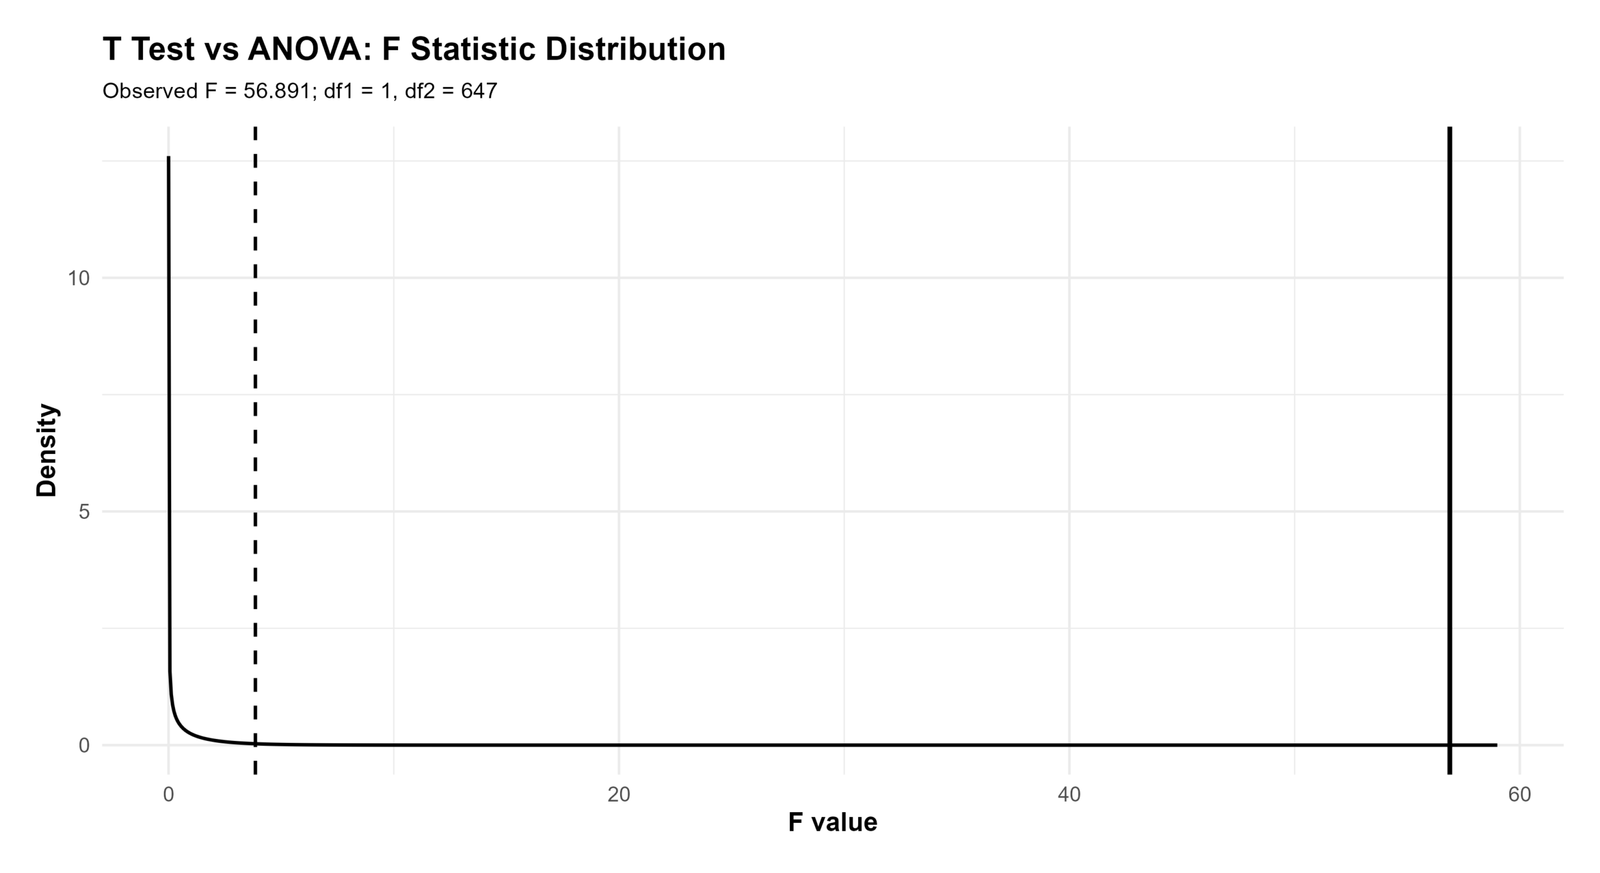
This chart shows how the ANOVA F statistic is interpreted under the F distribution.
It explains why ANOVA output uses F instead of t.
Chart 17: T Squared vs F Statistic
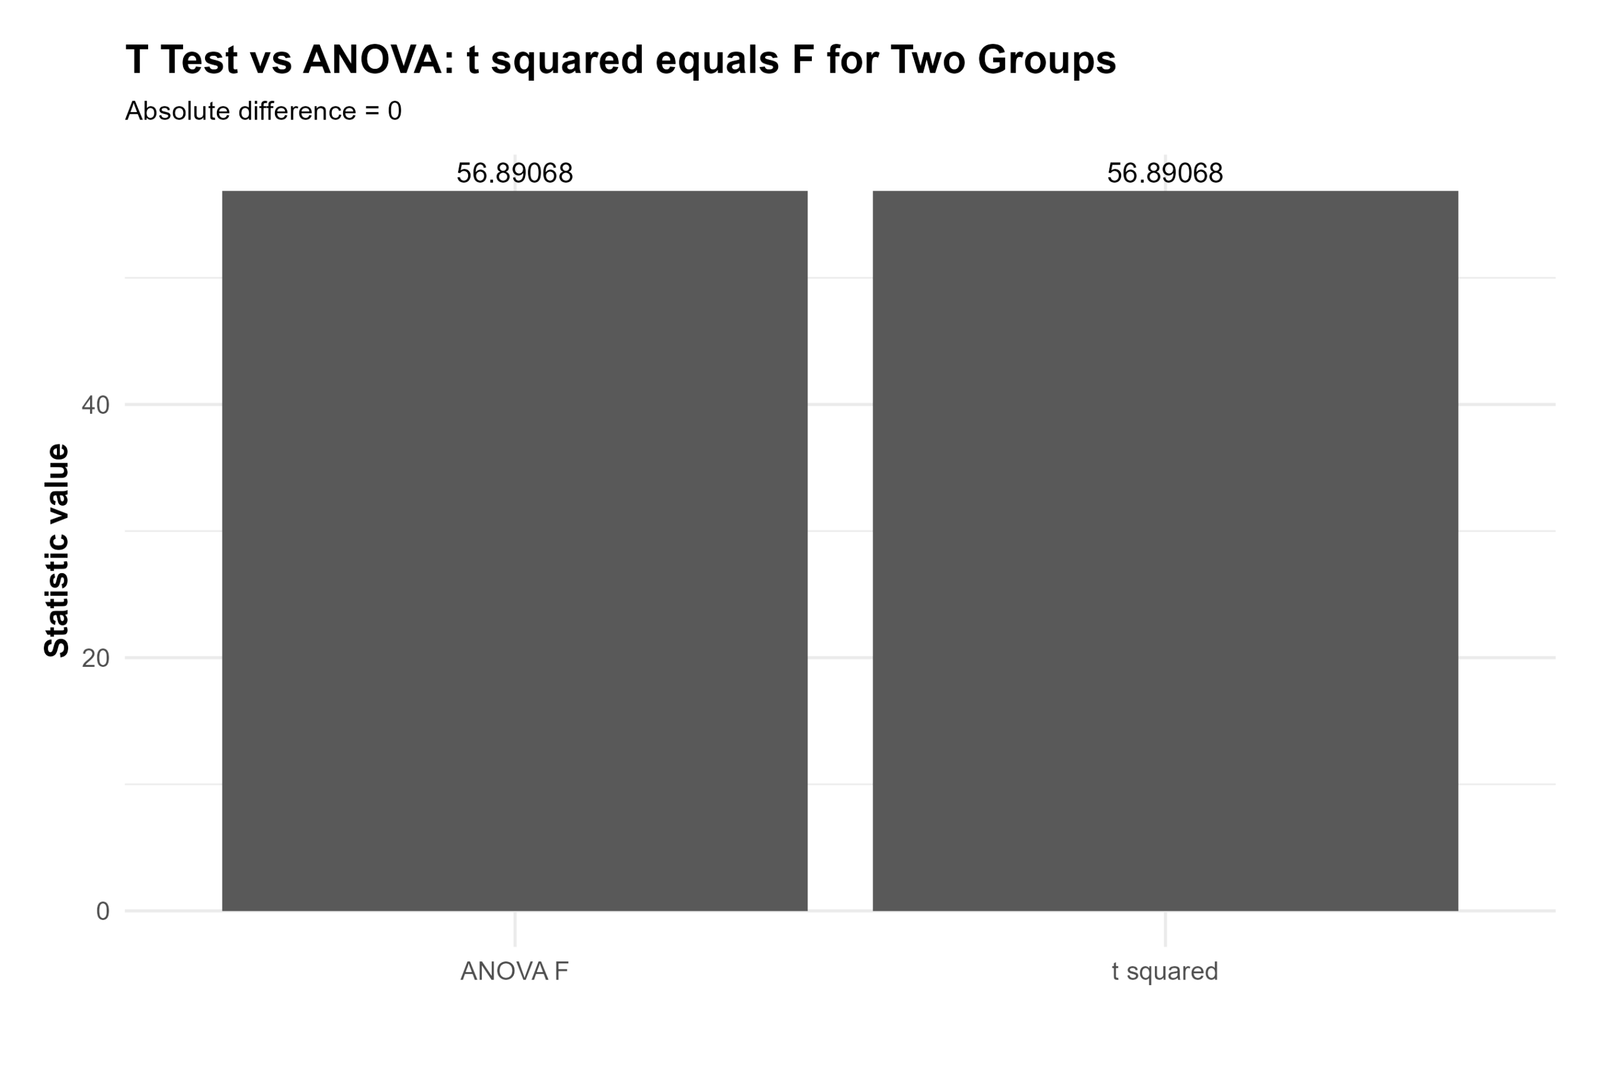
This chart reinforces the two-group equivalence. When there are exactly two groups, the ANOVA F statistic is the squared t statistic.
This is the main mathematical connection between the two methods.
Chart 18: ANOVA Between and Within Variation
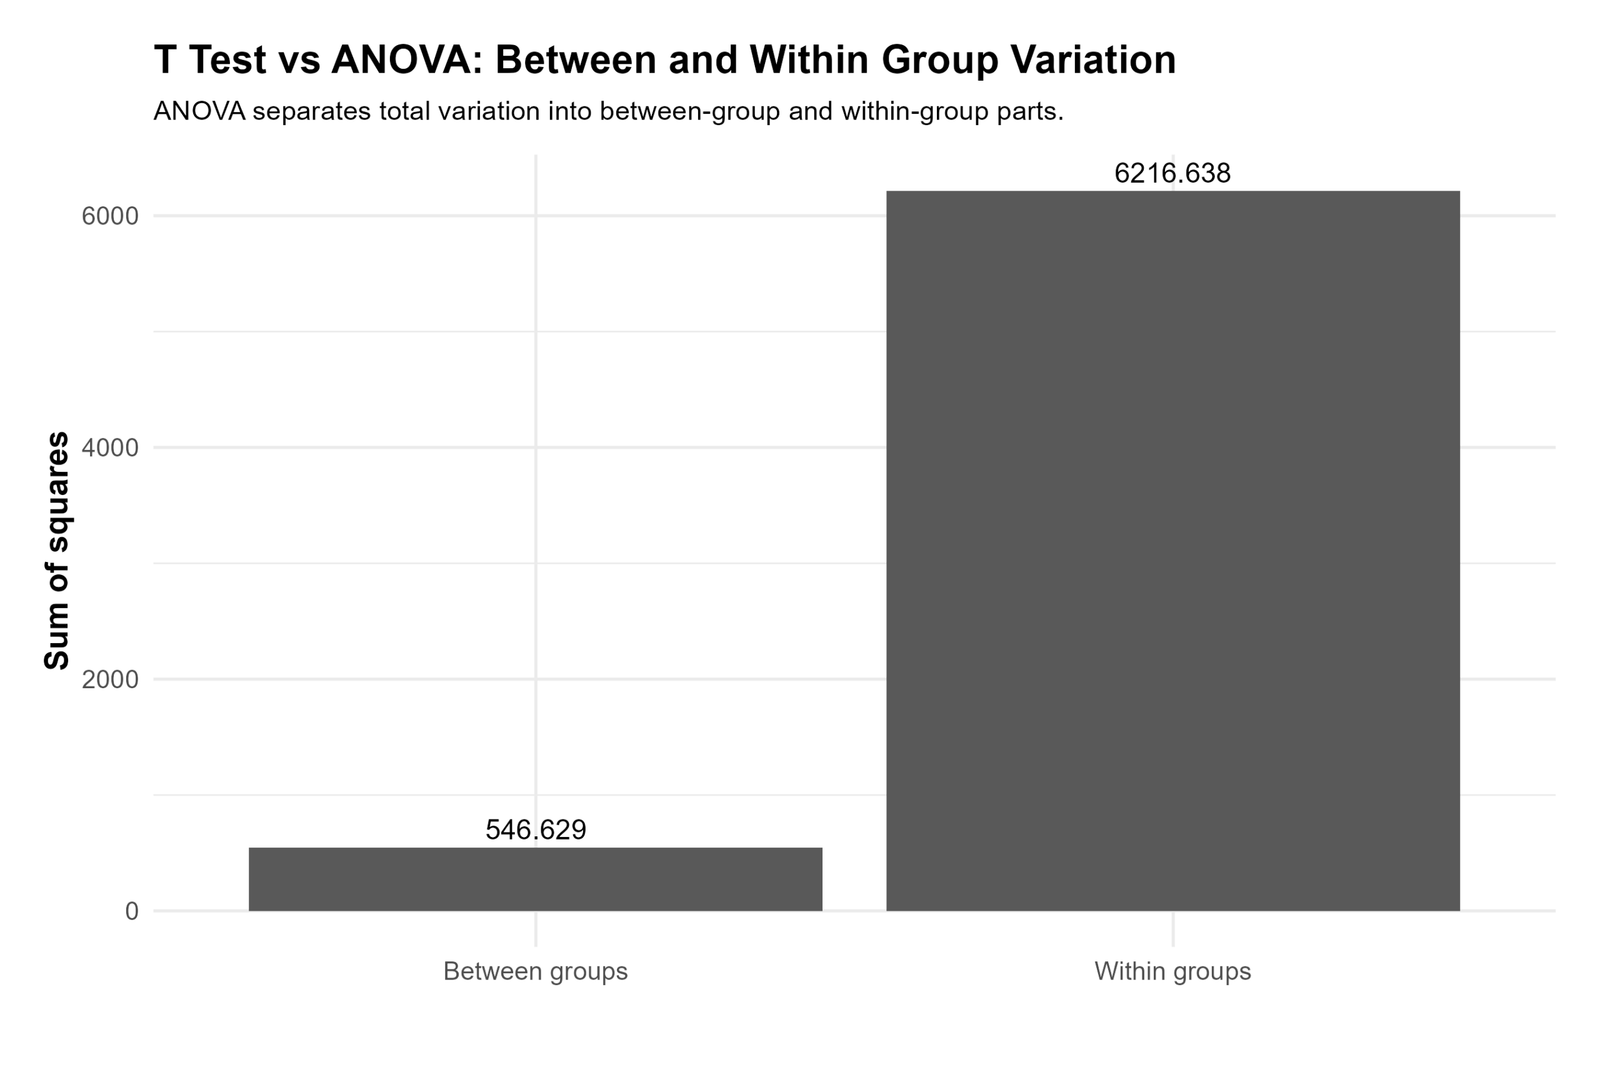
This chart explains the core ANOVA idea. ANOVA compares variation between group means with variation inside the groups.
If between-group variation is large relative to within-group variation, the F statistic becomes large.
Chart 19: T Test vs ANOVA Summary Table

This table summarizes the t-test and ANOVA comparison in a single view.
It is useful for quick revision because it shows the main differences between the two methods.
Chart 20: Group Summary Table

This table gives the descriptive statistics behind the test results. It shows sample size, mean and variability for the groups.
Always read group summaries before interpreting either a t test or ANOVA.
Chart 21: Method Equivalence Table
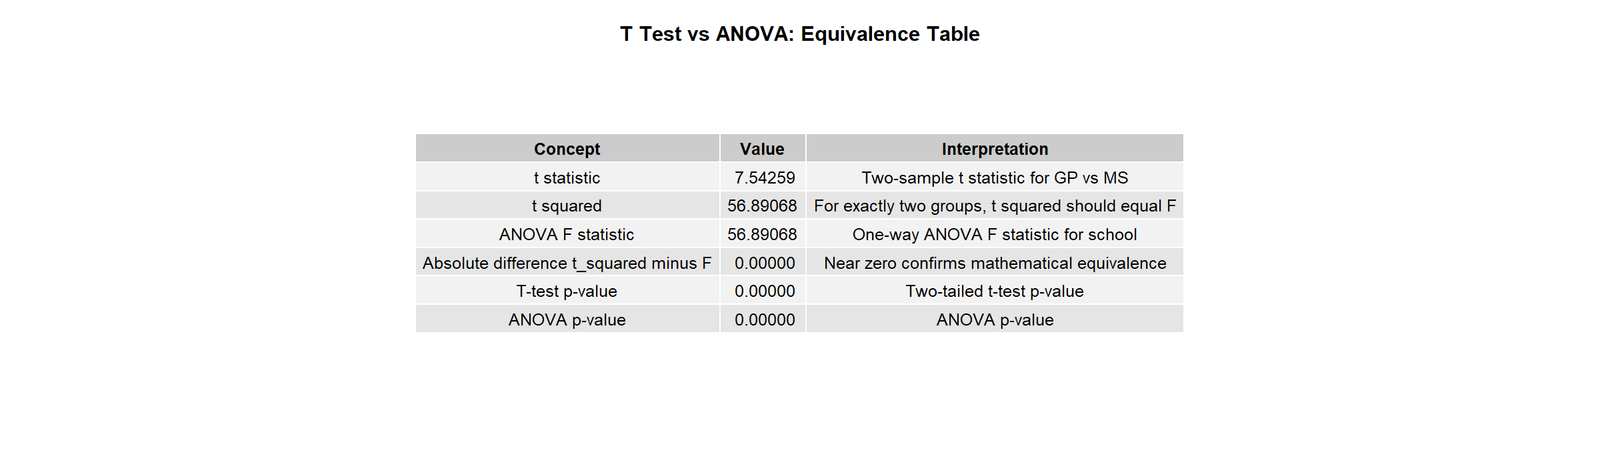
This table explains the exact condition where t test and ANOVA become equivalent: exactly two independent groups under the same equal-variance model.
The table prevents the common misunderstanding that t test and ANOVA are always different. They differ in purpose, but overlap in the two-group case.
Chart 22: Additional Group Means Output
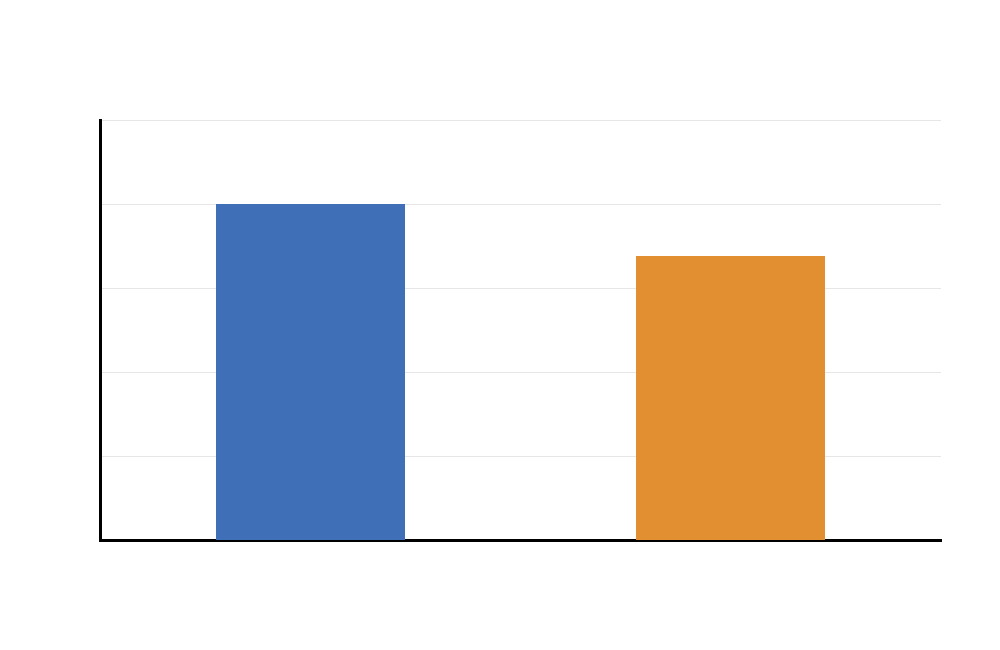
This additional group means output reinforces the difference between two-group and multi-group comparisons.
The chart preserves the complete output set and gives another view of the mean comparison.
Chart 23: Additional G3 Distribution by School
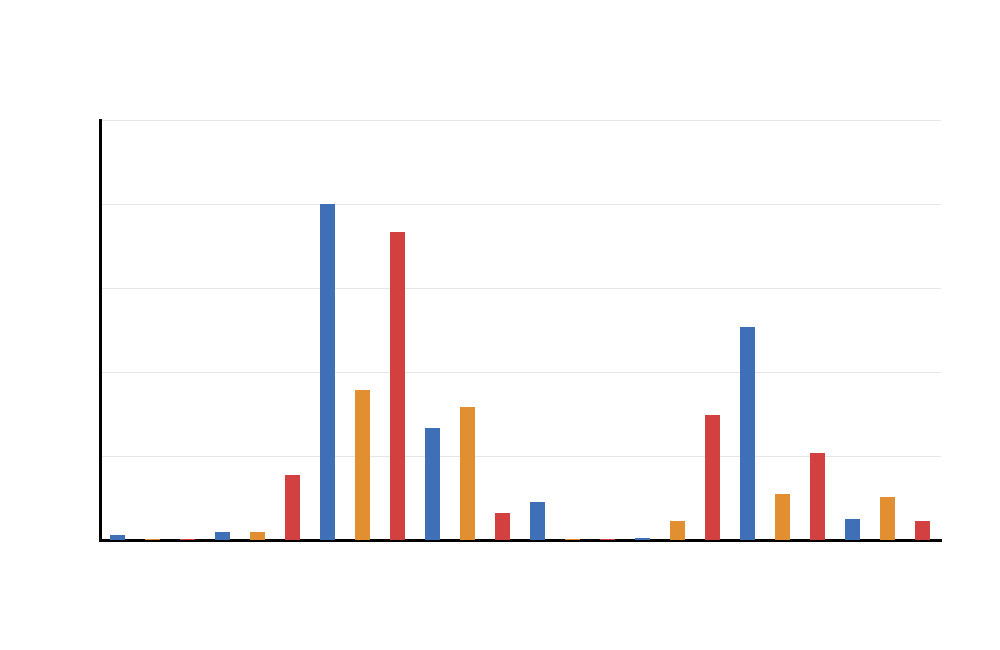
This additional distribution chart supports the t-test example by showing the two school groups separately.
It helps readers check the data pattern before relying on the test result.
Chart 24: Additional T Test Mean Difference CI
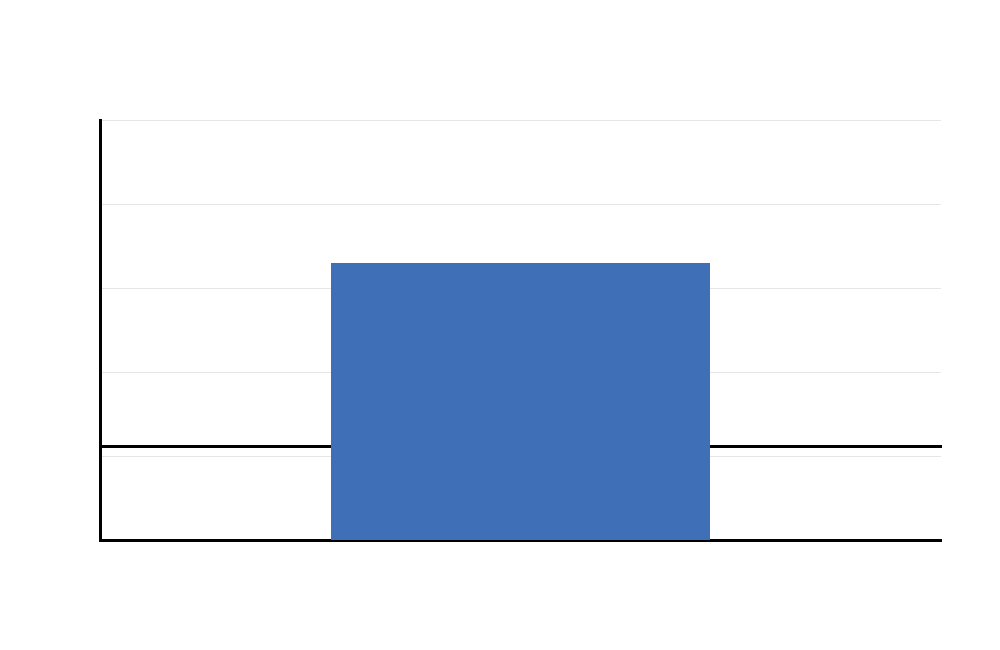
This additional confidence interval chart confirms the direction and uncertainty of the two-group t-test difference.
If the interval excludes zero, the difference is statistically significant.
Chart 25: Additional T Statistic Curve
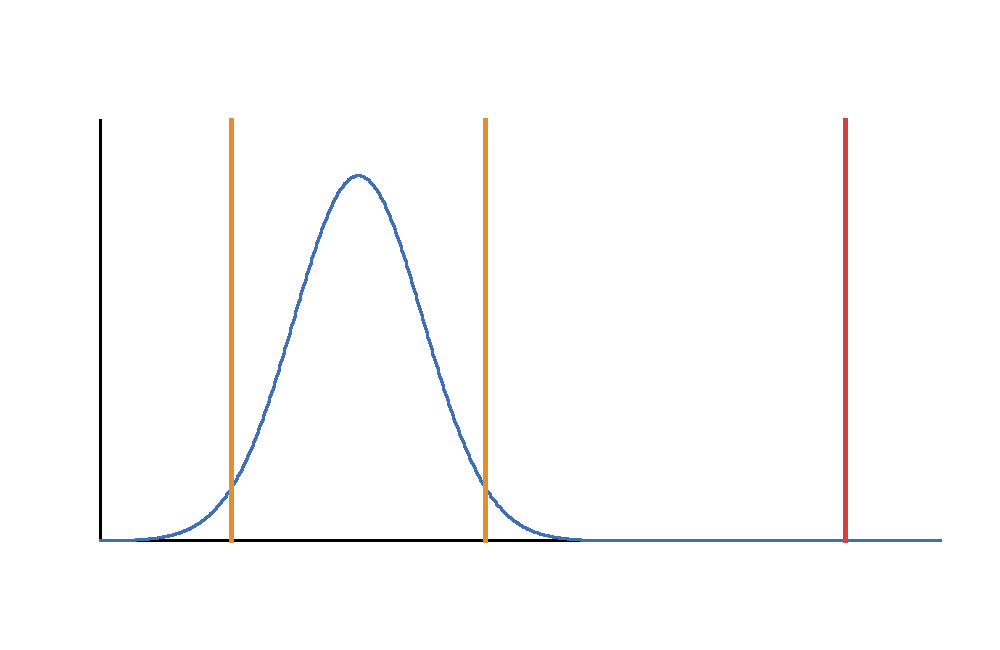
This additional t-curve output supports the t-test decision logic.
It provides another visual explanation of how the t statistic leads to a p value.
Chart 26: Additional ANOVA F Distribution Curve
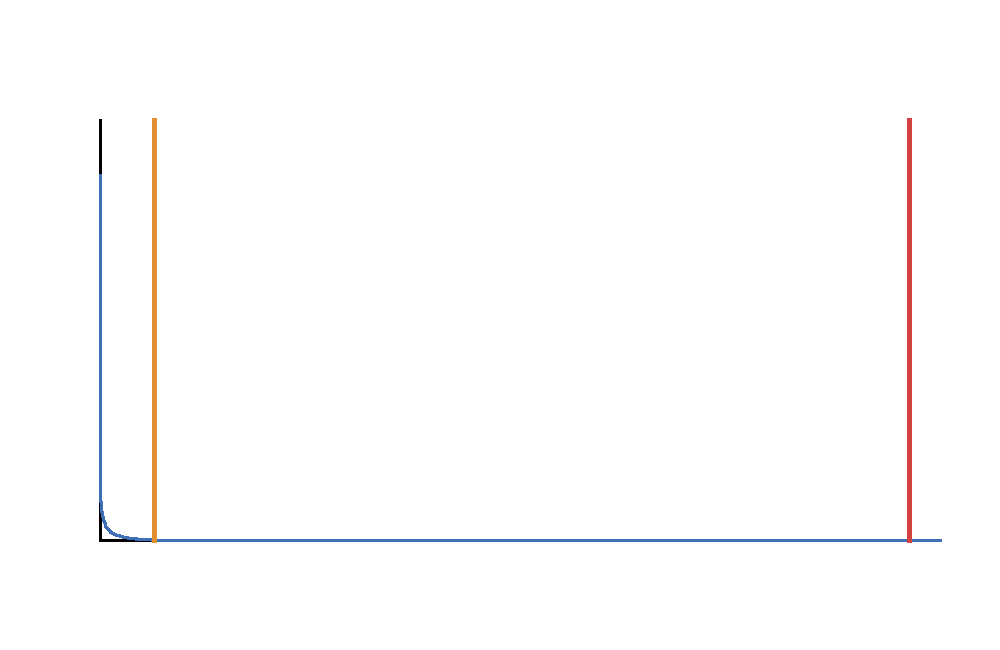
This additional F-distribution chart supports the ANOVA interpretation.
It shows that ANOVA uses a different distribution because its statistic is a ratio of variances.
Chart 27: Additional T Squared vs F Statistic
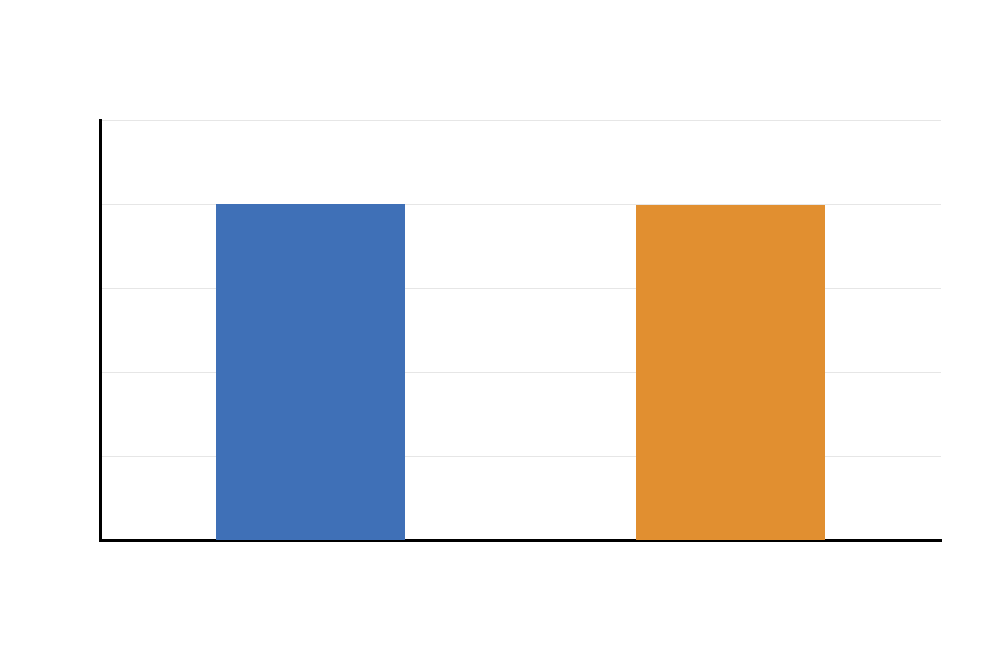
This additional chart repeats the most important equivalence rule: for exactly two groups, F = t².
This is useful for students who are confused when both methods return the same p value.
Chart 28: Additional ANOVA Between and Within Variation
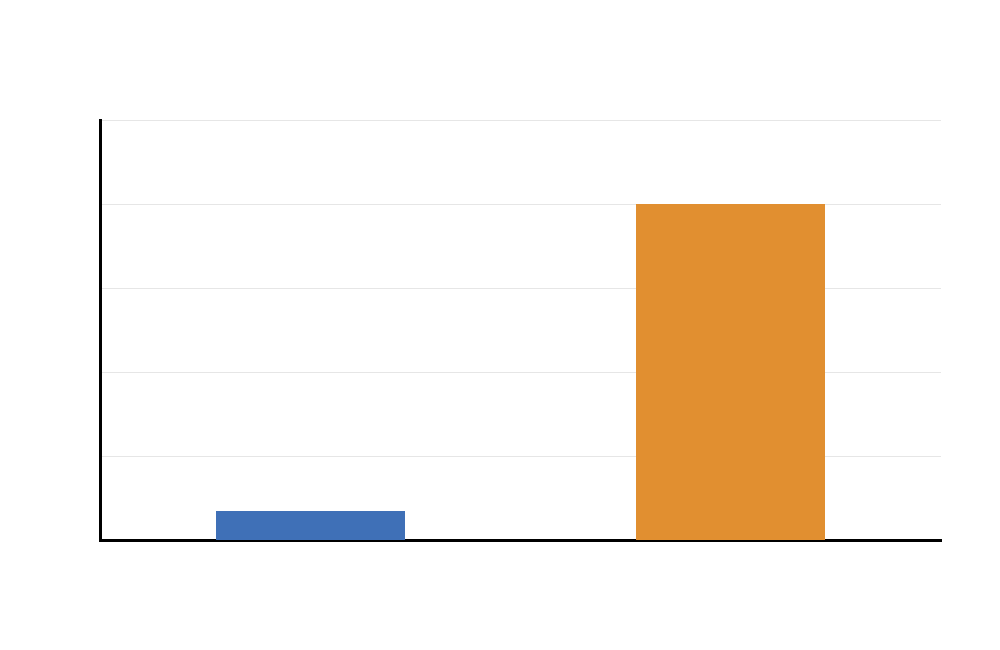
This final chart reinforces the ANOVA logic. ANOVA is not just comparing means directly; it compares between-group variation with within-group variation.
The chart completes the method comparison by showing why ANOVA is preferred when there are multiple groups.
When to Use ANOVA vs T Test
The keyword sheet includes many “when to use” queries. The best answer depends on the number of groups and the research design.
| Research Situation | Use This Method | Reason |
|---|---|---|
| One sample mean compared with a fixed value | One sample t test | There is one sample mean and one test value. |
| Two independent group means | Independent samples t test | There are exactly two unrelated groups. |
| Two paired measurements | Paired samples t test | The same cases are measured twice. |
| Three or more independent group means | One-way ANOVA | ANOVA controls the overall comparison across multiple groups. |
| Two independent groups but using ANOVA | Two-group one-way ANOVA | Equivalent to equal-variance t test because F = t². |
| Multiple groups and significant ANOVA | Post hoc test | Identifies which specific group pairs differ. |
Method choice rule: If the independent variable has two groups, use a t test. If it has three or more groups, use ANOVA. If ANOVA is significant and you need pairwise differences, use post hoc tests.
Software Workflow Notes
This guide is method-focused. The same logic applies in SPSS, R, Python and Excel. The software changes, but the decision rule stays the same: use t test for two means and ANOVA for three or more means.
| Software | T Test Command or Menu | ANOVA Command or Menu |
|---|---|---|
| SPSS | Analyze > Compare Means > Independent-Samples T Test | Analyze > Compare Means > One-Way ANOVA |
| R | t.test(G3 ~ school, data = df) | aov(G3 ~ studytime, data = df) |
| Python | stats.ttest_ind() | stats.f_oneway() |
| Excel | T.TEST() | Data Analysis ToolPak > ANOVA |
Code and Formula Blocks
R Code: T Test vs ANOVA
# T Test vs ANOVA in R

df <- read.csv("dataset.csv")

df$G3 <- as.numeric(df$G3)
df$school <- as.factor(df$school)
df$studytime <- as.factor(df$studytime)

# T test: two groups
t_result <- t.test(G3 ~ school, data = df)
print(t_result)

# ANOVA: three or more groups
anova_result <- aov(G3 ~ studytime, data = df)
summary(anova_result)

# Two-group ANOVA equivalence
anova_two_group <- aov(G3 ~ school, data = df)
summary(anova_two_group)
Python Code: T Test vs ANOVA
import pandas as pd
from scipy import stats

df = pd.read_csv("dataset.csv")
df["G3"] = pd.to_numeric(df["G3"], errors="coerce")
df = df.dropna(subset=["G3", "school", "studytime"])

# T test: two groups
gp = df.loc[df["school"] == "GP", "G3"]
ms = df.loc[df["school"] == "MS", "G3"]

t_stat, p_t = stats.ttest_ind(gp, ms, equal_var=True)

# ANOVA: studytime groups
groups = [g["G3"].dropna() for _, g in df.groupby("studytime")]
f_stat, p_f = stats.f_oneway(*groups)

print("T test statistic:", t_stat)
print("T test p value:", p_t)
print("ANOVA F statistic:", f_stat)
print("ANOVA p value:", p_f)
print("Two-group relationship if same equal-variance model: F = t^2")
Excel Formula: T Test vs ANOVA
Two-sample t test:
=T.TEST(group1_range,group2_range,2,2)

Welch t test:
=T.TEST(group1_range,group2_range,2,3)

One-way ANOVA:
Use Data > Data Analysis > ANOVA: Single Factor

Two-group equivalence:
F = t^2
SPSS Menu: T Test vs ANOVA
T test:
Analyze > Compare Means > Independent-Samples T Test

ANOVA:
Analyze > Compare Means > One-Way ANOVA

Two-group note:
If the factor has exactly two groups, one-way ANOVA and the equal-variance t test give the same p value.
APA Reporting Wording
Report the method that matches the research question. Do not write a t test report for a multi-group ANOVA question, and do not use ANOVA language when only a two-group mean difference is being interpreted.
T test report: An independent samples t test was conducted to compare G3 final grades between GP and MS students. GP students had a higher mean G3 score than MS students, and the difference was statistically significant, p < .001.
ANOVA report: A one-way ANOVA was conducted to compare mean G3 scores across studytime categories. The ANOVA tested whether at least one studytime group mean differed from the others. If the ANOVA was significant, post hoc comparisons should be used to identify the specific group differences.
Equivalence report: When the same two groups are tested under the equal-variance model, the two-group ANOVA produces the same p value as the independent samples t test because the ANOVA F statistic equals the squared t statistic.
Common Mistakes in T Test vs ANOVA
| Mistake | Why It Is Wrong | Correct Practice |
|---|---|---|
| Using many t tests for many groups | Inflates the false positive rate. | Use ANOVA first, then post hoc tests. |
| Thinking ANOVA tells which groups differ | ANOVA only says at least one mean differs. | Use post hoc tests after significant ANOVA. |
| Using ANOVA for only one mean | ANOVA is not for one sample versus a fixed value. | Use one sample t test. |
| Ignoring two-group equivalence | Two-group ANOVA and equal-variance t test match. | Remember F = t² for exactly two groups. |
| Choosing based on p value only | The correct method depends on design. | Choose based on group count and dependency structure. |
| Using independent t test for paired data | Paired data have within-subject dependency. | Use paired t test. |
When to Use T Test vs ANOVA
Use this quick guide when deciding between t test vs ANOVA.
| Question | Correct Method | Example |
|---|---|---|
| Is one sample mean different from a value? | One sample t test | Mean G3 vs 10 |
| Are two independent group means different? | Independent samples t test | GP vs MS |
| Are two paired means different? | Paired samples t test | G1 vs G3 for same students |
| Are three or more group means different? | One-way ANOVA | G3 across studytime groups |
| Are there exactly two groups but ANOVA was used? | Two-group ANOVA equals equal-variance t test | F = t² |
Downloads and Resources
Use these resources to reproduce the T Test vs ANOVA workflow. Replace placeholder links with final hosted file URLs after uploading your scripts, syntax files, outputs and workbook templates.
Download T Test vs ANOVA Dataset
Practice dataset with G3, school and studytime variables.
Download R Script
R code for t test, ANOVA and two-group equivalence.
Download Python Script
Python code for t test, ANOVA, p value comparison and charts.
Download SPSS Syntax
SPSS syntax for independent samples t test and one-way ANOVA.
FAQs About T Test vs ANOVA
What is the difference between t test and ANOVA?
A t test usually compares one or two means. ANOVA compares three or more group means. With exactly two groups, one-way ANOVA and the equal-variance t test give the same significance decision.
When should I use ANOVA vs t test?
Use a t test for two means and ANOVA for three or more means. Use paired t test for related measurements and one-way ANOVA for one factor with multiple groups.
When should I use t test vs ANOVA?
Use a t test when the comparison involves two groups, such as GP versus MS. Use ANOVA when the comparison involves three or more groups, such as several studytime levels.
Is ANOVA the same as t test?
Not always. They are different methods for different group structures. However, when ANOVA has exactly two groups and the same equal-variance model is used, ANOVA gives the same p value as the independent samples t test because F = t².
Can I use t test instead of ANOVA?
You can use a t test when there are only two groups. If there are three or more groups, use ANOVA first instead of running many separate t tests.
What does F = t squared mean?
It means that for exactly two independent groups under the same equal-variance model, the ANOVA F statistic equals the squared t statistic from the independent samples t test.
Does ANOVA tell which group is different?
No. A significant ANOVA tells that at least one group mean differs. To find which groups differ, use post hoc tests.

