
Regression Specification, Omitted Nonlinearity, Fitted Power Terms and Model Diagnostics
Ramsey RESET Test: Formula, Interpretation, SPSS, Python, R and Excel Guide
Ramsey RESET Test is a regression specification test used to detect whether a linear regression model may be missing important nonlinear patterns, omitted variables, interaction terms, or incorrect functional form. It does this by adding powers of the fitted values, such as fitted squared and fitted cubed terms, to the original model and testing whether those extra terms improve model fit. This guide explains the Ramsey RESET Test with SPSS output, Python charts, R validation charts, Excel workflow, fitted power terms, F-test decision, APA reporting, common mistakes, downloadable resources, and related assumption checks.
Quick Answer: Ramsey RESET Test Result
The Ramsey RESET Test checks whether the original regression model is correctly specified. The null hypothesis says the model has no major functional-form misspecification detected by fitted-value power terms. The alternative hypothesis says the model may be misspecified because the added fitted squared, fitted cubed, or higher-order fitted terms significantly improve prediction.
In this worked example, the model predicts G3 final grade using student-performance predictors such as prior grades and study-related variables. The Ramsey RESET Test is used after the basic regression model to ask a deeper diagnostic question: does the linear model capture the main structure, or are important nonlinear terms missing? The observed-versus-fitted chart, residuals-versus-fitted chart, fitted power terms chart, model fit comparison chart, RESET F reference curve, p-value decision chart, and RESET power-sensitivity chart are all used to support the decision.
Final interpretation: Use the Ramsey RESET Test as a model-specification warning system. If the RESET p-value is significant, the current linear model may be missing nonlinear structure, omitted variables, interactions, or incorrect functional form. If the RESET p-value is not significant, the test does not find evidence of those fitted-power misspecification patterns, although other diagnostics should still be checked.
Important: A significant Ramsey RESET Test does not tell exactly which variable is wrong. It only says the model may be misspecified. The next step is to inspect residual plots, consider nonlinear terms, add theoretically meaningful predictors, check interactions, and compare improved models.
Table of Contents
- What Is the Ramsey RESET Test?
- Ramsey RESET Test Formula
- Null and Alternative Hypotheses
- Dataset and Regression Variables Used
- SPSS Output Interpretation
- Python Chart-by-Chart Interpretation
- R Chart-by-Chart Validation
- SPSS, R, Python and Excel Workflows
- Code Blocks for Ramsey RESET Test
- APA Reporting Wording
- Common Mistakes
- When to Use Ramsey RESET Test
- Downloads and Resources
- Related Guides
- FAQs
What Is the Ramsey RESET Test?
Ramsey RESET Test, often called the Regression Equation Specification Error Test, is a diagnostic test for linear regression model specification. It asks whether the model may be missing nonlinear relationships or important terms. A regression model can have a high R-squared and still be misspecified if it leaves out nonlinear structure or uses the wrong functional form.
The test works by fitting the original regression model, saving the fitted values, then adding powers of those fitted values into an augmented model. If the added fitted power terms are statistically significant, the test suggests that the original model may be incomplete or misspecified.
Simple definition: The Ramsey RESET Test checks whether adding fitted-value powers, such as ŷ² and ŷ³, improves the regression model. If they improve the model significantly, the original model may have a specification problem.
The Ramsey RESET Test belongs in a broader regression-diagnostics workflow. It should be interpreted together with residual plots, observed-versus-fitted values, normality checks, heteroscedasticity checks, multicollinearity checks, outlier diagnostics, and theory-based model review. Useful related guides include Goldfeld-Quandt test, Q-Q plot normality check, P-P plot normality check, Levene test, and Brown-Forsythe test.
Ramsey RESET Test Formula
The original linear regression model can be written as:
After fitting this model, the predicted values are saved as ŷ. The Ramsey RESET Test then estimates an augmented model by adding fitted power terms:
The RESET decision tests whether the fitted power terms are jointly significant. If they are jointly significant, the original model may be missing nonlinear or omitted-variable structure.
| Term | Meaning | Role in RESET Test |
|---|---|---|
| y | Dependent variable | The outcome being predicted, such as G3 final grade. |
| X | Original predictors | The predictors included in the original regression model. |
| ŷ | Fitted value | The predicted value from the original model. |
| ŷ² | Squared fitted value | Checks for omitted nonlinear structure. |
| ŷ³ | Cubed fitted value | Checks for additional functional-form misspecification. |
| F test | Joint test of fitted power terms | Decides whether the extra terms significantly improve fit. |
Ramsey RESET F-Test Decision
If the RESET F-test is significant, the augmented model fits significantly better than the original model. This suggests possible omitted nonlinear terms, interactions, missing predictors, or incorrect functional form. If the test is not significant, the RESET test does not detect this type of misspecification.
Null and Alternative Hypotheses for Ramsey RESET Test
The Ramsey RESET Test has a clear hypothesis structure. The null hypothesis says the original regression model is adequately specified with respect to the fitted-power terms tested. The alternative hypothesis says the fitted power terms improve the model, suggesting misspecification.
| Hypothesis | Statement | Meaning for Regression Reporting |
|---|---|---|
| Null hypothesis | H0: γ2 = γ3 = … = 0 | The added fitted power terms do not significantly improve the model. |
| Alternative hypothesis | H1: At least one γ term is not zero | The model may have omitted nonlinear structure or incorrect functional form. |
| Decision rule | Reject H0 if p < .05 | A significant RESET result warns of possible model misspecification. |
Interpretation rule: If the RESET p-value is significant, do not simply write “the model is wrong.” Write that the RESET test indicates possible specification error and that follow-up checks are needed. The test detects a problem pattern, but it does not identify the exact missing variable or correct model form.
Dataset and Regression Variables Used
The worked example uses a student performance regression model. The dependent variable is G3 final grade. Predictors may include earlier grades and student-background variables such as G1, G2, studytime, failures, absences and age. The Ramsey RESET Test checks whether the linear specification is adequate or whether fitted-value powers improve the model.
| Variable or Term | Role | Why It Matters for Ramsey RESET Test |
|---|---|---|
| G3 | Dependent variable | The final grade outcome predicted by the regression model. |
| G1 and G2 | Main academic predictors | Prior grades often strongly predict final grade and form the baseline model. |
| studytime | Behavior predictor | May contribute linearly or interact with prior performance. |
| failures | Academic-history predictor | May require nonlinear or group-specific interpretation. |
| absences | Count predictor | May have skewness and nonlinear relation with grades. |
| age | Background predictor | Can be included as a control variable. |
| ŷ² and ŷ³ | RESET fitted power terms | Used to detect possible functional-form misspecification. |
Before running the Ramsey RESET Test, review the model with descriptive statistics, frequency distribution, histogram interpretation, box plot interpretation, and coefficient of variation.
SPSS Output Interpretation for Ramsey RESET Test
The SPSS output PDF verifies the Ramsey RESET Test workflow. In SPSS, the RESET workflow is usually completed by fitting the original regression model, saving fitted values, computing fitted-value powers, fitting the augmented model, and comparing model fit. The RESET decision is based on whether the added fitted power terms significantly improve the model.
SPSS Ramsey RESET Workflow Table
| SPSS Step | Output to Check | How to Interpret |
|---|---|---|
| Original regression model | Model Summary, ANOVA, Coefficients | Confirms the baseline model predicting G3 from the original predictors. |
| Save fitted values | Predicted values variable | Creates the fitted value used to generate fitted power terms. |
| Compute fitted powers | ŷ² and ŷ³ variables | Creates extra terms used to test functional-form misspecification. |
| Augmented regression model | Model Summary and Coefficients with fitted powers | Checks whether fitted powers explain additional variance. |
| Model comparison | Change in R², F-change, or joint test | Determines whether added fitted power terms significantly improve fit. |
| RESET decision | p-value | p < .05 suggests possible model misspecification. |
SPSS Interpretation Logic
If the fitted power terms are significant in the augmented model, the SPSS interpretation should state that the original model may be misspecified. This does not automatically prove a specific omitted variable, but it does indicate that the linear specification may be incomplete. If the fitted power terms are not significant, the RESET test does not provide evidence of this type of misspecification.
SPSS conclusion template: The Ramsey RESET workflow compared the original regression model with an augmented model containing fitted-value power terms. The p-value for the added terms was used to decide whether model misspecification was detected. A significant result indicates possible omitted nonlinear structure or incorrect functional form.
How SPSS Output Connects with the Charts
The charts below explain the SPSS result visually. Observed-versus-fitted values show prediction alignment. Residuals-versus-fitted values show patterns not captured by the model. Fitted power terms show the variables added by RESET. Model fit comparison shows whether the augmented model improves fit. The RESET F reference curve and p-value chart summarize the formal decision. Power sensitivity shows how the test behaves when different fitted power terms are considered.
Python Chart-by-Chart Interpretation
The Python charts provide the main visual explanation of the Ramsey RESET Test. They show the original model fit, residual structure, fitted power terms, model fit comparison, RESET F-test reference curve, p-value decision and sensitivity to fitted power choices.
Python Chart 1: Observed vs Fitted Values
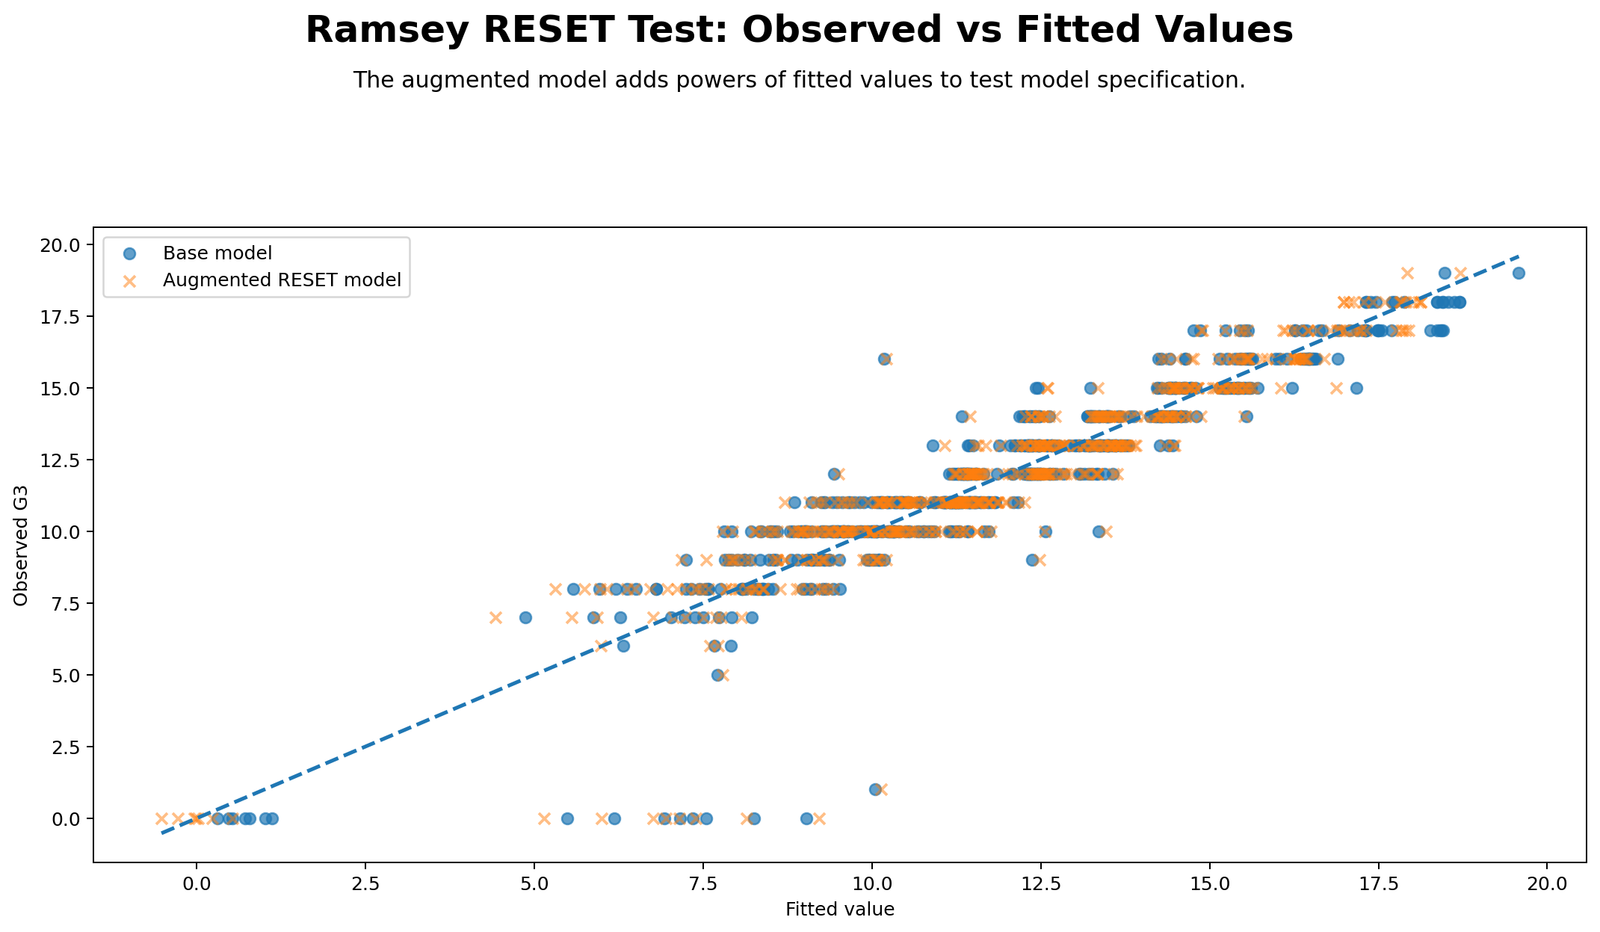
This chart checks how closely the original regression model predicts the observed outcome. If points follow the diagonal reference pattern closely, the fitted values are aligned with observed values. If there is curvature, systematic spread, or large deviations, the model may not capture the full relationship.
For the Ramsey RESET Test, observed-versus-fitted alignment is the first visual clue. A model can fit well overall but still miss nonlinear patterns. Therefore, this chart should be interpreted with residuals-versus-fitted and fitted power terms rather than alone.
Python Chart 2: Residuals vs Fitted Values
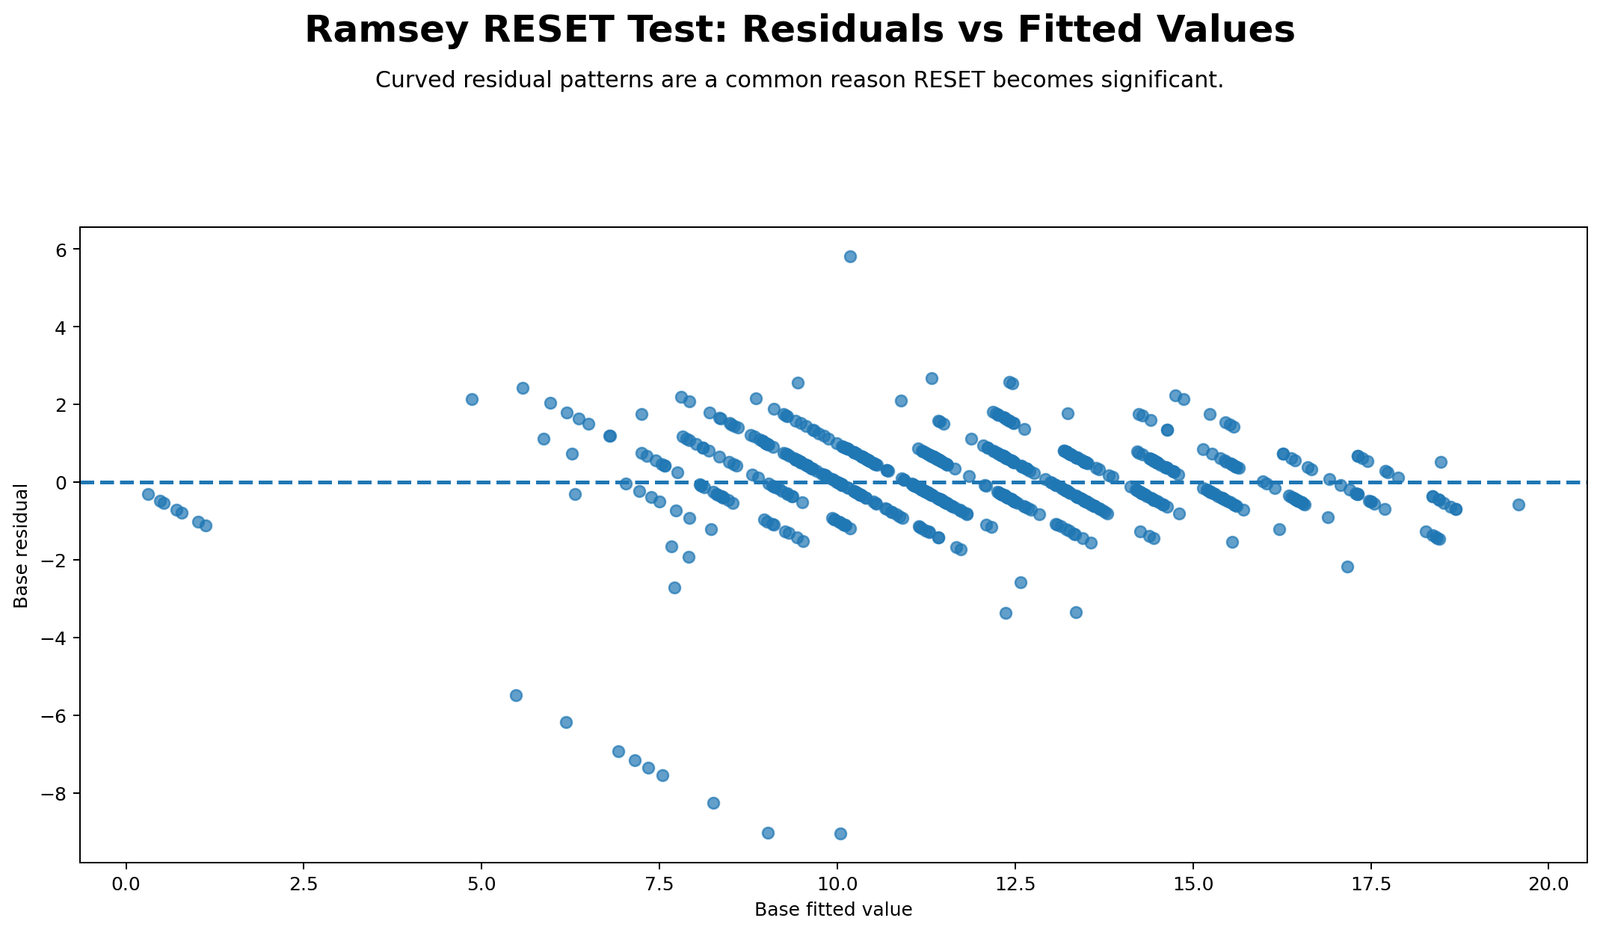
This chart is one of the most important diagnostics for the Ramsey RESET Test. Residuals should be scattered randomly around zero. Curves, waves, funnels, or systematic patterns suggest that the model may be missing nonlinear terms, interactions, or other structure.
If the residuals show a clear pattern, the RESET test may become significant because fitted squared or cubed terms can capture some of the missing structure. If the residual pattern is random, the RESET test is less likely to detect misspecification.
Python Chart 3: Fitted Power Terms
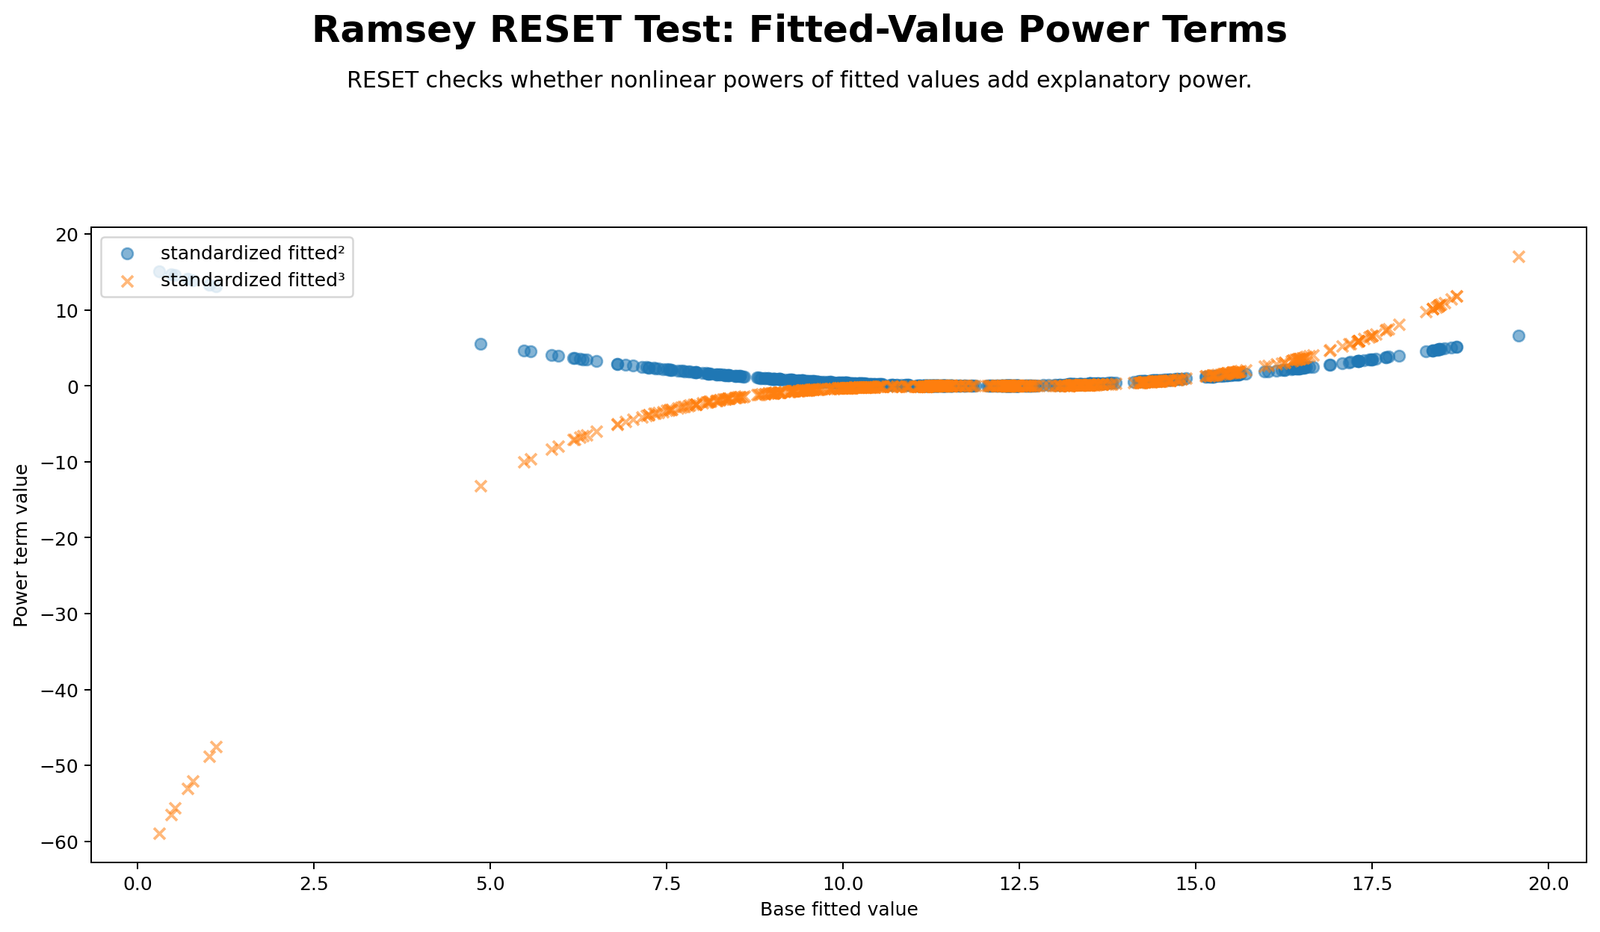
This chart explains the mechanics of the Ramsey RESET Test. The original fitted values are transformed into powers such as fitted squared and fitted cubed. These power terms are added to the model to test whether they explain additional variation in the outcome.
If fitted power terms add meaningful explanatory power, the model may be missing nonlinear structure. The chart helps readers understand that RESET is not a vague model-checking tool; it specifically tests whether powers of fitted values reveal patterns that the original model failed to capture.
Python Chart 4: Model Fit Comparison
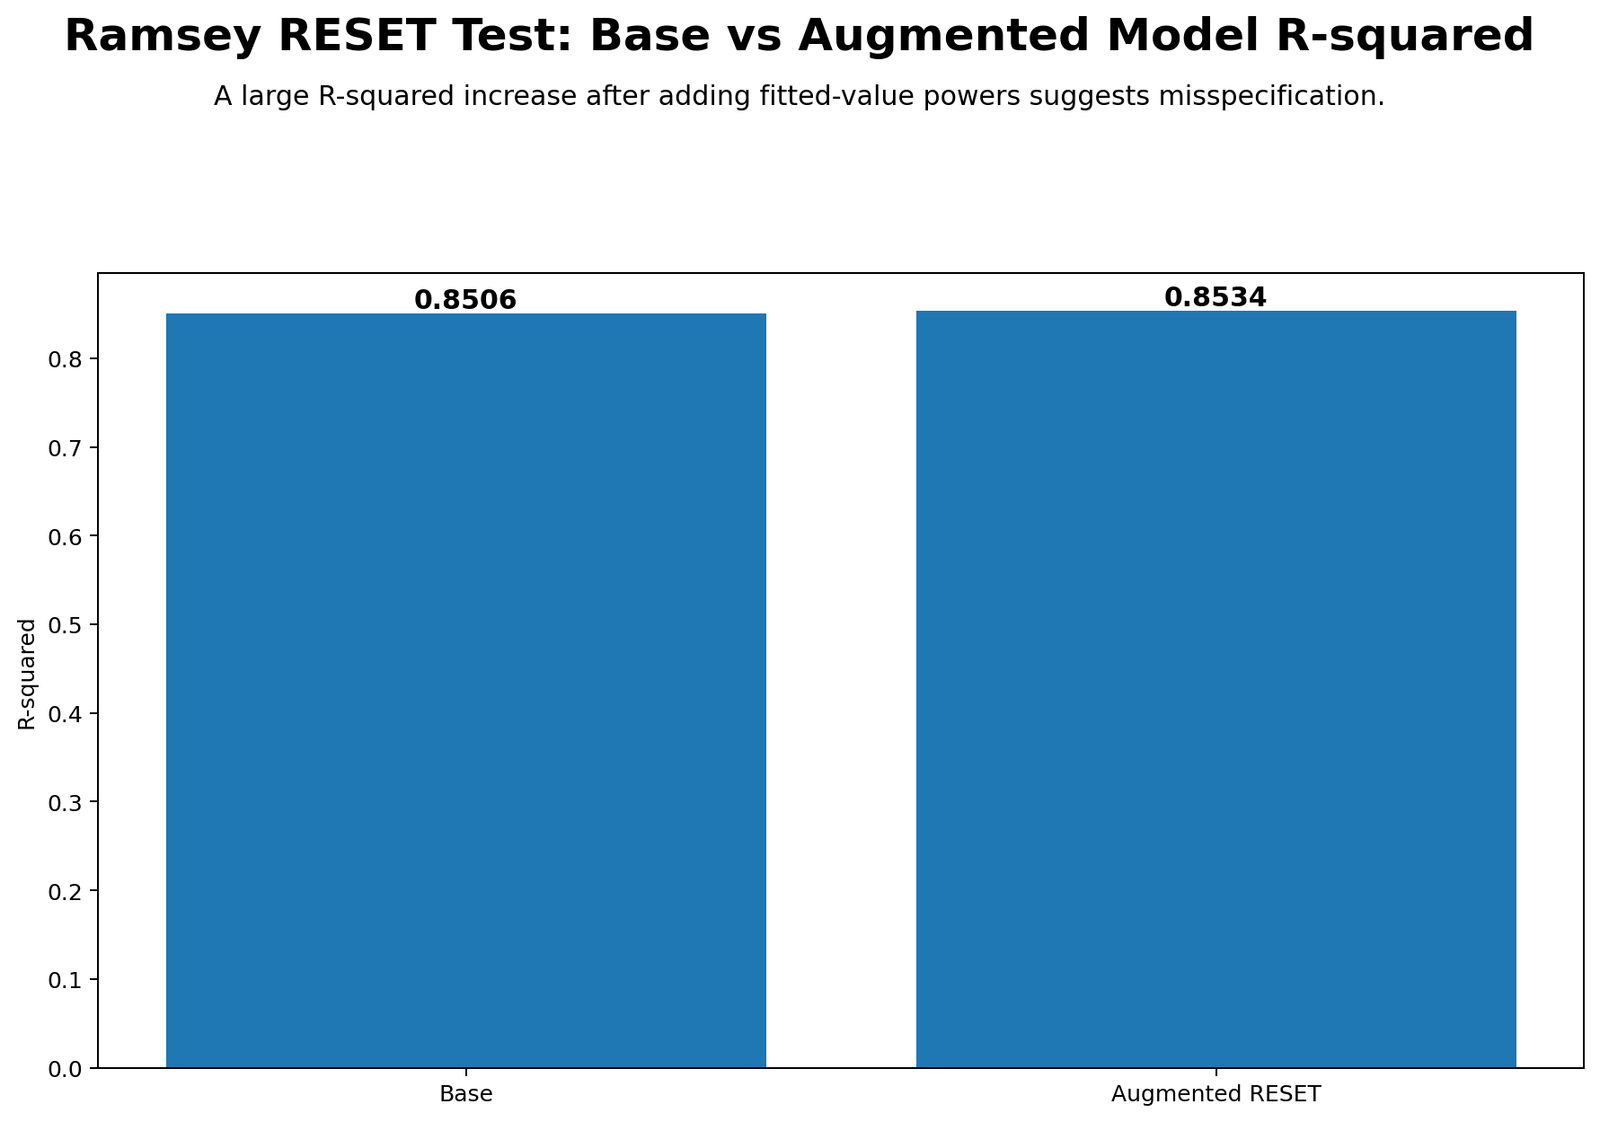
This chart compares model fit before and after adding the RESET fitted power terms. If the augmented model improves fit noticeably and the improvement is statistically significant, the RESET decision supports possible misspecification in the original model.
The correct interpretation is not that the fitted powers should always become the final model. Instead, they are diagnostic indicators. A significant improvement means the analyst should consider better theory-based nonlinear terms, transformations, interactions, or omitted variables.
Python Chart 5: RESET F Reference Curve
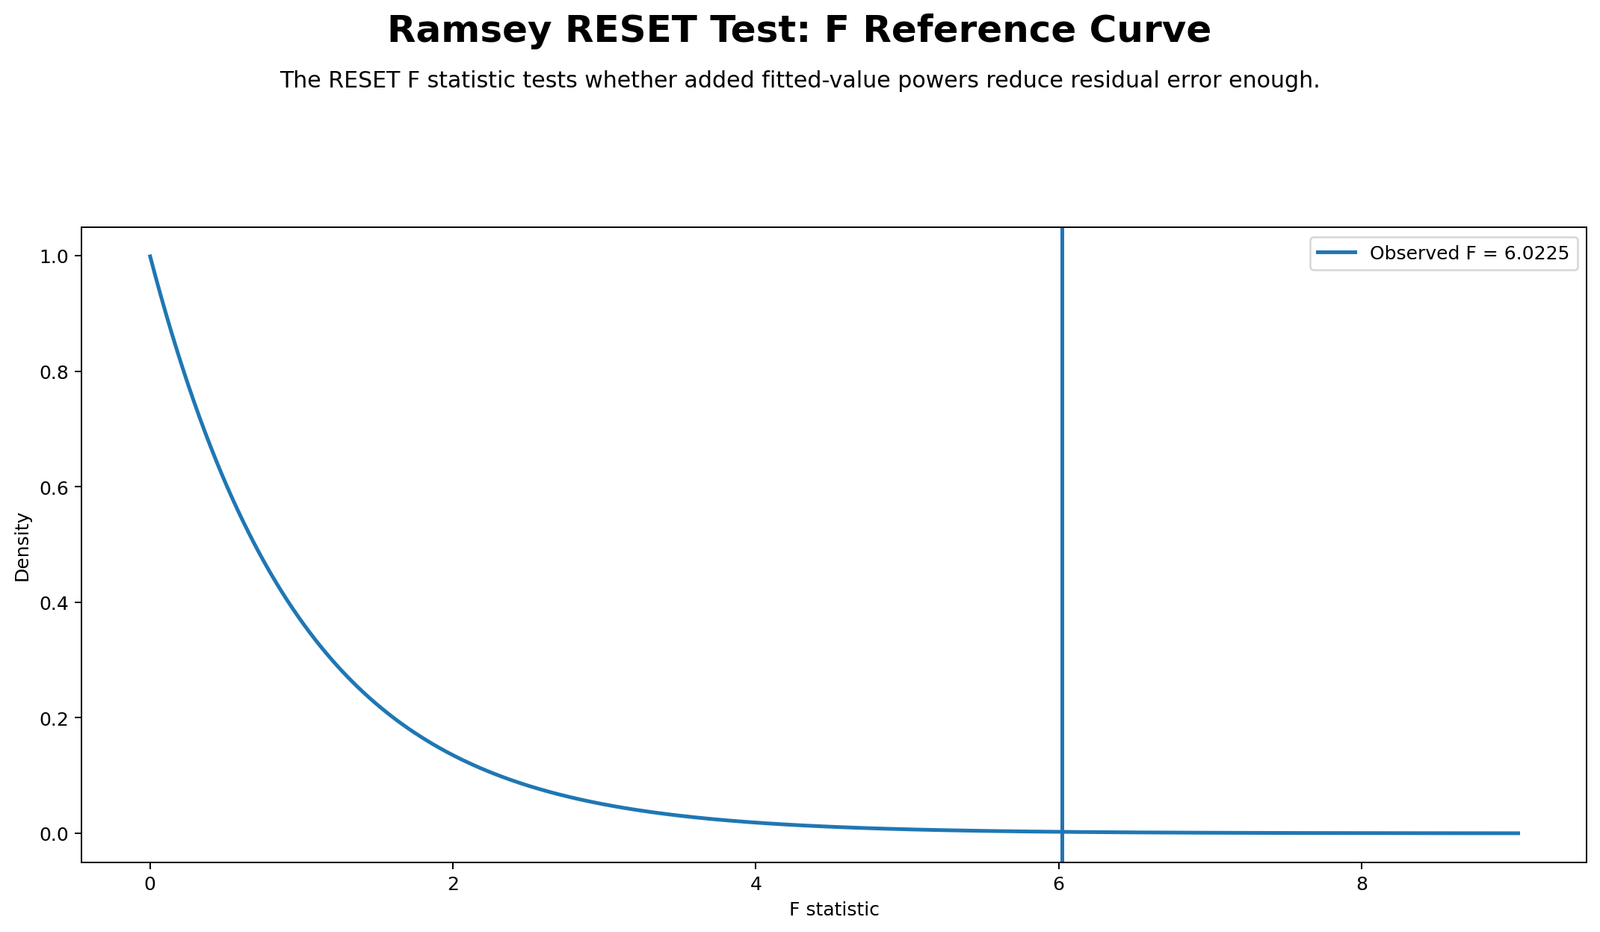
This chart explains the formal F-test decision. The RESET F statistic is compared with the reference F distribution. If the observed F statistic falls far into the upper tail, the p-value becomes small, and the test rejects the null hypothesis of correct specification.
The F reference curve helps readers understand that the RESET decision is a formal statistical comparison, not only a visual judgment. It shows where the observed statistic lies relative to what would be expected if the added fitted power terms did not matter.
Python Chart 6: P-value Decision
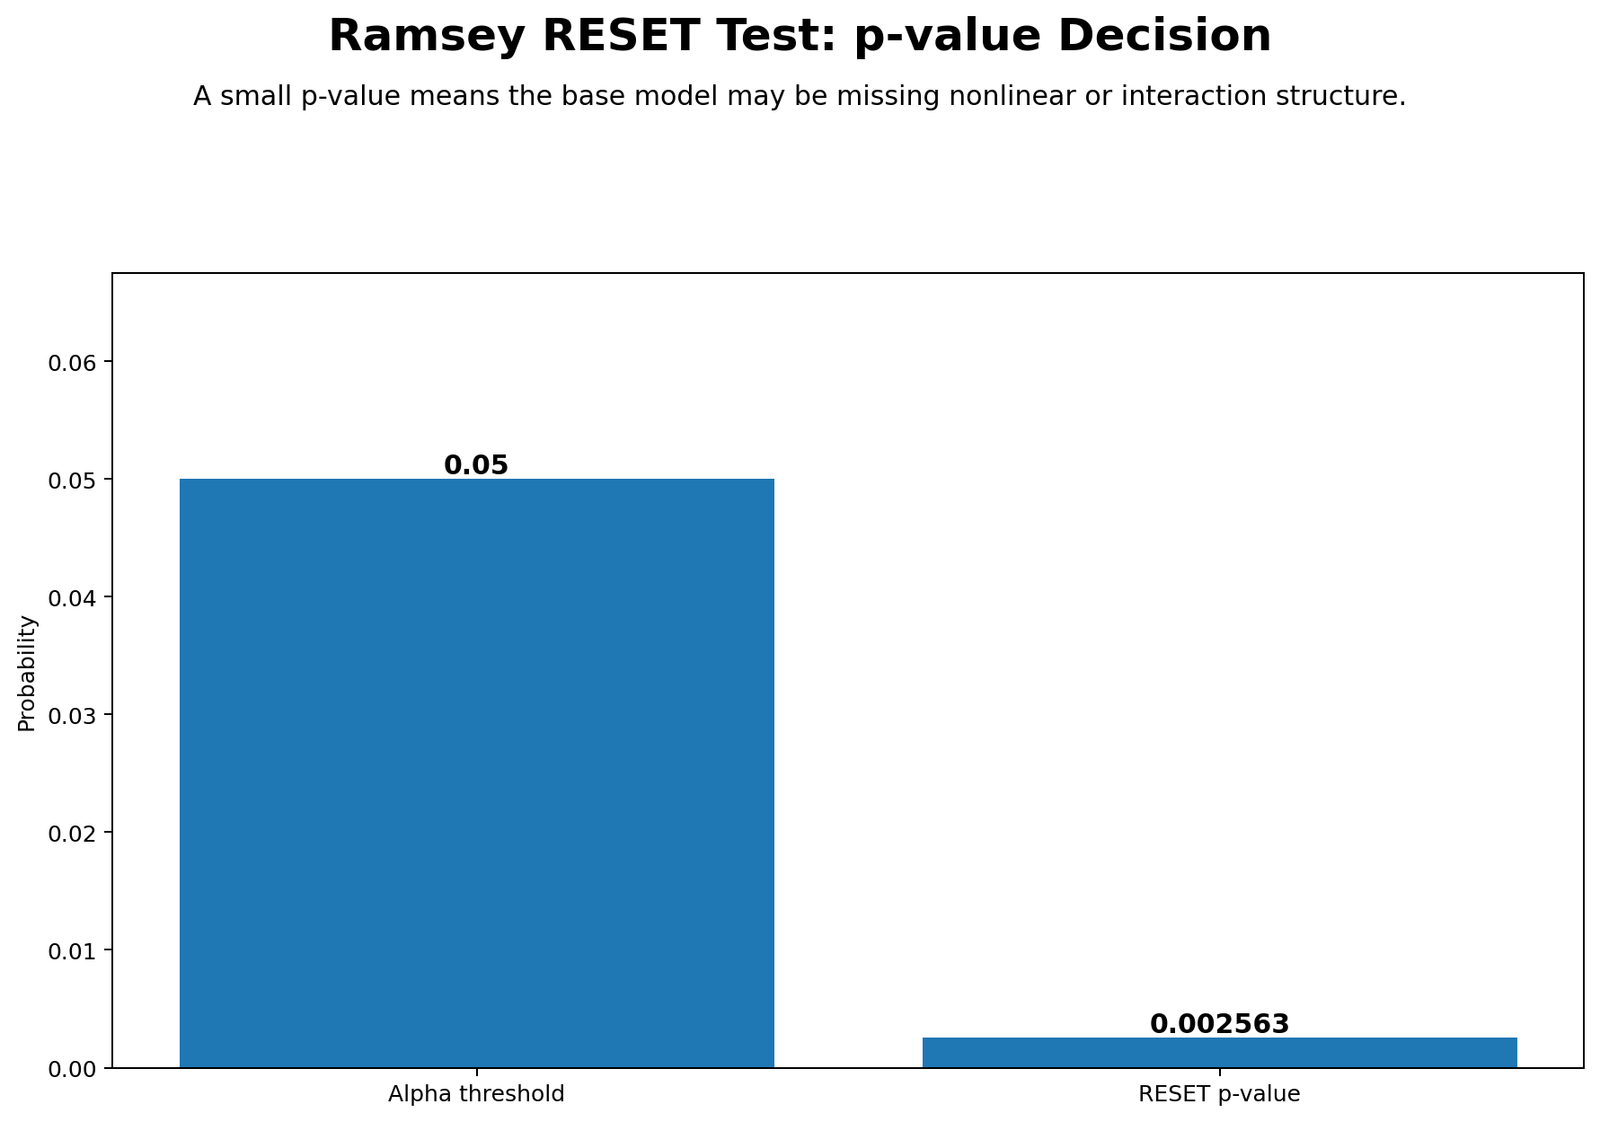
This chart summarizes the decision rule. If the p-value is less than .05, reject the null hypothesis that the original model is adequately specified under the fitted-power diagnostic. If the p-value is greater than .05, the RESET test does not find evidence of specification error through the tested fitted powers.
The p-value decision should always be reported with the visual charts. A significant p-value tells the analyst that follow-up work is needed, but the residual plots and model comparison help explain what type of follow-up may be useful.
Python Chart 7: RESET Power Sensitivity
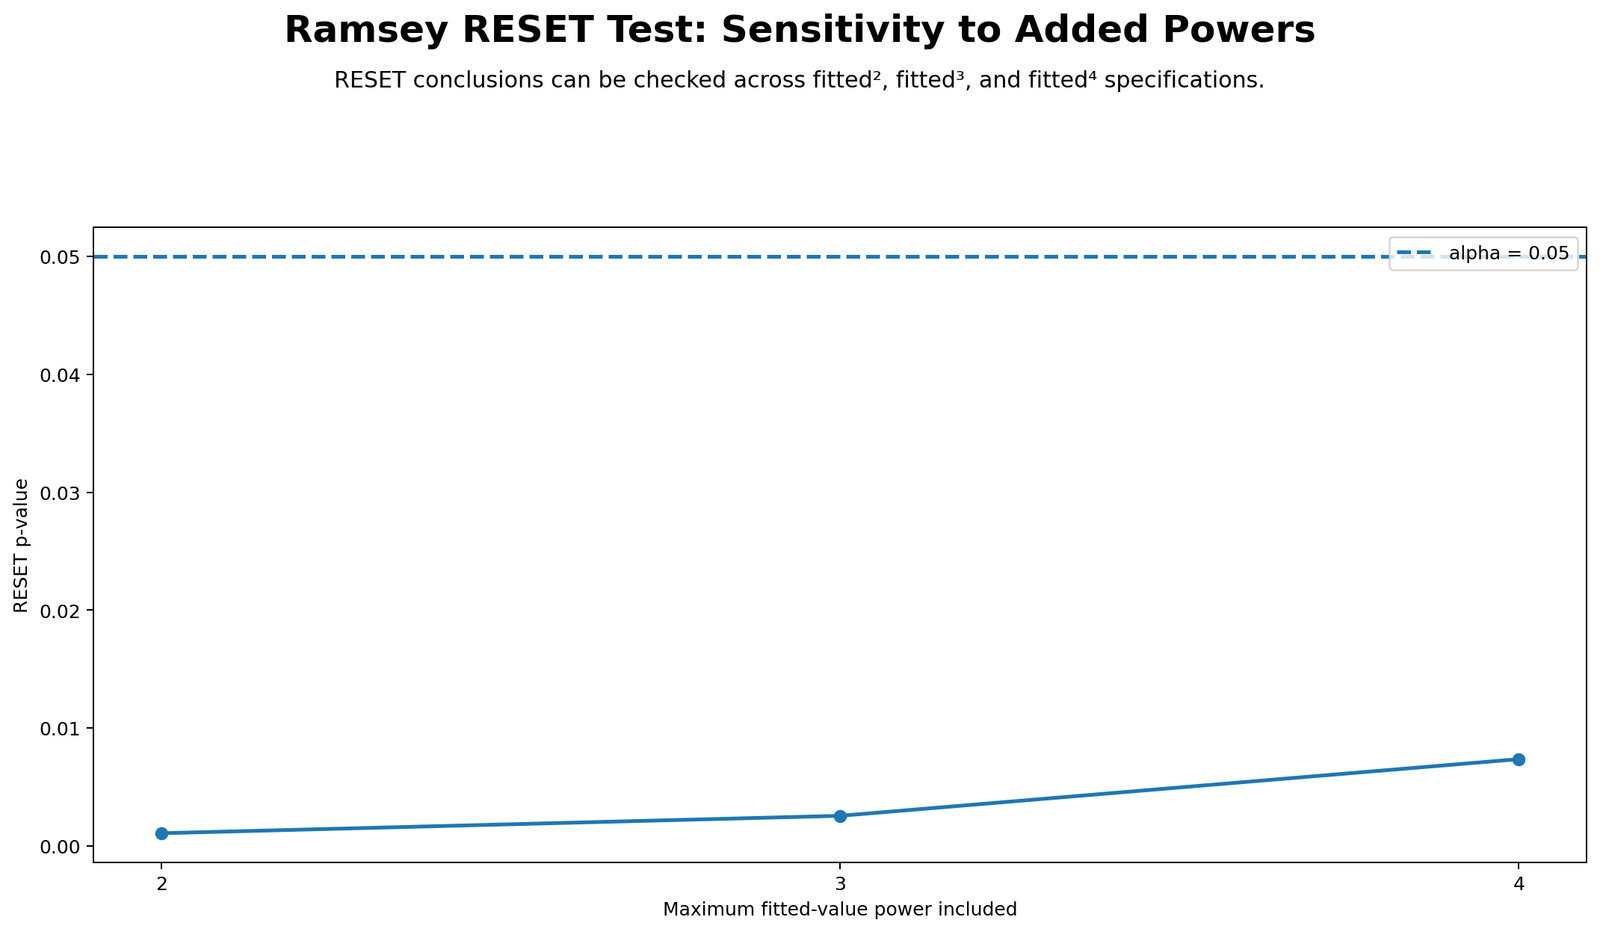
This chart shows the sensitivity of the RESET result to the fitted power terms included in the augmented model. A test that includes only fitted squared values may behave differently from a test that includes squared and cubed fitted values. Sensitivity analysis helps determine whether the misspecification signal is stable or dependent on one chosen power term.
If the RESET decision remains significant across several power settings, the evidence of misspecification is stronger. If the result changes depending on the power choice, the analyst should interpret the result more cautiously and inspect the residual plots carefully.
R Chart-by-Chart Validation
The R charts validate the Python and SPSS Ramsey RESET Test interpretation using a separate workflow. The same seven diagnostic views appear again: observed versus fitted values, residuals versus fitted values, fitted power terms, model fit comparison, RESET F reference curve, p-value decision and RESET power sensitivity.
R Chart 1: Observed vs Fitted Values
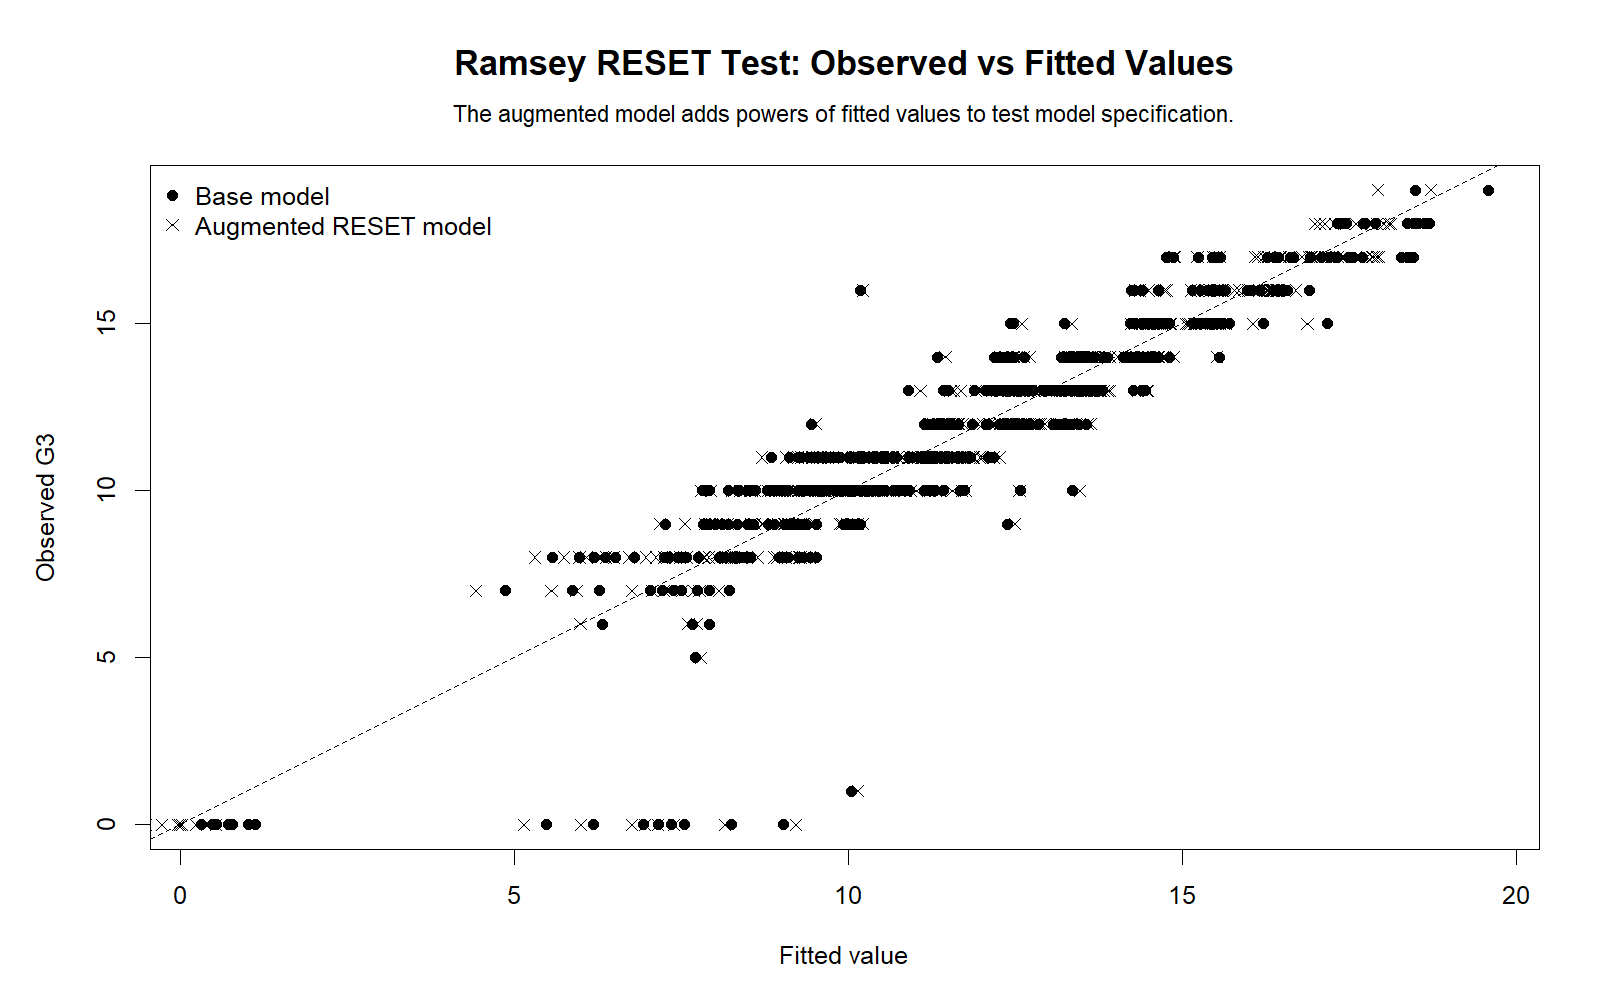
The R observed-versus-fitted chart validates the Python model-fit view. It shows whether fitted values track observed G3 values reasonably well and whether there are visible prediction patterns that may require further diagnostic review.
R Chart 2: Residuals vs Fitted Values
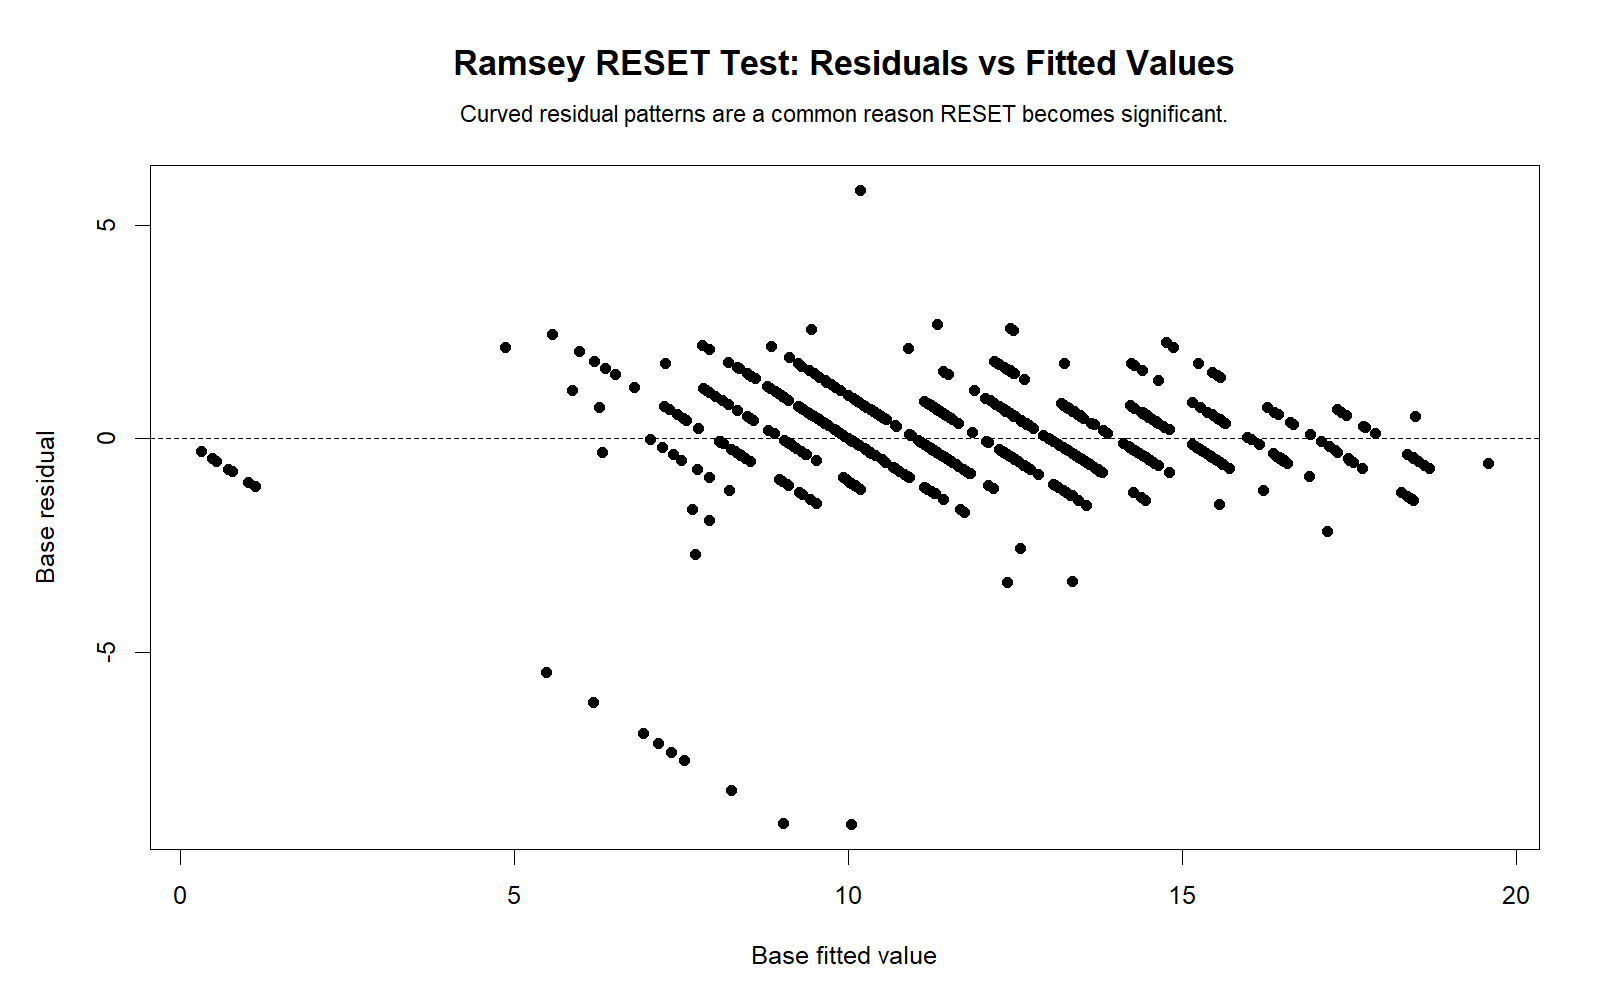
The R residual plot confirms whether residual patterns are random or systematic. A random cloud supports the linear specification. A curve or structured pattern suggests that the model may be missing nonlinear or omitted terms, which is exactly the type of issue the Ramsey RESET Test is designed to detect.
R Chart 3: Fitted Power Terms
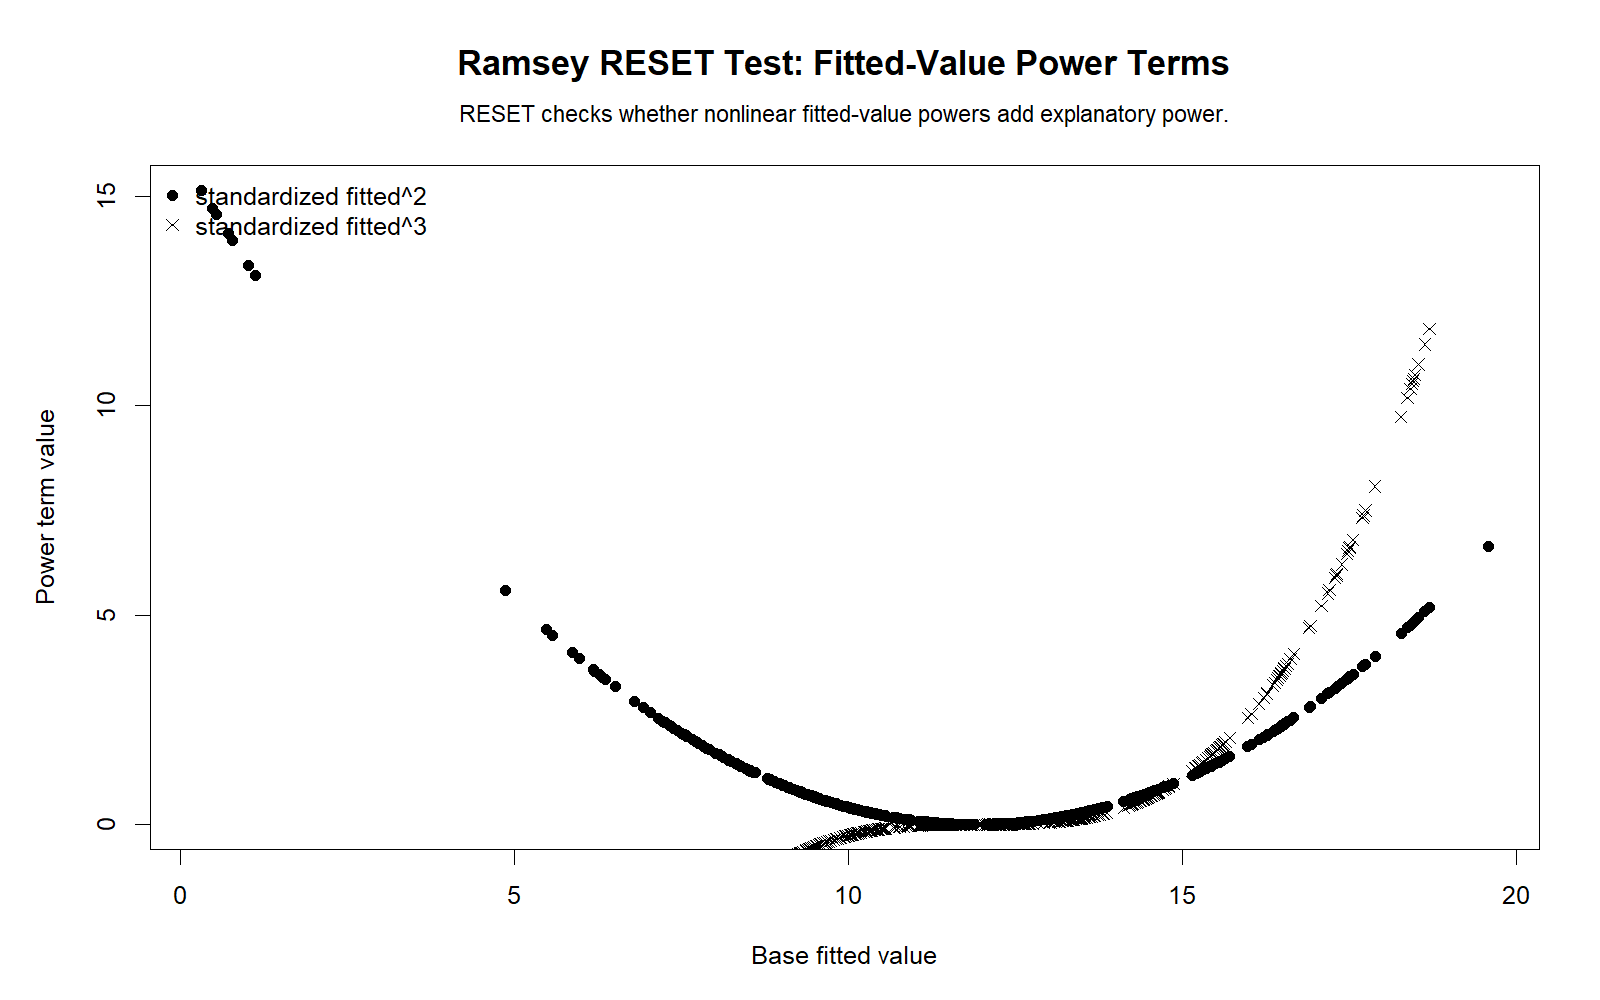
The R fitted-power chart validates how the augmented model is built. It confirms that the RESET test adds functions of the fitted values rather than randomly adding unrelated terms. This helps readers understand the test logic clearly.
R Chart 4: Model Fit Comparison
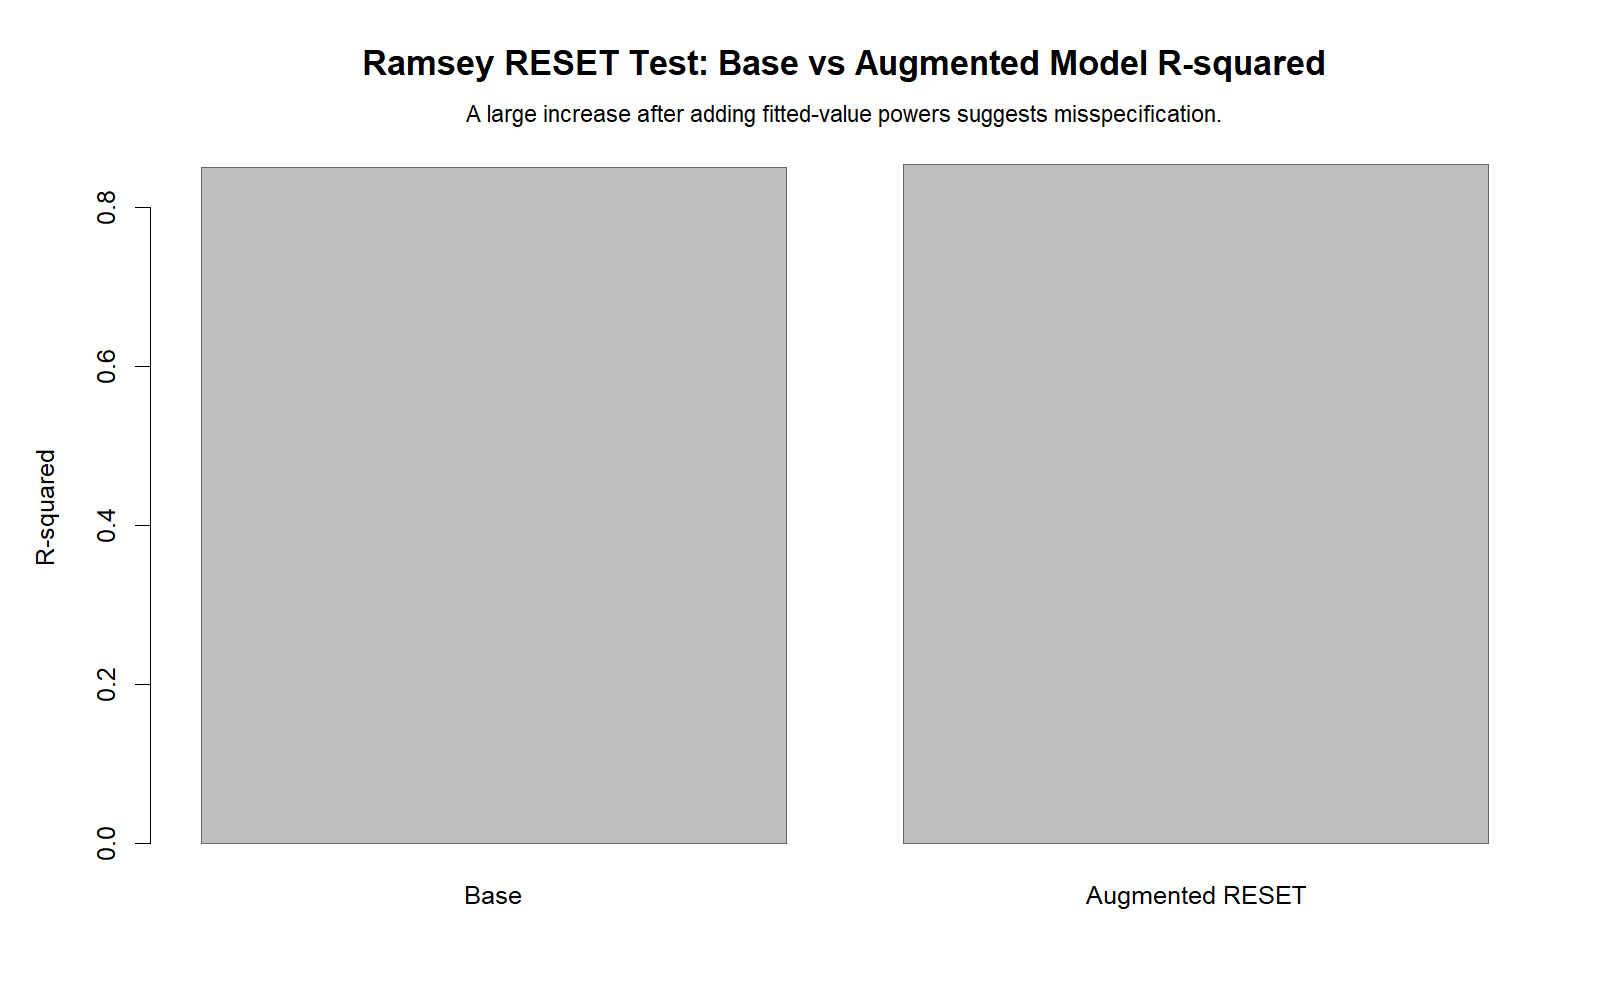
The R model fit comparison confirms whether adding fitted power terms improves fit. If the augmented model improves fit only slightly and the p-value is not significant, specification may be acceptable under this test. If improvement is clear and significant, the original model requires follow-up.
R Chart 5: RESET F Reference Curve
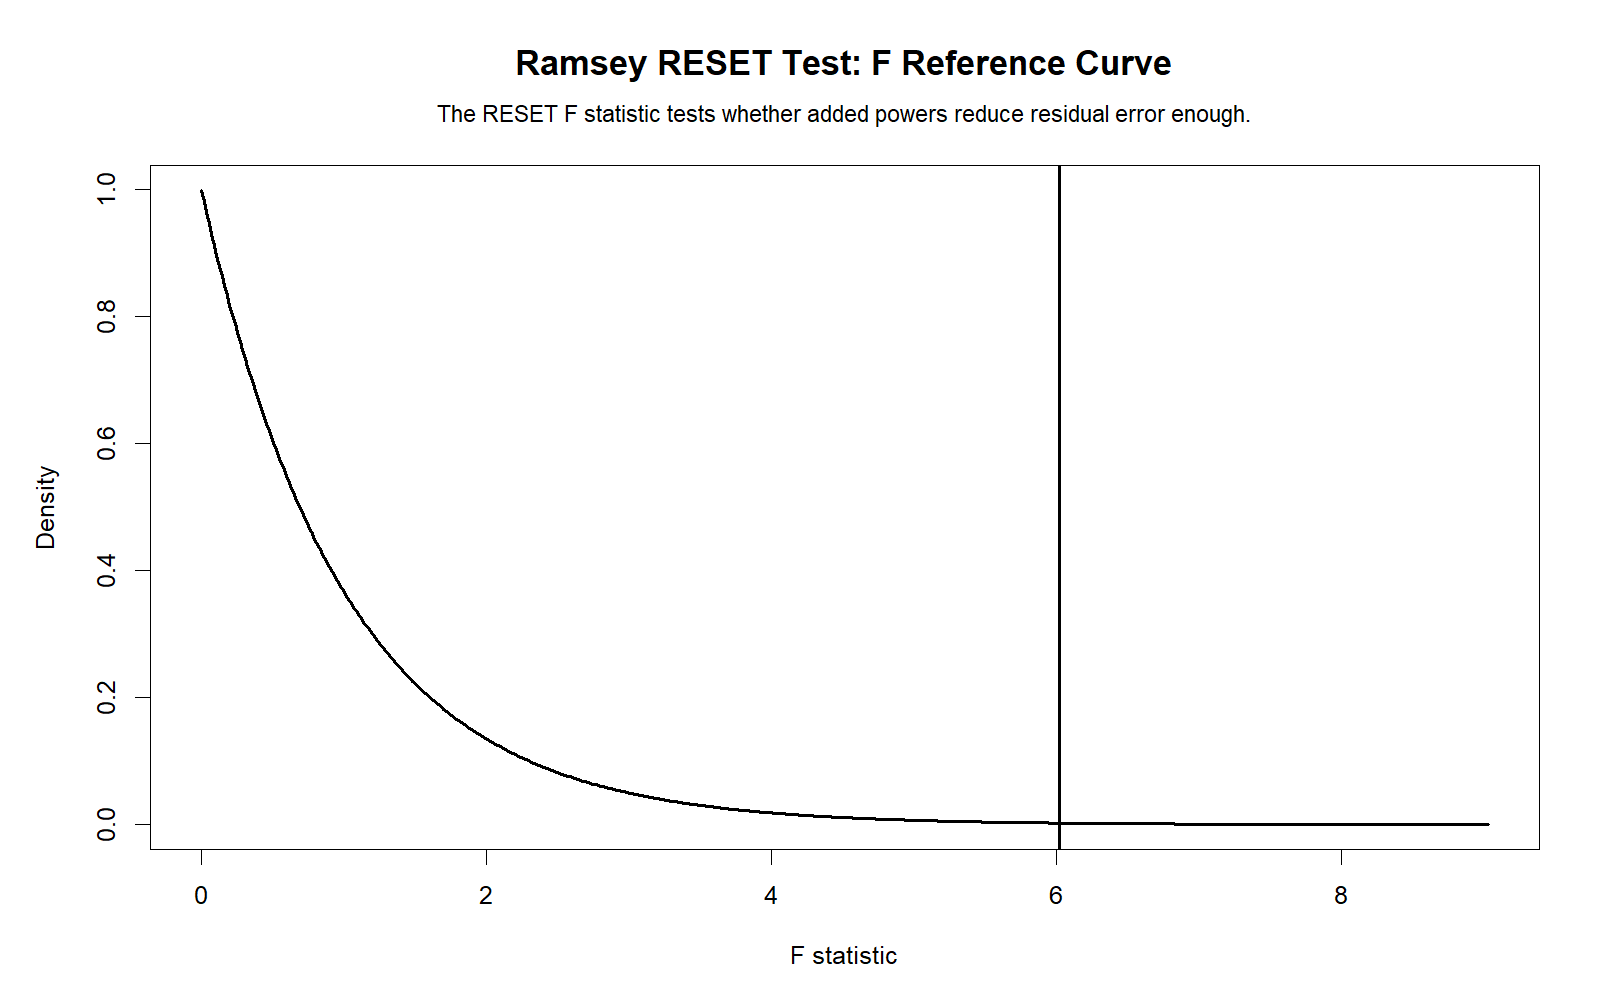
The R F reference curve validates the formal RESET decision. The chart shows how extreme the observed RESET F statistic is under the null hypothesis. This makes the p-value decision more transparent for readers.
R Chart 6: P-value Decision
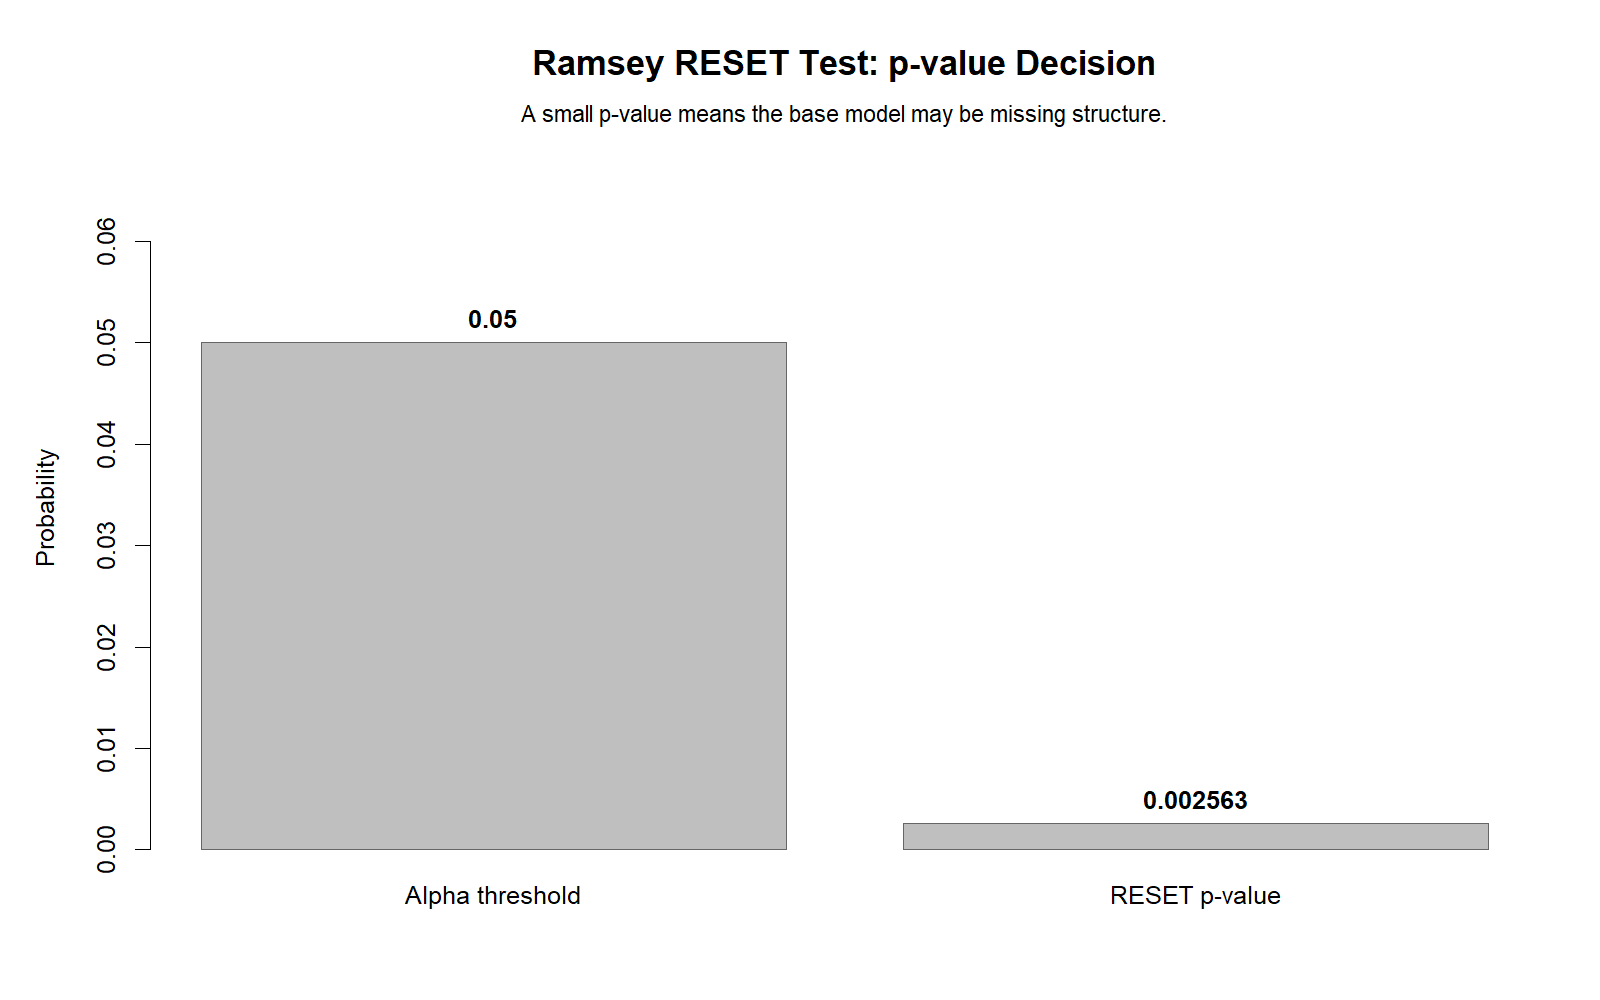
The R p-value chart confirms the decision rule used in Python. The chart should be read together with the residual plot and model comparison. A significant result points to possible specification error; a nonsignificant result means this RESET version did not detect fitted-power misspecification.
R Chart 7: RESET Power Sensitivity
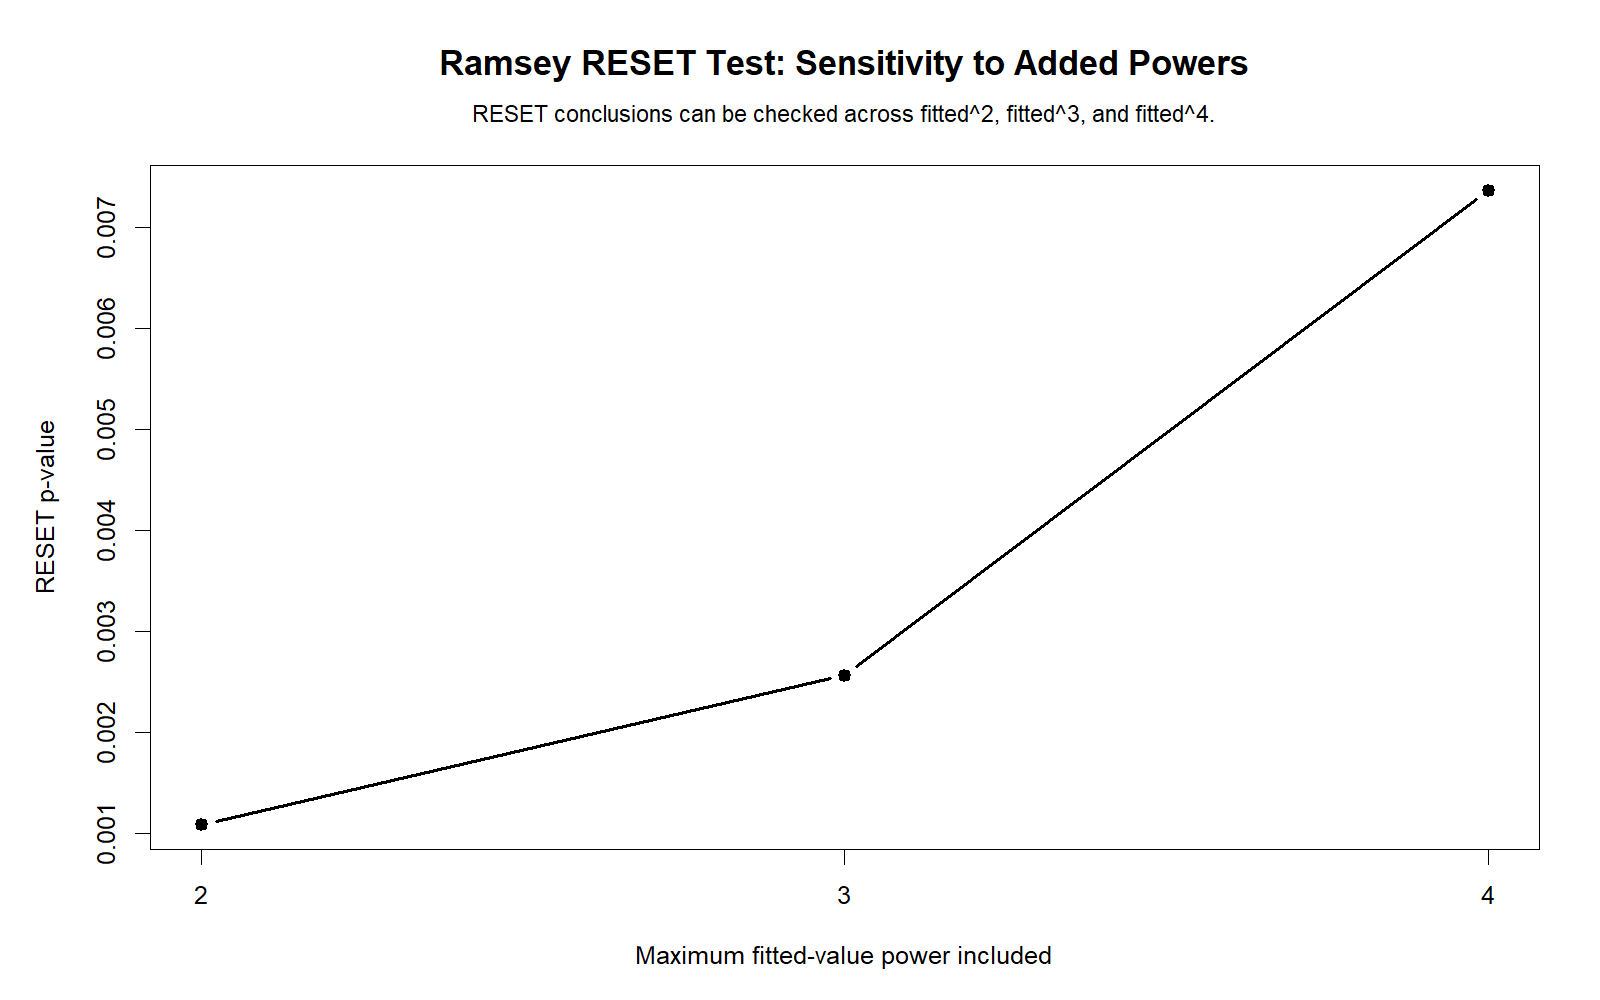
The R sensitivity chart confirms whether the RESET decision is stable across fitted-power choices. Stable significance across powers strengthens the misspecification warning. A decision that changes across powers should be interpreted cautiously and followed by theory-based model review.
SPSS, R, Python and Excel Workflows for Ramsey RESET Test
The Ramsey RESET Test can be performed in SPSS, R, Python and Excel-style workflows. The core logic is always the same: fit the original model, save fitted values, create fitted power terms, fit an augmented model, and test whether the fitted powers significantly improve model fit.
SPSS Workflow
| Step | SPSS Action | Purpose |
|---|---|---|
| Run original regression | Analyze > Regression > Linear | Fit the baseline regression model. |
| Save predicted values | Save > Unstandardized predicted values | Create fitted values for RESET power terms. |
| Compute fitted powers | Transform > Compute Variable | Create fitted squared and fitted cubed variables. |
| Run augmented regression | Add fitted power terms to original predictors | Test whether power terms improve the model. |
| Compare models | R² change, F change, coefficients | Decide whether model misspecification is detected. |
| Export output | OUTPUT EXPORT or File > Export | Save SPSS PDF for reporting. |
R Workflow
| Step | R Action | Purpose |
|---|---|---|
| Read data | read.csv() | Load the dataset. |
| Fit original model | lm() | Create baseline linear regression model. |
| Run RESET test | lmtest::resettest() | Perform Ramsey RESET Test directly. |
| Create fitted powers manually | fitted(model)^2, fitted(model)^3 | Build augmented model manually if needed. |
| Compare models | anova(original, augmented) | Test whether added fitted powers improve model fit. |
Python Workflow
| Step | Python Action | Purpose |
|---|---|---|
| Read data | pandas.read_csv() | Load the dataset. |
| Fit OLS model | statsmodels.OLS() | Create the baseline regression. |
| Run RESET | linear_reset() | Perform Ramsey RESET Test. |
| Create fitted power terms | fitted ** 2, fitted ** 3 | Build the augmented model manually if needed. |
| Create charts | matplotlib | Visualize model fit, residuals, fitted powers and p-value decision. |
Excel Workflow
| Excel Task | Formula or Tool | Purpose |
|---|---|---|
| Fit original regression | Data Analysis ToolPak > Regression | Estimate the baseline model. |
| Save fitted values | Predicted values output | Create ŷ values. |
| Create fitted squared | =PredictedValue^2 | Create the fitted squared RESET term. |
| Create fitted cubed | =PredictedValue^3 | Create the fitted cubed RESET term. |
| Fit augmented model | Regression with original predictors plus fitted powers | Check whether fitted powers improve the model. |
| Compare model fit | R², adjusted R², F statistics | Evaluate possible misspecification. |
Code Blocks for Ramsey RESET Test
SPSS Syntax for Ramsey RESET Test
* Ramsey RESET Test workflow in SPSS.
* Dependent variable: G3.
* Predictors: G1 G2 studytime failures absences age.

TITLE "Ramsey RESET Test Regression Specification Check".

REGRESSION
  /DEPENDENT G3
  /METHOD=ENTER G1 G2 studytime failures absences age
  /STATISTICS COEFF OUTS R ANOVA COLLIN TOL CHANGE
  /SAVE PRED(pred_original) RESID(resid_original)
  /CRITERIA=PIN(.05) POUT(.10).

* Create fitted power terms.
COMPUTE pred_sq = pred_original ** 2.
COMPUTE pred_cu = pred_original ** 3.
VARIABLE LABELS pred_sq "Squared fitted value for Ramsey RESET".
VARIABLE LABELS pred_cu "Cubed fitted value for Ramsey RESET".
EXECUTE.

* Augmented RESET model.
REGRESSION
  /DEPENDENT G3
  /METHOD=ENTER G1 G2 studytime failures absences age pred_sq pred_cu
  /STATISTICS COEFF OUTS R ANOVA COLLIN TOL CHANGE
  /CRITERIA=PIN(.05) POUT(.10).

* Inspect residuals from original model.
EXAMINE VARIABLES=resid_original
  /PLOT BOXPLOT HISTOGRAM NPPLOT
  /STATISTICS DESCRIPTIVES
  /CINTERVAL 95
  /MISSING LISTWISE
  /NOTOTAL.

OUTPUT EXPORT
  /CONTENTS EXPORT=VISIBLE
  /PDF DOCUMENTFILE="Ramsey-RESET-Test-SPSS-Output.pdf".
Python Code for Ramsey RESET Test
import pandas as pd
import statsmodels.api as sm
from statsmodels.stats.diagnostic import linear_reset

df = pd.read_csv("dataset.csv")

dependent = "G3"
predictors = ["G1", "G2", "studytime", "failures", "absences", "age"]

model_data = df[[dependent] + predictors].apply(pd.to_numeric, errors="coerce").dropna()

X = sm.add_constant(model_data[predictors])
y = model_data[dependent]

original_model = sm.OLS(y, X).fit()

# Ramsey RESET Test using fitted powers
reset_result = linear_reset(original_model, power=3, use_f=True)

print(original_model.summary())
print(reset_result)

# Manual augmented model with fitted squared and cubed
model_data["fitted"] = original_model.fittedvalues
model_data["fitted_sq"] = model_data["fitted"] ** 2
model_data["fitted_cu"] = model_data["fitted"] ** 3

X_aug = sm.add_constant(model_data[predictors + ["fitted_sq", "fitted_cu"]])
augmented_model = sm.OLS(y, X_aug).fit()

print(augmented_model.summary())

print("Original R-squared:", original_model.rsquared)
print("Augmented R-squared:", augmented_model.rsquared)
print("RESET F statistic:", reset_result.statistic)
print("RESET p-value:", reset_result.pvalue)

if reset_result.pvalue < 0.05:
    print("Reject correct specification: possible model misspecification.")
else:
    print("Do not reject correct specification under RESET test.")
R Code for Ramsey RESET Test
# Ramsey RESET Test in R

df <- read.csv("dataset.csv")

vars_needed <- c("G3", "G1", "G2", "studytime", "failures", "absences", "age")
df_model <- df[vars_needed]
df_model[] <- lapply(df_model, as.numeric)
df_model <- na.omit(df_model)

model_original <- lm(G3 ~ G1 + G2 + studytime + failures + absences + age, data = df_model)

summary(model_original)

# install.packages("lmtest")
library(lmtest)

reset_result <- resettest(model_original, power = 2:3, type = "fitted")

print(reset_result)

# Manual augmented model
df_model$fitted <- fitted(model_original)
df_model$fitted_sq <- df_model$fitted^2
df_model$fitted_cu <- df_model$fitted^3

model_augmented <- lm(G3 ~ G1 + G2 + studytime + failures + absences + age + fitted_sq + fitted_cu,
                      data = df_model)

summary(model_augmented)

anova(model_original, model_augmented)
Excel Formula Block for Ramsey RESET Test
Step 1:
Run the original regression using Excel Data Analysis ToolPak.

Step 2:
Save predicted values from the original model.

Step 3:
Create fitted squared:
=Predicted_Value^2

Step 4:
Create fitted cubed:
=Predicted_Value^3

Step 5:
Run the augmented regression:
Dependent variable = G3
Predictors = original predictors + fitted squared + fitted cubed

Step 6:
Compare original and augmented models:
Original R²
Augmented R²
Adjusted R²
F statistics
Significance of fitted squared and fitted cubed terms

Step 7:
Interpret:
If fitted power terms significantly improve fit, the original model may be misspecified.
If fitted power terms do not improve fit, RESET does not detect fitted-power misspecification.
APA Reporting Wording for Ramsey RESET Test
APA reporting for the Ramsey RESET Test should include the test name, model being checked, fitted power terms used, F statistic if available, p-value, decision, and follow-up interpretation. Do not simply write that the model is “good” or “bad.” The RESET test is a specification diagnostic, not a complete model-quality certificate.
APA-Style Full Report
The regression model predicting G3 was evaluated for functional-form misspecification using the Ramsey RESET Test. Fitted-value power terms were added to the original model and tested jointly. A significant RESET result would indicate possible omitted nonlinear structure, omitted variables, interactions, or incorrect functional form. The decision was interpreted together with observed-versus-fitted values, residuals-versus-fitted plots, and model fit comparison.
If RESET Is Significant
The Ramsey RESET Test was significant, indicating possible model misspecification. This suggests that the original linear model may be missing nonlinear terms, interaction effects, or relevant predictors. Follow-up model revision and residual diagnostics are recommended before relying on final coefficient interpretation.
If RESET Is Not Significant
The Ramsey RESET Test was not significant, indicating that the test did not detect functional-form misspecification through the added fitted-value power terms. The model should still be reviewed with residual plots, normality diagnostics, heteroscedasticity checks, outlier diagnostics and theory-based predictor selection.
Common Mistakes in Ramsey RESET Test Interpretation
| Mistake | Why It Is a Problem | Correct Practice |
|---|---|---|
| Assuming RESET identifies the missing variable | The test detects possible misspecification but does not name the cause. | Use theory, residual plots and model comparison for follow-up. |
| Ignoring residual plots | RESET p-value alone does not show the shape of the problem. | Inspect residuals versus fitted values. |
| Using fitted powers as final model automatically | Fitted powers are diagnostic terms, not necessarily meaningful predictors. | Use theory-based nonlinear terms or transformations. |
| Thinking nonsignificant RESET proves the model is correct | The test may miss other types of misspecification. | Still check heteroscedasticity, normality, outliers and multicollinearity. |
| Running RESET before building a reasonable model | A poor initial model can produce confusing diagnostic results. | Build a theoretically defensible model first. |
| Ignoring sample size | Large samples can detect small misspecification; small samples may lack power. | Interpret p-values with effect size, plots and practical meaning. |
Important warning: The Ramsey RESET Test should guide model improvement. It should not replace substantive reasoning, residual diagnostics, variable selection, or meaningful model comparison.
When to Use Ramsey RESET Test
Use the Ramsey RESET Test after fitting a linear regression model when you want to check whether the model may have an incorrect functional form. It is especially useful when residual plots suggest curvature, when theory suggests possible nonlinear relationships, or when a model fits poorly despite relevant predictors.
| Use Ramsey RESET Test When | Reason | Example from This Guide |
|---|---|---|
| Checking model specification | RESET tests whether fitted power terms improve the model. | G3 regression model specification check. |
| Residual plot shows curvature | Curvature suggests missing nonlinear terms. | Residuals-versus-fitted chart. |
| Model may omit important variables | Omitted variables can create misspecification patterns. | Augmented model comparison. |
| Testing functional form | Fitted squared and cubed terms detect nonlinear structure. | Fitted power terms chart. |
| Writing regression diagnostics | RESET adds a formal model-specification check. | APA reporting section. |
The Ramsey RESET Test should be used with other regression diagnostics. For heteroscedasticity, review the Goldfeld-Quandt test. For normality, review the Q-Q plot normality check, P-P plot normality check, Kolmogorov-Smirnov test, Lilliefors test, D’Agostino-Pearson test, and Ryan-Joiner test.
Downloads and Resources for Ramsey RESET Test
The SPSS output PDF below verifies the Ramsey RESET Test workflow used for this guide. Use it as the supporting output file for SPSS interpretation, original model review, fitted power terms, augmented model comparison and reporting.
FAQs About Ramsey RESET Test
What is the Ramsey RESET Test?
The Ramsey RESET Test is a regression specification test that checks whether fitted-value power terms significantly improve a linear regression model.
What does Ramsey RESET stand for?
RESET stands for Regression Equation Specification Error Test. It is commonly called the Ramsey RESET Test.
What is the null hypothesis of the Ramsey RESET Test?
The null hypothesis is that the original model is adequately specified with respect to the fitted-value power terms tested.
What is the alternative hypothesis of the Ramsey RESET Test?
The alternative hypothesis is that the model may be misspecified because at least one fitted-value power term improves the model.
How do I interpret a significant Ramsey RESET Test?
A significant result suggests possible model misspecification, such as omitted nonlinear terms, missing variables, interactions, or incorrect functional form.
How do I interpret a nonsignificant Ramsey RESET Test?
A nonsignificant result means the test did not detect misspecification through the fitted power terms tested. It does not prove the model is perfect.
Does Ramsey RESET tell which variable is missing?
No. It only warns that the model may be misspecified. The analyst must use theory, plots, and model comparison to identify the likely issue.
Can I run Ramsey RESET Test in SPSS?
Yes. In SPSS, fit the original model, save predicted values, compute fitted squared and fitted cubed variables, then run an augmented regression and compare fit.
Can I run Ramsey RESET Test in Python?
Yes. In Python, use statsmodels OLS and the linear_reset() function from statsmodels.stats.diagnostic.
Can I run Ramsey RESET Test in R?
Yes. In R, use lm() for the regression model and lmtest::resettest() for the Ramsey RESET Test.
Can I approximate Ramsey RESET Test in Excel?
Yes. Fit the original regression, save predicted values, create fitted squared and fitted cubed columns, run an augmented regression, and compare model fit.
Is Ramsey RESET a normality test?
No. It is a model specification test. Normality should be checked separately with Q-Q plots, P-P plots and normality tests.
Is Ramsey RESET a heteroscedasticity test?
No. It is not a heteroscedasticity test. For heteroscedasticity, use residual plots or tests such as Goldfeld-Quandt when appropriate.
Should fitted power terms become my final model?
Not automatically. Fitted power terms are diagnostic. Use theory-based nonlinear terms, transformations or interactions for final model improvement.

