
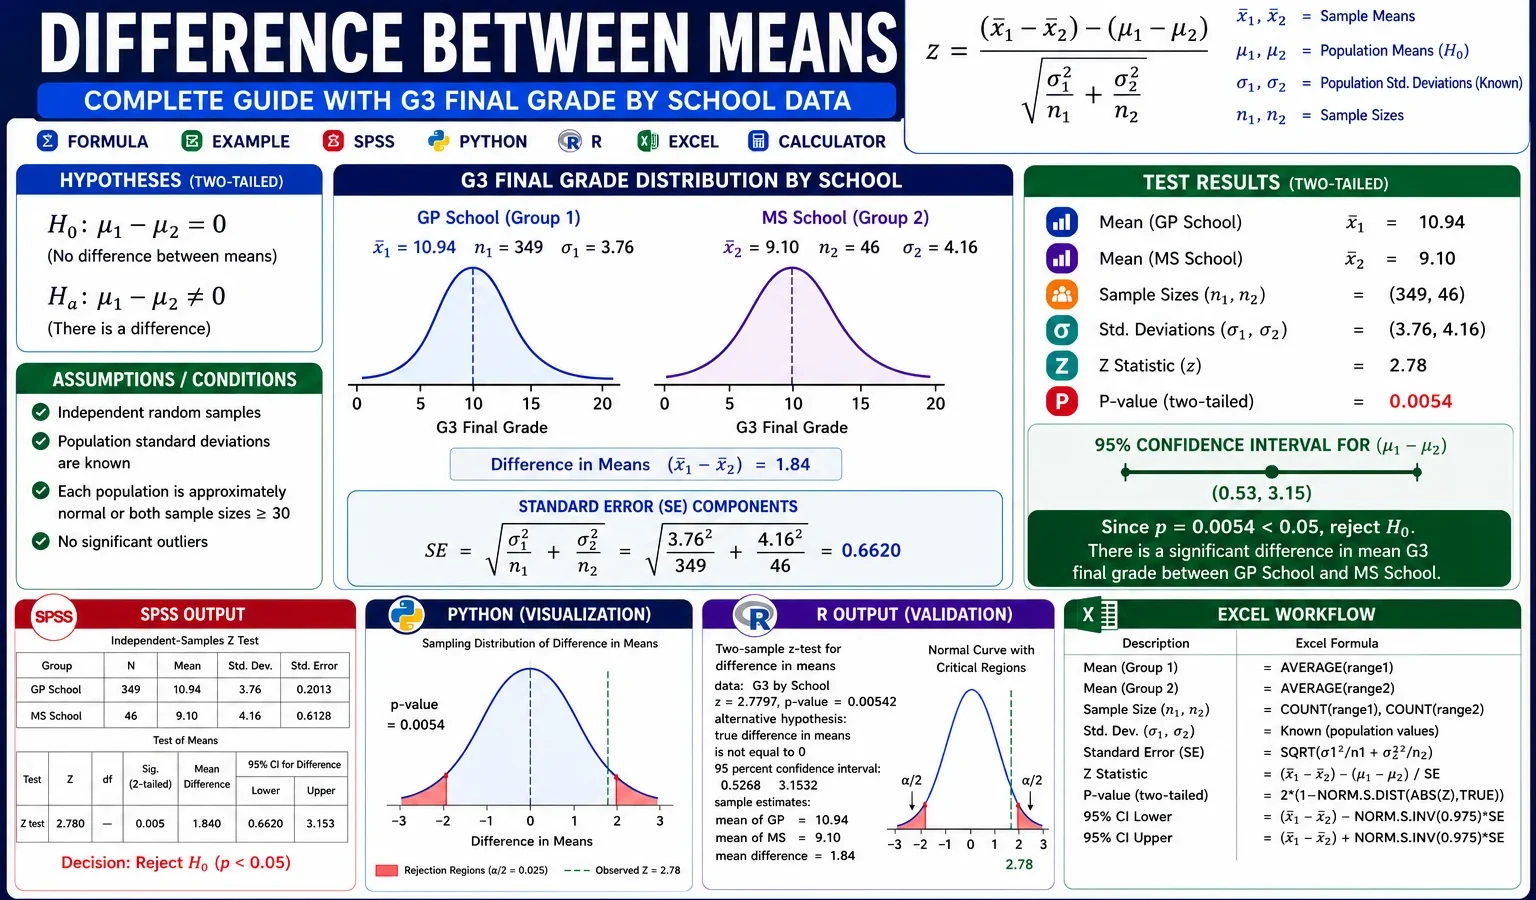
Hypothesis Test for the Difference Between Two Means
Z Test for Difference Between Means is used to test whether two independent population means are significantly different when the population standard deviations are known or when a large-sample z-test workflow is used. This guide explains the z test for difference between two means with formula, assumptions, p-value, confidence interval, SPSS image output, Python charts, R validation charts and Excel workflow using G3 final grade data for GP and MS school groups.
Quick Answer: Z Test for Difference Between Means Result
The Z Test for Difference Between Means was performed to compare the mean G3 final grade between two independent school groups: GP and MS. The GP school mean was 12.577, and the MS school mean was 10.650. The observed mean difference was GP − MS = 1.926.
The standard-error component for GP was 0.0213, and the standard-error component for MS was 0.0398. Together these components give a standard error of approximately 0.247. The observed z statistic was approximately z = 7.79. The 95% confidence interval for the difference between means was [1.442, 2.411].
Final conclusion: Since the observed z statistic is far beyond the usual critical values of ±1.96, reject the null hypothesis. The sample provides strong evidence that mean G3 final grade differs between GP and MS. Because the difference is positive, GP has a higher mean G3 final grade than MS.
Important note: A textbook z test for difference between means assumes known population standard deviations. If standard deviations are estimated only from the sample, a two-sample t test is usually the formal textbook choice. In this worked example, the chart workflow is a z-test workflow for comparing independent means.
Table of Contents
- What Is Z Test for Difference Between Means?
- When Should You Use This Test?
- Null and Alternative Hypothesis
- Z Test for Difference Between Means Formula
- Conditions and Assumptions
- Dataset and Variables Used
- Verified Results Summary
- SPSS Image Output and Interpretation
- Python Charts and Interpretation
- R Validation Charts and Interpretation
- Overall Image Interpretation
- How to Run the Test in SPSS, Python, R and Excel
- How to Report the Test
- Common Mistakes
- Related Statistical Guides
- FAQs
What Is Z Test for Difference Between Means?
A Z Test for Difference Between Means is a hypothesis test used to compare the means of two independent groups. It is also called a z test for difference in means, z test for difference of means, z test for difference between two means, independent samples z test or two sample z test for means.
The test compares two group means, usually written as x̄1 and x̄2. The null hypothesis says that the two population means are equal. The alternative hypothesis says that the two population means are different. The observed difference between the two sample means is divided by the standard error of the difference. This produces a z statistic, which is interpreted using the standard normal distribution.
In this example, the outcome variable is G3 final grade. The grouping variable is school, with two independent categories: GP and MS. The main research question is: Is the mean G3 final grade different between GP and MS?
For background concepts, see Null and Alternative Hypothesis, P Value, Z Score, Standard Error, Standard Normal Distribution, Mean, Median and Mode and Descriptive Statistics.
When Should You Use a Z Test for Difference Between Means?
Use a z test for difference between means when you want to compare two independent means and the population standard deviations are known. The outcome should be numeric, and the two groups should be independent.
| Situation | Use this test? | Reason |
|---|---|---|
| Comparing mean G3 final grade between GP and MS schools | Yes | The outcome is numeric and the groups are independent. |
| Comparing average exam scores between two independent schools | Yes | The test compares two independent population means. |
| Testing whether one sample mean differs from one benchmark | No | Use a One Sample Z Test. |
| Comparing pass proportions between two schools | No | Use a Two Proportion Z Test. |
| Population standard deviations are unknown | Usually no | A two-sample t test is usually preferred when standard deviations are estimated from samples. |
Null and Alternative Hypothesis for Z Test for Difference Between Means
The hypotheses compare the two population means. In this example, μGP is the population mean G3 final grade for GP school, and μMS is the population mean G3 final grade for MS school.
| Hypothesis | Symbolic form | Meaning in this example |
|---|---|---|
| Null hypothesis | H0: μGP = μMS | The two schools have equal population mean G3 final grades. |
| Alternative hypothesis | H1: μGP ≠ μMS | The two schools have different population mean G3 final grades. |
| Difference form | H0: μGP − μMS = 0 | There is no population mean difference between schools. |
| Decision rule | Reject H0 if |z| > 1.96 or p < .05 | The observed z = 7.79 is far beyond the rejection boundary. |
This worked example uses a two-tailed z test because the alternative hypothesis says the two means are different. If the research question were specifically whether GP is higher than MS, the alternative would be H1: μGP > μMS. If the research question were whether GP is lower than MS, the alternative would be H1: μGP < μMS.
Z Test for Difference Between Means Formula and Calculation
The z test for difference between means formula is:
z = (x̄1 - x̄2) / sqrt[(σ1² / n1) + (σ2² / n2)]

where:
x̄1 = mean of group 1
x̄2 = mean of group 2
σ1² / n1 = standard-error variance component for group 1
σ2² / n2 = standard-error variance component for group 2
For this worked example, GP is group 1 and MS is group 2.
| Component | Exact value from output | Explanation |
|---|---|---|
| Group 1 mean | GP mean = 12.577 | Mean G3 final grade for GP. |
| Group 2 mean | MS mean = 10.650 | Mean G3 final grade for MS. |
| Mean difference | GP − MS = 1.926 | GP is 1.926 grade points higher than MS. |
| GP standard-error component | 0.0213 | Variance contribution from GP inside the standard error formula. |
| MS standard-error component | 0.0398 | Variance contribution from MS inside the standard error formula. |
| Total variance contribution | 0.0611 | 0.0213 + 0.0398. |
| Standard error | SE ≈ 0.247 | sqrt(0.0611). |
| Z statistic | z = 7.79 | The mean difference is 7.79 standard errors above zero. |
| 95% confidence interval | [1.442, 2.411] | The interval for GP − MS is entirely above zero. |
Mean difference = 12.577 - 10.650
Mean difference = 1.926

Total variance contribution = 0.0213 + 0.0398
Total variance contribution = 0.0611

SE = sqrt(0.0611)
SE ≈ 0.247

z = 1.926 / 0.247
z ≈ 7.79
The 95% confidence interval for the difference between means is:
95% CI = difference ± 1.96 × SE

95% CI = 1.926 ± 1.96 × 0.247
95% CI = [1.442, 2.411]
Because the confidence interval is entirely above 0, it supports the same conclusion as the z statistic. The GP mean is higher than the MS mean. For more detail, see Confidence Interval, Margin of Error and Standard Error.
Conditions and Assumptions for Z Test for Difference Between Means
The z test for difference between two means has several important assumptions. These should be checked before reporting the result.
| Condition | How to check it | This example |
|---|---|---|
| Continuous outcome | The dependent variable should be numeric. | G3 final grade is numeric. |
| Two independent groups | Each case should belong to one group only. | Each student belongs to either GP or MS. |
| Independent observations | Each observation should represent a separate case. | Each row is treated as one student record. |
| Known standard deviations or z-test workflow | The textbook z test assumes known standard deviations. | The output uses standard-error components for the z-test calculation. |
| Approximately normal sampling distribution | The difference between sample means should have an approximately normal sampling distribution. | The distribution and large-sample workflow support the z approximation. |
| No paired observations | The two groups should not be matched or repeated measures. | GP and MS are independent school groups. |
If the main concern is whether the group variances are equal, compare this test with Levene Test, Brown-Forsythe Test or Bartlett’s Test. For distribution checks, use Histogram Interpretation, Box Plot Interpretation, Q Q Plot Normality Check, Shapiro Wilk Test and Kolmogorov Smirnov Test.
Dataset and Variables Used
This worked example uses student performance data. The outcome variable is G3 final grade. The grouping variable is school, with two categories: GP and MS. The z test for difference between means compares the mean G3 final grade between these two school groups.
| Item | Value | Explanation |
|---|---|---|
| Outcome variable | G3 | Final exam grade. |
| Outcome scale | 0 to 20 | G3 is a numeric grade score. |
| Grouping variable | school | Two independent school groups. |
| Group 1 | GP | Mean G3 = 12.577. |
| Group 2 | MS | Mean G3 = 10.650. |
| Main comparison | GP − MS | Difference between two independent means. |
External dataset source: UCI Machine Learning Repository: Student Performance dataset.
Verified SPSS, Python and R Results Summary
The SPSS image output, Python charts and R validation charts support the same conclusion. GP has a higher mean G3 final grade than MS. The mean difference is 1.926, the confidence interval is entirely above zero, and the observed z statistic is far beyond the usual two-tailed critical values of ±1.96.
| Statistic | Exact value | Interpretation |
|---|---|---|
| GP mean G3 | 12.577 | Average final grade in GP. |
| MS mean G3 | 10.650 | Average final grade in MS. |
| Mean difference | 1.926 | GP is 1.926 grade points higher than MS. |
| 95% confidence interval | [1.442, 2.411] | The interval is entirely above zero. |
| GP variance contribution | 0.0213 | GP contribution to the standard-error formula. |
| MS variance contribution | 0.0398 | MS contribution to the standard-error formula. |
| Z statistic | 7.79 | The result is far into the rejection region. |
| Decision | Reject H0 | The school means are significantly different. |
SPSS Image Output and Interpretation
The SPSS image output explains the z test for difference between means visually. These images show the G3 distribution by school, the group mean comparison, the confidence interval for the mean difference, the z statistic on the standard normal curve and subgroup context by sex and study time.
1. SPSS Image: G3 Distribution by School
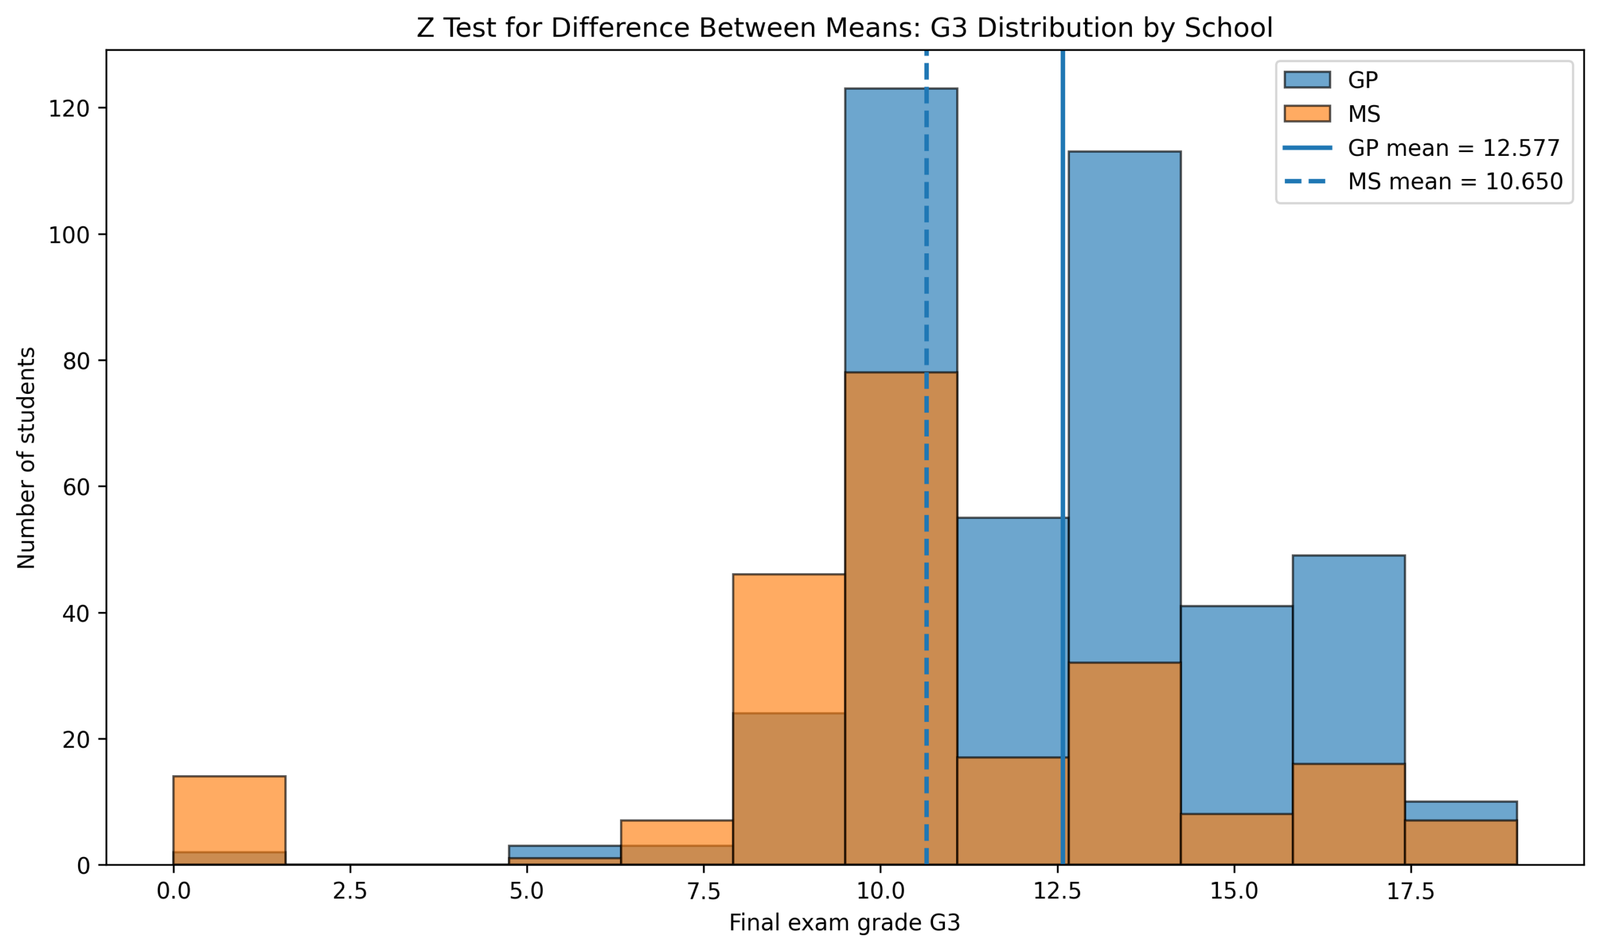
This SPSS image shows the distribution of G3 final grades for the two school groups. The GP mean is 12.577, and the MS mean is 10.650. The GP mean line is to the right of the MS mean line, which indicates a higher average final grade for GP.
The chart is important because it shows the raw data context before the formal z statistic is interpreted. The two distributions overlap, which is normal in real education data, but their centers are different. The observed difference between the means is 1.926 grade points.
This image supports the test because the formal question is whether the visible difference between these group centers is large relative to the standard error. The later z curve and confidence interval confirm that the difference is statistically meaningful.
2. SPSS Image: Group Mean Comparison
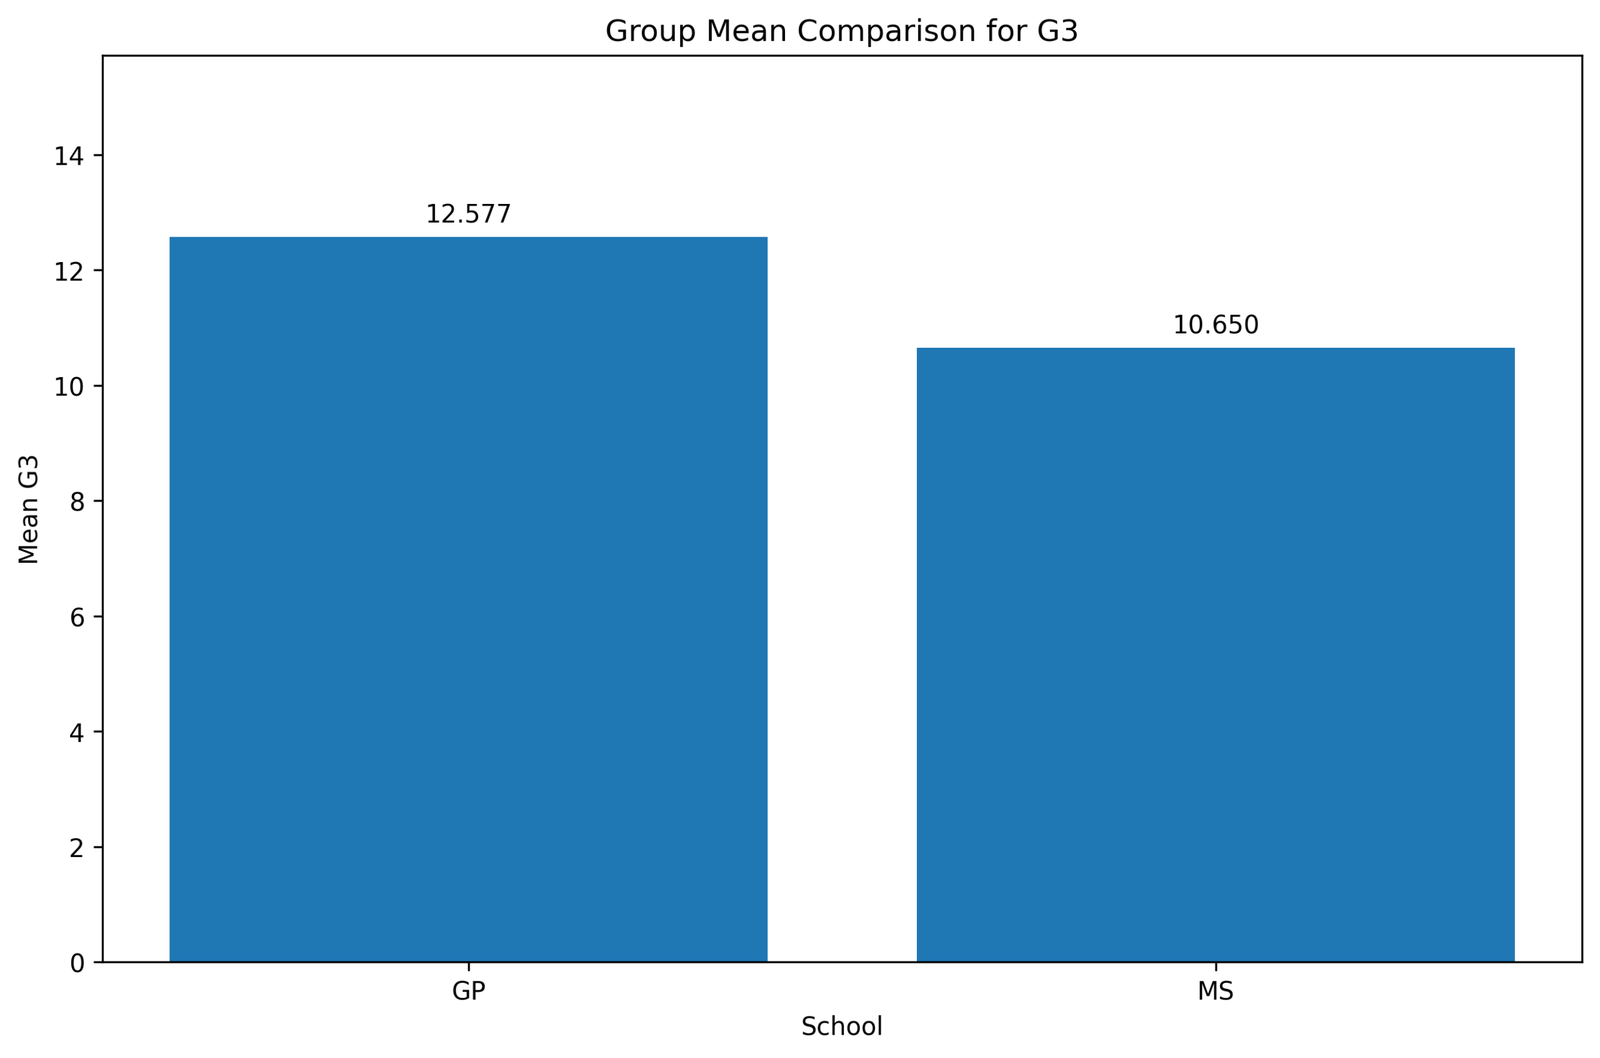
This SPSS image focuses directly on the two means. GP has a mean of 12.577, while MS has a mean of 10.650. The difference is 1.926 grade points in favor of GP.
This is the central comparison in the z test for difference between means. The null hypothesis says that the two population means are equal. The observed data show that the GP sample mean is higher than the MS sample mean.
The chart gives a practical interpretation: GP students scored about 1.93 G3 grade points higher on average. The formal z test then determines whether this observed difference is too large to be explained by ordinary sampling variation.
3. SPSS Image: Confidence Interval for Difference Between Means
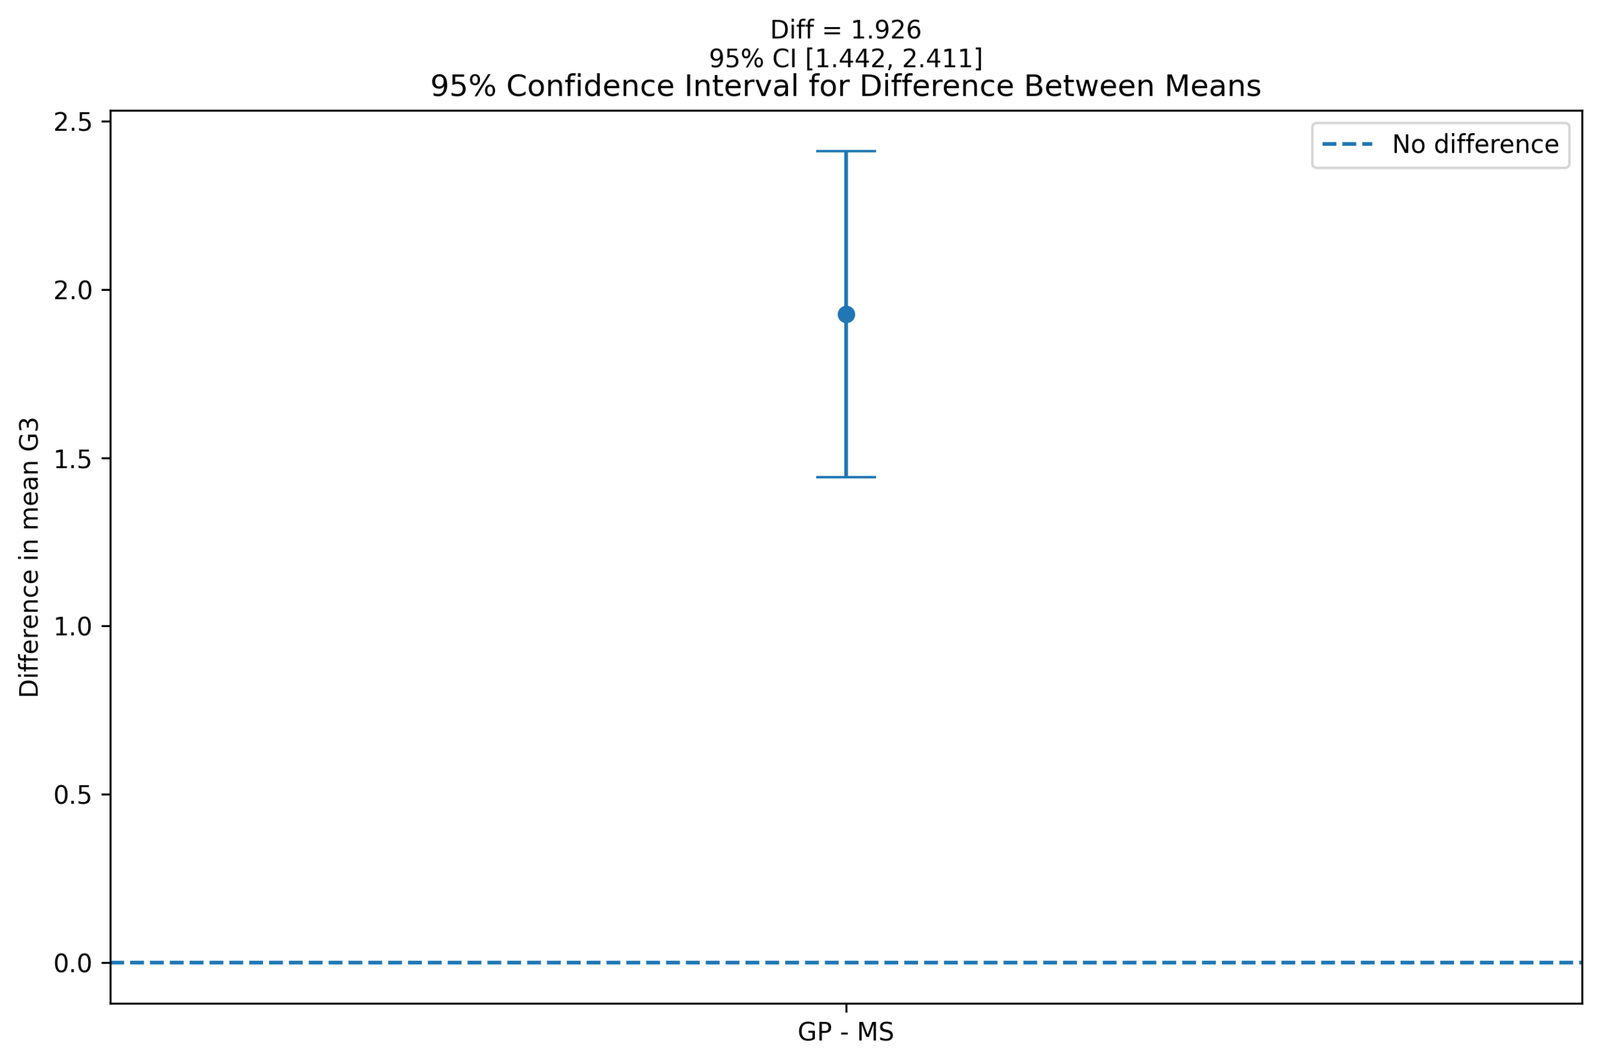
This SPSS image shows the confidence interval for the difference between means. The observed difference is 1.926, and the 95% confidence interval is [1.442, 2.411]. The no-difference reference line is 0.
The entire interval is above zero. This means the estimated population difference remains positive after sampling uncertainty is considered. In plain language, GP is likely higher than MS by about 1.44 to 2.41 G3 grade points.
This image strongly supports the z-test decision. If the interval had crossed zero, the evidence would be weaker. Since the interval is fully above zero, the result supports rejecting the null hypothesis of equal means.
4. SPSS Image: Z Statistic on the Standard Normal Curve
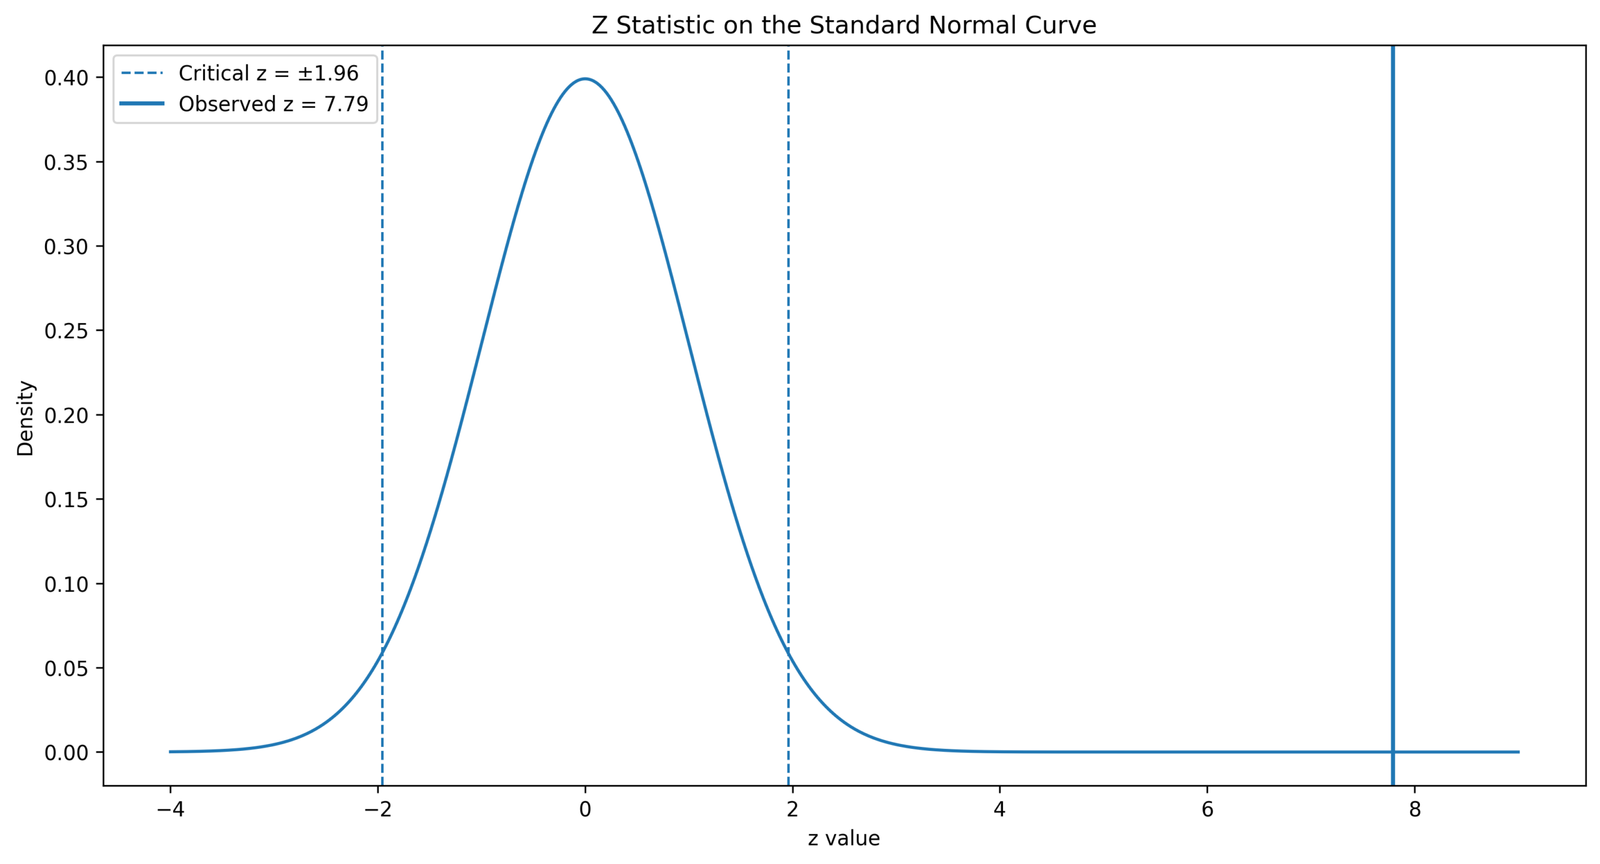
This SPSS image places the observed test statistic on the standard normal curve. The observed z statistic is approximately 7.79. For a two-tailed test at α = .05, the usual critical values are -1.96 and +1.96.
The observed value is far to the right of +1.96. This means the difference between the two means is far larger than what would normally be expected if the two population means were equal.
The curve explains why the p-value is extremely small. A z value near 7.79 is deep in the rejection region. Therefore, the test rejects H0: μGP = μMS.
5. SPSS Image: Mean G3 by Sex Within School
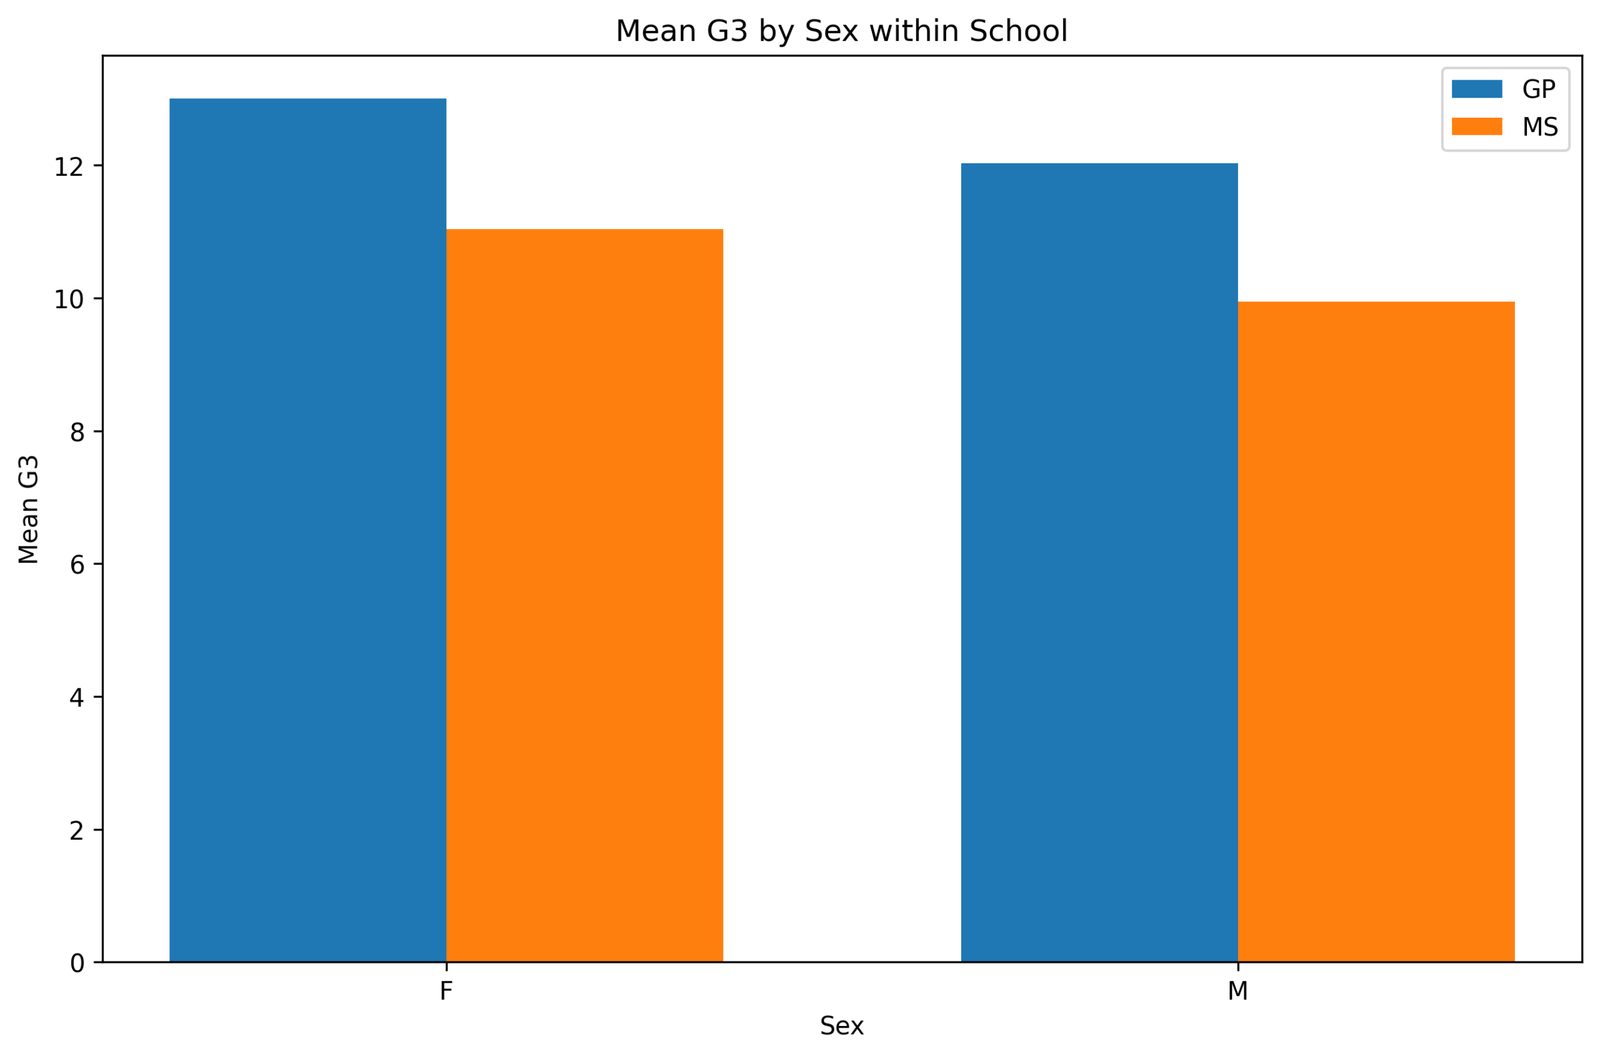
This SPSS image provides subgroup context by sex within school. The chart shows that GP is higher than MS for both female and male students. For female students, GP is around 13.004, while MS is around 11.034. For male students, GP is around 12.032, while MS is around 9.950.
The subgroup chart supports the overall school comparison because the GP advantage appears in both sex categories. The female difference is about 1.970 points, and the male difference is about 2.082 points.
This image is descriptive context. It does not replace the formal z test. The formal test compares the overall GP and MS means, while this chart helps explain the pattern within sex groups.
6. SPSS Image: Mean G3 by Study Time Within School
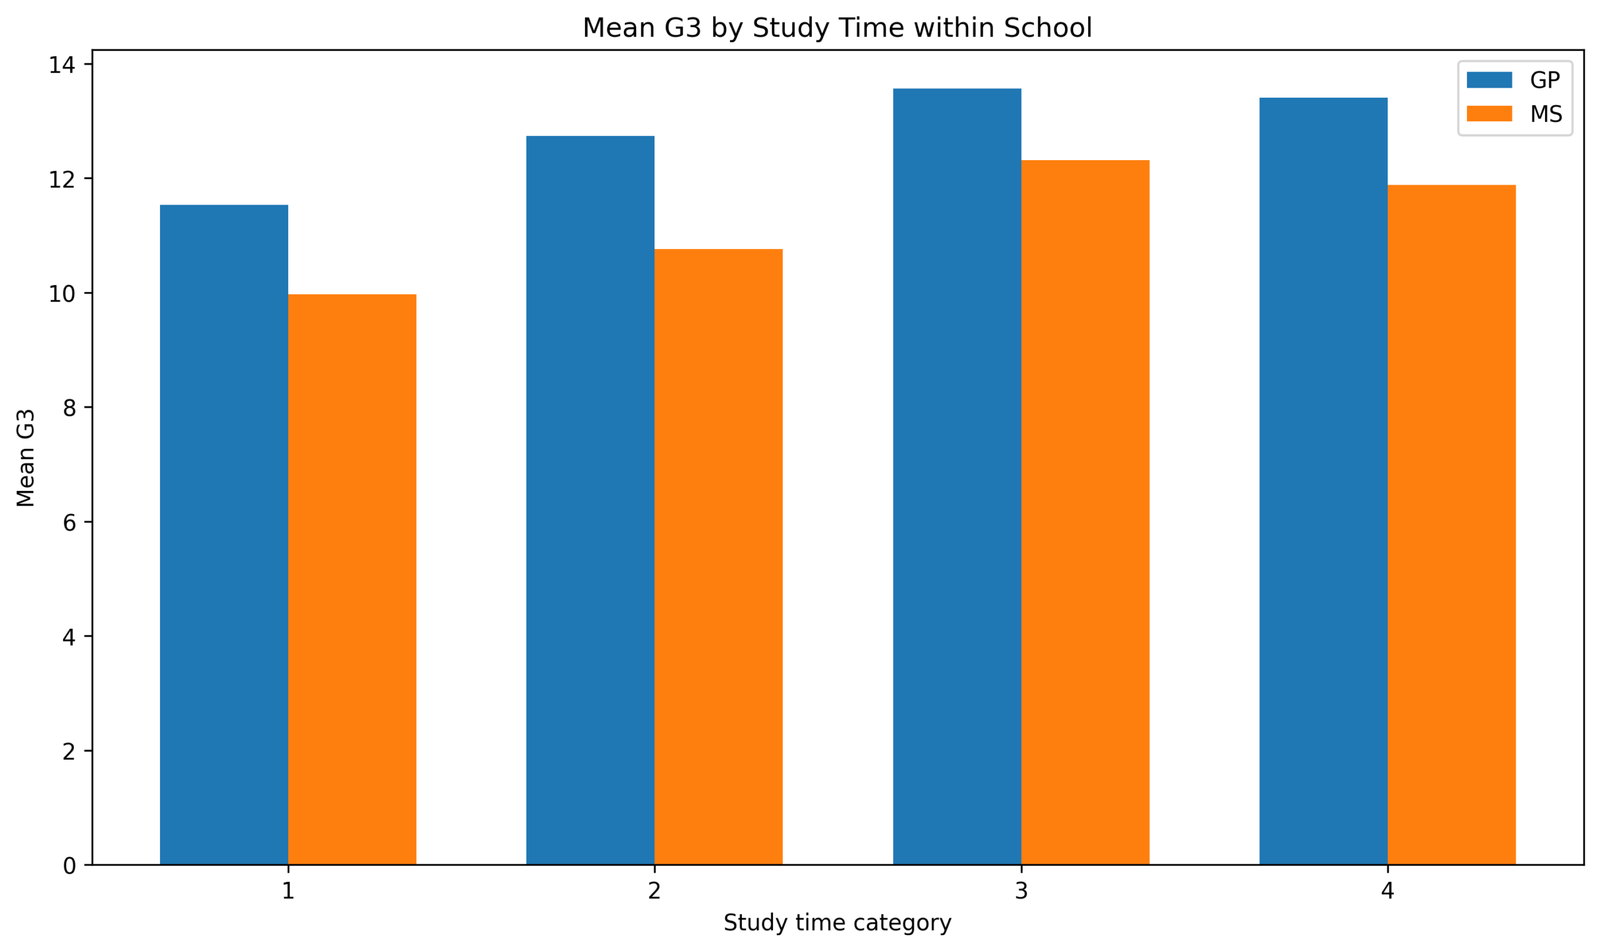
This SPSS image shows mean G3 by study-time category within each school. In study-time category 1, GP is around 11.529 and MS is around 9.968. In category 2, GP is around 12.733 and MS is around 10.758. In category 3, GP is around 13.563 and MS is around 12.308. In category 4, GP is around 13.407 and MS is around 11.875.
The chart shows that GP has a higher mean G3 score than MS in every study-time category. This strengthens the descriptive interpretation because the school difference is visible across study-time levels.
The image is not an adjusted statistical model. It does not prove that school differences remain after full adjustment for study time. It simply shows that the overall GP advantage appears consistently across the displayed study-time categories.
Python Charts and Interpretation
The Python charts validate the same z test for difference between means using a programmatic workflow. The Python image set includes the standard-error components chart, which shows how each group contributes to the standard error of the mean difference.
1. Python Chart: G3 Distribution by School
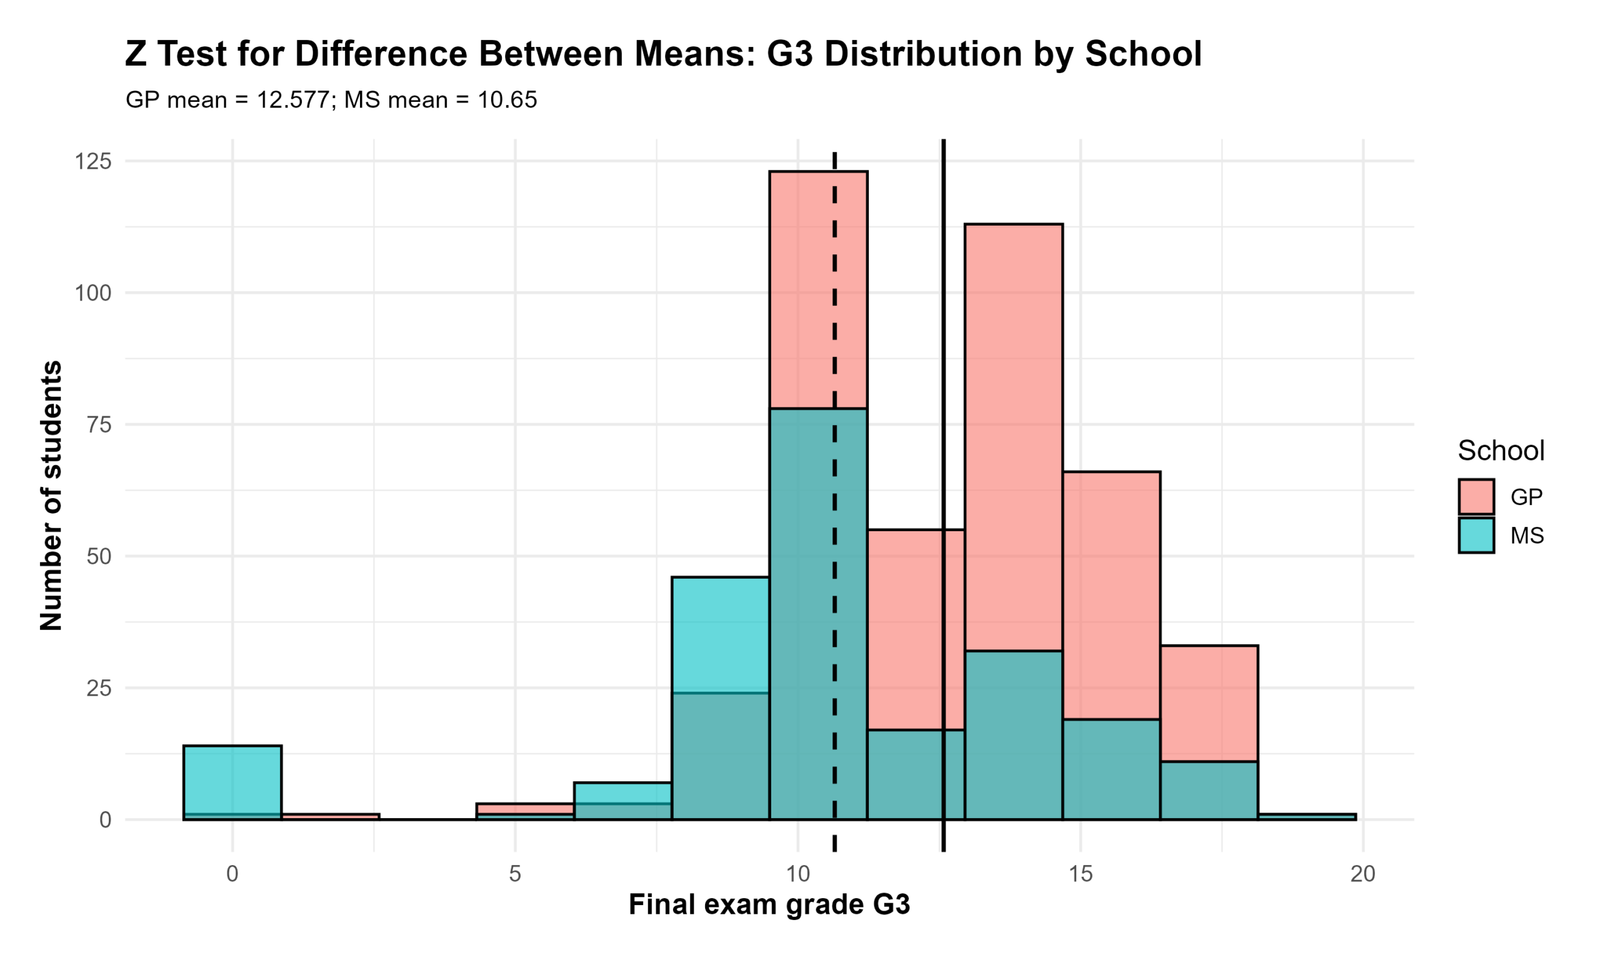
The Python distribution chart confirms the same pattern shown in the SPSS output. GP has a higher center than MS, with GP mean = 12.577 and MS mean = 10.650.
The chart shows overlap between the two school distributions, but the GP mean line is shifted to the right. This means the average G3 final grade is higher for GP.
This chart supports the z test because it shows the raw data pattern behind the mean comparison. The test then standardizes the difference using the standard error.
2. Python Chart: Group Mean Comparison
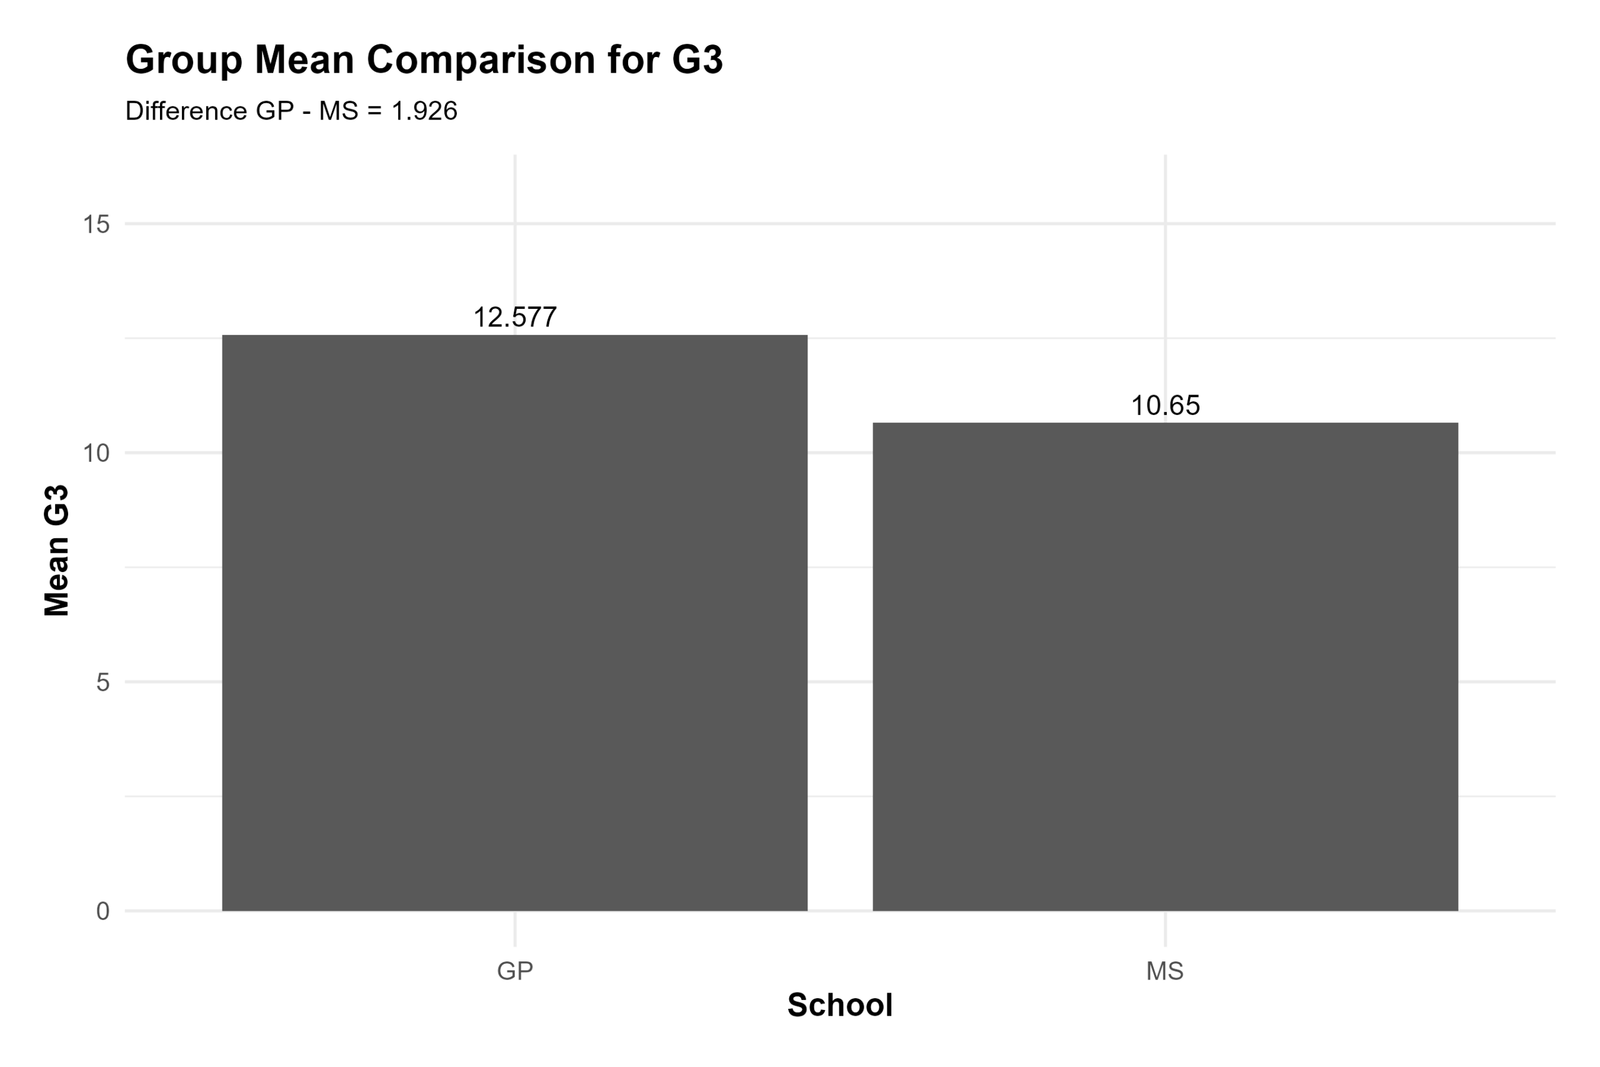
The Python group-mean chart shows GP = 12.577 and MS = 10.650. The difference is 1.926 grade points.
This image is the direct visual version of the hypothesis test numerator. The numerator of the z statistic is the observed mean difference, x̄GP − x̄MS.
The chart confirms that the two group means are not equal in the sample. The z test confirms that the difference is large relative to its standard error.
3. Python Chart: Confidence Interval for Difference Between Means
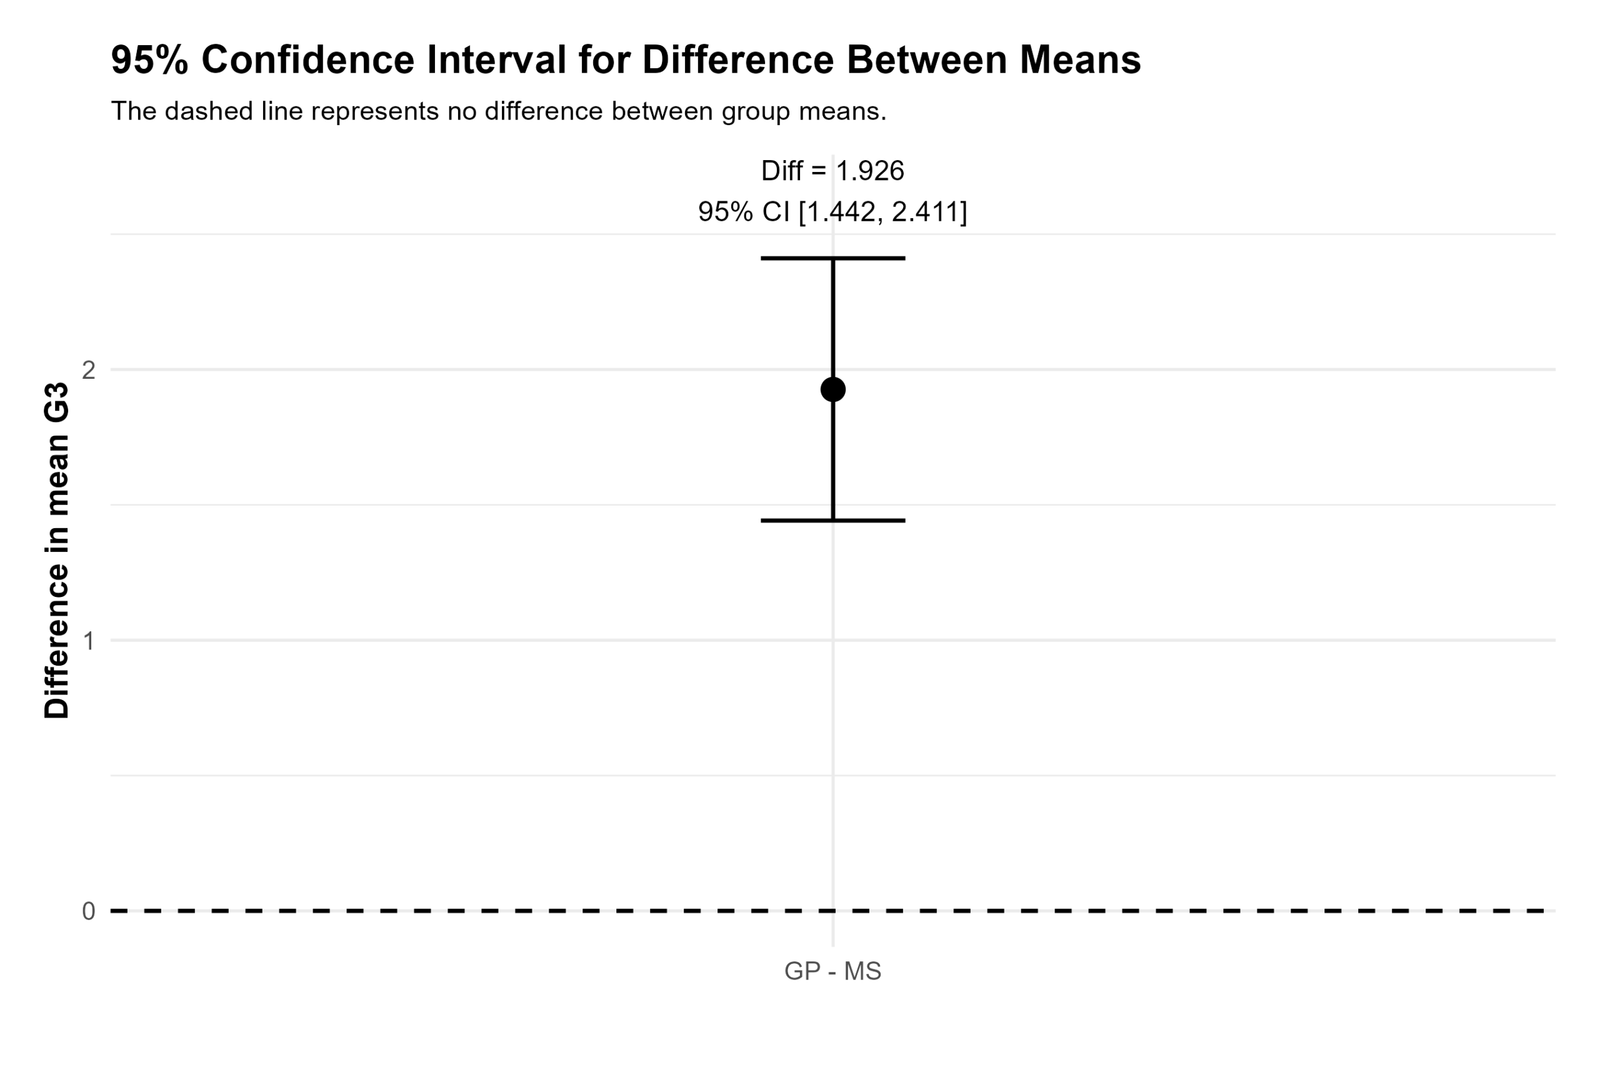
The Python confidence interval chart confirms the mean difference of 1.926 and the 95% confidence interval of [1.442, 2.411].
The entire confidence interval is above zero. This means the estimated population difference is positive, not merely a random sample fluctuation around zero.
The chart gives practical meaning: the GP mean is likely between about 1.44 and 2.41 final-grade points higher than the MS mean.
4. Python Chart: Z Statistic on the Standard Normal Curve
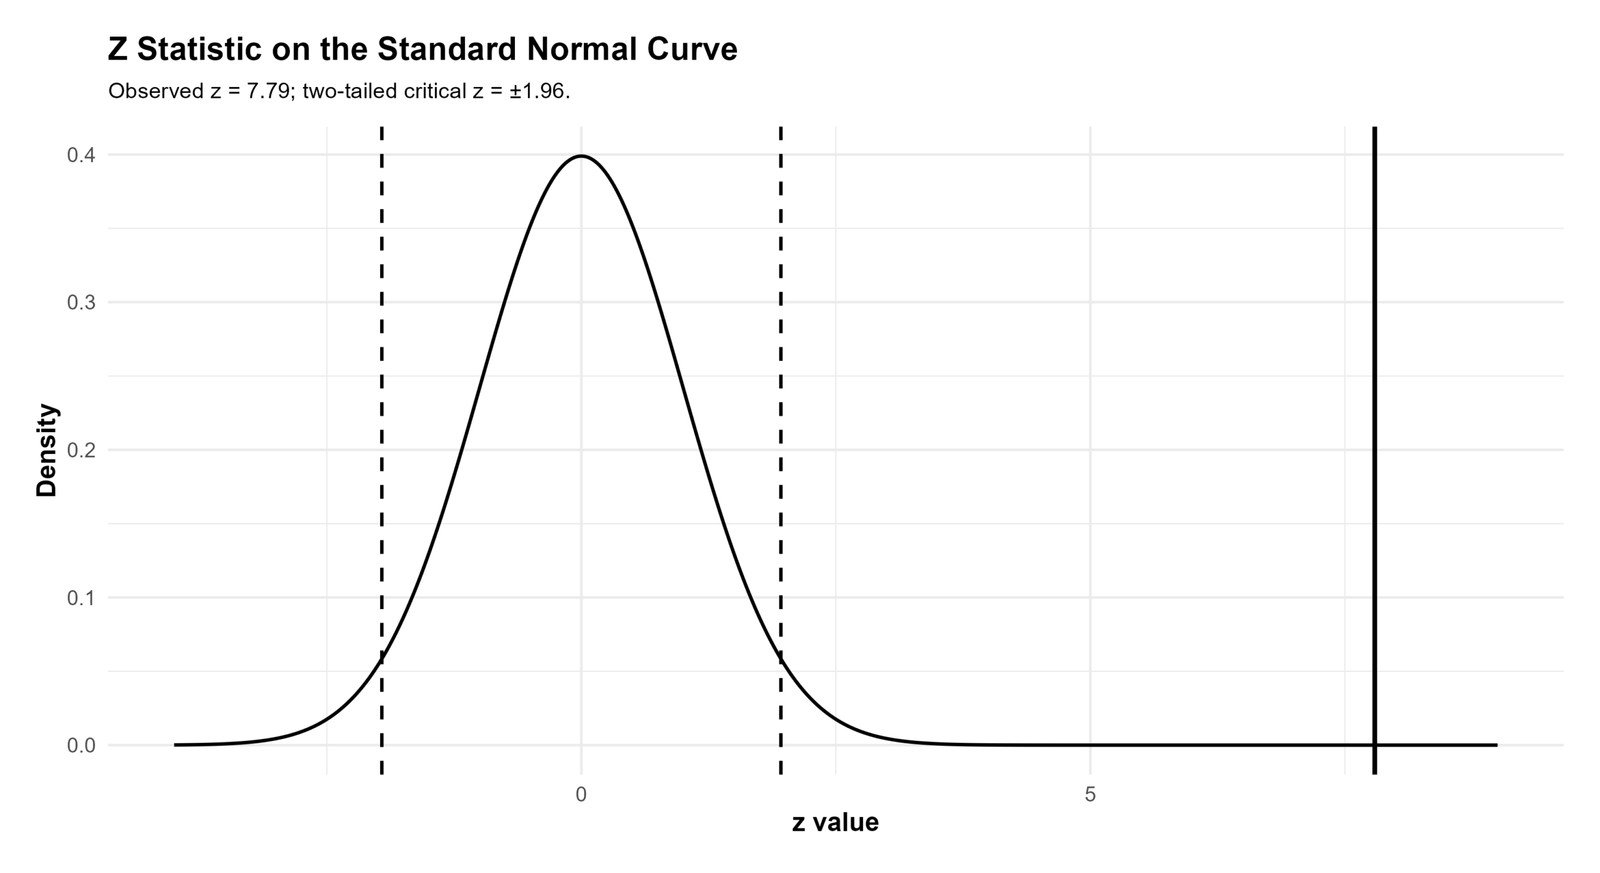
The Python standard normal curve chart shows the observed z statistic at approximately 7.79. This is far beyond the usual two-tailed rejection boundaries of ±1.96.
This image explains the p-value decision. Under the null hypothesis of equal means, a z value this extreme would be very unlikely. Therefore, the result is statistically significant.
The Python curve confirms the formal decision: reject the null hypothesis and conclude that GP and MS have significantly different mean G3 scores.
5. Python Chart: Standard Error Components
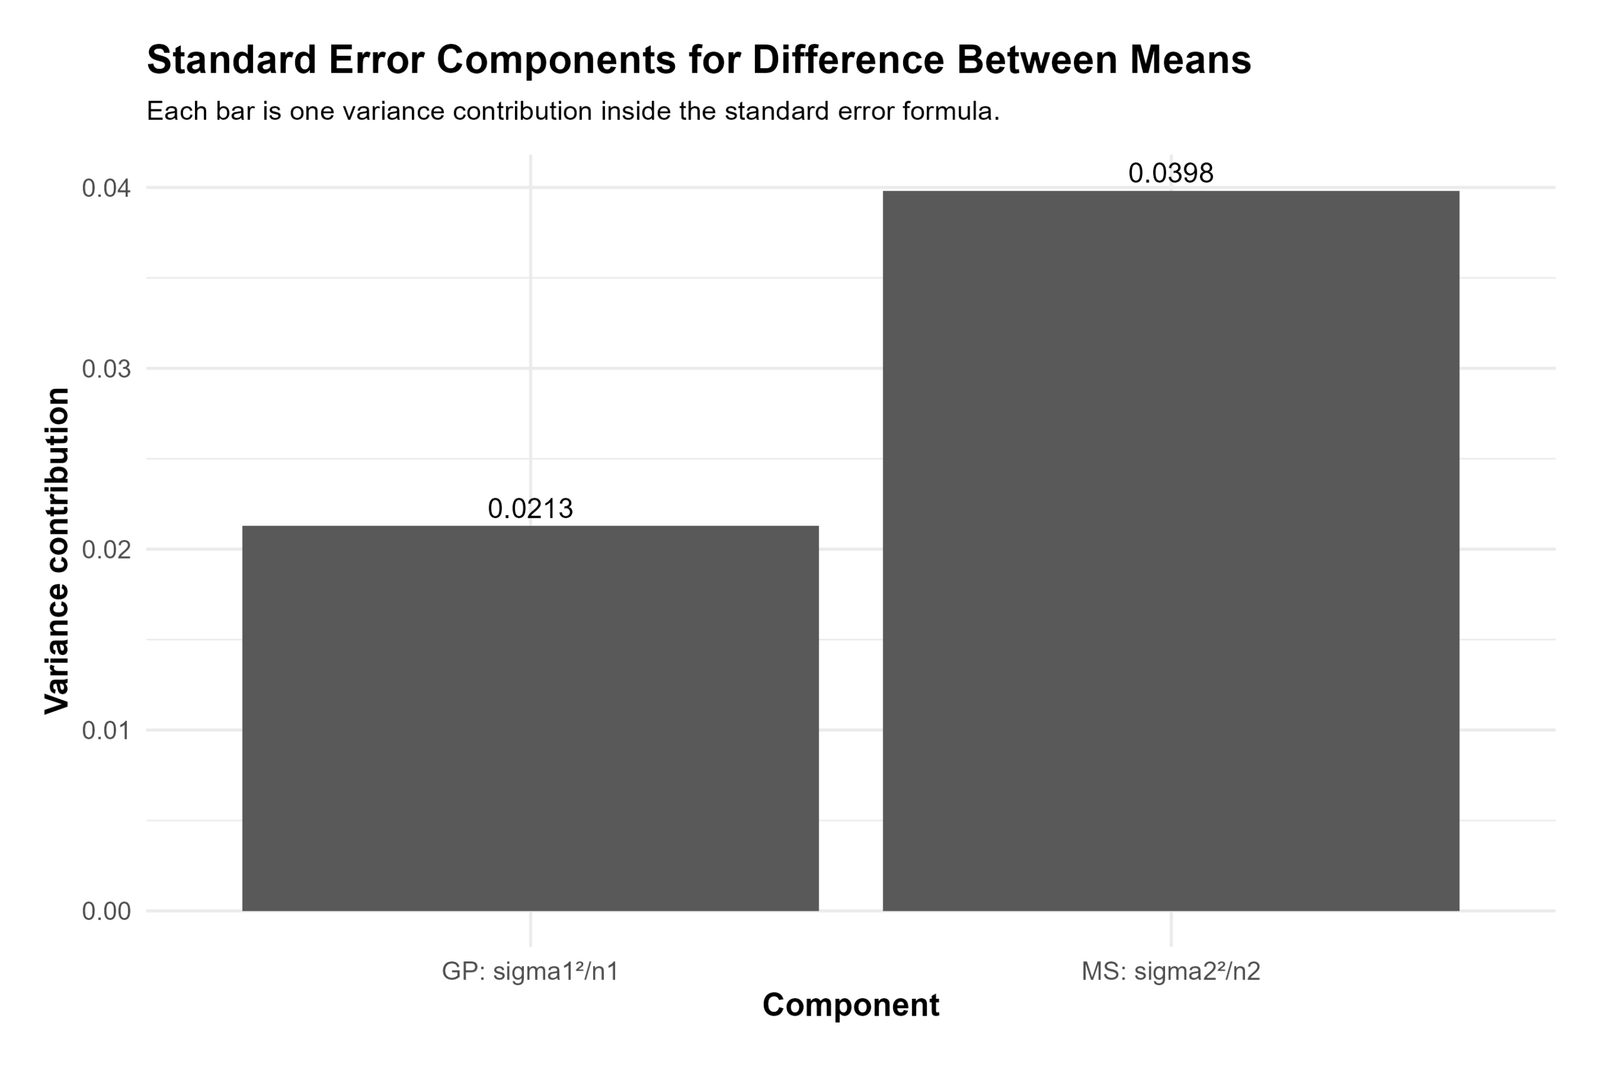
This Python chart explains the denominator of the z statistic. The GP standard-error component is 0.0213, and the MS standard-error component is 0.0398. These are the two variance contributions inside the standard error formula.
The MS component is larger than the GP component. This means the MS group contributes more to the uncertainty in the difference between means. The total variance contribution is approximately 0.0611, and the standard error is the square root of that value, approximately 0.247.
This chart is important because it shows that the z statistic is not based only on the raw difference of 1.926. The test compares that difference with the expected sampling uncertainty. Since the difference is large relative to SE ≈ 0.247, the z statistic becomes very large.
6. Python Chart: Mean G3 by Sex Within School
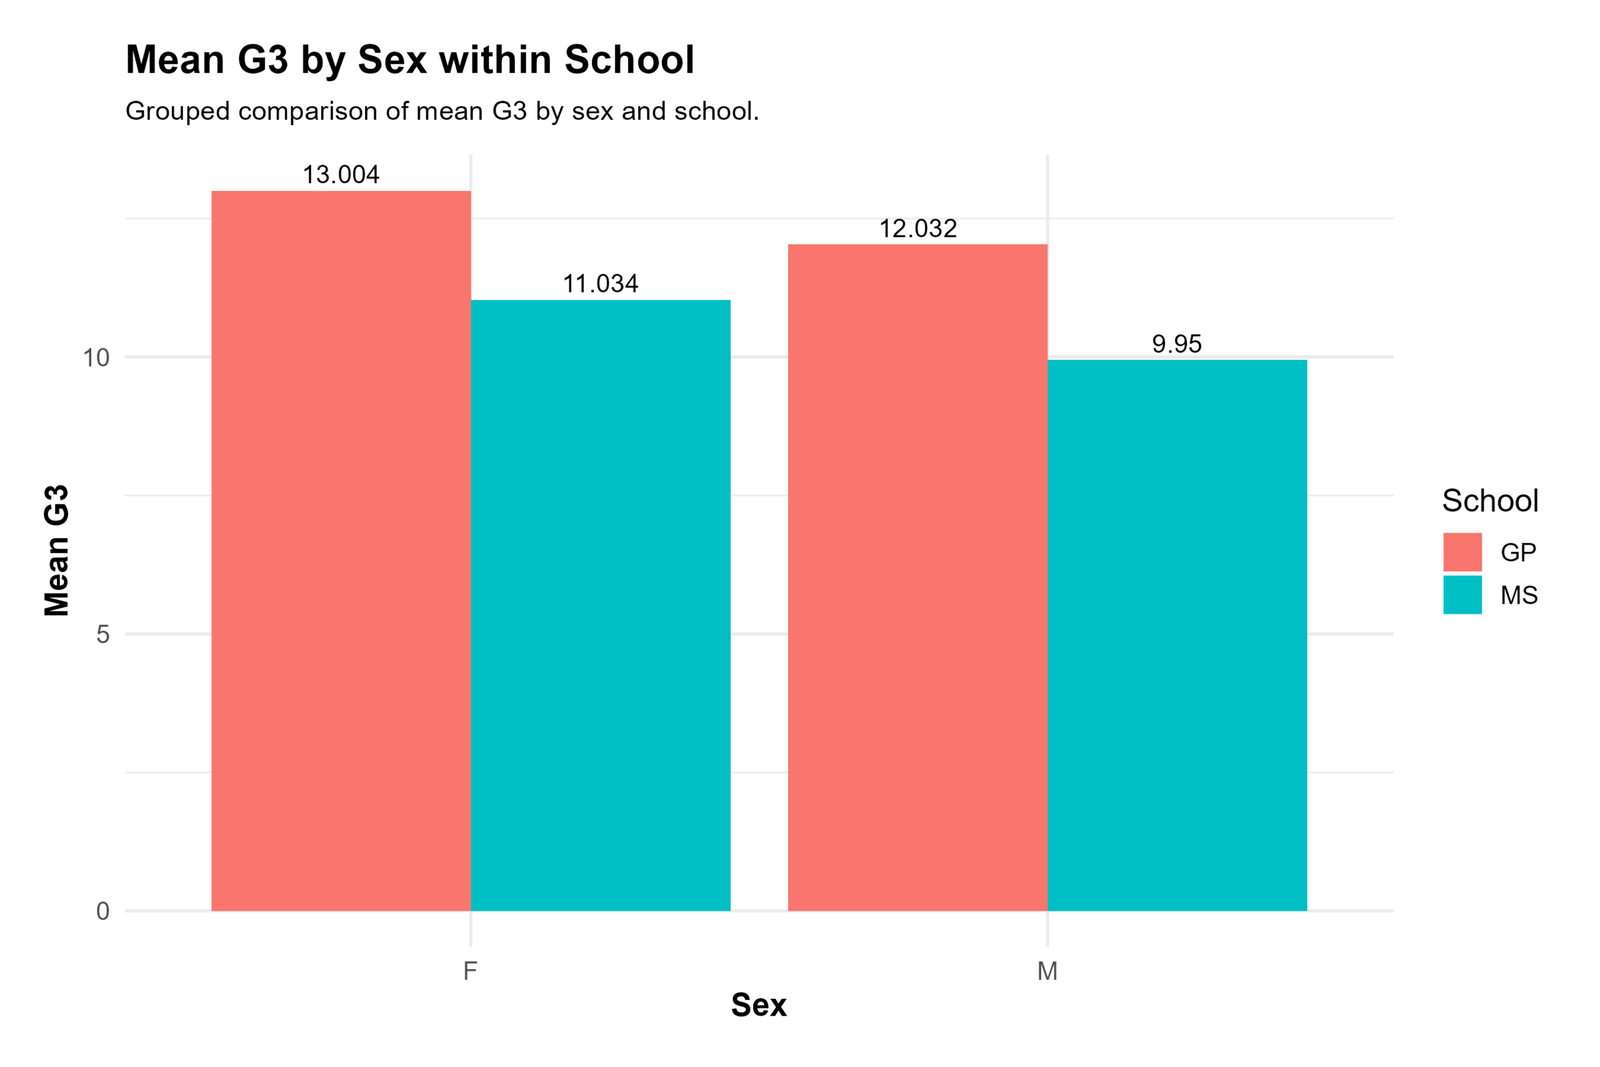
The Python sex-within-school chart gives exact subgroup means. For female students, GP has mean G3 13.004 and MS has mean G3 11.034. For male students, GP has mean G3 12.032 and MS has mean G3 9.950.
In both sex categories, GP has a higher mean than MS. This supports the descriptive interpretation that the school difference is not limited to one sex group.
The chart is still descriptive. The formal z test is the overall comparison between GP and MS means. A separate model would be needed to test sex effects or school-by-sex interaction.
7. Python Chart: Mean G3 by Study Time Within School
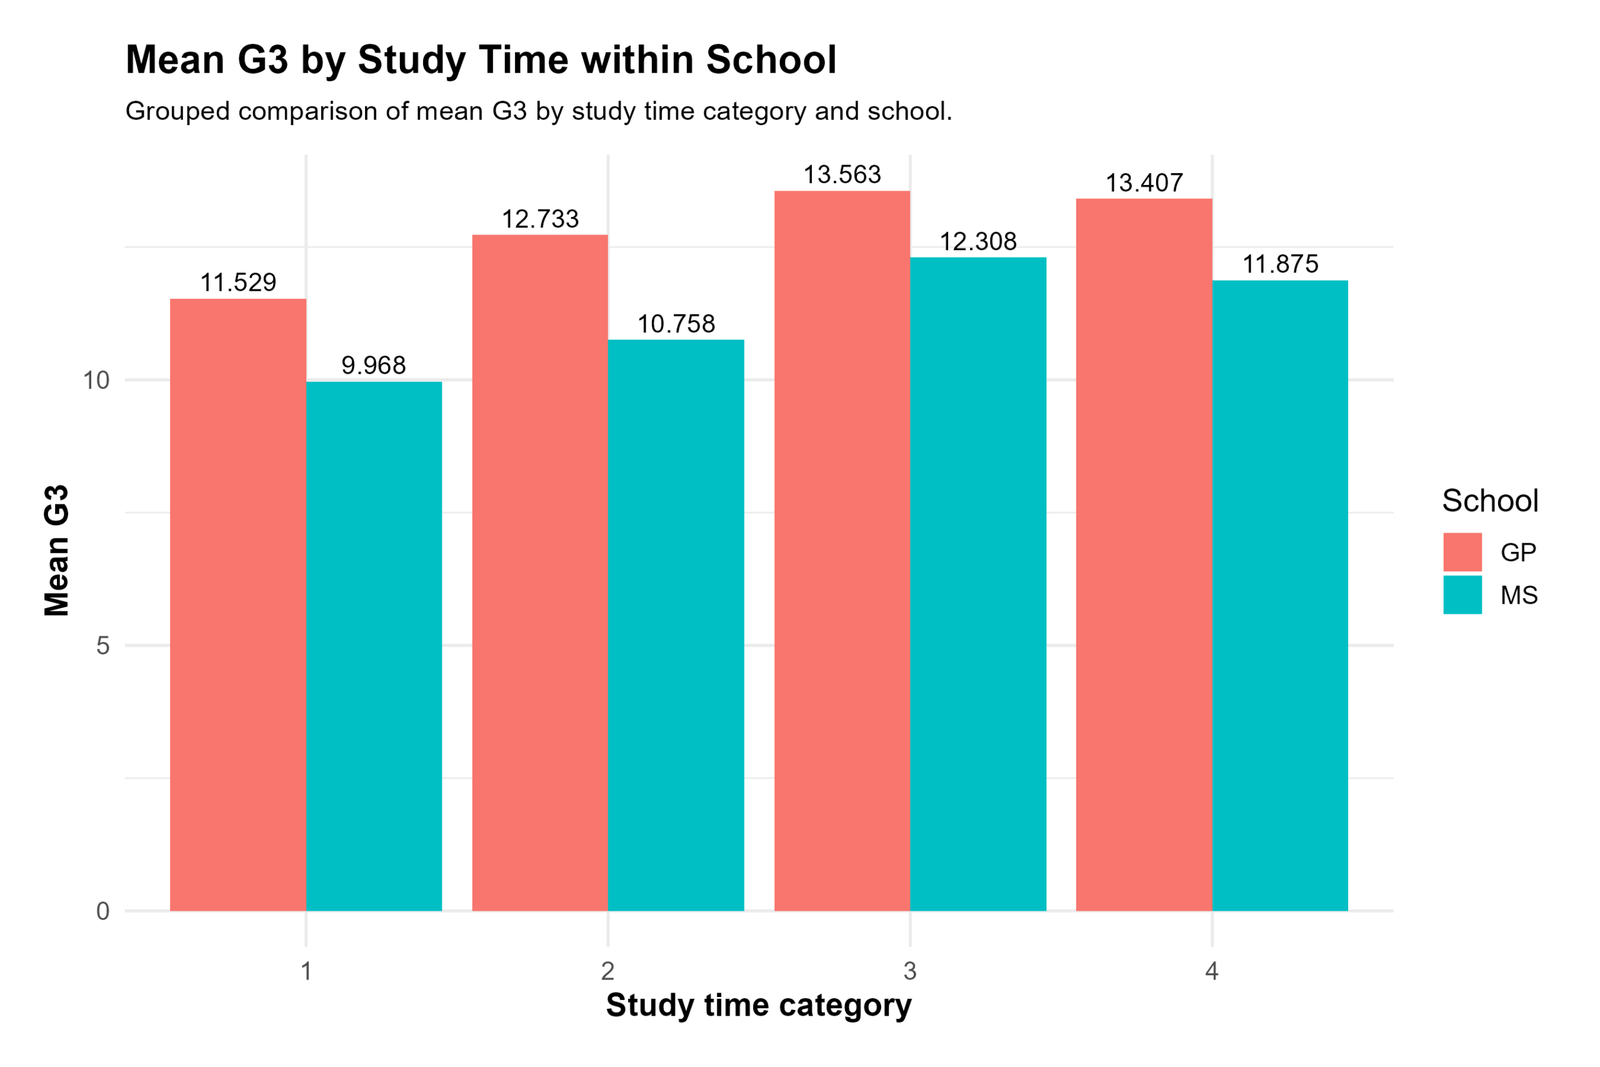
The Python study-time chart shows that GP has a higher mean G3 than MS in every displayed study-time category. The exact values are: category 1, GP = 11.529 and MS = 9.968; category 2, GP = 12.733 and MS = 10.758; category 3, GP = 13.563 and MS = 12.308; category 4, GP = 13.407 and MS = 11.875.
The pattern is consistent: GP remains above MS across study-time groups. This gives descriptive support for the overall school difference.
The chart does not replace an adjusted regression or ANOVA model. It is included to explain the data structure behind the overall z test.
R Validation Charts and Interpretation
The R validation charts provide another independent software view of the same result. R confirms the group distributions, mean comparison, confidence interval, z curve, standard error components and subgroup patterns.
1. R Chart: G3 Distribution by School
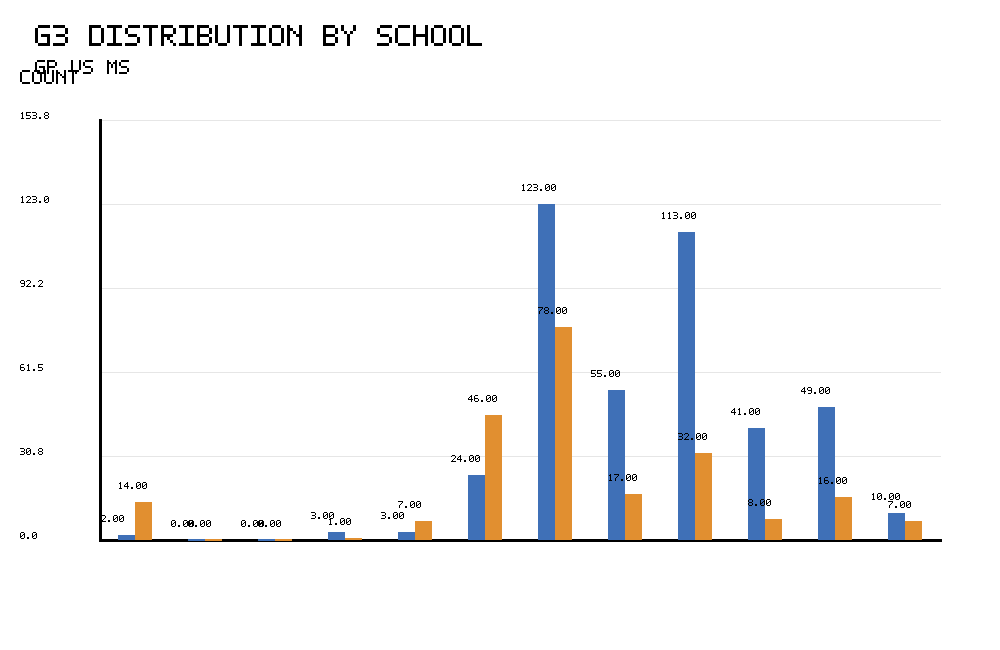
The R distribution chart confirms that the GP distribution has a higher center than the MS distribution. The group means are 12.577 for GP and 10.650 for MS.
The mean lines show that GP is shifted upward compared with MS. This matches the SPSS and Python images and confirms the same raw data pattern.
The R chart supports the final conclusion because the group mean difference is visible before standardization.
2. R Chart: Group Mean Comparison
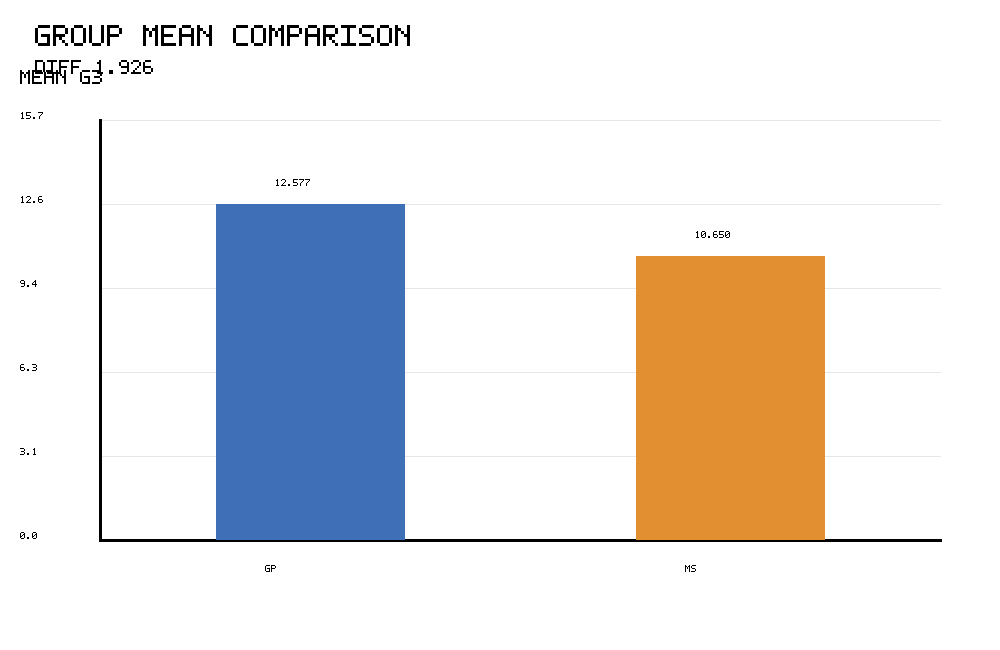
The R group-mean comparison confirms GP = 12.577 and MS = 10.650. The visual gap between the groups is the mean difference tested in the z test.
The difference is 1.926 grade points. This means GP students have a higher average final grade than MS students in the sample.
Because R confirms the same mean values, it validates the consistency of the analysis across software workflows.
3. R Chart: Confidence Interval for Difference Between Means
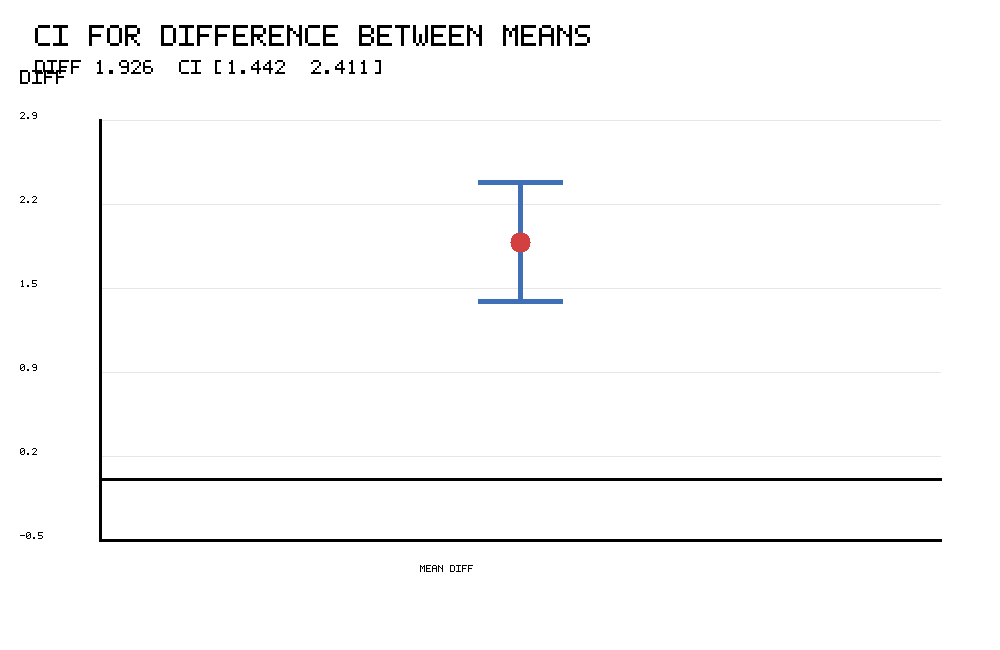
The R confidence interval chart confirms the same interval: [1.442, 2.411]. The point estimate is 1.926.
The interval stays fully above zero. This means the population mean difference is estimated to be positive, with GP higher than MS.
The interval supports the null-hypothesis decision because a 95% interval that does not include zero corresponds to rejecting equal means at the 5% level.
4. R Chart: Z Statistic on the Standard Normal Curve
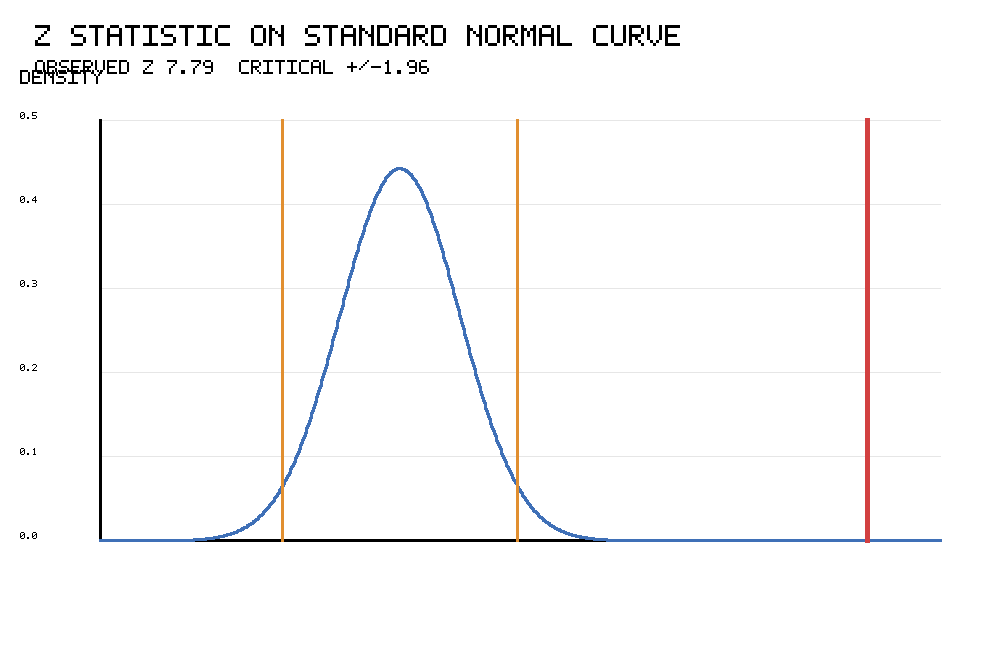
The R standard normal curve chart shows the observed z statistic around 7.79. This is far beyond the ordinary rejection cutoffs of ±1.96.
A z value this extreme means the observed difference would be highly unlikely if the two population means were truly equal.
The R chart supports the same final decision as SPSS and Python: reject the null hypothesis and conclude that GP and MS differ in mean G3 final grade.
5. R Chart: Standard Error Components
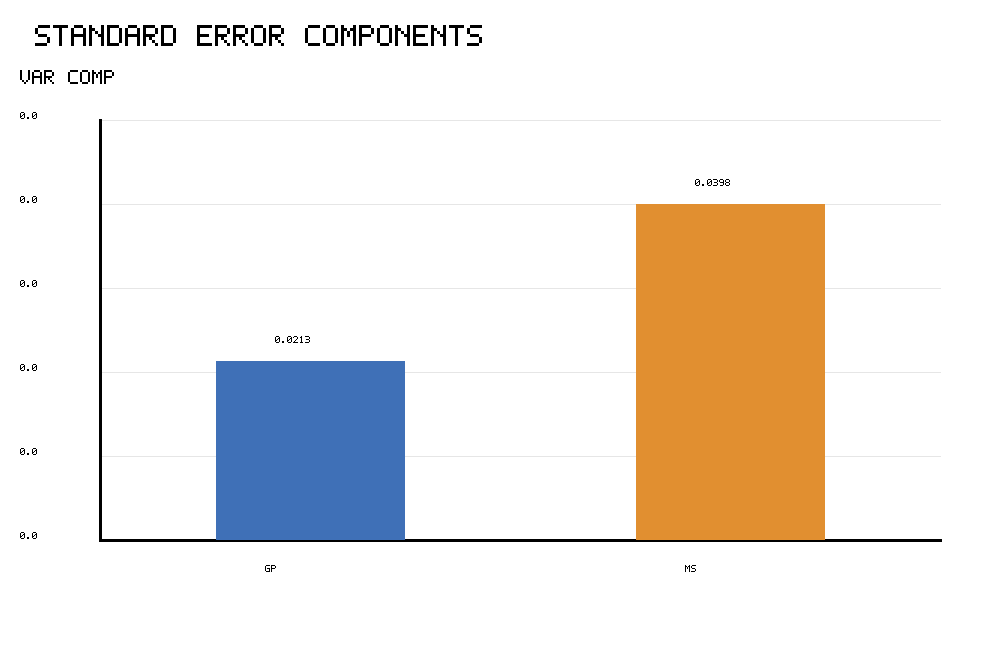
The R standard-error components chart confirms the two variance contributions used inside the standard error formula. The GP component is 0.0213, and the MS component is 0.0398.
The MS component is larger, so it contributes more uncertainty to the difference between means. The combined contribution is about 0.0611, and the square root gives a standard error of about 0.247.
This chart helps readers understand the mechanics of the test. The z statistic is large because the observed difference, 1.926, is much larger than the standard error.
6. R Chart: Mean G3 by Sex Within School
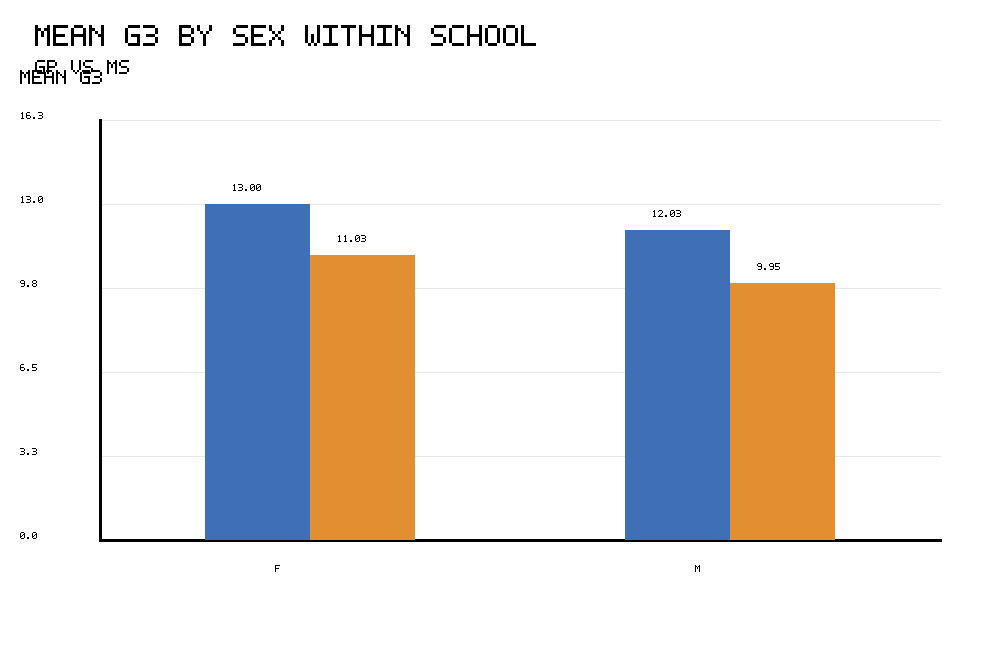
The R sex-within-school chart confirms that GP has higher mean G3 scores in both sex categories. For female students, GP is 13.004 and MS is 11.034. For male students, GP is 12.032 and MS is 9.950.
This subgroup pattern supports the descriptive conclusion that the GP advantage is visible in both female and male groups.
The formal test is still the overall z test for difference between means. The sex chart is included to explain the data pattern more clearly.
7. R Chart: Mean G3 by Study Time Within School
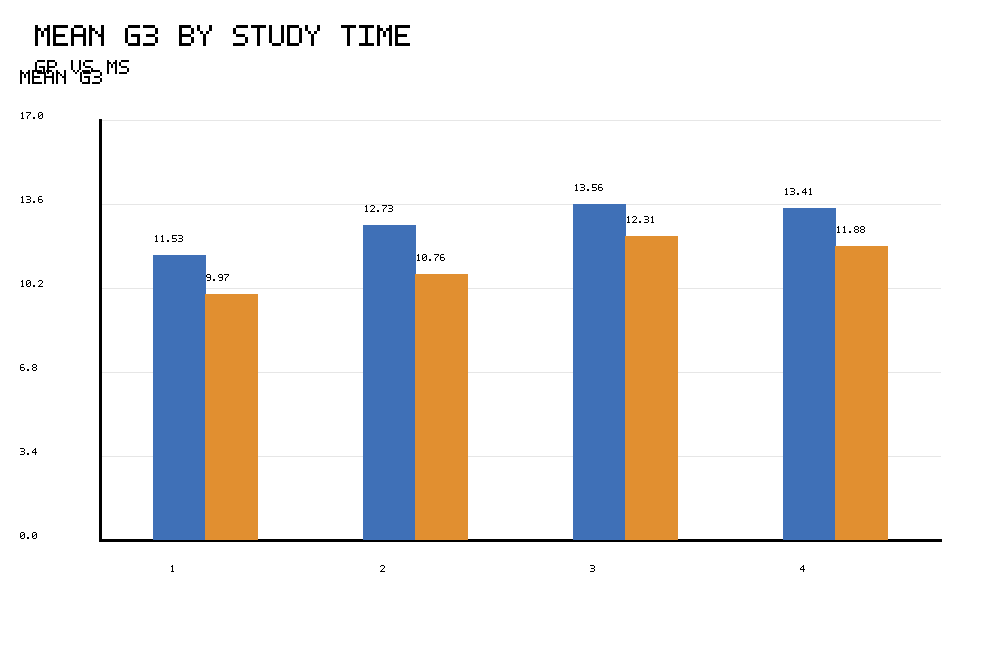
The R study-time chart confirms the same category pattern. Study-time category 1 has GP = 11.529 and MS = 9.968. Category 2 has GP = 12.733 and MS = 10.758. Category 3 has GP = 13.563 and MS = 12.308. Category 4 has GP = 13.407 and MS = 11.875.
GP is higher than MS across all four study-time categories. This provides descriptive support for the overall result.
The chart is not an adjusted test. It is a validation and interpretation chart that helps readers understand the school pattern across study-time levels.
Overall Interpretation of All SPSS, Python and R Images
All image sets tell the same statistical story. The distribution images show that GP is centered higher than MS. The mean comparison images show 12.577 versus 10.650. The confidence interval images show a difference of 1.926 with 95% CI [1.442, 2.411]. The standard-error component images show 0.0213 and 0.0398. The standard normal curve images show z = 7.79, far into the rejection region.
| Image type | Main message | How it supports the test |
|---|---|---|
| G3 distribution images | GP distribution is centered higher than MS | Shows the raw data context for the mean comparison. |
| Group mean comparison images | GP = 12.577 and MS = 10.650 | Shows the observed difference between means. |
| Confidence interval images | Difference = 1.926, 95% CI [1.442, 2.411] | Shows the difference is positive and does not include zero. |
| Z curve images | Observed z = 7.79 | Shows the result is far beyond ±1.96. |
| Standard-error component images | GP = 0.0213 and MS = 0.0398 | Explains the denominator of the z statistic. |
| Sex subgroup images | GP is higher for female and male students | Provides descriptive subgroup context. |
| Study-time subgroup images | GP is higher in every study-time category | Provides descriptive context across study-time groups. |
The final decision is consistent across SPSS, Python and R: reject the null hypothesis. The mean G3 final grade is significantly different between GP and MS, and GP has the higher mean.
How to Run Z Test for Difference Between Means in SPSS, Python, R and Excel
SPSS Method
SPSS can calculate the group means using descriptive statistics. The z statistic can then be computed from the group means and standard-error components.
* Z Test for Difference Between Means in SPSS.
* Compare mean G3 between GP and MS.

MEANS TABLES=G3 BY school
  /CELLS=COUNT MEAN STDDEV.

* Enter exact summary values from the output.
INPUT PROGRAM.
DATA LIST FREE /mean_GP mean_MS se_component_GP se_component_MS.
BEGIN DATA
12.577 10.650 0.0213 0.0398
END DATA.
END FILE.
END INPUT PROGRAM.

COMPUTE diff = mean_GP - mean_MS.
COMPUTE se_diff = SQRT(se_component_GP + se_component_MS).
COMPUTE z_value = diff / se_diff.
COMPUTE p_value_two_tailed = 2 * (1 - CDF.NORMAL(ABS(z_value), 0, 1)).
COMPUTE ci_95_low = diff - 1.96 * se_diff.
COMPUTE ci_95_high = diff + 1.96 * se_diff.
EXECUTE.

FORMATS diff se_diff z_value p_value_two_tailed ci_95_low ci_95_high (F12.6).
LIST.
Python Method
Python can calculate the z test for difference between means using direct formulas from the exact summary values.
import math

mean_gp = 12.577
mean_ms = 10.650

se_component_gp = 0.0213
se_component_ms = 0.0398

diff = mean_gp - mean_ms
se_diff = math.sqrt(se_component_gp + se_component_ms)
z_value = diff / se_diff

p_value_two_tailed = math.erfc(abs(z_value) / math.sqrt(2))

ci_low = diff - 1.96 * se_diff
ci_high = diff + 1.96 * se_diff

decision = "Reject H0" if abs(z_value) > 1.96 else "Fail to reject H0"

print("GP mean:", mean_gp)
print("MS mean:", mean_ms)
print("Difference:", diff)
print("SE:", se_diff)
print("z:", z_value)
print("p-value:", p_value_two_tailed)
print("95% CI:", ci_low, ci_high)
print("Decision:", decision)
R Method
R can reproduce the same result with direct formula calculation.
mean_gp <- 12.577
mean_ms <- 10.650

se_component_gp <- 0.0213
se_component_ms <- 0.0398

diff <- mean_gp - mean_ms
se_diff <- sqrt(se_component_gp + se_component_ms)
z_value <- diff / se_diff

p_value_two_tailed <- 2 * (1 - pnorm(abs(z_value)))

ci_low <- diff - 1.96 * se_diff
ci_high <- diff + 1.96 * se_diff

decision <- ifelse(abs(z_value) > 1.96, "Reject H0", "Fail to reject H0")

data.frame(
  mean_gp = mean_gp,
  mean_ms = mean_ms,
  difference = diff,
  se = se_diff,
  z_value = z_value,
  p_value = p_value_two_tailed,
  ci_low = ci_low,
  ci_high = ci_high,
  decision = decision
)
Excel Method
Excel can calculate the z test for difference between means using the exact output values.
| Excel item | Formula | Purpose |
|---|---|---|
| GP mean | =12.577 | Stores the GP mean. |
| MS mean | =10.650 | Stores the MS mean. |
| Mean difference | =GP_mean_cell-MS_mean_cell | Calculates GP − MS. |
| Total variance contribution | =0.0213+0.0398 | Adds standard-error components. |
| Standard error | =SQRT(total_variance_cell) | Calculates standard error. |
| Z statistic | =difference_cell/se_cell | Calculates z. |
| Two-tailed p-value | =2*(1-NORM.S.DIST(ABS(z_cell),TRUE)) | Calculates p-value. |
| 95% CI lower | =difference_cell-1.96*se_cell | Lower confidence bound. |
| 95% CI upper | =difference_cell+1.96*se_cell | Upper confidence bound. |
How to Report the Z Test for Difference Between Means
A complete report should include the two groups, group means, mean difference, standard error, z statistic, p-value, confidence interval and decision.
APA-style report: A z test for difference between means was conducted to compare mean G3 final grade between GP and MS schools. GP had a higher mean G3 score (M = 12.577) than MS (M = 10.650). The mean difference was statistically significant, difference = 1.926, z = 7.79, p < .001, 95% CI [1.442, 2.411]. Therefore, the null hypothesis of equal means was rejected.
In plain language, GP students scored about 1.93 G3 grade points higher than MS students on average. The confidence interval suggests the population difference is likely between about 1.44 and 2.41 grade points.
Common Mistakes in Z Test for Difference Between Means
1. Confusing a mean test with a proportion test
This test compares two means. If the outcome is pass/fail, use a Two Proportion Z Test.
2. Using a one-sample test for two groups
If there are two independent groups, use a difference-between-means test. A One Sample Z Test compares one sample mean with one benchmark.
3. Ignoring the standard deviation condition
A formal z test assumes known population standard deviations. If standard deviations are unknown and estimated from the sample, a t test is usually preferred.
4. Reporting p = .000
Do not report p = .000. If the p-value is very small, write p < .001.
5. Treating subgroup charts as adjusted tests
The sex and study-time charts are descriptive context. They do not replace a formal adjusted regression or ANOVA model.
6. Ignoring practical meaning
A statistically significant result should also be interpreted in original units. Here, the difference is about 1.93 grade points on a 0 to 20 G3 scale.
FAQs About Z Test for Difference Between Means
What is a Z Test for Difference Between Means?
A Z Test for Difference Between Means is a hypothesis test used to compare the means of two independent groups when the z-test conditions are satisfied.
What is the formula for Z Test for Difference Between Means?
The formula is z = (x̄1 − x̄2) / sqrt[(σ1² / n1) + (σ2² / n2)].
What was the result in this example?
GP had mean G3 = 12.577 and MS had mean G3 = 10.650. The difference was 1.926, the 95% CI was [1.442, 2.411], and the observed z statistic was 7.79. The null hypothesis was rejected.
What does the confidence interval mean?
The confidence interval [1.442, 2.411] means the GP mean is estimated to be about 1.44 to 2.41 G3 grade points higher than the MS mean.
When should I use this test?
Use it when comparing two independent means for a numeric outcome and when population standard deviations are known or when a valid large-sample z workflow is being used.
Is this the same as a Two Sample Z Test?
Yes. A z test for difference between means is commonly described as a two sample z test for means.
Is this the same as a Two Proportion Z Test?
No. This test compares two means. A Two Proportion Z Test compares two proportions, such as pass rates.
Can I run Z Test for Difference Between Means in Excel?
Yes. Excel can calculate the mean difference, standard error, z statistic, p-value and confidence interval using formulas such as SQRT and NORM.S.DIST.
Should I use a t test instead?
Use a two-sample t test when population standard deviations are unknown and must be estimated from sample data, especially in smaller samples.
How do I report a very small p-value?
Report very small p-values as p < .001 instead of p = .000.

