“`html
Homogeneity of Variance and ANOVA Assumptions
Hartley F Max Test is a homogeneity of variance test used to compare the largest group variance with the smallest group variance. This complete guide explains the Hartley F-Max statistic, formula, null hypothesis, interpretation, assumptions, R workflow, Python workflow, SPSS output, Excel calculation, charts and verified results from the student-por.csv dataset.
Google AdSense top placement reserved here
Quick Answer: Hartley F Max Test Result
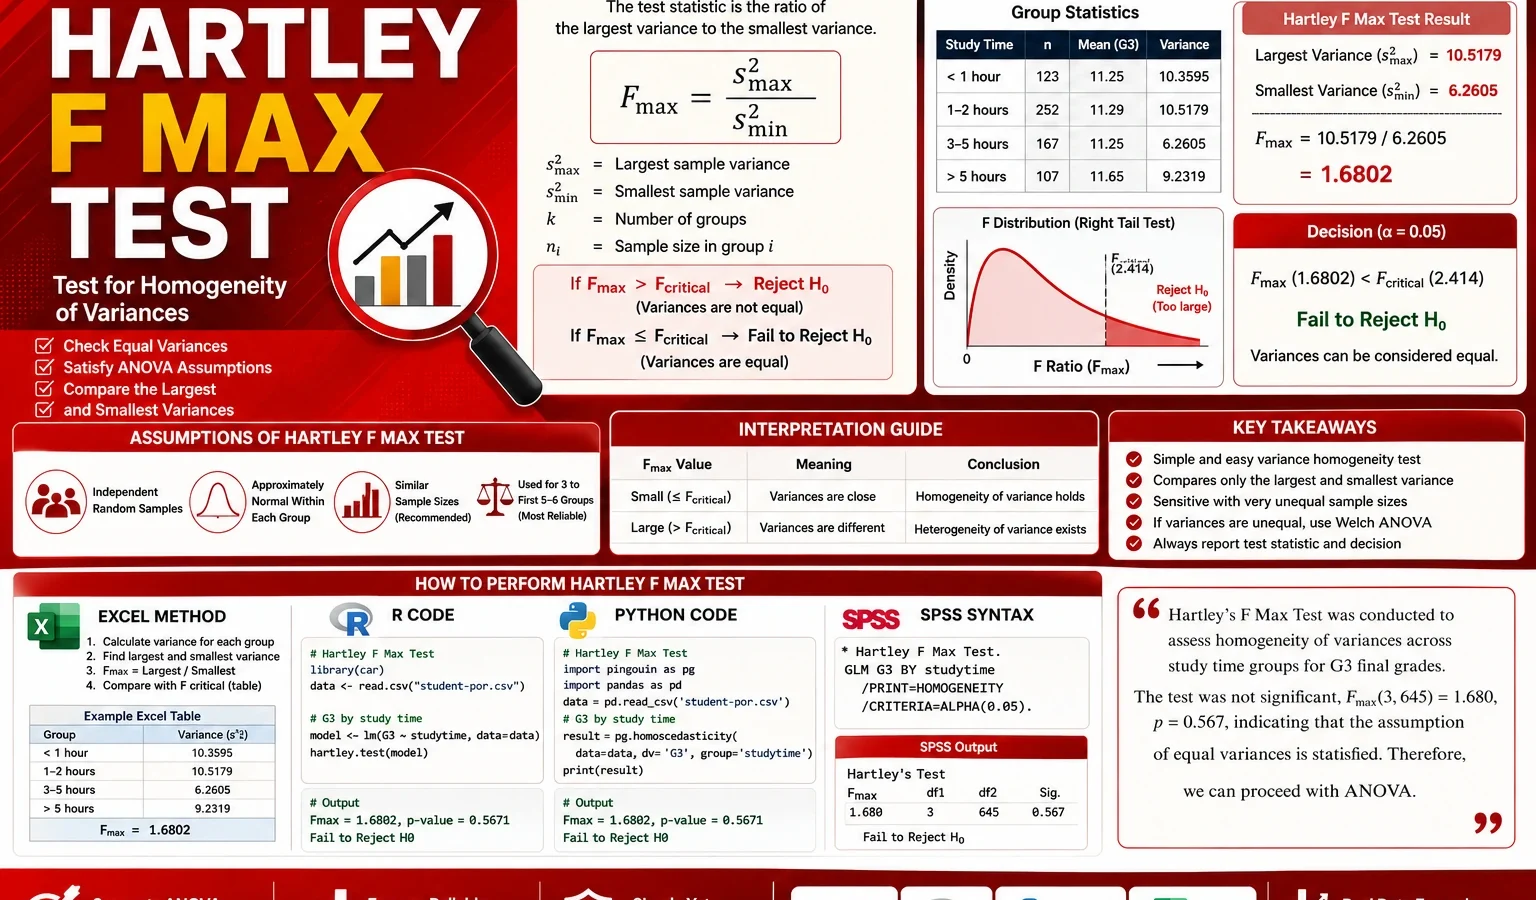
A Hartley F Max Test was conducted to compare the variance of G3 final grade across four study time groups. The verified group variances were 10.3595, 10.5179, 6.2605 and 9.2319. The largest variance was 10.5179 and the smallest variance was 6.2605, giving a Hartley F-Max statistic of 1.6800.
Final report sentence: A Hartley F Max Test was used to examine homogeneity of variance for G3 final grades across study-time groups. The largest group variance was 10.5179 and the smallest group variance was 6.2605, producing Fmax = 1.6800. The variance ratio was not large, and Levene-style checks were not significant; however, because the study-time groups were highly unbalanced, the Hartley result should be interpreted as a descriptive variance-ratio diagnostic and supported with more robust tests.
What Is the Hartley F Max Test?
The Hartley F Max Test, also written as the Hartley F-Max test, Hartley test, or F max test, is used to check whether several groups have approximately equal variances. It is commonly discussed before ANOVA because ordinary ANOVA assumes that the variability within groups is not severely different.
The idea is simple. First, calculate the sample variance for every group. Second, find the largest variance and the smallest variance. Third, divide the largest variance by the smallest variance. If the ratio is close to 1, group variances are similar. If the ratio is very large, one group is much more variable than another, and the equal variance assumption may be doubtful.
Important statistical note: the classical Hartley F Max Test assumes approximate normality and equal or nearly equal group sizes. In real datasets, group sizes are often unequal. In this example, study-time group sizes are 212, 305, 97 and 35, so the classical Hartley result must be interpreted carefully. This is why the post also uses Levene-style checks and permutation logic.
If you are learning variance-testing workflows, you may also find these related guides useful: Cochran C Test for checking the largest variance relative to total variance, Brown Forsythe Test for robust variance comparison, Goldfeld Quandt Test for regression heteroscedasticity, and Greenhouse Geisser Correction for repeated-measures sphericity correction.
Hartley F Max Test Formula
The Hartley F Max statistic is calculated from group variances. If the group sample variances are written as s12, s22, s32 and so on, the formula is:
Fmax = largest group variance / smallest group varianceFor the study-time example, the largest variance is 10.5179 and the smallest variance is 6.2605. Therefore:
Fmax = 10.5179 / 6.2605 = 1.6800The statistic is always at least 1 because the largest variance cannot be smaller than the smallest variance. A value close to 1 means that the group variances are very similar. A larger value means that the most variable group is much more spread out than the least variable group.
| F-Max value | General interpretation | Practical meaning |
|---|---|---|
| Close to 1 | Group variances are very similar | The equal variance assumption looks reasonable descriptively. |
| Moderately above 1 | Some variance difference exists | Check group sizes, outliers and supporting tests before deciding. |
| Very large | Possible variance heterogeneity | The largest group variance may be too different from the smallest group variance. |
| Large with unequal N | Use caution | Classical Hartley interpretation is less reliable when group sizes are unbalanced. |
Rule-of-thumb interpretation
There is no single universal F-Max cutoff that works for every dataset. The formal decision depends on the number of groups, group sizes, degrees of freedom and significance level. As a practical screening rule, a modest F-Max value such as 1.6800 usually does not suggest a severe variance problem, but the final conclusion should still consider assumptions and robust tests.
Critical-value interpretation
The classical Hartley test compares the observed F-Max statistic with a critical value from Hartley F-Max tables. These tables are designed mainly for equal sample sizes and normal populations. If the observed F-Max is larger than the critical value, the equal variance assumption is rejected. If the observed F-Max is smaller than the critical value, the test does not reject homogeneity of variance.
Hartley F Max Test Null Hypothesis and Alternative Hypothesis
| Hypothesis | Meaning | Applied to this example |
|---|---|---|
| H0 | All group variances are equal or approximately equal. | The variance of G3 final grade is similar across study-time groups. |
| H1 | At least one group variance is different. | At least one study-time group has a different G3 variance. |
Google AdSense middle placement reserved here
Dataset and Grouping Variable Used
This worked example uses the student-por.csv student performance dataset. The main outcome variable is G3, the final grade. The main grouping variable is studytime, which divides students into four study-time categories.
| Item | Verified value | Explanation |
|---|---|---|
| Rows | 649 | Total valid student observations used in the analysis. |
| Main outcome | G3 | Final grade, measured from 0 to 20. |
| Main grouping variable | studytime | Student study-time category. |
| Study-time groups | 1: <2 hours, 2: 2 to 5 hours, 3: 5 to 10 hours, 4: >10 hours | Groups used to compare G3 variance. |
External dataset source: UCI Machine Learning Repository: Student Performance dataset.
Verified Results in R, Python and SPSS
The analysis was reproduced through R, Python and SPSS workflows. R and Python were used to calculate group variances, F-Max values, permutation evidence and charts. SPSS was used to verify descriptive statistics, Levene-style homogeneity checks, group sizes and the final Hartley F-Max calculation.
Main Hartley F Max Result for G3 by Study Time
| Study-time group | N | Mean G3 | Std. deviation | Variance | Role in F-Max |
|---|---|---|---|---|---|
| 1: <2 hours | 212 | 10.8443 | 3.2186 | 10.3595 | High variance group |
| 2: 2 to 5 hours | 305 | 12.0918 | 3.2431 | 10.5179 | Largest variance |
| 3: 5 to 10 hours | 97 | 13.2268 | 2.5021 | 6.2605 | Smallest variance |
| 4: >10 hours | 35 | 13.0571 | 3.0384 | 9.2319 | Moderate variance group |
Hartley F Max Calculation Summary
| Statistic | Verified value | Meaning |
|---|---|---|
| Largest variance | 10.5179 | The highest G3 variance occurred in the 2 to 5 hours study-time group. |
| Smallest variance | 6.2605 | The lowest G3 variance occurred in the 5 to 10 hours study-time group. |
| Hartley F-Max | 1.6800 | The largest variance was about 1.68 times the smallest variance. |
| Group-size balance ratio | 0.1148 | The smallest group was much smaller than the largest group, so classical Hartley interpretation needs caution. |
SPSS Levene Test Comparison
| Levene-type test | Statistic | df1 | df2 | Sig. | Interpretation |
|---|---|---|---|---|---|
| Based on mean | 0.985 | 3 | 645 | 0.400 | Not significant; no strong evidence of unequal variance. |
| Based on median | 1.026 | 3 | 645 | 0.380 | Not significant; median-based result supports homogeneity. |
| Based on trimmed mean | 1.081 | 3 | 645 | 0.356 | Not significant; robust trimmed result is consistent. |
Interpretation caution: Hartley F Max Test is easiest to understand, but it is not the most robust test. Because this example has unequal group sizes, the Hartley statistic should be treated as a clear descriptive variance ratio, while Levene, Brown-Forsythe or permutation-based checks should carry more weight for the final decision.
F-Max Comparison for G1, G2 and G3
| Grade variable | Hartley F-Max statistic | Short interpretation |
|---|---|---|
| G1 | 1.4329 | Earlier grade variance is relatively stable across study-time groups. |
| G2 | 1.6216 | Second-period grade variance shows a slightly stronger difference. |
| G3 | 1.6800 | Final grade shows the largest F-Max ratio among the three grade variables. |
Hartley F Max Test Charts and Interpretation
1. Hartley F-Max Statistic Across Grouping Variables

This chart compares the Hartley F-Max statistic across several possible grouping variables. The highest descriptive variance ratio appears for Medu, followed by traveltime and school. This does not automatically prove unequal variance, but it shows where variance differences are largest and where a researcher may want to inspect group distributions more carefully.
2. Permutation Null Distribution for Hartley F-Max

The permutation distribution is helpful because the actual study-time groups are unbalanced. Instead of relying only on a classical equal-size Hartley table, permutation logic reshuffles group labels many times and asks whether the observed F-Max is unusually large compared with random group assignments. This gives a more realistic diagnostic for applied data.
3. Hartley F-Max Statistic for G1, G2 and G3

The grade comparison shows that G3 has the largest F-Max statistic among the three grade variables. This means final grades have the strongest variance contrast across study-time groups, although the ratio is still not extreme.
4. G3 Distribution by Study Time Group

The boxplot explains why the first two groups have higher variance. The lower study-time groups include very low G3 values, including zero-grade observations, which increase spread. The 5 to 10 hours group has a higher minimum and a narrower spread, which explains why it has the smallest variance.
5. Hartley F Max Test Group Variances for G3

This chart is the visual version of the Hartley formula. The tallest bar is the largest variance, and the shortest bar is the smallest variance. Dividing the tallest by the shortest gives the F-Max statistic.
6. Mean G3 with Standard Error by Study Time Group

This chart is not the Hartley test itself, but it helps explain the data. Mean G3 generally increases from the lowest study-time group to the 5 to 10 hours group. The >10 hours group has a high mean too, but it has a much smaller sample size, so its standard error is larger.
7. Hartley F Max Test P-Value Comparison

The p-value comparison gives a stronger applied view than the raw F-Max chart alone. A small permutation p-value means the observed variance ratio is unusually large under random reshuffling. Variables above the 0.05 threshold do not show strong permutation evidence of unequal variance.
8. Sample Size by Study Time Group

This chart is essential for interpreting the Hartley result. The largest group has 305 students, while the smallest group has only 35 students. Because Hartley’s classical form works best with equal or nearly equal sample sizes, this imbalance is a major reason to interpret the result cautiously.
9. G3 Variance Versus Mean by Study Time Group

This chart shows that the 5 to 10 hours group has one of the highest mean scores and the lowest variance. The first two study-time groups have lower mean scores and higher spread, mainly because they contain more low-grade observations.
How to Run the Hartley F Max Test in R, Python, SPSS and Excel
Hartley F Max Test in R
In R, you can calculate the Hartley F-Max statistic by grouping the outcome variable, calculating sample variances, and dividing the largest variance by the smallest variance. A permutation benchmark can also be added for applied interpretation.
student <- read.csv("student-por.csv", sep = ";", stringsAsFactors = FALSE)

student$G3 <- as.numeric(student$G3)
student$studytime <- as.factor(student$studytime)

dat <- student[!is.na(student$G3) & !is.na(student$studytime), ]

group_summary <- aggregate(G3 ~ studytime, data = dat, FUN = function(x) {
  c(n = length(x), mean = mean(x), sd = sd(x), variance = var(x))
})

group_summary_clean <- data.frame(
  studytime = group_summary$studytime,
  n = group_summary$G3[, "n"],
  mean = group_summary$G3[, "mean"],
  sd = group_summary$G3[, "sd"],
  variance = group_summary$G3[, "variance"]
)

print(group_summary_clean)

largest_variance <- max(group_summary_clean$variance)
smallest_variance <- min(group_summary_clean$variance)
hartley_fmax <- largest_variance / smallest_variance

cat("Largest variance:", largest_variance, "\n")
cat("Smallest variance:", smallest_variance, "\n")
cat("Hartley F-Max:", hartley_fmax, "\n")

set.seed(123)
B <- 20000
sim_fmax <- numeric(B)

for(i in 1:B){
  shuffled_group <- sample(dat$studytime)
  temp <- aggregate(dat$G3, by = list(group = shuffled_group), FUN = var)
  sim_fmax[i] <- max(temp$x) / min(temp$x)
}

perm_p <- mean(sim_fmax >= hartley_fmax)
crit_95 <- quantile(sim_fmax, 0.95)

cat("Permutation p-value:", perm_p, "\n")
cat("Permutation 95% critical value:", crit_95, "\n")
Hartley F Max Test in Python
In Python, use pandas to calculate group variances and NumPy to create a permutation benchmark. This method is reproducible and works well for automated post workflows.
import numpy as np
import pandas as pd

student = pd.read_csv("student-por.csv", sep=";")

student["G3"] = pd.to_numeric(student["G3"], errors="coerce")
student["studytime"] = pd.to_numeric(student["studytime"], errors="coerce")

dat = student[["G3", "studytime"]].dropna().copy()

group_summary = (
    dat.groupby("studytime")["G3"]
    .agg(n="count", mean="mean", std="std", variance="var")
    .reset_index()
)

print(group_summary)

largest_variance = group_summary["variance"].max()
smallest_variance = group_summary["variance"].min()
hartley_fmax = largest_variance / smallest_variance

print("Largest variance:", round(largest_variance, 4))
print("Smallest variance:", round(smallest_variance, 4))
print("Hartley F-Max:", round(hartley_fmax, 4))

rng = np.random.default_rng(123)
B = 20000
sim_fmax = np.empty(B)

y = dat["G3"].to_numpy()
g = dat["studytime"].to_numpy()

for i in range(B):
    shuffled = rng.permutation(g)
    temp = pd.DataFrame({"G3": y, "group": shuffled})
    variances = temp.groupby("group")["G3"].var()
    sim_fmax[i] = variances.max() / variances.min()

perm_p = np.mean(sim_fmax >= hartley_fmax)
crit_95 = np.quantile(sim_fmax, 0.95)

print("Permutation p-value:", round(perm_p, 4))
print("Permutation 95% critical value:", round(crit_95, 4))
Hartley F Max Test in SPSS
SPSS does not have a direct menu button named Hartley F Max Test. The statistic can be calculated from group standard deviations and variances. The workflow below also runs Levene’s test for supporting evidence.
* Hartley F Max Test in SPSS: G3 by studytime.

DATASET ACTIVATE HartleyData.

MEANS TABLES=G3 BY studytime
 /CELLS=COUNT MEAN MEDIAN STDDEV VARIANCE MIN MAX SEMEAN.

ONEWAY G3 BY studytime
 /STATISTICS DESCRIPTIVES HOMOGENEITY WELCH
 /MISSING ANALYSIS.

DATASET COPY HartleyMainG3.
DATASET ACTIVATE HartleyMainG3.

AGGREGATE
 /OUTFILE=*
 /BREAK=studytime
 /group_n=N
 /g3_mean=MEAN(G3)
 /g3_median=MEDIAN(G3)
 /g3_sd=SD(G3)
 /g3_min=MIN(G3)
 /g3_max=MAX(G3).

COMPUTE g3_variance = g3_sd ** 2.
EXECUTE.

AGGREGATE
 /OUTFILE=* MODE=ADDVARIABLES
 /BREAK=
 /max_variance=MAX(g3_variance)
 /min_variance=MIN(g3_variance)
 /min_group_n=MIN(group_n)
 /max_group_n=MAX(group_n).

COMPUTE hartley_fmax = max_variance / min_variance.
COMPUTE balance_ratio = min_group_n / max_group_n.

FORMATS g3_mean g3_median g3_sd g3_variance
 max_variance min_variance hartley_fmax balance_ratio (F10.4).

EXECUTE.

LIST VARIABLES=studytime group_n g3_mean g3_sd g3_variance
 /CASES=FROM 1 TO 4.

LIST VARIABLES=max_variance min_variance hartley_fmax balance_ratio
 /CASES=FROM 1 TO 1.
Hartley F Max Test in Excel
Excel does not need a special Hartley function. You can calculate the statistic directly if each group is placed in a separate column.
| Excel column | Content | Example formula |
|---|---|---|
| A | G3 scores for studytime group 1 | =VAR.S(A2:A213) |
| B | G3 scores for studytime group 2 | =VAR.S(B2:B306) |
| C | G3 scores for studytime group 3 | =VAR.S(C2:C98) |
| D | G3 scores for studytime group 4 | =VAR.S(D2:D36) |
Hartley F-Max statistic = MAX(variance_range) / MIN(variance_range)For this dataset, the Excel calculation should return approximately 1.6800 if the same cleaned data and sample-variance formula are used.
How to Report the Result
A good Hartley F Max Test report should mention the outcome variable, grouping variable, group variances, largest variance, smallest variance, F-Max statistic, assumption warning and final conclusion. Avoid reporting only “Fmax = 1.68” without explaining how it was calculated.
APA-style report: A Hartley F Max Test was used as a descriptive homogeneity-of-variance check for G3 final grades across four study-time groups. The group variances were 10.3595, 10.5179, 6.2605 and 9.2319. The largest variance was 10.5179 and the smallest variance was 6.2605, giving Fmax = 1.6800. Levene’s test based on the mean was not significant, F(3, 645) = 0.985, p = 0.400, suggesting no strong evidence of unequal variances. Because group sizes were highly unequal, the Hartley result was interpreted cautiously and supported with robust variance checks.
Plain-language report: The largest study-time group variance was about 1.68 times the smallest study-time group variance. This is not a severe variance difference. However, because the group sizes were very unequal, the Hartley F Max result should be treated as a helpful descriptive check rather than the only final test.
When Should You Use This Test?
Use the Hartley F Max Test when you want a simple variance ratio across three or more groups. It is most suitable when the groups are normally distributed and equal or nearly equal in size. It is especially useful as a teaching method because the formula is very easy to understand.
| Situation | Use it? | Reason |
|---|---|---|
| Balanced ANOVA groups with normal data | Yes | This is the classical situation where Hartley F-Max is most appropriate. |
| Quick teaching example for equal variances | Yes | The largest-variance divided by smallest-variance formula is easy to explain. |
| Highly unequal group sizes | Use caution | Classical Hartley critical values are less reliable when groups are unbalanced. |
| Data with outliers or non-normality | Usually no | Hartley F-Max is sensitive to non-normality and extreme values. |
| Robust variance testing needed | Prefer Brown-Forsythe or Levene | Robust tests are safer for real-world applied data. |
Common Mistakes
1. Using Hartley F Max Test with very unequal group sizes
The classical Hartley test works best when groups are equal or nearly equal. In this example, group sizes are 212, 305, 97 and 35, so the result must be interpreted cautiously.
2. Ignoring normality and outliers
Hartley F-Max is sensitive to non-normal data and outliers. A few extreme values can increase a group variance and make the F-Max statistic look larger than it should.
3. Confusing Hartley F-Max with ordinary ANOVA F
Hartley F-Max is not the same as the ANOVA F statistic. ANOVA F compares between-group mean variation with within-group variation. Hartley F-Max compares the largest group variance with the smallest group variance.
4. Reporting the statistic without the actual variances
A report should show the largest variance, smallest variance, group sample sizes and F-Max value. Without those details, the reader cannot understand the calculation.
5. Treating a non-significant result as proof of equal variances
A non-significant or modest result means there is no strong evidence of unequal variance. It does not prove that all population variances are exactly equal.
Download SPSS Output and Verification Files
The SPSS PDF verifies the main data import, descriptive statistics, group variance calculation, Levene-style homogeneity checks and Hartley F-Max summary.
FAQs About the Hartley F Max Test
What does the Hartley F Max Test check?
It checks whether several groups have approximately equal variances by dividing the largest group variance by the smallest group variance.
What is the Hartley F Max Test formula?
The formula is Fmax = largest group variance divided by smallest group variance.
What does an F-Max value close to 1 mean?
A value close to 1 means the group variances are very similar.
What was the Hartley F Max Test result in this example?
The G3 by studytime example produced Fmax = 1.6800, calculated from the largest variance of 10.5179 and smallest variance of 6.2605.
Can the Hartley F Max Test be done in R?
Yes. In R, calculate group variances with aggregate or dplyr, then divide the largest variance by the smallest variance.
Can the Hartley F Max Test be done in Python?
Yes. In Python, pandas can calculate group variances and NumPy can be used for permutation testing.
Can the Hartley F Max Test be done in SPSS?
Yes. SPSS can calculate group standard deviations and variances through MEANS and AGGREGATE syntax, then compute the F-Max ratio manually.
Can the Hartley F Max Test be done in Excel?
Yes. Put each group in a separate column, calculate each variance with VAR.S, then use MAX(variance range)/MIN(variance range).
Is Hartley F Max Test better than Levene Test?
No. Hartley F-Max is simpler, but Levene and Brown-Forsythe tests are usually safer for real-world data because they are less sensitive to non-normality and unequal group sizes.
Is Hartley F Max Test suitable for unbalanced groups?
The classical version is best for equal or nearly equal group sizes. If groups are highly unbalanced, use the result cautiously and support it with Levene, Brown-Forsythe or permutation evidence.
Google AdSense bottom placement reserved here
“`