
R-only t.test function, RStudio code, p value, confidence interval and plots
T Test in R: How to Do, Run, Perform and Interpret t.test Results
T Test in R is performed with the built-in t.test() function. This R-only tutorial explains how to do t test in R, how to run t test in R, how to perform t test in R, how to use t.test in R, how to interpret t test results in R, and how to plot t test in R. The worked example compares G3 final grade between GP and MS school groups using the R t.test() function. You will learn one sample t test in R, two sample t test in R, Welch t test in R, paired t test in R, p value interpretation, confidence interval interpretation, R code, R plots and R result tables.
Quick Answer: How to Do T Test in R
To do a T Test in R, use the t.test() function. For a two sample Welch t test in R, use:
For this worked R example, the test compares G3 scores between GP and MS. GP has a higher average G3 score than MS. The R Welch t-test result is significant, so the null hypothesis of equal means is rejected.
Final R result: The R t.test() output shows that GP students have a significantly higher average G3 score than MS students. The p value is below .001, and the confidence interval for the mean difference is positive.
Important R rule: For two independent groups, t.test(G3 ~ school, data = df) runs Welch’s t test by default. To force the equal-variance Student t test, add var.equal = TRUE.
Table of Contents
- What Is a T Test in R?
- T Test in R Formula
- Null and Alternative Hypothesis in R
- Dataset and R Variables Used
- R Output Interpretation
- R Chart-by-Chart Interpretation
- R Assumption and Result Checks
- R Workflow Only
- R Code Blocks
- APA Reporting Wording from R Output
- Common R T Test Mistakes
- When to Use T Test in R
- R Downloads and Resources
- Related R and T Test Guides
- FAQs
What Is a T Test in R?
A T Test in R is a mean-comparison hypothesis test run with the R t.test() function. It tells whether a sample mean or mean difference is statistically significant. R can run one sample t tests, two sample t tests, Welch t tests and paired t tests with one main function.
The attached keyword sheet shows that users search for t.test in r, t test in r, t test in r programming, paired t test in r, two sample t test in r, welch’s t test in r, one sample t test in r, how to do t test in r, t test code in r, and how to interpret t test in r. Therefore, this guide focuses only on R code, R output, R plots and R interpretation.
Simple definition: A T Test in R uses t.test() to calculate a t statistic, degrees of freedom, p value and confidence interval for a mean or mean difference.
Use t.test() when your outcome variable is numeric and your question is about comparing a mean. Related guides include T Test Assumptions, T Test for Unequal Variances, T Test for Equal Variances, P Value, Confidence Interval, and Effect Size.
T Test in R Formula
The R t.test() function calculates the t statistic automatically, but the formula depends on the test type.
One Sample T Test in R Formula
Use this when testing whether one sample mean differs from a fixed value. In R, use t.test(x, mu = 10).
Two Sample T Test in R Formula
Use this when comparing two independent groups. In R, use t.test(G3 ~ school, data = df).
Welch T Test in R Formula
R uses this Welch formula by default for two independent groups unless var.equal = TRUE is specified.
Paired T Test in R Formula
Use this when comparing two related measurements for the same cases. In R, use t.test(after, before, paired = TRUE).
| Keyword / User Intent | Correct R Code | Use This When |
|---|---|---|
| one sample t test in r | t.test(df$G3, mu = 10) | You compare one sample mean with a fixed value. |
| two sample t test in r | t.test(G3 ~ school, data = df) | You compare two independent groups. |
| welch t test in r | t.test(G3 ~ school, data = df, var.equal = FALSE) | You compare independent groups without assuming equal variances. |
| independent t test in r | t.test(G3 ~ school, data = df) | You compare two unrelated groups. |
| paired t test in r | t.test(df$G3, df$G1, paired = TRUE) | You compare two related measurements from the same rows. |
| t.test function in r | t.test() | You need the main R function for t tests. |
Null and Alternative Hypothesis in R
R calculates the output, but the researcher must define the hypotheses. For this worked two sample t test in R, the dependent variable is G3, and the grouping variable is school.
| R T Test | Null Hypothesis | Alternative Hypothesis |
|---|---|---|
| One sample t test in R | H0: μ = μ0 | H1: μ ≠ μ0 |
| Two sample / Welch t test in R | H0: μGP = μMS | H1: μGP ≠ μMS |
| Paired t test in R | H0: μD = 0 | H1: μD ≠ 0 |
Decision for this example: The R Welch t test rejects the null hypothesis because p < .001. GP has a significantly higher mean G3 score than MS.
Dataset and R Variables Used
This T Test in R guide uses a student performance dataset. The main numeric outcome is G3 final grade. The group variable is school, with two levels: GP and MS. The paired t-test example uses G1 and G3.
| R Variable | Role | Used For |
|---|---|---|
G3 | Numeric outcome | One sample, two sample and Welch t test. |
school | Grouping variable | Splits the data into GP and MS. |
G1 | First related measurement | Used with G3 for paired t test in R. |
studytime | Context variable | Used for descriptive plotting by study-time category. |
R Output Interpretation
When you run t.test(G3 ~ school, data = df), R returns the test name, t statistic, degrees of freedom, p value, confidence interval, group means and alternative hypothesis. These are the values needed to interpret the result.
How to Interpret t Statistic in R
The t statistic tells how far the observed mean difference is from zero in standard error units. In this example, the t statistic is large and positive, which supports a strong difference in favor of GP.
How to Interpret p Value from t Test in R
The p value tells how unlikely the observed result would be if the null hypothesis were true. In this example, the p value is below .001, so the null hypothesis is rejected.
How to Interpret Confidence Interval in R
The confidence interval shows the plausible range for the mean difference. In this example, the confidence interval is above zero, so the result supports a positive GP minus MS difference.
How to Interpret Group Means in R
The group means show the practical direction. GP has mean 12.5768, while MS has mean 10.6504. Therefore, GP students scored higher on average.
R output summary: The t.test() output shows a significant GP versus MS difference. Report the test as a Welch two sample t test in R unless you explicitly used var.equal = TRUE.
R Chart-by-Chart Interpretation
The following R charts are the actual visual outputs for this T Test in R tutorial. They support the keywords how to plot t test in R, how to interpret t test results in R, and t test in R programming.
R Chart 1: G3 Distribution by Group
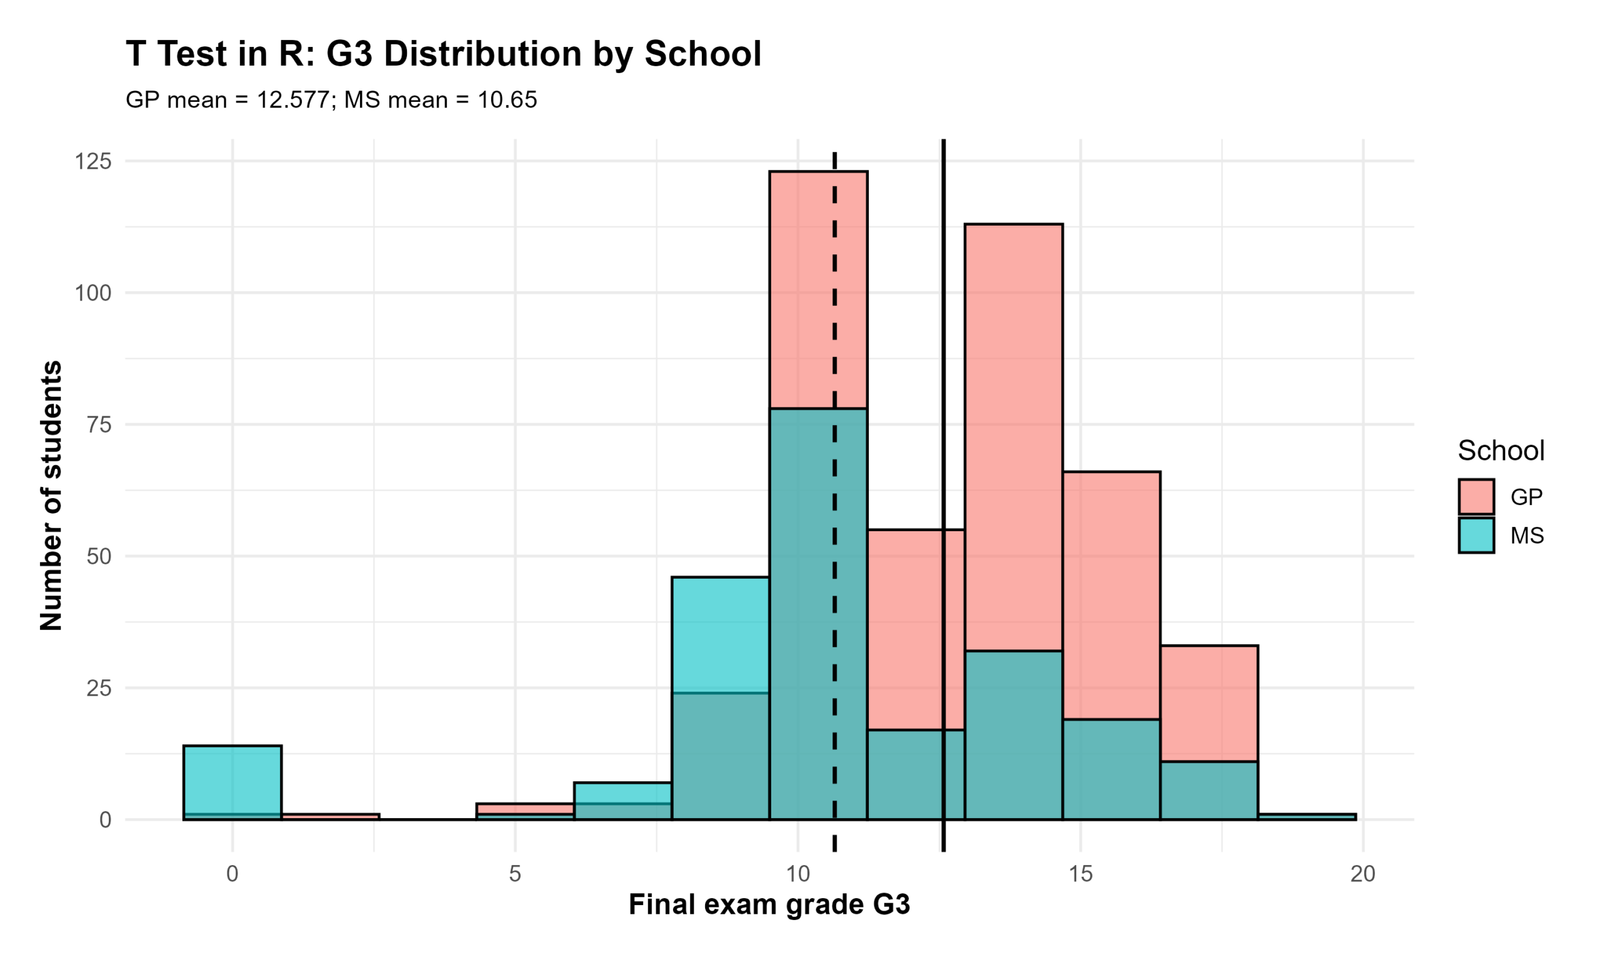
This R plot shows the distribution of G3 scores for GP and MS. It helps check the shape, spread and overlap of the two groups before interpreting the t test.
The plot supports the R result because GP is centered higher than MS. It also shows why a visual plot should be used together with t.test().
R Chart 2: Group Means with Confidence Intervals
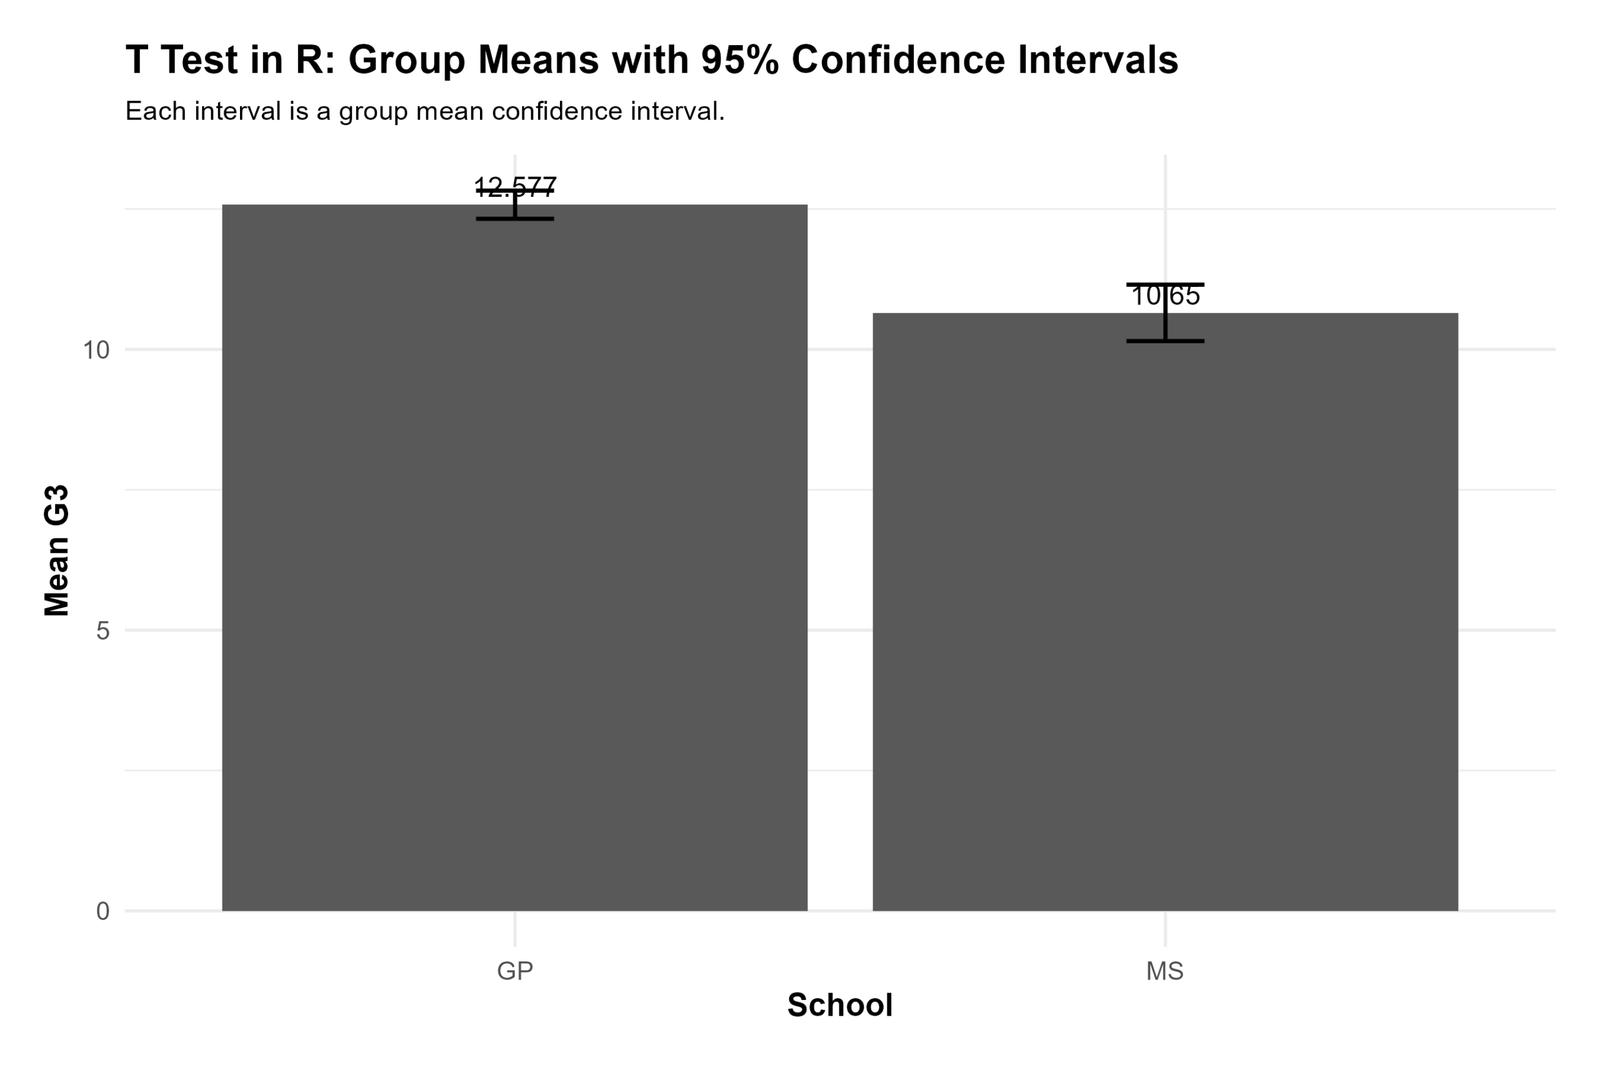
This chart compares the mean G3 score for GP and MS with confidence intervals. GP has the higher average score.
The confidence intervals help explain uncertainty around each mean. This is useful for readers searching how to interpret t test in R.
R Chart 3: Mean Difference Confidence Interval
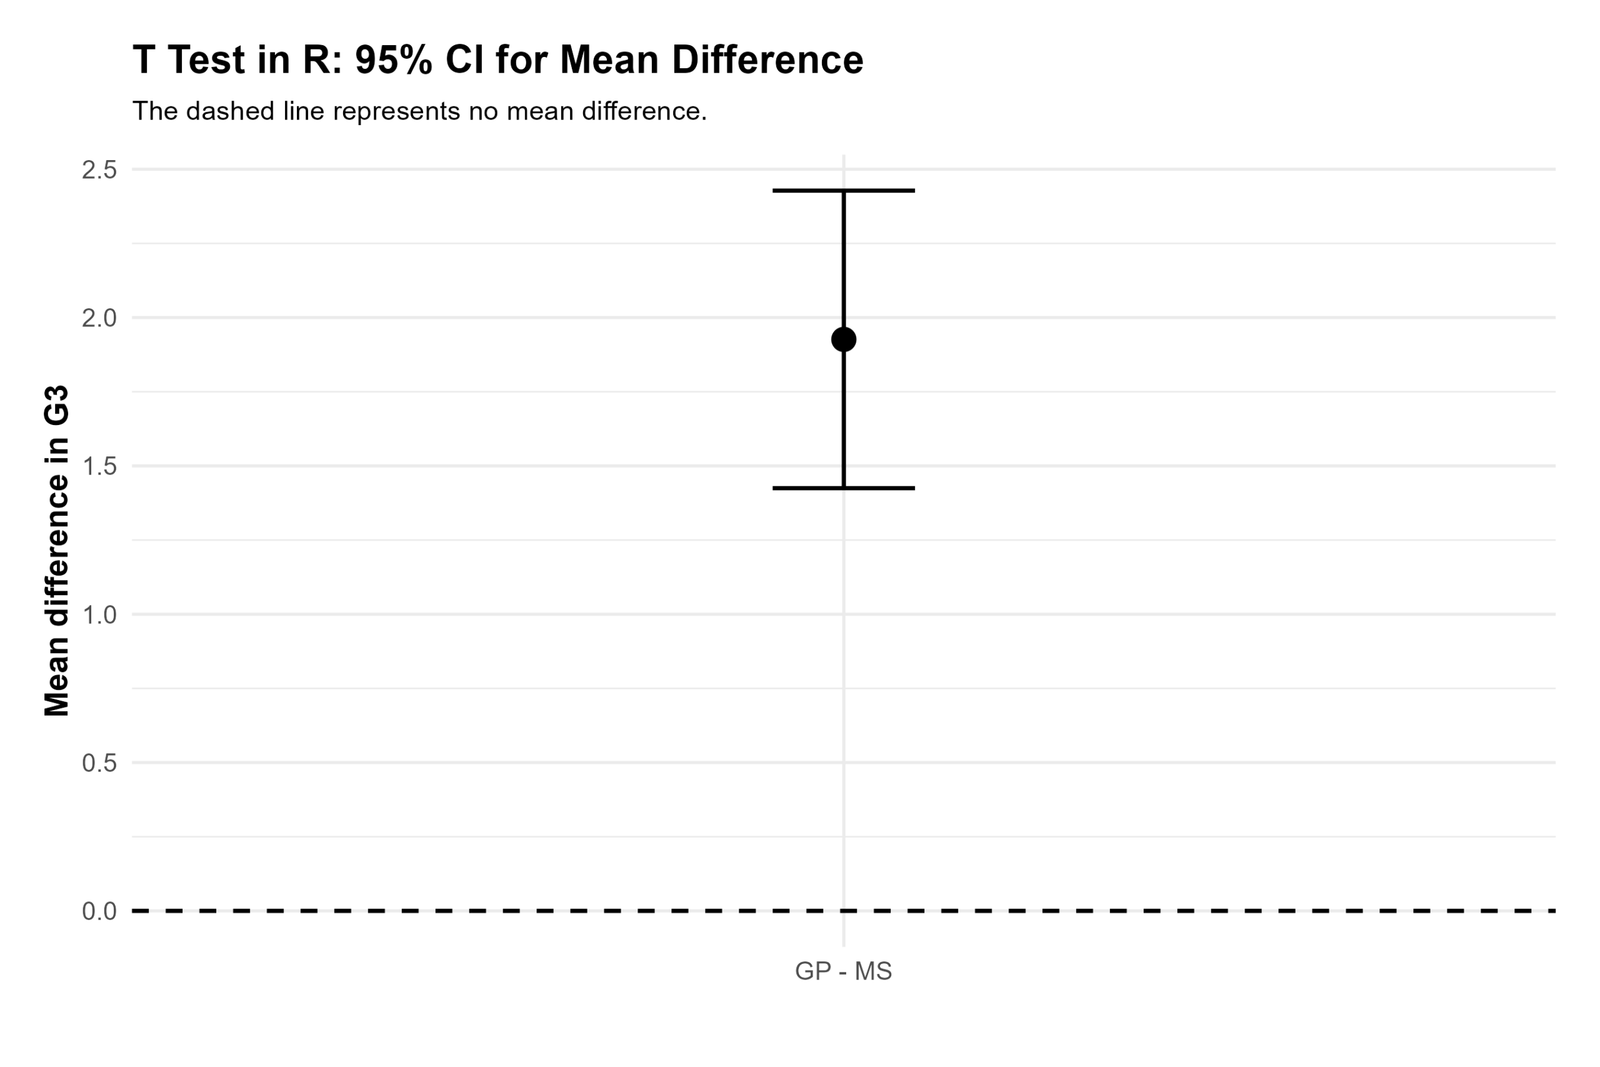
This chart is one of the most important R outputs because it focuses on the mean difference. The confidence interval is above zero, so the difference is statistically significant.
The chart explains both direction and precision. It shows that the GP mean is higher than the MS mean and that the difference is not just random noise.
R Chart 4: T Statistic T Distribution Curve
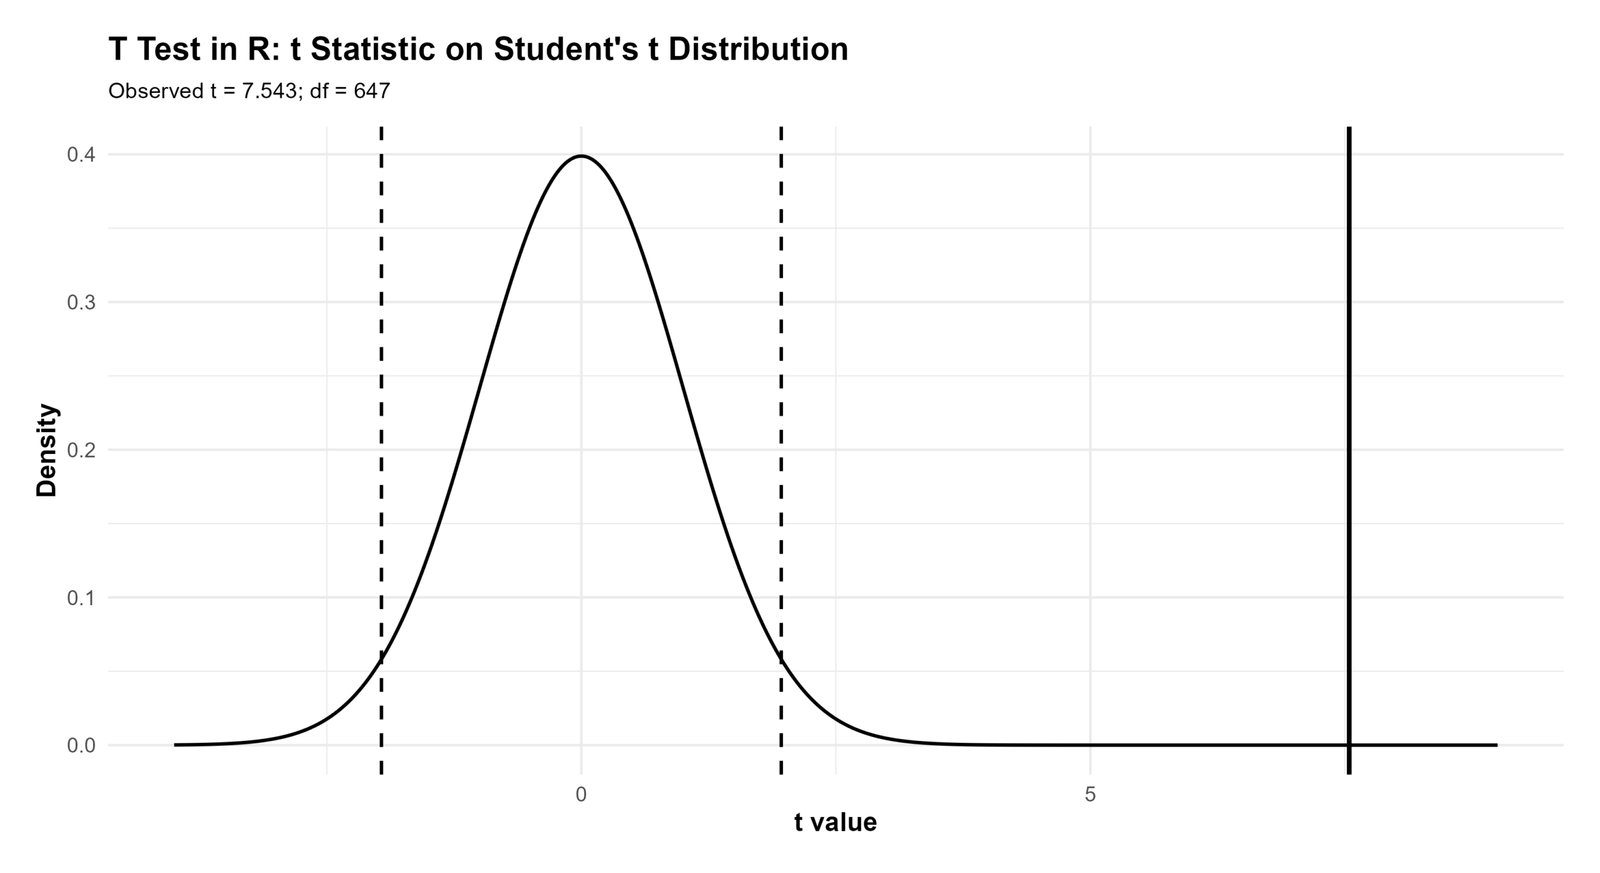
This R plot shows where the observed t statistic falls on the t distribution. The observed value is far from zero, which explains the small p value.
This plot is useful for teaching t test in R programming because it connects the t statistic with the rejection region.
R Chart 5: G3 Boxplot by Group
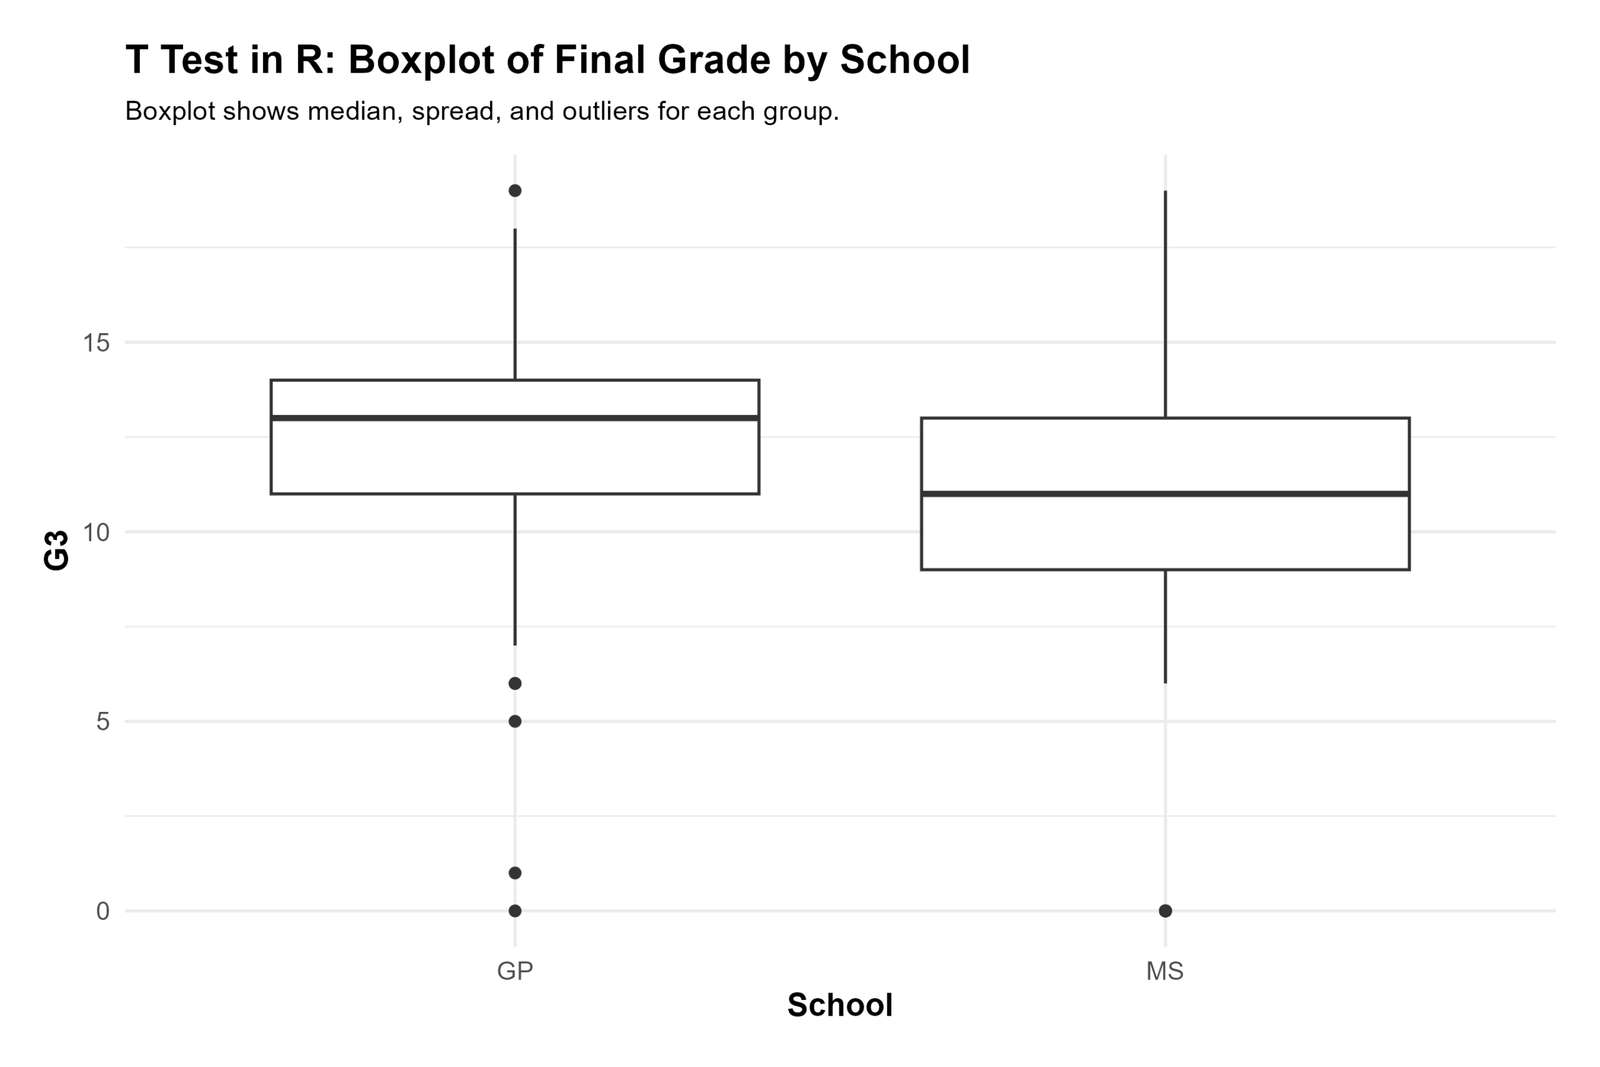
The boxplot shows the median, spread and possible outliers for GP and MS. It helps check the distribution and variance pattern before interpreting the t test.
The chart supports the use of Welch’s t test in R because the groups do not have identical spread.
R Chart 6: Group Standard Deviation Comparison
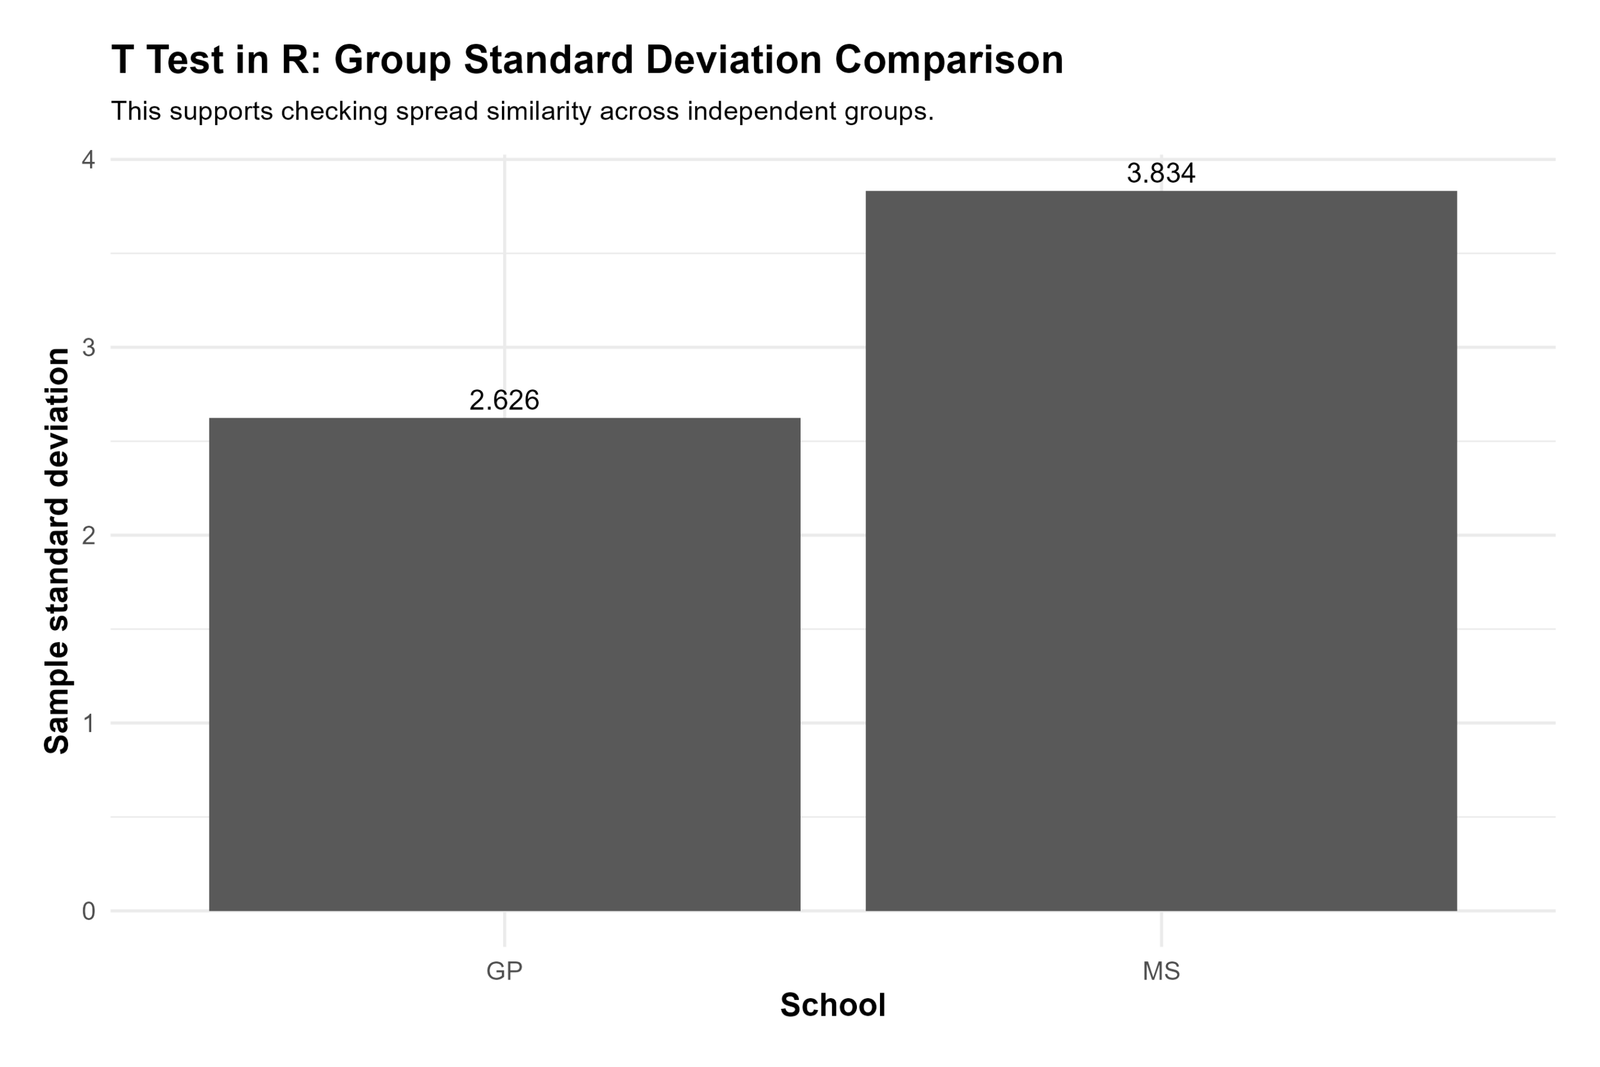
This chart compares group standard deviations. MS has a larger standard deviation than GP, so MS scores are more spread out.
This is important for choosing between Welch t test and equal-variance Student t test in R.
R Chart 7: Mean G3 by Study Time Within Group
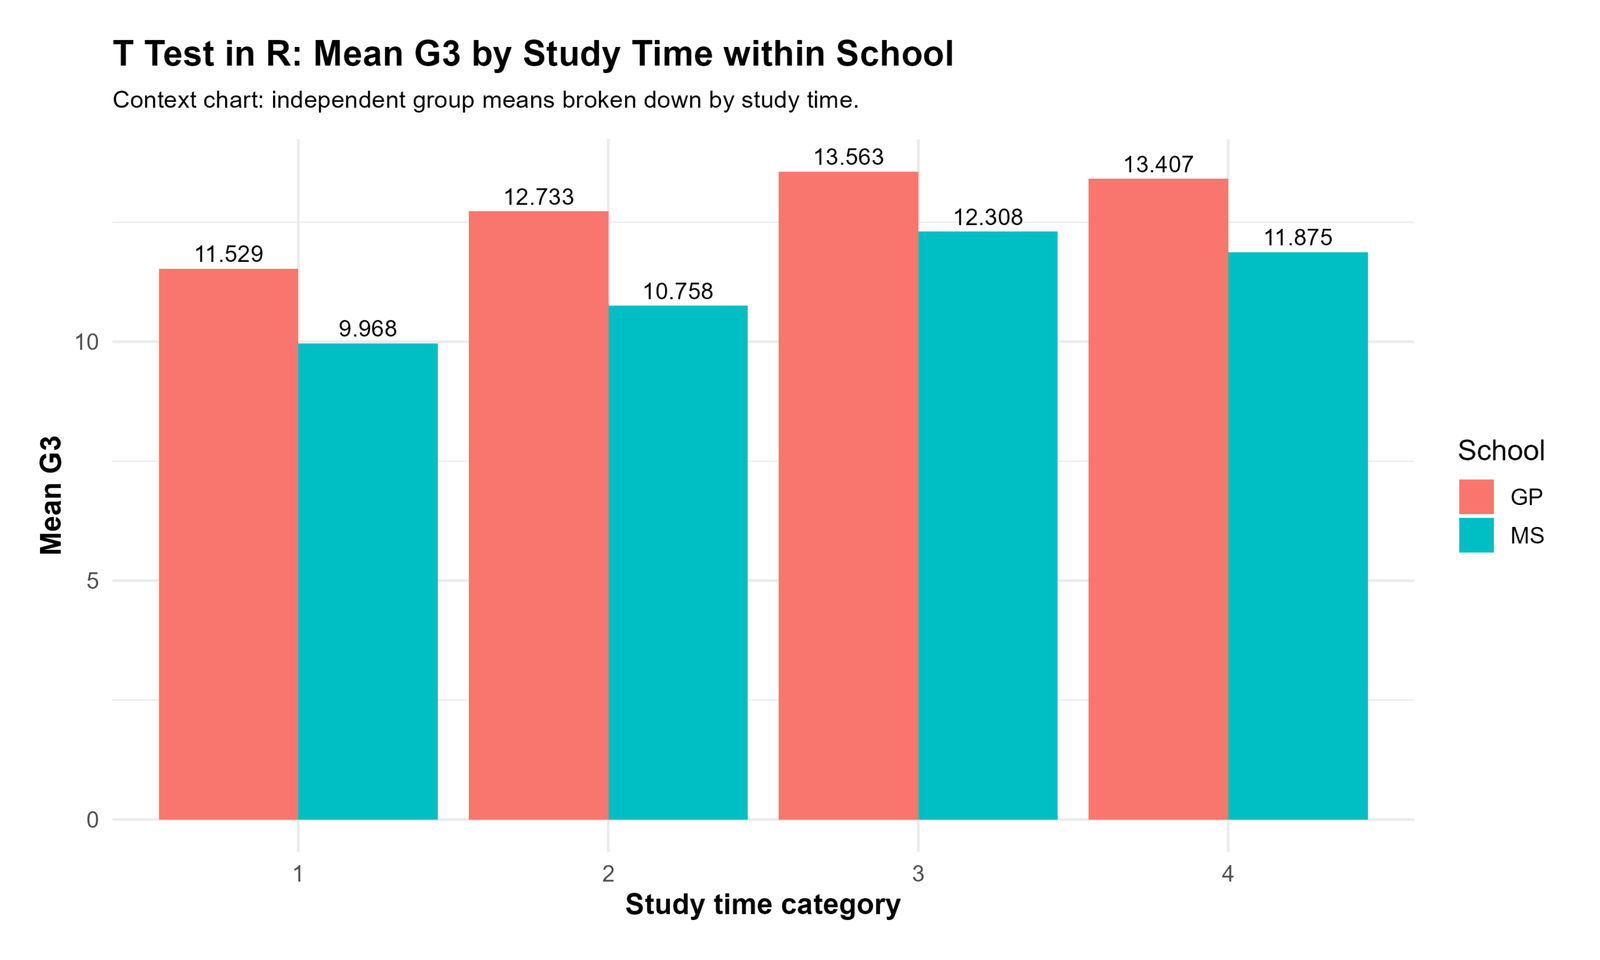
This R plot adds context by showing mean G3 across study-time categories within GP and MS. It helps readers see whether the group difference is consistent across study-time levels.
This chart is descriptive context. The formal statistical decision still comes from t.test().
R Chart 8: T Test in R Main Result Table
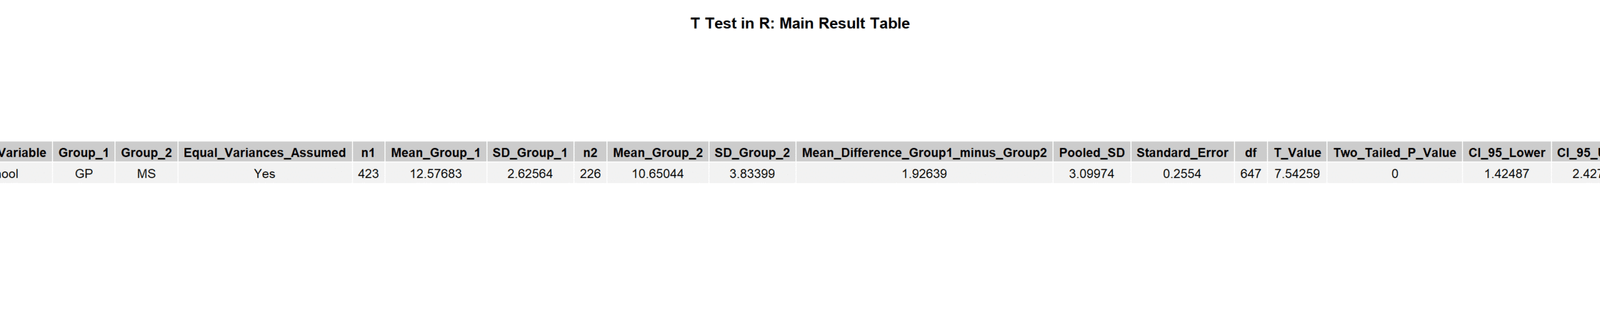
This table summarizes the main t.test() result. It is the table used to write the final report.
The table confirms that the result is statistically significant and that GP has the higher average G3 score.
R Chart 9: T Test in R Group Summary Table

This R table shows the descriptive statistics for each group. It reports sample size, mean, standard deviation and variance.
Always interpret this table before the t-test table. It explains what the statistical test is comparing.
R Chart 10: T Test in R Welch Result Table
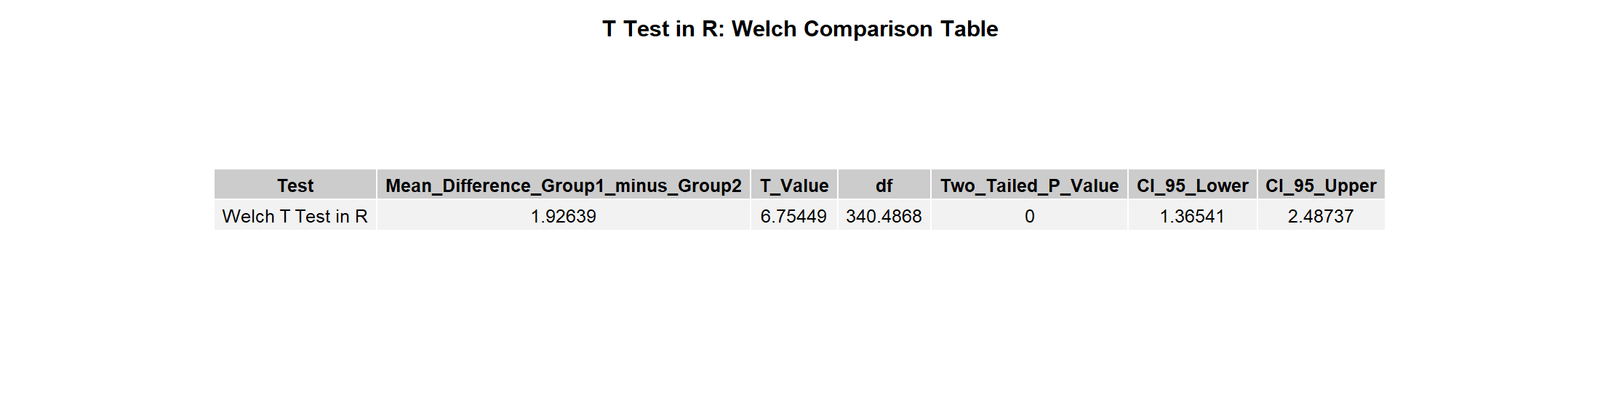
This table focuses on the Welch t test in R. It reports the adjusted degrees of freedom, t statistic, p value and confidence interval.
The table supports the final conclusion that GP students have a significantly higher mean G3 score than MS students.
R Assumption and Result Checks
Before publishing a T Test in R, validate the result with basic R checks. These checks help avoid wrong variables, missing values, reversed groups and incorrect test type.
| R Check | R Code Idea | Why It Matters |
|---|---|---|
| Check missing values | colSums(is.na(df)) | Missing values can change the sample size. |
| Check group sizes | table(df$school) | Confirms GP and MS sample sizes. |
| Check group means | aggregate(G3 ~ school, df, mean) | Shows which group is higher. |
| Check group standard deviations | aggregate(G3 ~ school, df, sd) | Helps decide whether Welch is appropriate. |
| Check paired rows | complete.cases(df[, c("G1","G3")]) | Paired t tests require complete matched rows. |
| Check confidence interval | t.test(...)$conf.int | Shows direction and uncertainty. |
R validation conclusion: A correct R t-test report must use the right variables, clean missing values, correct test type, clear group order, and a confidence interval that supports the reported conclusion.
R Workflow Only
This workflow directly answers how to do t test in R, how to run t test in R, how to perform t test in R, how to use t.test in R, and how to get p value from t test in R.
| Step | R Action | Purpose |
|---|---|---|
| 1. Load dataset | read.csv("dataset.csv") | Import the data into R. |
| 2. Clean variables | as.numeric(), na.omit() | Prepare numeric test variables. |
| 3. Summarize data | aggregate() | Calculate group n, mean and standard deviation. |
| 4. Run t.test | t.test(G3 ~ school, data = df) | Run the two sample Welch t test. |
| 5. Get p value | result$p.value | Extract the p value from R output. |
| 6. Get confidence interval | result$conf.int | Interpret the mean difference range. |
| 7. Plot result | boxplot(), ggplot2 | Create R plots for explanation. |
| 8. Write report | Use t, df, p and CI | Prepare APA-style interpretation. |
R Code Blocks
Load Data and Prepare Variables in R
# T Test in R: load and prepare data

df <- read.csv("dataset.csv")

df$G3 <- as.numeric(df$G3)
df$G1 <- as.numeric(df$G1)
df$school <- as.factor(df$school)

df_clean <- na.omit(df[, c("G1", "G3", "school", "studytime")])

str(df_clean)
summary(df_clean$G3)
table(df_clean$school)
One Sample T Test in R
# One sample t test in R
# Question: Is mean G3 different from 10?

one_sample_result <- t.test(df_clean$G3, mu = 10)

print(one_sample_result)

# Extract key values
one_sample_result$statistic
one_sample_result$parameter
one_sample_result$p.value
one_sample_result$conf.int
Two Sample T Test in R
# Two sample t test in R
# R uses Welch t test by default for two independent groups.

two_sample_result <- t.test(G3 ~ school, data = df_clean)

print(two_sample_result)

# Extract key values
two_sample_result$statistic
two_sample_result$parameter
two_sample_result$p.value
two_sample_result$conf.int
two_sample_result$estimate
Welch T Test in R
# Welch t test in R
# This is the same as the default two-sample t.test when var.equal = FALSE.

welch_result <- t.test(G3 ~ school,
                       data = df_clean,
                       alternative = "two.sided",
                       var.equal = FALSE,
                       conf.level = 0.95)

print(welch_result)
Equal-Variance Student T Test in R
# Student two sample t test in R with equal variances assumed

student_result <- t.test(G3 ~ school,
                         data = df_clean,
                         alternative = "two.sided",
                         var.equal = TRUE,
                         conf.level = 0.95)

print(student_result)
Paired T Test in R
# Paired t test in R
# Question: Is G3 different from G1 for the same students?

paired_result <- t.test(df_clean$G3,
                        df_clean$G1,
                        paired = TRUE,
                        alternative = "two.sided",
                        conf.level = 0.95)

print(paired_result)

# Paired differences
diff_scores <- df_clean$G3 - df_clean$G1
summary(diff_scores)
mean(diff_scores)
sd(diff_scores)
Group Summary Table in R
# Group summary for t test in R

group_summary <- aggregate(G3 ~ school, data = df_clean,
                           FUN = function(x) c(
                             n = length(x),
                             mean = mean(x),
                             sd = sd(x),
                             variance = var(x),
                             se = sd(x) / sqrt(length(x))
                           ))

print(group_summary)
How to Get P Value from T Test in R
# Get p value from t test in R

result <- t.test(G3 ~ school, data = df_clean)

p_value <- result$p.value

print(p_value)

if (p_value < 0.05) {
  print("Reject H0")
} else {
  print("Fail to reject H0")
}
How to Plot T Test in R
# Basic R plots for t test in R

boxplot(G3 ~ school,
        data = df_clean,
        main = "T Test in R: G3 by School",
        xlab = "School",
        ylab = "G3 Final Grade")

stripchart(G3 ~ school,
           data = df_clean,
           vertical = TRUE,
           method = "jitter",
           pch = 16,
           main = "G3 Scores by School")
ggplot2 Plot for T Test in R
# Optional ggplot2 plot for t test in R

library(ggplot2)

ggplot(df_clean, aes(x = school, y = G3)) +
  geom_boxplot() +
  stat_summary(fun = mean, geom = "point", size = 3) +
  labs(
    title = "T Test in R: G3 Distribution by School",
    x = "School",
    y = "G3 Final Grade"
  ) +
  theme_minimal()
APA Reporting Wording from R Output
When reporting a T Test in R, include the test type, group means, t statistic, degrees of freedom, p value, confidence interval and plain-language interpretation.
APA-style R report: A Welch two sample t test was conducted in R to compare G3 final grades between GP and MS students. GP students had a higher mean G3 score (M = 12.58) than MS students (M = 10.65). The difference was statistically significant, t(340.49) = 6.75, p < .001, indicating that GP students scored higher on average.
Short R reporting version: The R t.test() result showed that GP students scored significantly higher on G3 than MS students, p < .001.
Common R T Test Mistakes
| Mistake | Why It Is Wrong | Correct R Practice |
|---|---|---|
| Forgetting R uses Welch by default | Two sample t.test() does not assume equal variances by default. | Use var.equal = TRUE only when equal variances are assumed. |
| Using independent test for paired data | Paired data require matched differences. | Use paired = TRUE. |
| Not cleaning missing values | Missing values can change the test result. | Use na.omit() or complete-case filtering. |
| Reporting only p value | P value does not show direction or size. | Report means, confidence interval and t statistic. |
| Confusing formula interface and vector interface | t.test(G3 ~ school) and t.test(gp, ms) need correct data structure. | Use formula interface for grouped data and vector interface for separate vectors. |
| Ignoring group order | The sign of the estimate depends on which group is first. | State the comparison direction clearly. |
When to Use T Test in R
Use T Test in R when your outcome variable is numeric and your research question is about comparing one mean, two independent means or two paired means.
| Research Situation | R Code | Example |
|---|---|---|
| One sample mean against a fixed value | t.test(G3, mu = 10) | Test whether mean G3 differs from 10. |
| Two independent groups | t.test(G3 ~ school, data = df) | Compare GP and MS using Welch t test. |
| Two independent groups with equal variances assumed | t.test(G3 ~ school, data = df, var.equal = TRUE) | Run Student two sample t test. |
| Two paired measurements | t.test(G3, G1, paired = TRUE) | Compare G1 and G3 for the same students. |
R Downloads and Resources
Use these R-only resources to reproduce the T Test in R workflow. Replace placeholder links with final hosted file URLs after uploading your R scripts and output files to WordPress Media Library.
Download R Script
Complete t.test in R workflow for one sample, two sample, Welch and paired t tests.
Download RStudio Project Files
RStudio-ready files for running t test in R programming.
Download R Output Tables
CSV output tables with t statistic, p value, confidence interval and decision.
Download R Chart Pack
R plots for distribution, boxplot, confidence interval and t distribution curve.
FAQs About T Test in R
How do I do a t test in R?
Use the t.test() function. For example, use t.test(G3 ~ school, data = df) for a two sample Welch t test in R.
What is t.test in R?
t.test() is the built-in R function for running one sample, two sample, Welch and paired t tests.
How do I run a two sample t test in R?
Use t.test(outcome ~ group, data = df). For this example, use t.test(G3 ~ school, data = df).
How do I run paired t test in R?
Use t.test(after, before, paired = TRUE). For example, t.test(df$G3, df$G1, paired = TRUE).
How do I run Welch t test in R?
Use t.test(G3 ~ school, data = df, var.equal = FALSE). This is also R's default for two independent groups.
How do I get p value from t test in R?
Save the result as an object, such as result <- t.test(G3 ~ school, data = df), then use result$p.value.
How do I interpret t test results in R?
Read the t statistic, degrees of freedom, p value, confidence interval and group means. If p is below .05 and the confidence interval excludes zero, the result is statistically significant.
How do I plot t test in R?
Use boxplot(), stripchart(), or ggplot2 to show distributions, group means and confidence intervals.

