
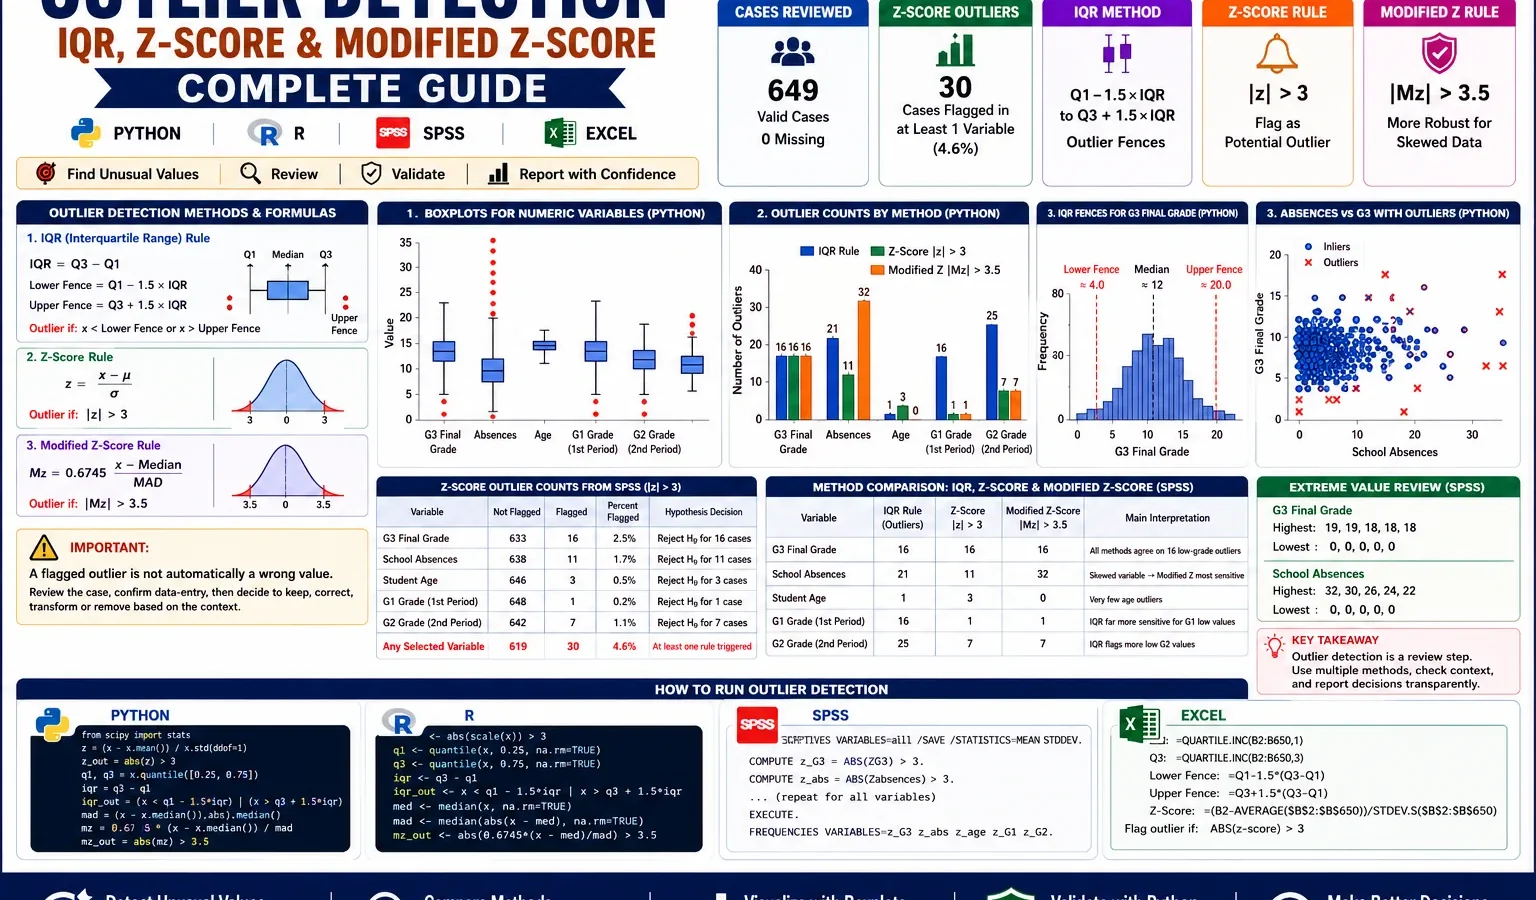
IQR Rule, Z-Score Flags and Modified Z-Score Review
Outlier Detection helps identify observations that sit far away from the main pattern of a dataset. This guide explains outlier detection methods using boxplots, the interquartile range rule, absolute z-scores greater than 3 and modified z-scores greater than 3.5. The worked example uses G3 final grade, school absences, student age, G1 first period grade and G2 second period grade with Python charts, R validation charts and SPSS output.
Quick Answer: Outlier Detection Result
Outlier Detection was performed on 649 valid cases across five numeric variables: G3 final grade, school absences, student age, G1 first period grade and G2 second period grade. The z-score rule flagged 30 cases as a potential outlier in at least one selected variable, equal to 4.6% of the dataset. By variable, the z-score method flagged 16 G3 cases, 11 absences cases, 3 age cases, 1 G1 case and 7 G2 cases.
Final report sentence: The outlier detection review showed that different rules flagged different records. Under the z-score rule, 30 of 649 cases were flagged in at least one selected variable. G3 final grade had 16 z-score outliers, school absences had 11, student age had 3, G1 had 1 and G2 had 7. The IQR rule was more sensitive for G1 and G2, while the modified z-score rule was more sensitive for school absences, flagging 32 cases.
Important interpretation note: A flagged outlier is not automatically a wrong value. It is a value that needs review. Some flagged cases may be real but unusual, such as very high absences or very low final grades. Decisions about deletion, correction, transformation or retention should depend on the research question, data-entry checks and analysis method.
Table of Contents
- What Is Outlier Detection?
- Outlier Detection Methods and Formulas
- Dataset and Variables Used
- Null and Alternative Hypotheses for Outlier Rules
- Verified SPSS, Python and R Results
- Python Charts and Interpretation
- R Validation Charts
- How to Run Outlier Detection in Python, R, SPSS and Excel
- How to Report Outlier Detection Results
- Common Mistakes
- Download SPSS Output
- FAQs
What Is Outlier Detection?
Outlier Detection is the process of finding values that are unusually low or unusually high compared with the rest of the data. In practical statistics, these values matter because they can affect the mean, standard deviation, regression models, normality checks, charts and many hypothesis tests.
An outlier may happen for several reasons. It may be a data-entry mistake, a measurement problem, a rare but valid observation, or a meaningful extreme case. For example, a student with 32 absences is unusual compared with most students, but that does not prove the value is false. It means the record should be checked before making final statistical decisions.
This guide uses three common outlier detection methods: the IQR rule, the z-score rule and the modified z-score rule. Boxplots are used to show the spread of each variable, bar charts compare the number of flagged cases, and scatterplots show how flagged absence records relate to final grade.
Practical meaning: Outlier detection is a review step, not a delete button. A good analysis reports which rule was used, how many cases were flagged, whether the flagged values are plausible and how the final model or summary changes if those cases are retained or removed.
For related visual interpretation, review Box Plot Interpretation, Histogram Interpretation, Five Number Summary, Descriptive Statistics and Coefficient of Variation.
Outlier Detection Methods and Formulas
There is no single outlier detection method that works best for every dataset. The IQR rule is robust because it uses quartiles. The z-score rule is easy to understand but depends strongly on the mean and standard deviation. The modified z-score rule uses the median and median absolute deviation, so it can be more stable when data are skewed.
1. IQR Outlier Detection Rule
The interquartile range method uses the first quartile, third quartile and IQR. Values outside the lower and upper fences are flagged as potential outliers.
IQR = Q3 - Q1
Lower IQR fence = Q1 - 1.5 × IQR
Upper IQR fence = Q3 + 1.5 × IQR

Flag as potential outlier if:
x < lower IQR fence or x > upper IQR fence
For G3 final grade, SPSS reported Q1 = 10, Q3 = 14 and IQR = 4. Therefore, the lower IQR fence is 4 and the upper IQR fence is 20. Since the maximum G3 value is 19, the upper side does not create flagged G3 outliers. The low values below 4 are the main G3 outlier concern.
2. Z-Score Outlier Detection Rule
The z-score method converts each value into standard deviation units from the mean. In this guide, SPSS used the common rule |z| > 3.
z = (x - mean) / standard deviation

Flag as potential outlier if:
|z| > 3
This rule flagged 30 cases in at least one selected variable. It is useful when variables are roughly symmetric, but it can under-flag or over-flag values when a variable is highly skewed.
3. Modified Z-Score Outlier Detection Rule
The modified z-score method uses the median and median absolute deviation. It is often more robust than the ordinary z-score because the median is less affected by extreme values.
Modified z-score = 0.6745 × (x - median) / MAD

Flag as potential outlier if:
|Modified z-score| > 3.5
In this output, the modified z-score rule flagged the highest number of absence outliers. That is expected because absences are strongly right-skewed, with many low values and a smaller number of large absence counts.
Dataset and Variables Used
The outlier detection workflow used 649 valid cases and five selected numeric variables. The SPSS output reported 0 missing cases for all selected variables, so the listwise valid N was also 649.
| Variable | N | Minimum | Maximum | Mean | Standard deviation | Interpretation |
|---|---|---|---|---|---|---|
| G3 final grade | 649 | 0 | 19 | 11.91 | 3.231 | Main grade variable. Low scores create most of the flagged lower-tail cases. |
| School absences | 649 | 0 | 32 | 3.66 | 4.641 | Strongly right-skewed variable with several high absence counts. |
| Student age | 649 | 15 | 22 | 16.74 | 1.218 | Age is concentrated around the mid-teen range, with a few older students. |
| G1 first period grade | 649 | 0 | 19 | 11.40 | 2.745 | First period grade. One extreme z-score case was detected. |
| G2 second period grade | 649 | 0 | 19 | 11.57 | 2.914 | Second period grade. Several low values were flagged. |
Shape review: G3 final grade had negative skewness of -0.913, while school absences had positive skewness of 2.021 and kurtosis of 5.781. This explains why absences produce many high-side outliers, while G3 mainly produces low-side grade outliers.
When outlier detection is part of a broader modelling workflow, it should be combined with assumption checks such as Q-Q Plot Normality Check, P-P Plot Normality Check, Kolmogorov-Smirnov Test and DAgostino Pearson Test.
Null and Alternative Hypotheses for Outlier Rules
Outlier detection rules are usually decision rules rather than formal significance tests. Still, it is useful to state clear working hypotheses before reviewing the results. In this guide, the hypotheses are written as rule-based screening decisions, not p-value tests.
| Method | Null hypothesis H0 | Alternative hypothesis H1 | Decision rule |
|---|---|---|---|
| IQR rule | The value lies within the lower and upper IQR fences and is not flagged by the IQR rule. | The value lies below the lower IQR fence or above the upper IQR fence and is flagged as a potential outlier. | Reject H0 for a case if x < Q1 – 1.5 × IQR or x > Q3 + 1.5 × IQR. |
| Z-score rule | The absolute z-score is not greater than 3, so the value is not flagged by the z-score rule. | The absolute z-score is greater than 3, so the value is flagged as a potential outlier. | Reject H0 for a case if |z| > 3. |
| Modified z-score rule | The absolute modified z-score is not greater than 3.5, so the value is not flagged by the modified z-score rule. | The absolute modified z-score is greater than 3.5, so the value is flagged as a potential outlier. | Reject H0 for a case if |Mz| > 3.5. |
Decision note: Rejecting H0 here means the value is flagged by a screening rule. It does not mean the value must be deleted. It means the case should be reviewed in context.
Verified SPSS, Python and R Results
The SPSS output, Python charts and R validation charts all show that different outlier detection methods can flag different numbers of cases. This is normal because the IQR rule, z-score rule and modified z-score rule define “unusual” in different ways.
SPSS Descriptive Output
The SPSS descriptive output confirmed that all selected variables had 649 valid cases and 0 missing cases. G3 final grade had a mean of 11.91 and standard deviation of 3.231. School absences had a mean of 3.66 and standard deviation of 4.641. Age ranged from 15 to 22. G1 and G2 both ranged from 0 to 19.
Z-Score Outlier Counts from SPSS
| Variable | Not flagged | Flagged | Percent flagged | Hypothesis decision |
|---|---|---|---|---|
| G3 final grade | 633 | 16 | 2.5% | Reject H0 for 16 cases because |z| > 3. |
| School absences | 638 | 11 | 1.7% | Reject H0 for 11 cases because |z| > 3. |
| Student age | 646 | 3 | 0.5% | Reject H0 for 3 cases because |z| > 3. |
| G1 first period grade | 648 | 1 | 0.2% | Reject H0 for 1 case because |z| > 3. |
| G2 second period grade | 642 | 7 | 1.1% | Reject H0 for 7 cases because |z| > 3. |
| Any selected variable | 619 | 30 | 4.6% | At least one selected z-score rule was triggered for 30 cases. |
Comparison of IQR, Z-Score and Modified Z-Score Counts
The method comparison shows why it is risky to rely on only one outlier rule. For G3, all three methods flagged 16 cases. For absences, the IQR rule flagged 21 cases, the z-score rule flagged 11, and the modified z-score rule flagged 32. For age, the z-score rule flagged 3 cases, the IQR rule flagged 1, and the modified z-score rule flagged 0.
| Variable | IQR rule | Z-score |z| > 3 | Modified z-score |Mz| > 3.5 | Main interpretation |
|---|---|---|---|---|
| G3 final grade | 16 | 16 | 16 | All methods agree that the same number of G3 values are unusual. |
| School absences | 21 | 11 | 32 | Absences are skewed, so method choice strongly changes the number of flags. |
| Student age | 1 | 3 | 0 | Only a small number of age values are unusual. |
| G1 first period grade | 16 | 1 | 1 | The IQR rule is much more sensitive for G1 than z-score methods. |
| G2 second period grade | 25 | 7 | 7 | The IQR rule flags more low G2 values than the z-score rules. |
Extreme Value Review
SPSS listed the highest and lowest values for each variable. For G3 final grade, the highest values were 19 and 18, while the lowest listed values were 0. For school absences, the highest listed values were 32, 30, 26, 24 and 22. These absence values explain the strong right tail in the boxplots and scatterplot.
Hypothesis decision summary: The null hypothesis was rejected only for records that crossed the selected screening threshold. Under the z-score rule, 30 records crossed at least one threshold. Under the IQR and modified z-score rules, the number of rejected case-level screening decisions changed by variable because each method uses a different definition of distance from the centre.
Python Charts and Interpretation
1. Boxplots for Numeric Variables
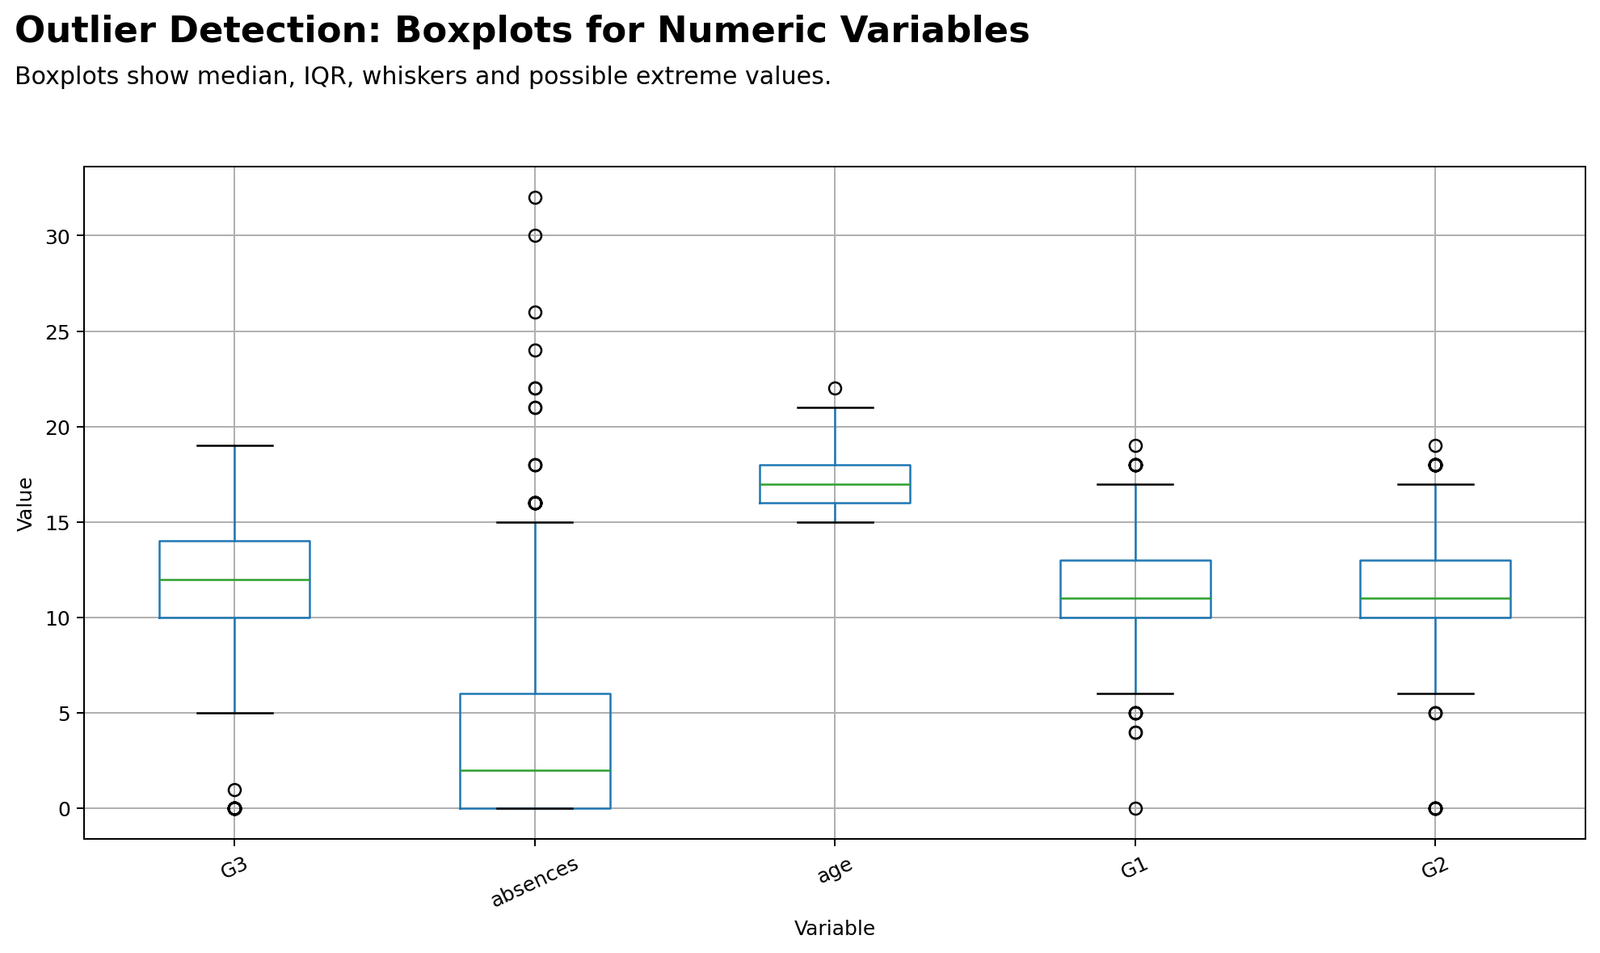
This chart compares the spread of G3, absences, age, G1 and G2 on the same value scale. The x-axis lists the variables and the y-axis shows their values. G3 has a median near 12 and an IQR roughly from 10 to 14, with low outlier points near 0 and 1. Absences has a much lower median near 2, but it has several high outliers above the upper whisker, reaching 32. Age is tightly grouped around 16 to 18, with a small number of older values above the whisker. G1 and G2 are centred around 11, but both show low-end outliers near 0. The main conclusion is that outliers are not evenly distributed across variables. Absences is the strongest right-skewed variable, while grade variables have important low-end extreme values.
2. Outlier Counts by Detection Method
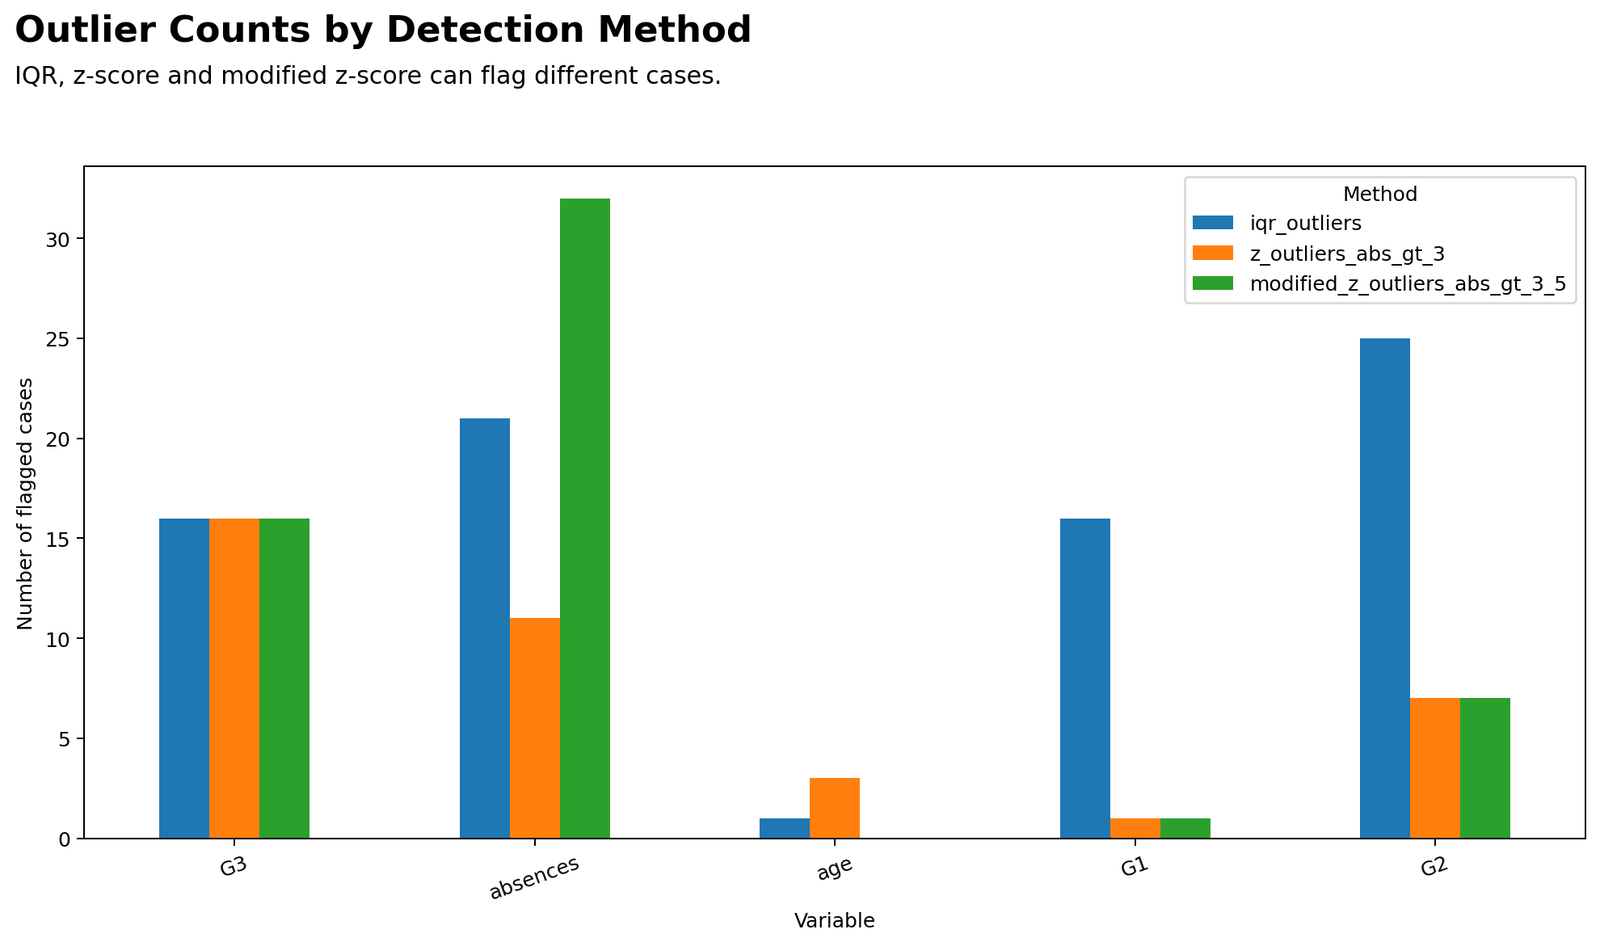
This chart shows how many cases were flagged by each rule for each variable. The x-axis lists the variables and the y-axis shows the number of flagged cases. For G3, all three methods flag 16 cases, which means the low G3 values are unusual under all rules. For absences, the modified z-score method flags the most cases, followed by the IQR rule and then the ordinary z-score rule. This happens because absences are highly skewed and the median-based rule reacts differently from the mean-based z-score rule. For G1 and G2, the IQR rule is more sensitive than the z-score methods. The chart supports the hypothesis section because H0 is rejected for different numbers of cases depending on the rule used.
3. IQR Outlier Fences for G3
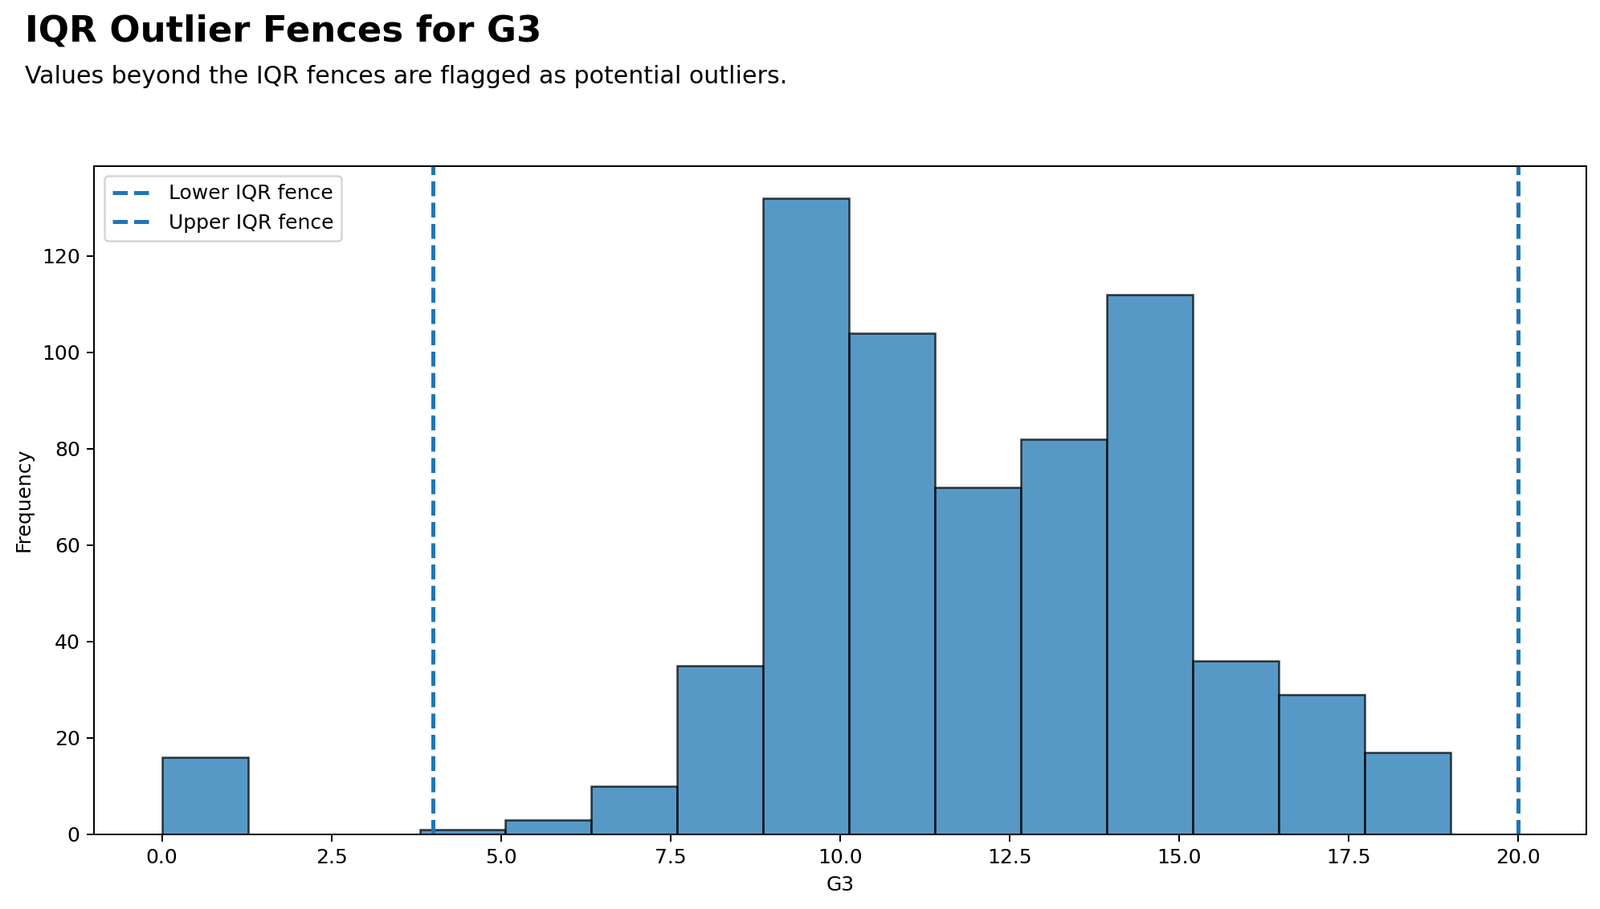
This histogram focuses on G3 final grade. The x-axis shows G3 scores and the y-axis shows frequency. The dashed vertical lines mark the lower and upper IQR fences. The lower fence is about 4 and the upper fence is about 20. Most G3 scores fall between 8 and 15, which is the main body of the distribution. Scores near 0 and 1 sit below the lower IQR fence and are therefore flagged as potential outliers. The upper fence is above the maximum observed G3 value of 19, so no upper-side G3 values are flagged by the IQR rule. In hypothesis terms, H0 is rejected for low G3 cases below the lower fence and not rejected for the main body of grades inside the fences.
4. Absences vs G3 with Flagged Outliers
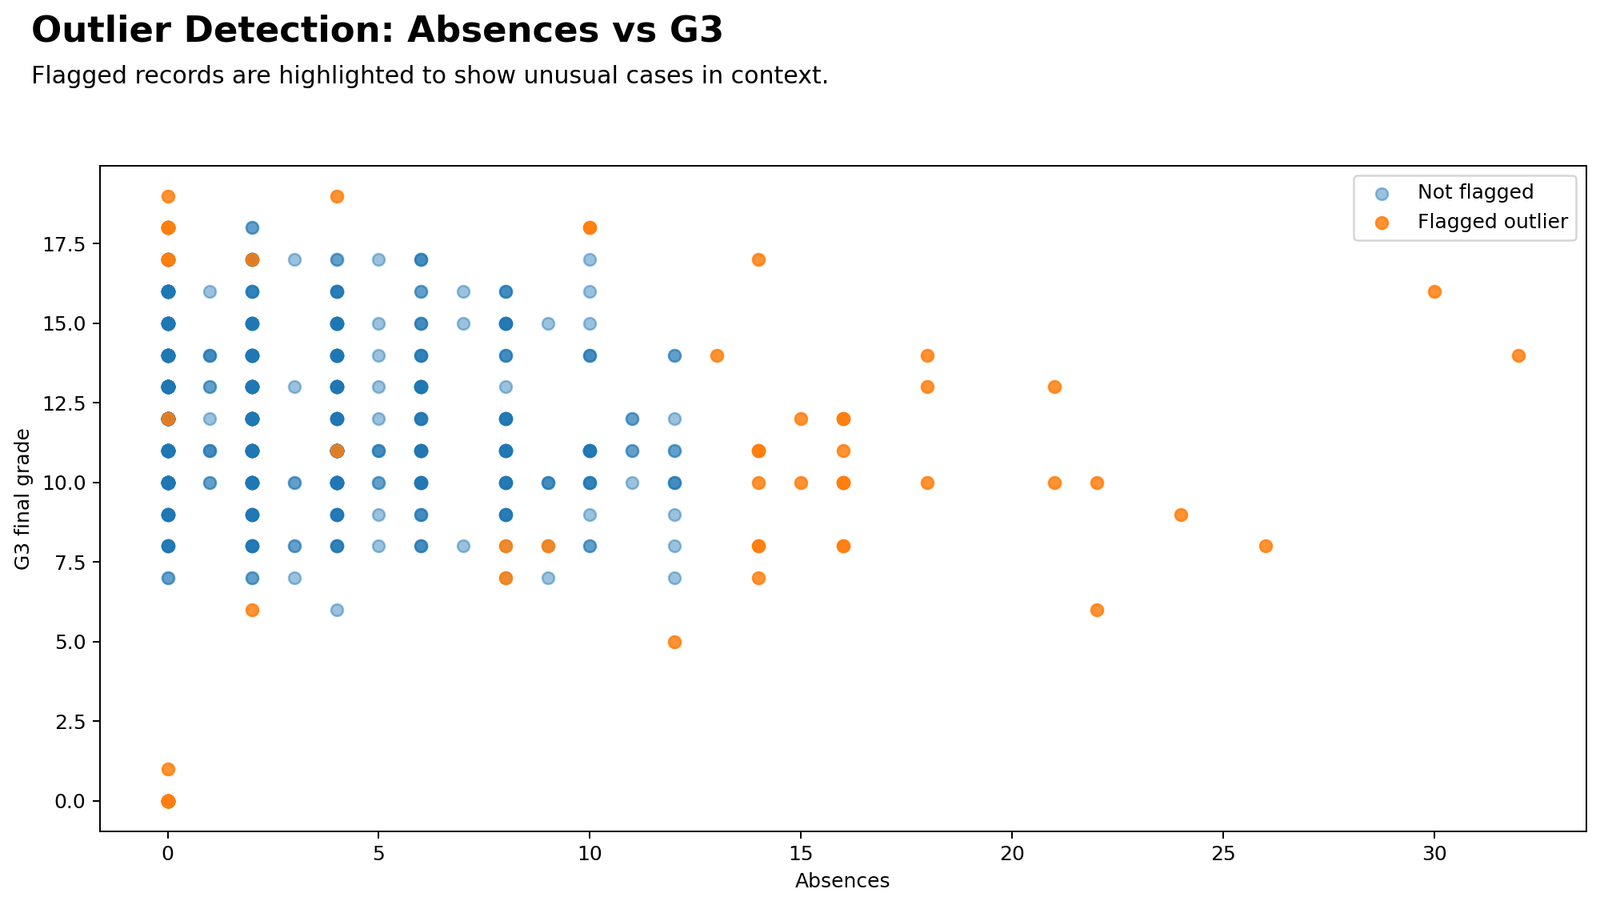
This scatterplot places absences on the x-axis and G3 final grade on the y-axis. Non-flagged records appear as the regular group, while flagged outliers are highlighted. The chart shows many students clustered between 0 and 10 absences, with G3 scores spread mostly from about 7 to 17. Flagged cases appear in several contexts: very high absence counts, very low G3 scores, and some unusual combinations such as high absences with moderate or high grades. This is useful because it shows that outliers should be reviewed in context. A high absence count may be unusual, but the final grade can still vary widely.
R Validation Charts
The R charts validate the same outlier detection pattern outside Python. The visual style is different, but the main conclusions are the same: absences have the strongest high-end outlier pattern, G3 has low-end grade outliers, and the three detection methods flag different numbers of cases.
1. R Boxplots for Numeric Variables
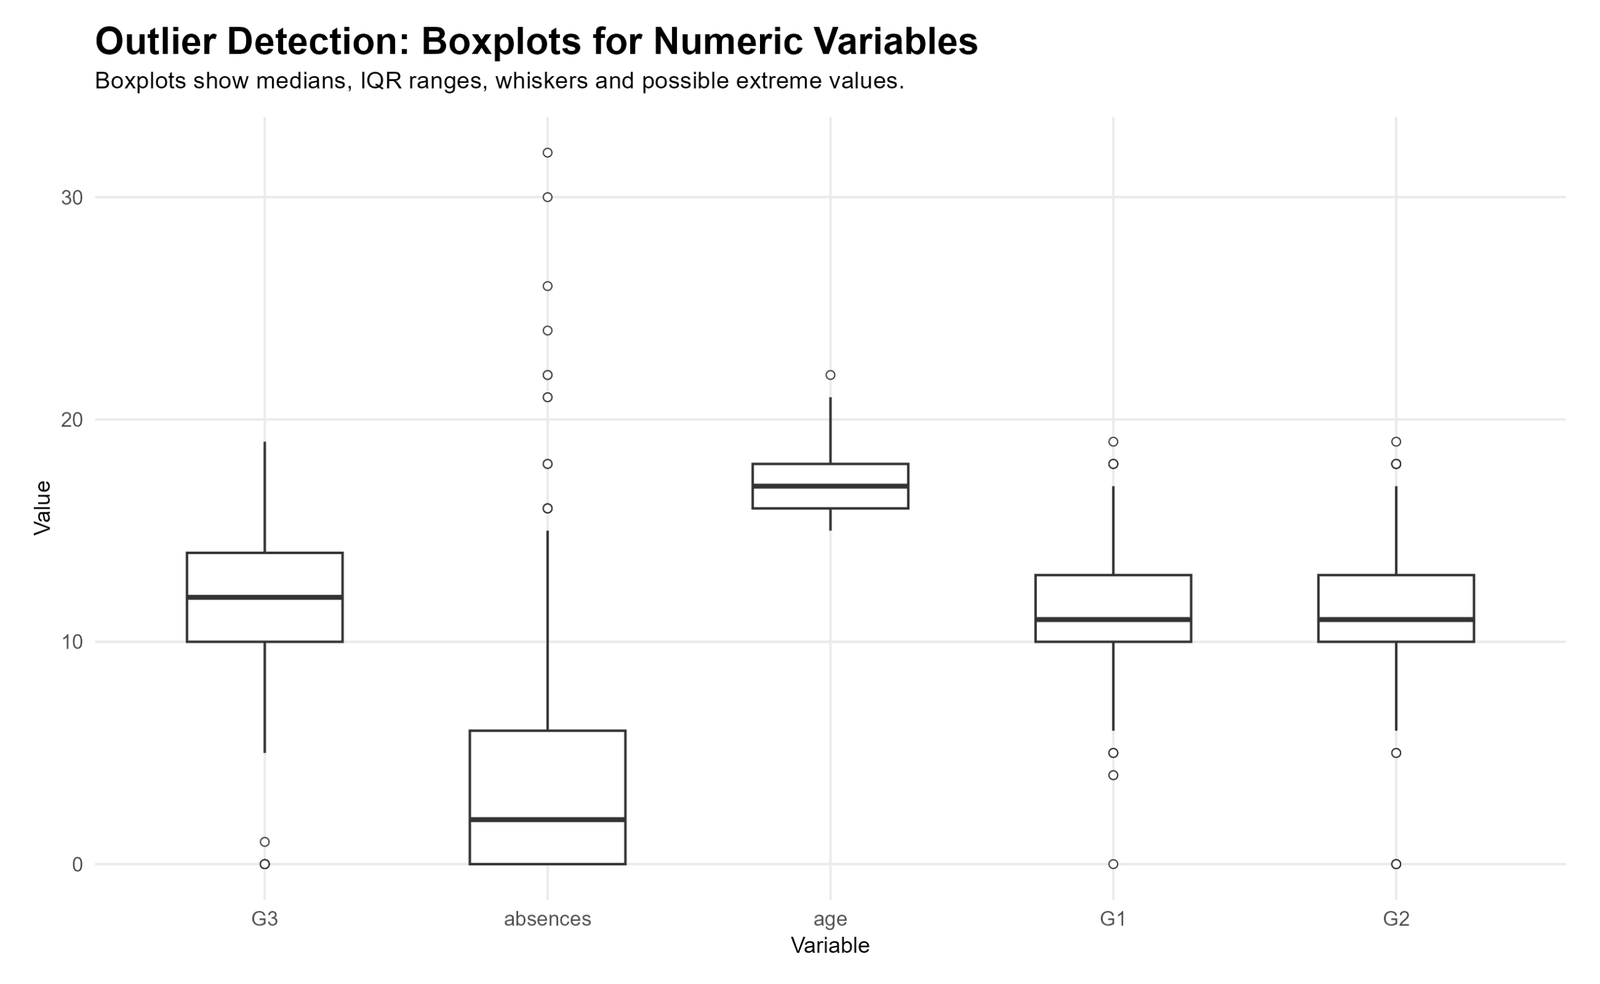
The R boxplot confirms the same distribution patterns seen in Python. Absences show a compact lower range with many high-end points above the whisker. G3, G1 and G2 have central grade ranges around 10 to 14 but also show low-end values near 0. Age is the most compact variable, with only a small number of possible high values. This chart supports the conclusion that outlier handling should be variable-specific rather than applying one blanket decision to all records.
2. R Outlier Counts by Method
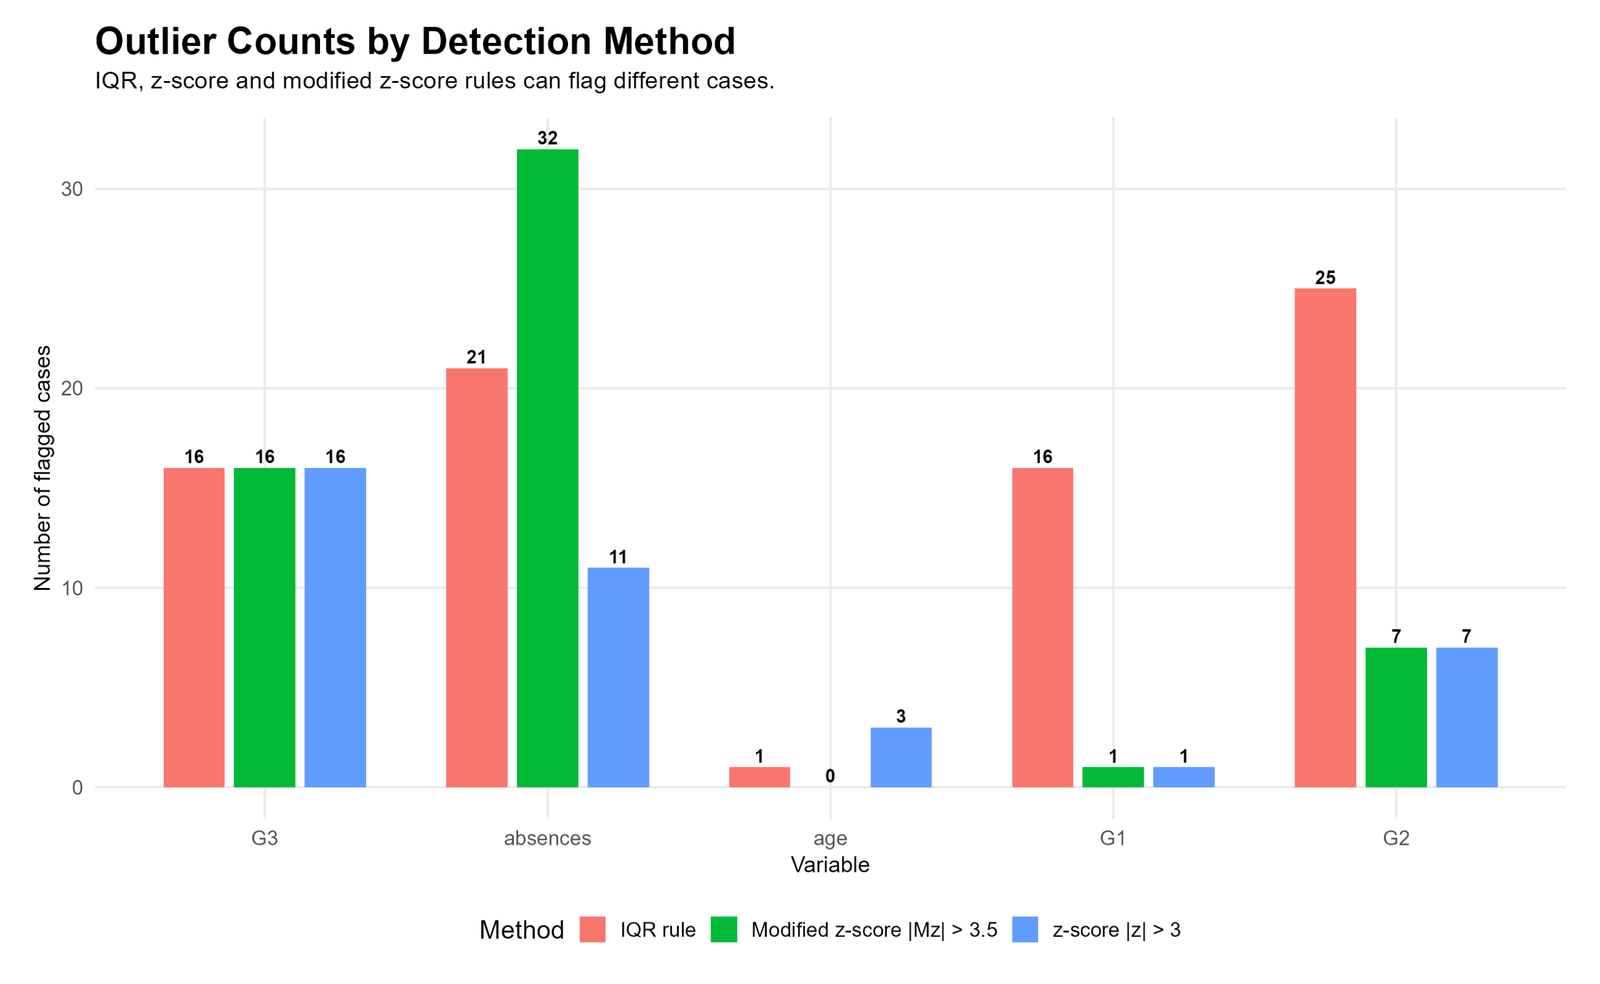
This R chart provides labelled counts, making the method comparison easy to verify. G3 has 16 flagged cases under all three methods. Absences show the biggest method difference: 21 under the IQR rule, 32 under the modified z-score rule and 11 under the z-score rule. G1 has 16 IQR flags but only 1 z-score and 1 modified z-score flag. G2 has 25 IQR flags and 7 flags under each z-score method. The chart confirms that the modified z-score is especially sensitive for the skewed absence variable, while the IQR rule is more sensitive for low grade values in G1 and G2.
3. R IQR Outlier Fences for G3
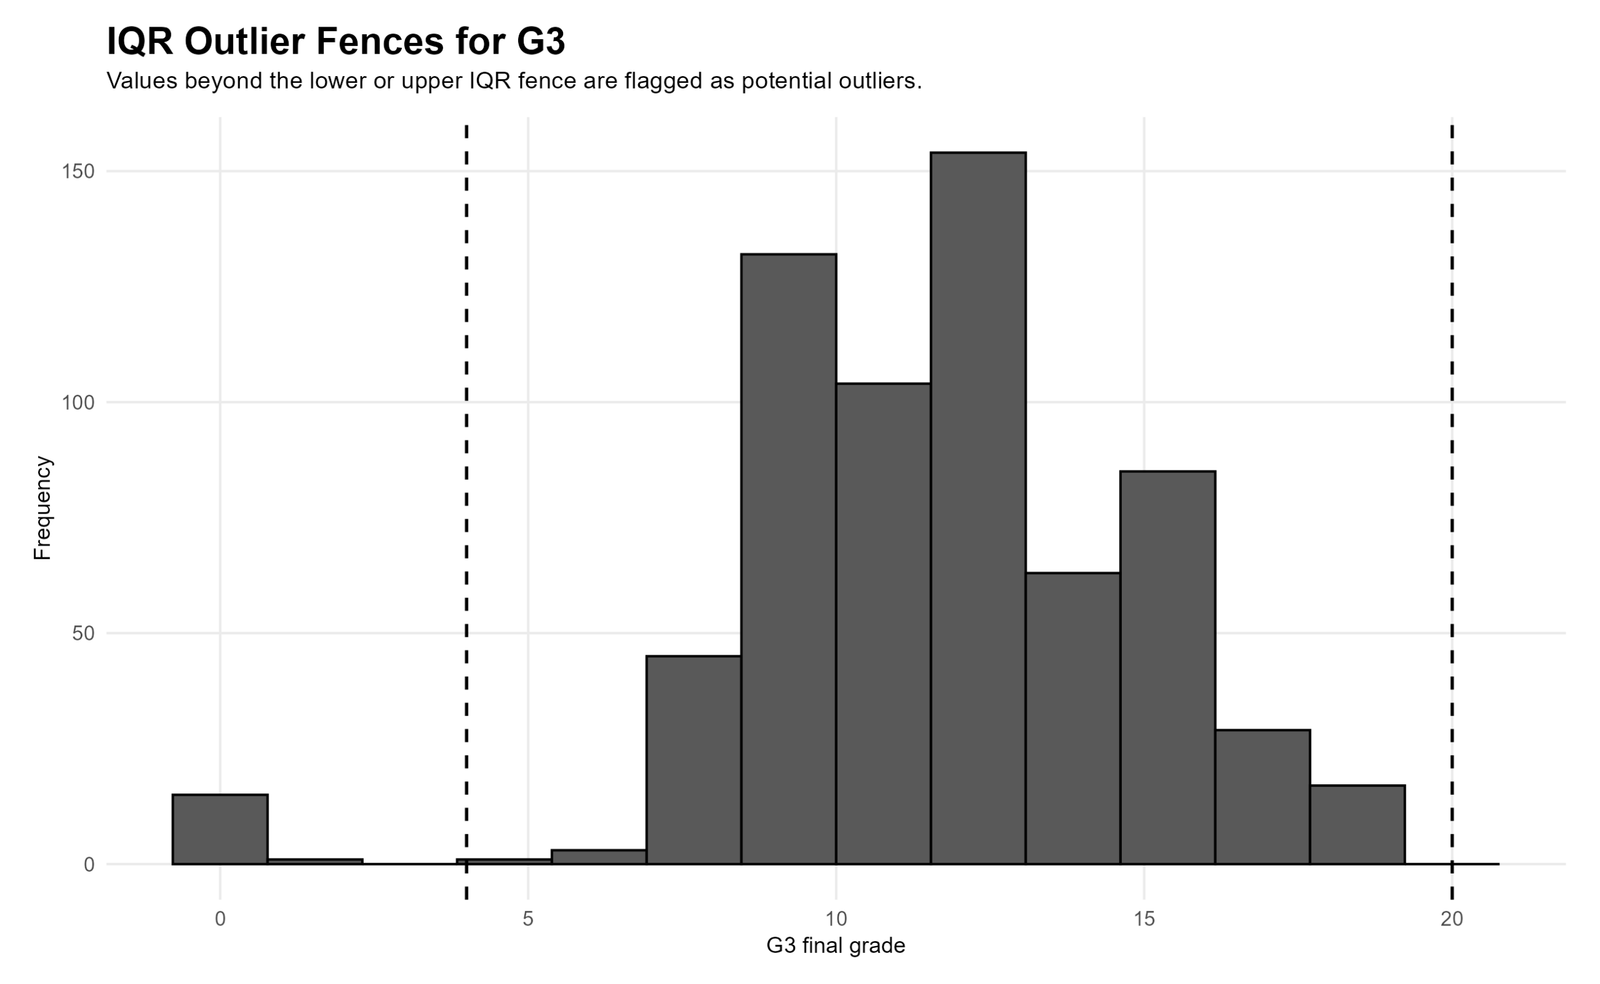
The R histogram again shows that the lower G3 fence sits near 4 and the upper fence near 20. The main G3 scores sit between the two fences, while the very low values near 0 and 1 fall outside the lower fence. Because G3 cannot exceed 19 in this dataset, the upper fence does not flag high-side grade values. This confirms that G3 outlier detection is mainly a low-performance or zero-grade review issue, not a high-grade issue.
4. R Scatterplot of Absences vs G3
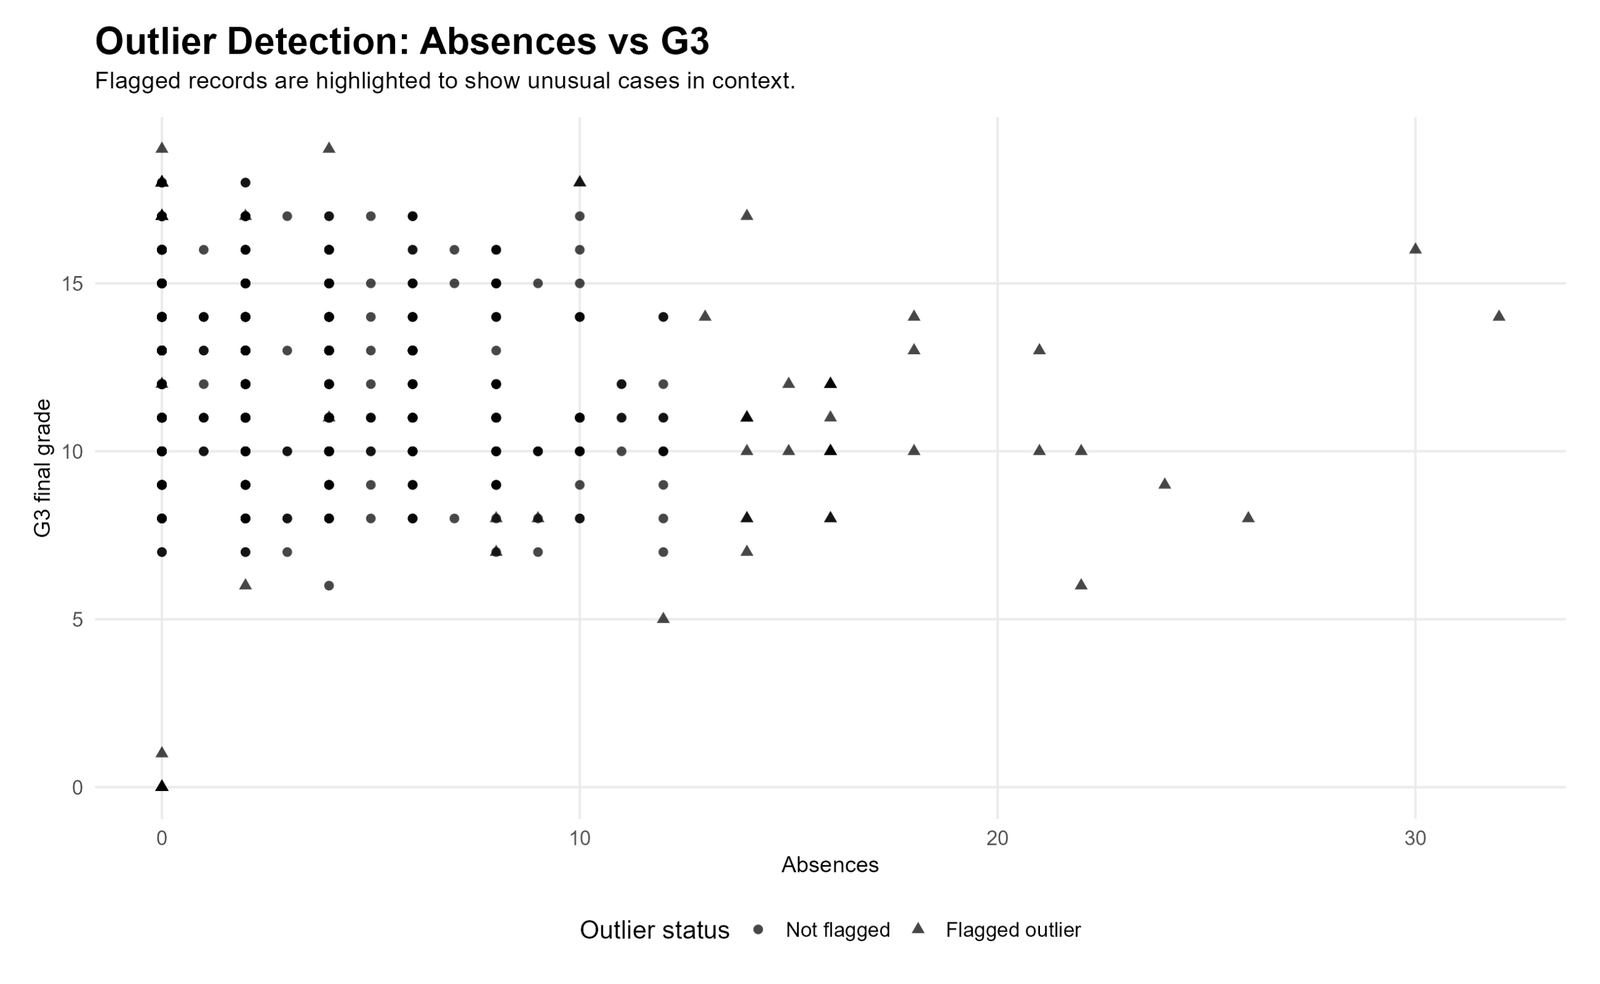
The R scatterplot uses different point shapes to separate flagged and non-flagged cases. The x-axis shows absences and the y-axis shows G3 final grade. The flagged cases are spread across both low-grade and high-absence situations. Some flagged records have zero absences but very low grades, while others have high absences but moderate grades. This makes the practical lesson clear: outlier detection should not be interpreted without looking at the actual record context.
How to Run Outlier Detection in Python, R, SPSS and Excel
Outlier Detection in Python
Python can calculate IQR flags, z-score flags and modified z-score flags, then save charts for WordPress and clean files for SPSS review.
import numpy as np
import pandas as pd
from scipy import stats

numeric_vars = ["G3", "absences", "age", "G1", "G2"]

def iqr_flags(series):
    q1 = series.quantile(0.25)
    q3 = series.quantile(0.75)
    iqr = q3 - q1
    lower = q1 - 1.5 * iqr
    upper = q3 + 1.5 * iqr
    return (series < lower) | (series > upper), lower, upper

def modified_z_flags(series):
    median = series.median()
    mad = np.median(np.abs(series - median))
    if mad == 0:
        return pd.Series(False, index=series.index)
    modified_z = 0.6745 * (series - median) / mad
    return modified_z.abs() > 3.5

summary = []

for col in numeric_vars:
    x = df[col].dropna()
    iqr_out, lower, upper = iqr_flags(x)
    z = np.abs(stats.zscore(x, nan_policy="omit"))
    z_out = z > 3
    mz_out = modified_z_flags(x)

    summary.append({
        "variable": col,
        "iqr_outliers": int(iqr_out.sum()),
        "z_outliers_abs_gt_3": int(z_out.sum()),
        "modified_z_outliers_abs_gt_3_5": int(mz_out.sum()),
        "lower_iqr_fence": lower,
        "upper_iqr_fence": upper
    })

summary_table = pd.DataFrame(summary)
print(summary_table)
Outlier Detection in R
R can reproduce the same IQR, z-score and modified z-score decisions. This is useful when Python and R are used together for validation.
numeric_vars <- c("G3", "absences", "age", "G1", "G2")

iqr_flags <- function(x) {
  q1 <- quantile(x, 0.25, na.rm = TRUE)
  q3 <- quantile(x, 0.75, na.rm = TRUE)
  iqr <- q3 - q1
  lower <- q1 - 1.5 * iqr
  upper <- q3 + 1.5 * iqr
  x < lower | x > upper
}

modified_z_flags <- function(x) {
  med <- median(x, na.rm = TRUE)
  mad_value <- median(abs(x - med), na.rm = TRUE)
  if (mad_value == 0) return(rep(FALSE, length(x)))
  mz <- 0.6745 * (x - med) / mad_value
  abs(mz) > 3.5
}

outlier_summary <- data.frame()

for (v in numeric_vars) {
  x <- student[[v]]
  iqr_out <- iqr_flags(x)
  z_out <- abs(scale(x)) > 3
  mz_out <- modified_z_flags(x)

  outlier_summary <- rbind(
    outlier_summary,
    data.frame(
      variable = v,
      iqr_outliers = sum(iqr_out, na.rm = TRUE),
      z_outliers_abs_gt_3 = sum(z_out, na.rm = TRUE),
      modified_z_outliers_abs_gt_3_5 = sum(mz_out, na.rm = TRUE)
    )
  )
}

print(outlier_summary)
Outlier Detection in SPSS
SPSS can create standardized values and then flag cases where the absolute z-score is greater than 3.
* Descriptive statistics and Explore review.
DESCRIPTIVES VARIABLES=G3 absences age G1 G2
 /STATISTICS=MEAN STDDEV MIN MAX.

EXAMINE VARIABLES=G3 absences age G1 G2
 /PLOT BOXPLOT
 /STATISTICS DESCRIPTIVES EXTREME
 /CINTERVAL 95
 /MISSING LISTWISE
 /NOTOTAL.

* Save z-scores.
DESCRIPTIVES VARIABLES=G3 absences age G1 G2
 /SAVE
 /STATISTICS=MEAN STDDEV.

* Flag absolute z-scores greater than 3.
COMPUTE zflag_G3 = ABS(ZG3) > 3.
COMPUTE zflag_absences = ABS(Zabsences) > 3.
COMPUTE zflag_age = ABS(Zage) > 3.
COMPUTE zflag_G1 = ABS(ZG1) > 3.
COMPUTE zflag_G2 = ABS(ZG2) > 3.
COMPUTE any_outlier = MAX(zflag_G3,zflag_absences,zflag_age,zflag_G1,zflag_G2).
EXECUTE.

FREQUENCIES VARIABLES=zflag_G3 zflag_absences zflag_age zflag_G1 zflag_G2 any_outlier.
Outlier Detection in Excel
Excel can calculate the same screening rules using quartiles, standard deviation and median absolute deviation formulas.
| Excel task | Example formula | Purpose |
|---|---|---|
| First quartile | =QUARTILE.INC(B2:B650,1) | Calculates Q1 for the IQR rule. |
| Third quartile | =QUARTILE.INC(B2:B650,3) | Calculates Q3 for the IQR rule. |
| IQR | =Q3-Q1 | Measures the middle 50% spread. |
| Lower fence | =Q1-1.5*IQR | Lower cutoff for IQR outliers. |
| Upper fence | =Q3+1.5*IQR | Upper cutoff for IQR outliers. |
| Z-score | =(B2-AVERAGE($B$2:$B$650))/STDEV.S($B$2:$B$650) | Flags values where the absolute z-score is greater than 3. |
How to Report Outlier Detection Results
A clear outlier detection report should name the rule, variables, sample size, cutoff values and number of flagged cases. It should also explain whether flagged cases were removed, retained or reviewed separately.
APA-style report: Outlier detection was conducted for G3 final grade, school absences, student age, G1 first period grade and G2 second period grade using IQR, z-score and modified z-score rules. The dataset included 649 valid cases. Under the z-score rule, values with absolute z-scores greater than 3 were flagged. This rule identified 16 G3 outliers, 11 absences outliers, 3 age outliers, 1 G1 outlier and 7 G2 outliers. Overall, 30 cases, or 4.6% of the dataset, were flagged in at least one selected variable.
Plain-language report: Most values fell within the expected range, but some records were unusual. The strongest issue was school absences because a small number of students had very high absence counts. Several grade variables also had very low scores that were flagged. These records should be checked before deciding whether to keep, transform or remove them.
When outlier handling changes a result, report both versions if possible. For example, show the mean, standard deviation or model result with and without flagged cases. This is especially important for methods that rely on the mean and standard deviation. For follow-up summaries, see Confidence Interval, Effect Size and Frequency Distribution.
Common Mistakes
1. Deleting every flagged outlier automatically
A flagged value is only a warning. It may be a real observation. Always check the case, variable meaning and possible data-entry issue before removing it.
2. Using only one outlier detection method
The IQR, z-score and modified z-score methods can flag different cases. In this example, absences had 11 z-score flags but 32 modified z-score flags. Method choice matters.
3. Ignoring skewness
School absences were strongly right-skewed. Skewed data often produce many upper-tail values. A median-based method can behave differently from a mean-based z-score method.
4. Treating outliers as proof of bad data
An outlier may be valid. A student with high absences or a very low grade may be unusual but still real. Statistical review should be paired with subject knowledge.
5. Reporting outlier removal without explanation
If cases are removed, explain the rule used, number removed and whether the conclusion changed. Silent outlier removal weakens trust in the analysis.
Download SPSS Output and Verification Files
The SPSS output PDF verifies the descriptive statistics, case processing summary, boxplot and extreme value review, z-score outlier counts and listed flagged cases.
External References for Outlier Detection
This post uses verified Python, R and SPSS outputs together with standard statistical rules for IQR, z-scores and modified z-scores.
FAQs About Outlier Detection
What is outlier detection?
Outlier detection is the process of finding values that are unusually far from the main pattern of the data. These values may be errors, rare cases or valid but extreme observations.
What are the main outlier detection methods used here?
This guide uses the IQR rule, the z-score rule and the modified z-score rule. The IQR rule uses quartiles, the z-score rule uses the mean and standard deviation, and the modified z-score rule uses the median and median absolute deviation.
What is the IQR rule for outlier detection?
The IQR rule flags values below Q1 – 1.5 × IQR or above Q3 + 1.5 × IQR. These cutoffs are called the lower and upper IQR fences.
What z-score is usually considered an outlier?
A common rule is to flag values with an absolute z-score greater than 3. In this output, that rule flagged 30 cases in at least one selected variable.
What is a modified z-score?
A modified z-score is a robust outlier measure based on the median and median absolute deviation. A common cutoff is an absolute modified z-score greater than 3.5.
Which variable had the most outliers?
School absences had the largest method difference. It had 21 IQR outliers, 11 z-score outliers and 32 modified z-score outliers.
How many cases were flagged by the SPSS z-score rule?
SPSS flagged 30 of 649 cases as a potential outlier in at least one selected variable using the absolute z-score greater than 3 rule.
Should flagged outliers always be removed?
No. Flagged outliers should be checked first. They may be valid observations. Removal should only happen when there is a clear reason, such as a confirmed data-entry error or a justified analysis rule.
Why do different methods flag different outliers?
Different methods define unusual values differently. The IQR rule uses quartiles, the z-score rule uses the mean and standard deviation, and the modified z-score rule uses the median and median absolute deviation.
Can outlier detection be done in Python, R and SPSS?
Yes. Python and R can calculate IQR, z-score and modified z-score flags, while SPSS can produce descriptives, boxplots, extreme value tables and z-score-based case flags.

