
.abx-article{–ink:#102238;–muted:#52657a;–line:#dce5ed;–paper:#fff;–soft:#f4f8fb;–navy:#092a45;–teal:#0d7774;–cyan:#dff7f6;–amber:#f4a340;–amber-soft:#fff4df;–red:#a83232;–red-soft:#fff0f0;–green:#176b47;–green-soft:#e9f8f0;–violet:#6654b8;–violet-soft:#f0edff;–shadow:0 16px 45px rgba(18,44,67,.10);font-family:Inter,ui-sans-serif,system-ui,-apple-system,BlinkMacSystemFont,”Segoe UI”,Arial,sans-serif;color:var(–ink);line-height:1.72;width:auto;max-width:none!important;margin-left:calc(50% – 50vw + 12px)!important;margin-right:calc(50% – 50vw + 12px)!important;margin-top:0!important;margin-bottom:0!important;background:var(–paper);font-size:17px;overflow-x:clip}
.abx-article *{box-sizing:border-box}.abx-article a{color:#075f72;text-decoration-thickness:1px;text-underline-offset:3px}.abx-article a:hover{color:#043f4c}.abx-shell{width:100%;max-width:1480px;margin:0 auto;padding:clamp(18px,2.8vw,42px)}.abx-hero{position:relative;overflow:hidden;border-radius:28px;background:linear-gradient(132deg,#07263f 0%,#0b4b61 55%,#0a7770 100%);color:#fff;padding:clamp(28px,6vw,68px);box-shadow:var(–shadow)}.abx-hero:before{content:””;position:absolute;right:-90px;top:-120px;width:360px;height:360px;border-radius:50%;background:rgba(255,255,255,.07)}.abx-hero:after{content:””;position:absolute;left:-110px;bottom:-180px;width:390px;height:390px;border-radius:50%;background:rgba(244,163,64,.10)}.abx-hero>*{position:relative;z-index:1}.abx-kicker{display:inline-flex;align-items:center;gap:9px;padding:7px 12px;border:1px solid rgba(255,255,255,.25);border-radius:999px;background:rgba(255,255,255,.09);font-size:.78rem;font-weight:800;letter-spacing:.08em;text-transform:uppercase}.abx-kicker i{width:9px;height:9px;border-radius:50%;background:#ffbd62;box-shadow:0 0 0 5px rgba(255,189,98,.16)}.abx-hero h1{font-size:clamp(2.15rem,5.2vw,4.65rem);line-height:1.04;letter-spacing:-.045em;margin:22px 0 18px;max-width:1000px;color:#fff}.abx-hero .abx-lead{font-size:clamp(1.05rem,2vw,1.34rem);max-width:900px;color:#e9f7fb;margin:0}.abx-badges{display:flex;flex-wrap:wrap;gap:10px;margin-top:25px}.abx-badge{padding:8px 12px;border-radius:999px;background:rgba(255,255,255,.11);border:1px solid rgba(255,255,255,.19);font-size:.84rem;font-weight:750}.abx-hero-result{margin-top:28px;display:grid;grid-template-columns:repeat(4,minmax(0,1fr));gap:12px}.abx-hero-metric{background:rgba(255,255,255,.10);border:1px solid rgba(255,255,255,.16);border-radius:16px;padding:14px}.abx-hero-metric span{display:block;color:#cdeaf0;font-size:.78rem;text-transform:uppercase;letter-spacing:.05em;font-weight:800}.abx-hero-metric strong{display:block;margin-top:4px;font-size:1.28rem;color:#fff}.abx-ad{display:flex;align-items:center;justify-content:center;min-height:96px;margin:26px 0;border:1px dashed #b8c6d1;border-radius:18px;background:#f8fafc;color:#718096;font-size:.78rem;letter-spacing:.14em;text-transform:uppercase}.abx-quick{display:grid;grid-template-columns:1.35fr .65fr;gap:20px;margin:28px 0}.abx-card{min-width:0;max-width:100%;border:1px solid var(–line);border-radius:22px;background:#fff;box-shadow:0 10px 30px rgba(21,48,70,.06);padding:clamp(19px,3vw,30px)}.abx-card h2,.abx-card h3{margin-top:0}.abx-answer{background:linear-gradient(145deg,#f2fbfa,#fff);border-color:#bfe5e2}.abx-answer .abx-verdict{display:inline-flex;align-items:center;gap:9px;padding:8px 12px;border-radius:999px;background:var(–green-soft);color:var(–green);font-weight:850;font-size:.84rem}.abx-answer .abx-verdict:before{content:”✓”;display:grid;place-items:center;width:22px;height:22px;border-radius:50%;background:var(–green);color:#fff}.abx-answer h2{font-size:clamp(1.55rem,3vw,2.25rem);line-height:1.15;margin:15px 0 10px}.abx-mini-table{display:grid;gap:10px}.abx-mini-row{display:flex;justify-content:space-between;gap:20px;padding:11px 0;border-bottom:1px solid var(–line)}.abx-mini-row:last-child{border-bottom:0}.abx-mini-row span{color:var(–muted)}.abx-mini-row strong{text-align:right}.abx-toc{margin:26px 0;border-radius:22px;background:var(–navy);color:#fff;padding:24px}.abx-toc h2{color:#fff;margin:0 0 14px;font-size:1.2rem}.abx-toc-grid{display:grid;grid-template-columns:repeat(3,minmax(0,1fr));gap:8px 20px}.abx-toc a{color:#d9f6f5;text-decoration:none;padding:7px 0;display:block;border-bottom:1px solid rgba(255,255,255,.12)}.abx-toc a:hover{color:#fff}.abx-section{scroll-margin-top:24px;margin:54px 0}.abx-section-head{display:grid;grid-template-columns:auto 1fr;align-items:start;gap:14px;margin-bottom:20px}.abx-num{width:42px;height:42px;border-radius:13px;background:var(–navy);color:#fff;display:grid;place-items:center;font-weight:900}.abx-section-head h2{margin:0;font-size:clamp(1.65rem,3.4vw,2.65rem);line-height:1.15;letter-spacing:-.025em}.abx-section-head p{grid-column:2;margin:5px 0 0;color:var(–muted);max-width:920px}.abx-grid-2{display:grid;grid-template-columns:repeat(2,minmax(0,1fr));gap:20px}.abx-grid-2>*,.abx-grid-3>*,.abx-grid-4>*,.abx-chart-grid>*,.abx-downloads>*,.abx-related>*,.abx-quick>*{min-width:0}.abx-grid-3{display:grid;grid-template-columns:repeat(3,minmax(0,1fr));gap:18px}.abx-grid-4{display:grid;grid-template-columns:repeat(4,minmax(0,1fr));gap:14px}.abx-callout{border-radius:18px;padding:18px 20px;border-left:5px solid var(–teal);background:var(–cyan);margin:20px 0}.abx-callout strong{color:#084f4c}.abx-warning{border-left-color:var(–red);background:var(–red-soft)}.abx-warning strong{color:var(–red)}.abx-note{border-left-color:var(–amber);background:var(–amber-soft)}.abx-note strong{color:#875311}.abx-formula{border:1px solid #cbd8e3;background:linear-gradient(180deg,#fff,#f7fafc);border-radius:20px;padding:22px;margin:18px 0;text-align:center;overflow:visible}.abx-formula .eq{font-family:”Cambria Math”,”Times New Roman”,serif;font-size:clamp(1.08rem,2.2vw,1.5rem);white-space:normal;overflow-wrap:anywhere;word-break:normal;line-height:1.55}.abx-formula p{margin:8px auto 0;color:var(–muted);max-width:850px;text-align:left;font-size:.94rem}.abx-pill-list{display:flex;flex-wrap:wrap;gap:10px;margin:15px 0}.abx-pill{background:var(–soft);border:1px solid var(–line);border-radius:999px;padding:8px 12px;font-weight:750;font-size:.88rem}.abx-flow{display:grid;grid-template-columns:repeat(5,minmax(0,1fr));gap:10px;counter-reset:flow}.abx-step{position:relative;padding:18px 14px 16px;border:1px solid var(–line);border-radius:18px;background:#fff;min-height:148px}.abx-step:before{counter-increment:flow;content:counter(flow);display:grid;place-items:center;width:30px;height:30px;border-radius:10px;background:var(–teal);color:#fff;font-weight:900;margin-bottom:10px}.abx-step h3{font-size:1rem;margin:0 0 6px}.abx-step p{font-size:.9rem;color:var(–muted);margin:0}.abx-table-wrap{min-width:0;max-width:100%;overflow-x:auto;border:1px solid var(–line);border-radius:18px;background:#fff}.abx-table{width:100%;border-collapse:collapse;min-width:720px}.abx-table.abx-compact{min-width:0}.abx-table th{background:var(–navy);color:#fff;text-align:left;padding:13px 14px;font-size:.85rem;letter-spacing:.02em}.abx-table td{padding:13px 14px;border-bottom:1px solid var(–line);vertical-align:top}.abx-table tbody tr:nth-child(even){background:#f8fafc}.abx-table tbody tr:last-child td{border-bottom:0}.abx-stat-grid{display:grid;grid-template-columns:repeat(4,minmax(0,1fr));gap:12px;margin:16px 0}.abx-stat{border:1px solid var(–line);border-radius:16px;padding:16px;background:#fff}.abx-stat span{display:block;color:var(–muted);font-size:.78rem;font-weight:800;text-transform:uppercase;letter-spacing:.05em}.abx-stat strong{display:block;font-size:1.34rem;margin-top:4px}.abx-stat small{display:block;color:var(–muted);margin-top:4px}.abx-result-panel{border-radius:22px;background:linear-gradient(145deg,#082c47,#0b5966);color:#fff;padding:26px}.abx-result-panel h3{color:#fff;margin-top:0;font-size:1.45rem}.abx-result-panel p{color:#e5f6f7}.abx-result-panel .abx-result-big{font-size:clamp(2rem,5vw,3.7rem);line-height:1;font-weight:950;color:#fff;margin:10px 0}.abx-result-panel .abx-result-tag{display:inline-block;padding:8px 12px;border-radius:999px;background:rgba(255,255,255,.12);border:1px solid rgba(255,255,255,.18);font-weight:800}.abx-figure{min-width:0;max-width:100%;margin:0;border:1px solid var(–line);border-radius:22px;overflow:hidden;background:#fff;box-shadow:0 10px 30px rgba(21,48,70,.06)}.abx-figure img{display:block;width:100%;height:auto;background:#f3f6f8}.abx-figure figcaption{padding:18px 20px}.abx-figure h3{font-size:1.08rem;margin:0 0 6px}.abx-figure p{margin:0;color:var(–muted);font-size:.94rem}.abx-chart-grid{display:grid;grid-template-columns:repeat(2,minmax(0,1fr));gap:20px}.abx-chart-grid .abx-wide{grid-column:1/-1}.abx-code{min-width:0;max-width:100%;position:relative;background:#071d2d;color:#e6f2f7;border-radius:18px;overflow:auto;padding:20px;margin:16px 0;box-shadow:inset 0 0 0 1px rgba(255,255,255,.07)}.abx-code code{display:block;white-space:pre;min-width:max-content;font-family:”SFMono-Regular”,Consolas,”Liberation Mono”,monospace;font-size:.88rem;line-height:1.65}.abx-code-label{display:inline-block;margin-bottom:8px;color:#7ee7db;font-size:.76rem;font-weight:900;letter-spacing:.08em;text-transform:uppercase}.abx-downloads{display:grid;grid-template-columns:repeat(4,minmax(0,1fr));gap:14px}.abx-download{display:flex;flex-direction:column;min-height:190px;padding:20px;border-radius:20px;border:1px solid var(–line);background:#fff;text-decoration:none!important;color:var(–ink)!important;box-shadow:0 10px 30px rgba(21,48,70,.06);transition:.2s transform,.2s box-shadow}.abx-download:hover{transform:translateY(-3px);box-shadow:0 16px 38px rgba(21,48,70,.12)}.abx-file-icon{width:46px;height:46px;border-radius:14px;display:grid;place-items:center;background:var(–violet-soft);color:var(–violet);font-weight:950;margin-bottom:16px}.abx-download strong{font-size:1.05rem}.abx-download span{color:var(–muted);font-size:.88rem;margin-top:6px}.abx-download em{margin-top:auto;padding-top:16px;color:#075f72;font-style:normal;font-weight:850}.abx-checks{display:grid;gap:10px}.abx-check{position:relative;padding:13px 14px 13px 44px;border:1px solid var(–line);border-radius:15px;background:#fff}.abx-check:before{content:”✓”;position:absolute;left:14px;top:13px;width:22px;height:22px;border-radius:50%;display:grid;place-items:center;background:var(–green-soft);color:var(–green);font-weight:950}.abx-faq details{border:1px solid var(–line);border-radius:17px;background:#fff;margin:11px 0;overflow:hidden}.abx-faq summary{cursor:pointer;font-weight:850;padding:17px 20px;list-style:none}.abx-faq summary::-webkit-details-marker{display:none}.abx-faq summary:after{content:”+”;float:right;color:var(–teal);font-size:1.4rem;line-height:1}.abx-faq details[open] summary:after{content:”−”}.abx-faq .abx-faq-answer{padding:0 20px 18px;color:var(–muted)}.abx-related{display:grid;grid-template-columns:repeat(3,minmax(0,1fr));gap:12px}.abx-related a{display:block;border:1px solid var(–line);border-radius:15px;padding:14px 16px;background:#fff;text-decoration:none;font-weight:800}.abx-footer-note{border-radius:22px;background:var(–soft);border:1px solid var(–line);padding:22px;color:var(–muted)}.abx-back{display:inline-flex;align-items:center;gap:8px;border-radius:999px;background:var(–navy);color:#fff!important;text-decoration:none!important;padding:11px 16px;font-weight:850;margin-top:18px}.abx-sr{position:absolute!important;width:1px!important;height:1px!important;padding:0!important;margin:-1px!important;overflow:hidden!important;clip:rect(0,0,0,0)!important;white-space:nowrap!important;border:0!important}
@media(max-width:960px){.abx-hero-result,.abx-grid-4,.abx-stat-grid,.abx-downloads{grid-template-columns:repeat(2,minmax(0,1fr))}.abx-toc-grid,.abx-grid-3,.abx-related{grid-template-columns:repeat(2,minmax(0,1fr))}.abx-flow{grid-template-columns:repeat(2,minmax(0,1fr))}.abx-flow .abx-step:last-child{grid-column:1/-1}.abx-quick{grid-template-columns:1fr}}
@media(max-width:680px){.abx-article{font-size:16px;margin-left:calc(50% – 50vw + 6px)!important;margin-right:calc(50% – 50vw + 6px)!important}.abx-shell{padding:12px}.abx-hero{border-radius:20px;padding:26px 20px}.abx-hero h1{font-size:2.2rem}.abx-hero-result,.abx-grid-2,.abx-grid-3,.abx-grid-4,.abx-stat-grid,.abx-downloads,.abx-chart-grid,.abx-toc-grid,.abx-related,.abx-flow{grid-template-columns:1fr}.abx-chart-grid .abx-wide,.abx-flow .abx-step:last-child{grid-column:auto}.abx-card{border-radius:18px;padding:18px}.abx-section{margin:42px 0}.abx-section-head{grid-template-columns:36px 1fr;gap:11px}.abx-num{width:36px;height:36px}.abx-section-head p{grid-column:1/-1}.abx-table{min-width:650px}.abx-formula{padding:18px 12px;text-align:left}.abx-formula .eq{font-size:1.05rem}.abx-mini-row{align-items:flex-start;flex-direction:column;gap:2px}.abx-mini-row strong{text-align:left}}
.abx-seo-context{font-size:1.02rem;color:#31475d;margin:-5px 0 20px;max-width:1180px}
.abx-model{display:grid;grid-template-columns:1.05fr .95fr;gap:20px;align-items:stretch}
.abx-model .abx-card{height:100%}
.abx-hypothesis{border:1px solid var(–line);border-radius:18px;padding:20px;background:#fff}
.abx-hypothesis h3{margin:0 0 10px}
.abx-direction{display:grid;grid-template-columns:repeat(3,minmax(0,1fr));gap:12px;margin:16px 0}
.abx-direction>div{border:1px solid var(–line);border-radius:16px;padding:16px;background:var(–soft)}
.abx-keyword-box{border:1px solid #b9d8e2;border-radius:20px;background:linear-gradient(145deg,#eff9fc,#fff);padding:22px;margin:22px 0}
.abx-keyword-box h3{margin-top:0}
.abx-equation-lines{display:grid;gap:10px;text-align:left}
.abx-equation-line{display:grid;grid-template-columns:minmax(140px,.38fr) 1fr;gap:16px;align-items:start;padding:10px 0;border-bottom:1px solid var(–line)}
.abx-equation-line:last-child{border-bottom:0}
.abx-equation-line strong{color:var(–navy)}
@media(max-width:900px){.abx-model,.abx-direction{grid-template-columns:1fr}.abx-equation-line{grid-template-columns:1fr;gap:4px}}
body.single-post .entry-title,body.single-post .wp-block-post-title,body.single-post .page-title,body.single-post .entry-header .post-title{display:none!important}
body.single-post #secondary,body.single-post .widget-area,body.single-post aside.sidebar,body.single-post .sidebar{display:none!important}
body.single-post .site-content,body.single-post #content,body.single-post .content-wrapper,body.single-post .main-content-wrap{display:block!important;grid-template-columns:minmax(0,1fr)!important;width:100%!important;max-width:none!important;margin-left:auto!important;margin-right:auto!important;padding-left:0!important;padding-right:0!important}body.single-post #primary,body.single-post .content-area,body.single-post main.site-main,body.single-post .site-main,body.single-post .entry-content,body.single-post .post-content{width:100%!important;max-width:none!important;float:none!important;margin-left:auto!important;margin-right:auto!important;padding-left:0!important;padding-right:0!important}
.abx-article{display:block!important;width:100%!important;max-width:100%!important;margin:0 auto!important;overflow-x:clip!important}
.abx-shell{width:100%!important;max-width:1480px!important;margin-left:auto!important;margin-right:auto!important}
.abx-hero-title{font-size:clamp(2.15rem,5.2vw,4.65rem);line-height:1.04;letter-spacing:-.045em;margin:22px 0 18px;max-width:1100px;color:#fff;font-weight:850}
@media(max-width:680px){.abx-hero-title{font-size:2.2rem}}
The Jonckheere Terpstra test is a nonparametric procedure for detecting a prespecified increasing or decreasing trend across three or more independent ordered groups. This complete guide explains the Jonckheere Terpstra test assumptions, ordered-pair statistic, tie scoring, permutation inference, null hypothesis, interpretation, and a worked final-grade trend across four study-time levels in Python, R, SPSS, and Excel.
Prespecified monotone order
Pairwise concordance counts
One-sided permutation inference
Python + R + SPSS + Excel
Final grades showed a statistically significant increasing trend across ordered study-time levels.
In this worked Jonckheere Terpstra test example, final grade (G3) was compared across four prespecified study-time levels ordered as 1 < 2 < 3 < 4. The observed ordered-pair statistic was JT = 85,922. A fixed-size permutation analysis with 2,000 label permutations produced a null mean of 68,196.98, a null standard deviation of 2,591.88, and z = 6.8387. The one-sided Monte Carlo p-value was 0.0004998, providing strong evidence that G3 tends to increase as studytime increases.
What does the Jonckheere Terpstra test measure?
A directional rank test for a monotone pattern across independent ordered groups.
The Jonckheere Terpstra test, also written as the Jonckheere-Terpstra test, Jonckheere Terpstra trend test, or JT test, evaluates whether an outcome tends to increase or decrease across three or more independent groups whose order is known before the data are analyzed. It belongs to the family of nonparametric tests because its calculation depends on relative ordering rather than a normal-theory model for group means.
The central research question
The test asks whether observations from groups later in the prespecified order tend to exceed observations from groups earlier in that order. In the current example, studytime levels are ordered 1, 2, 3, 4. The increasing alternative predicts that a student in a higher study-time category will tend to have a higher final grade than a student in a lower category.
This focus is narrower than a general “are the groups different?” question. A general omnibus test can detect any pattern, including a U-shape, an isolated high middle group, or an unordered collection of differences. The Jonckheere Terpstra test concentrates statistical power on a monotone direction selected in advance.
What the test does not measure
The Jonckheere Terpstra test is not a repeated-measures procedure, a correlation coefficient, or a post hoc comparison method. The groups must contain independent observational units. It also does not require every sample mean or median to rise perfectly at every adjacent step. Instead, it aggregates all favorable and tied comparisons across every ordered pair of groups.
Readers reviewing categorical and quantitative variables should note that the grouping variable is ordinal and the outcome is ordinal or continuous. The test uses the order of the categories, not merely their labels.
When should the Jonckheere Terpstra test be used?
Choose it when theory predicts an ordered trend before the outcome is examined.
The question when to use the Jonckheere Terpstra test is answered by the design and hypothesis. The Jonckheere Terpstra test is appropriate for three or more independent groups, an ordinal or continuous outcome, and a prespecified increasing or decreasing alternative. The ordering can represent dose, exposure, disease stage, education level, time category measured on different people, or any other scientifically meaningful progression.
Independent groups?
Each person or unit must belong to one group only.
Natural group order?
The categories must have a defensible sequence chosen before testing.
Rankable outcome?
The response should be ordinal or continuous and comparable across groups.
Directional theory?
The hypothesis should predict increasing or decreasing outcomes.
Three or more groups?
The method is most useful when a multi-group ordered pattern is expected.
Strong applications
The design should arise from defensible sampling methods or a sound experimental design. Random assignment, when available, strengthens causal interpretation; observational ordering alone does not establish causality.
Situations needing a different approach
When the primary question is association between two ordinal variables rather than ordered independent groups, Spearman rank correlation or Kendall’s tau may align more directly with the estimand.
Jonckheere Terpstra test assumptions
The Jonckheere Terpstra test is distribution-free under the null, but design conditions still determine validity.
The Jonckheere Terpstra test assumptions are less restrictive than those of a one-way normal-theory ANOVA, yet they are substantive. Independence, a valid category order, an orderable outcome, prespecification of direction, and transparent tie handling are required for a meaningful analysis.
Independent observations
Measurements must be independent within and across groups. Clustered students, repeated observations, matched sets, or school-level nesting need a design-aware method such as a multilevel model.
Ordered grouping variable
The groups must have a scientifically meaningful sequence. Reordering categories after examining the sample creates a data-driven directional hypothesis and inflates the apparent evidence.
Ordinal or continuous outcome
The response must support pairwise ordering. Numeric final grades satisfy this requirement, and ordinal scales can also be used when their ordering is meaningful.
Prespecified direction
The increasing or decreasing alternative should be stated before testing. This is the nonparametric analogue of distinguishing a planned directional claim from a general hypothesis test.
Comparable measurement process
All groups should be measured using the same outcome definition and scale. Changes in measurement quality across groups can mimic a trend.
Ties handled consistently
Tied cross-group observations receive half credit in the statistic. With many ties, permutation inference provides a direct reference distribution for the observed data structure.
Jonckheere Terpstra test null hypothesis and ordered alternative
The Jonckheere Terpstra test alternative describes a monotone direction rather than unspecified inequality.
The Jonckheere Terpstra test null hypothesis states that the outcome distributions are the same across the ordered groups. The increasing alternative states that later groups tend to produce larger outcomes, with at least one strict improvement. A decreasing test reverses the direction.
Increasing alternative used in this analysis
H0: the distribution of G3 is the same across studytime levels 1, 2, 3, and 4.
H1: G3 follows an ordered increasing tendency across studytime 1 < 2 < 3 < 4, with at least one strict difference.
The directional claim was encoded before inference. Higher-group observations are counted as favorable when they exceed lower-group observations. Ties receive one-half.
Decreasing and two-sided questions
A decreasing Jonckheere Terpstra trend test reverses the favorable comparison: a later group supports the alternative when its outcome is lower. Some software also provides two-sided output, but a non-directional research question is often better served by a general omnibus method because the principal advantage of the JT test comes from concentrating power on a planned order.
The distinction parallels the general logic of one-tailed testing, while the interpretation of α and p-values follows the framework described in p-value, significance level and test statistic.
Later ordered groups tend to have larger outcomes.
Later ordered groups tend to have smaller outcomes.
Use a general multi-group test rather than choosing the direction from the data.
Jonckheere Terpstra test formula and calculation by hand
The Jonckheere Terpstra test statistic is a sum of favorable cross-group comparisons across every ordered pair.
The Jonckheere-Terpstra test by hand is easiest to understand as a collection of Mann–Whitney-style order counts. For every lower group i and higher group j, compare every observation in group i with every observation in group j. Award one point when the higher-group value is larger, one-half point for a tie, and zero when it is smaller.
The overall Jonckheere Terpstra statistic is the sum of the ordered-pair scores for all group pairs.
I(·) is an indicator. A favorable higher-group outcome contributes 1; a cross-group tie contributes 0.5.
The maximum occurs when every observation in each later group exceeds every observation in every earlier group.
Under exchangeability and no directional trend, half of all cross-group comparisons are expected to favor the specified order after ties receive half credit.
Seven calculation steps
- Place the groups in their theoretical order.
- Choose increasing or decreasing before viewing the result.
- Compare every observation in group 1 with every observation in groups 2, 3, and 4.
- Repeat for group 2 against groups 3 and 4, then group 3 against group 4.
- Score favorable comparisons as 1 and ties as 0.5.
- Sum all six group-pair contributions to obtain JT.
- Evaluate the statistic using an exact, asymptotic, or permutation null distribution.
Current calculation totals
The standard error and normal approximation can be derived with tie corrections, but the current workbook uses a fixed-size permutation reference. Permutation inference is especially transparent because it preserves the observed G3 values, the observed ties, and the four group sizes while repeatedly breaking the relationship between grade and studytime.
Jonckheere Terpstra test example: final grade across study-time levels
A complete Jonckheere Terpstra test analysis using 649 student records.
This Jonckheere Terpstra test example evaluates whether the distribution of final grade G3 tends to increase across four ordered studytime categories. The categories represent increasing weekly study-time bands, so the order 1 < 2 < 3 < 4 is meaningful before the grades are analyzed.
Variables used
| Role | Variable | Definition |
|---|---|---|
| Outcome | G3 | Final grade, numeric, with larger values representing stronger performance. |
| Ordered grouping variable | studytime | Four ordered study-time levels coded 1, 2, 3, and 4. |
| Direction | Increasing | The prespecified alternative is G31 ≤ G32 ≤ G33 ≤ G34, with at least one strict ordering. |
| Inference | Fixed-size permutation | Studytime labels are permuted while the group counts remain 212, 305, 97, and 35. |
Why the design matches the test
Each student contributes one final grade and belongs to one studytime category, so the samples are independent. The response is numeric and orderable. The group sequence has a natural educational interpretation. The test direction is positive because the substantive expectation is that greater study time is associated with stronger final performance.
The study is observational, so the result describes an ordered association rather than a guaranteed causal effect. Potential confounding is part of the distinction between experimental and quasi-experimental design, and a regression model would be needed to adjust for additional predictors.
Complementary summaries such as descriptive statistics, five-number summaries, standard deviations, and ranges help describe the data but do not replace the directional inference.
Exact Jonckheere Terpstra test results and interpretation
The observed Jonckheere Terpstra test statistic is more than six permutation standard deviations above the null center.
The Jonckheere Terpstra test statistic meaning becomes clear when the observed JT value is compared with its permutation reference. The observed value of 85,922 is far larger than the null distribution generated by random reassignment of the ordered group labels.
Primary inference
Reject H0
The one-sided Monte Carlo probability is below .05. Final grades show a statistically significant increasing tendency across the prespecified studytime order.
Calculation audit
| Metric | Value | Interpretation |
|---|---|---|
| Observed JT | 85,922 | Ordered-pair score for the increasing studytime alternative. |
| Theoretical null center | 68,149.5 | Half of the 136,299 possible cross-group comparisons. |
| Monte Carlo null mean | 68,196.98 | Average JT across 2,000 random label permutations; small simulation deviation from the theoretical center is expected. |
| Monte Carlo null SD | 2,591.88 | Estimated spread of JT under the null with the observed ties and group sizes. |
| z from permutation | 6.8387 | The observed JT is 6.84 permutation standard deviations above the simulated mean. |
| One-sided p-value | 0.0004998 | Using the plus-one Monte Carlo rule, the smallest possible p with 2,000 permutations is 1/2,001. |
The statistical result should be interpreted together with effect size, statistical power, sample design, and the practical size of the grade differences. A small p-value measures compatibility with the null model, not educational importance by itself.
Pairwise order counts behind the Jonckheere Terpstra statistic
Six ordered group pairs combine to produce the overall Jonckheere Terpstra test result.
The Jonckheere Terpstra test table below shows how each ordered pair contributes to JT. The score is the number of higher-group observations exceeding lower-group observations plus one-half of the ties. Dividing by ninj gives a readable ordered-pair share.
| Ordered pair | Possible comparisons | Higher group wins | Ties | Lower group wins | JT contribution | Ordered share |
|---|---|---|---|---|---|---|
| 1 vs 2 | 64,660 | 36,872 | 6,765 | 21,023 | 40,254.5 | 62.26% |
| 1 vs 3 | 20,564 | 14,059 | 1,805 | 4,700 | 14,961.5 | 72.76% |
| 1 vs 4 | 7,420 | 4,748 | 737 | 1,935 | 5,116.5 | 68.96% |
| 2 vs 3 | 29,585 | 16,445 | 2,963 | 10,177 | 17,926.5 | 60.59% |
| 2 vs 4 | 10,675 | 5,551 | 1,063 | 4,061 | 6,082.5 | 56.98% |
| 3 vs 4 | 3,395 | 1,413 | 335 | 1,647 | 1,580.5 | 46.55% |
Where the positive trend is strongest
The largest proportional signal occurs for studytime 1 versus 3: 72.76% of all cross-group comparisons favor the higher studytime category after half-credit ties. The 1 vs 4 and 1 vs 2 contrasts are also strongly aligned with the planned increase. These results show that the low-studytime group is the principal anchor of the ordered trend.
Why level 4 does not invalidate the test
The 3 vs 4 ordered share is 46.55%, slightly below the 50% null center. This local reversal matches the nearly identical descriptive levels for groups 3 and 4. The overall JT test remains strongly positive because the other five ordered pairs contribute enough concordance to place the total statistic far above its null distribution.
Permutation null distribution and Monte Carlo p-value
The Jonckheere Terpstra test permutation design reproduces the null hypothesis while preserving ties and group counts.
The worked Jonckheere Terpstra test uses permutation inference because the sample contains many tied final grades and strongly unequal group sizes. Under the null, studytime labels are exchangeable relative to G3. Reassigning the labels creates datasets with no systematic ordered association while preserving the observed grades and the four group sizes.
Permutation algorithm
- Keep all 649 G3 values fixed.
- Randomly permute the studytime labels.
- Preserve the original counts of 212, 305, 97, and 35.
- Recalculate JT for the increasing order 1 < 2 < 3 < 4.
- Repeat the process 2,000 times with seed 20260716.
- Count permutations with JT at least as large as the observed 85,922.
- Use the plus-one formula to avoid a zero Monte Carlo p-value.
Monte Carlo probability formula
B is the number of random permutations. No simulated statistic reached the observed JT, so p̂ = 1/(2,000 + 1) = 0.00049975.
A larger number of permutations would provide finer probability resolution. With 2,000 permutations, the result is already well below .05 and .01, so the inferential conclusion is stable.
Permutation testing does not repair a biased design. Issues such as sampling bias, confounding, dependent observations, or incorrect category order remain substantive design concerns even when the randomization calculation is exact for the observed labels.
Jonckheere Terpstra test in Python
A transparent Python Jonckheere Terpstra test calculation reproduces the ordered-pair statistic and permutation reference.
The Jonckheere Terpstra test in Python can be implemented directly with NumPy or standard array operations because the statistic has a clear pair-count definition. The current Python analysis computes all six ordered group-pair contributions, performs 2,000 fixed-size label permutations, and saves a fully reproducible report. Readers building broader workflows may also review categorical data analysis in Python and correlation in Python.
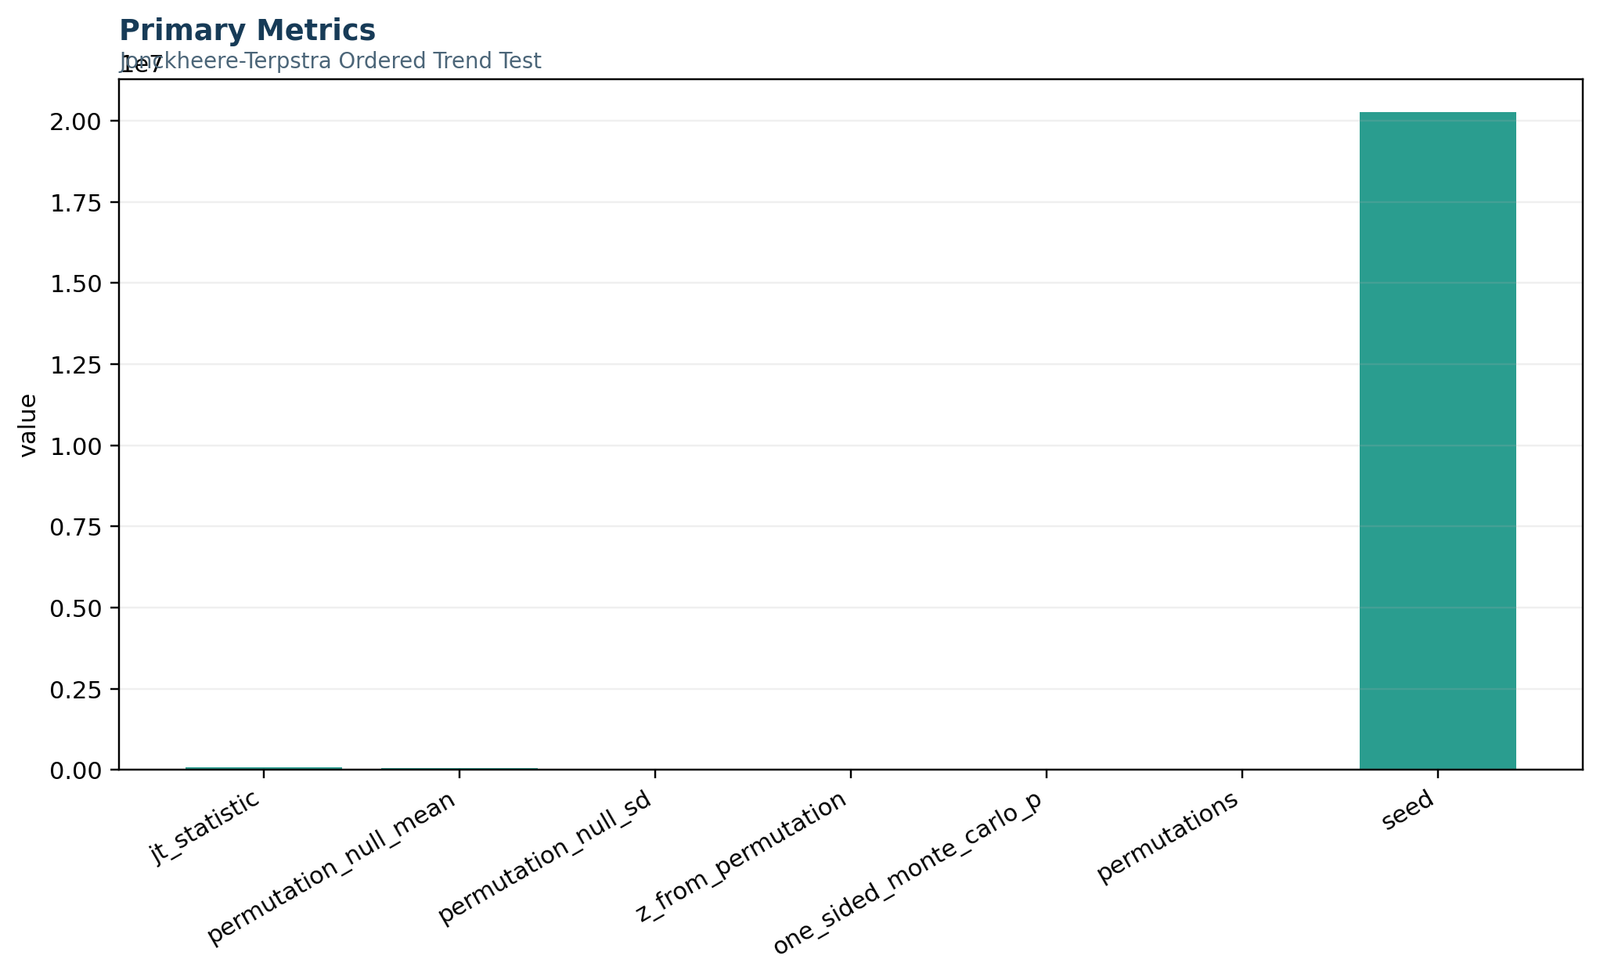
Python chart 1: primary Jonckheere Terpstra metrics
The primary metrics panel summarizes the complete inferential engine: JT = 85,922, permutation null mean 68,196.98, null SD 2,591.88, z = 6.8387, one-sided Monte Carlo p = 0.0004998, 2,000 permutations, and seed 20260716. The large positive standardized distance shows that the observed increasing order is far stronger than random relabeling typically produces.
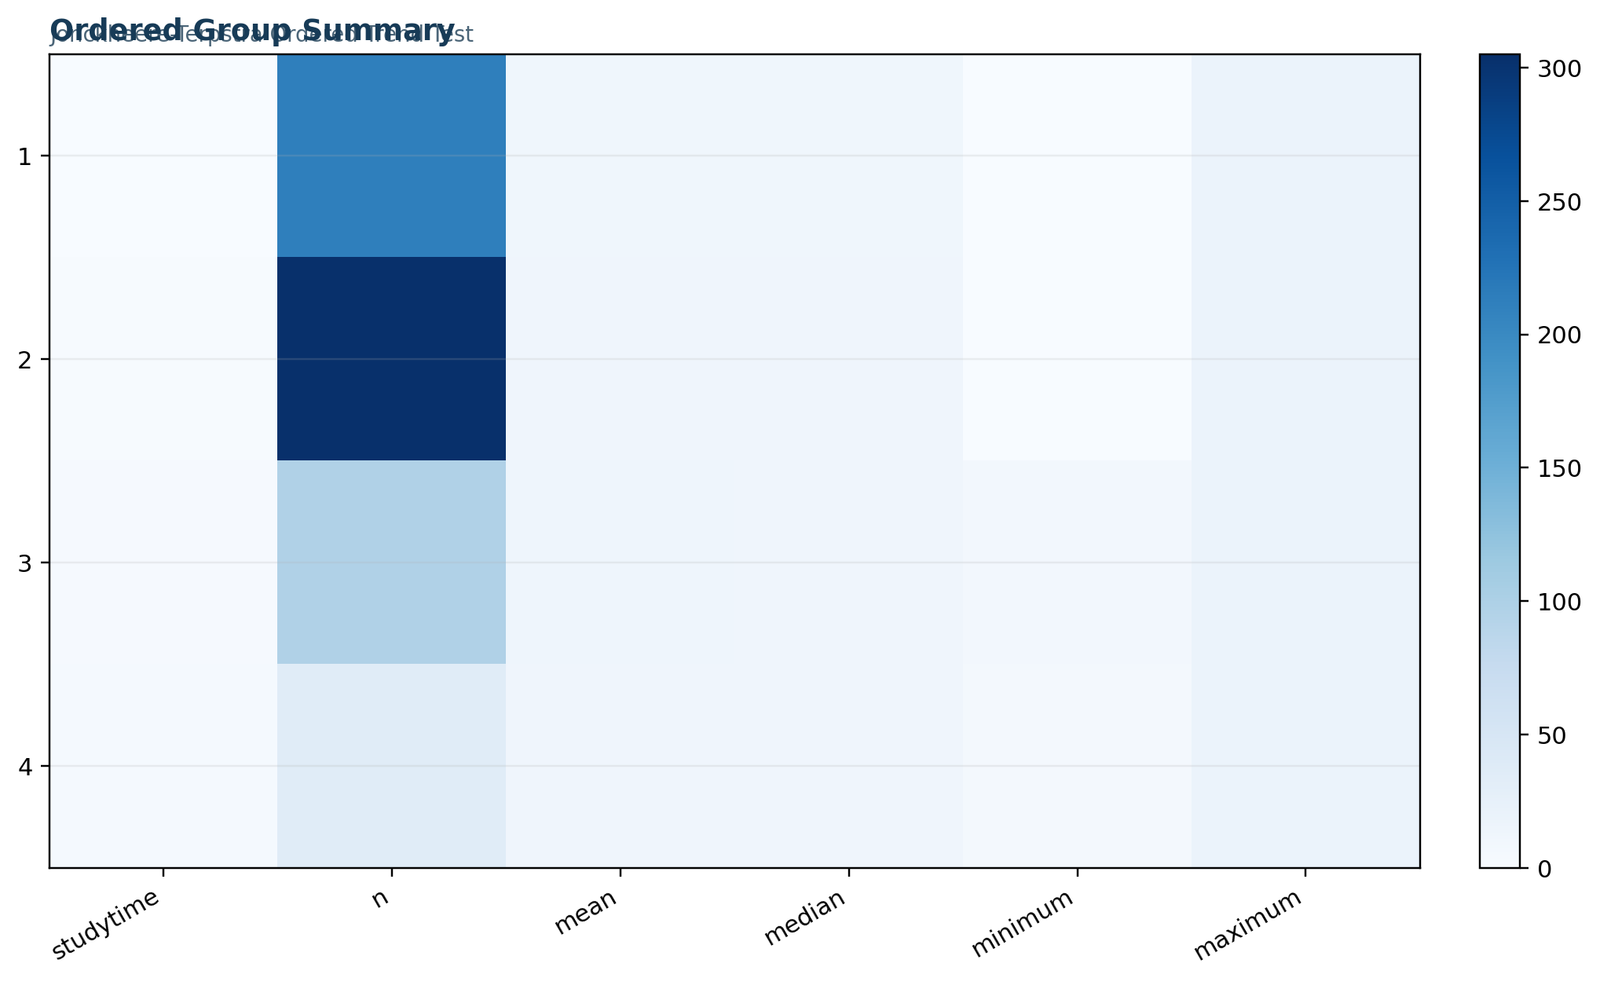
Python chart 2: ordered group summary
This figure organizes the descriptive evidence in the same 1-to-4 order used by the test. Sample sizes are 212, 305, 97, and 35; means are 10.84, 12.09, 13.23, and 13.06; medians are 11, 12, 13, and 13. The chart shows a strong early rise and a high plateau at the final two levels rather than a perfectly linear increase.
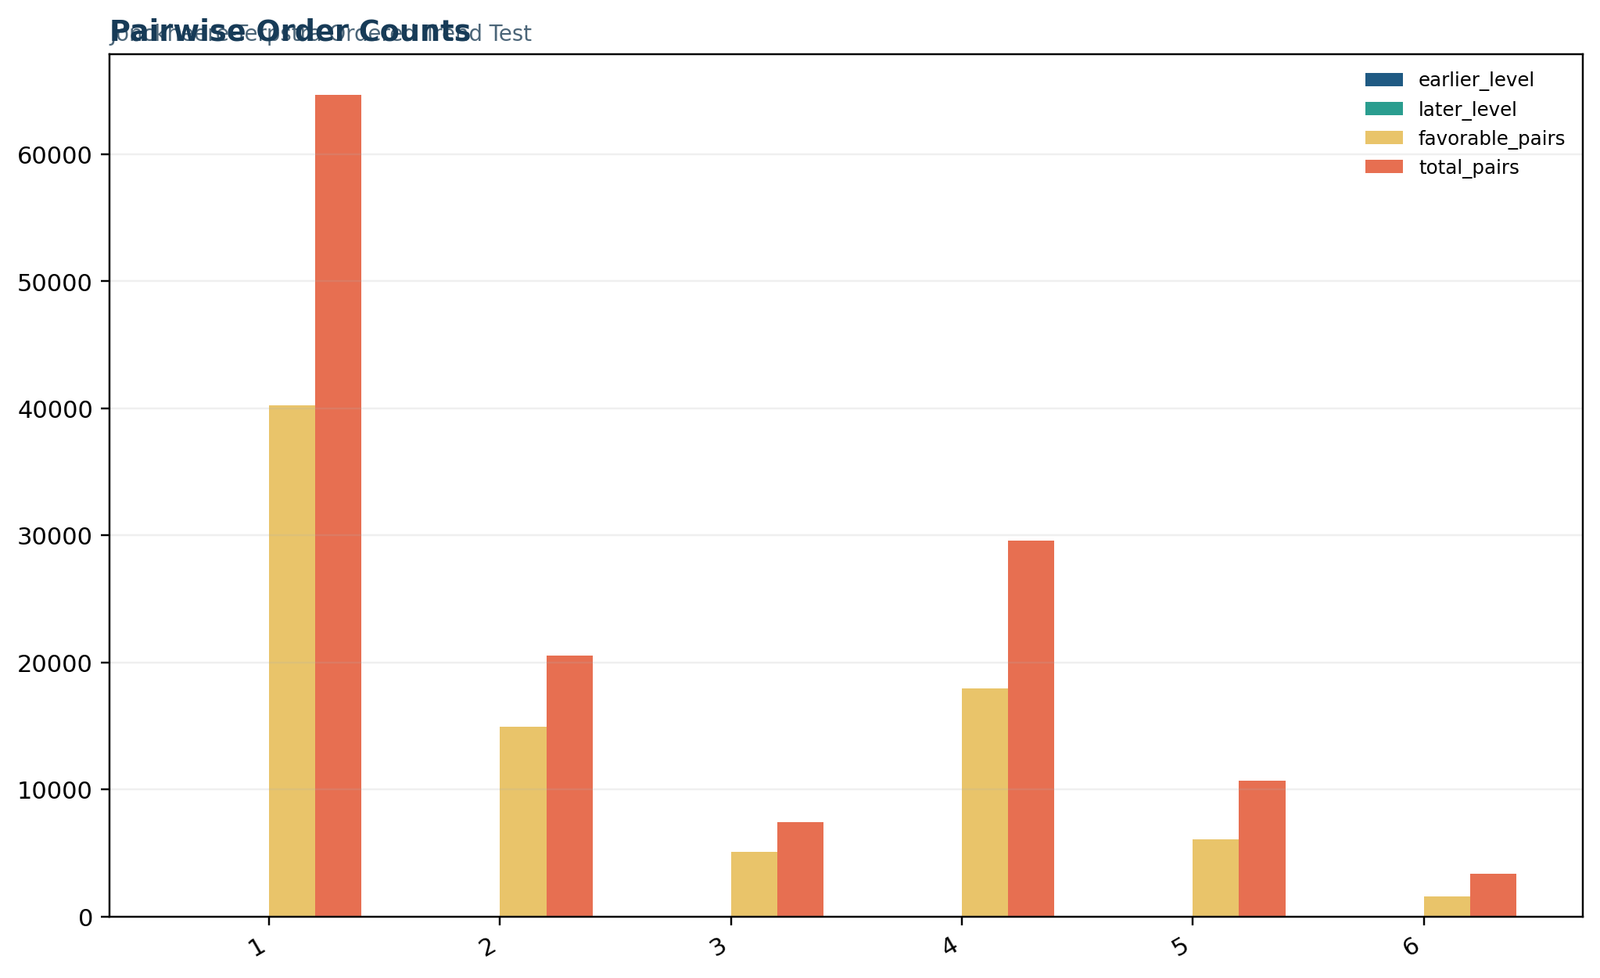
Python chart 3: pairwise order-count contributions
The six contributions sum exactly to 85,922. The strongest proportional order appears for 1 vs 3 (72.76%) and 1 vs 4 (68.96%). The 3 vs 4 component is slightly contrary to the planned direction (46.55%), illustrating that the global JT statistic integrates the complete order instead of demanding a perfect increase in every adjacent pair.
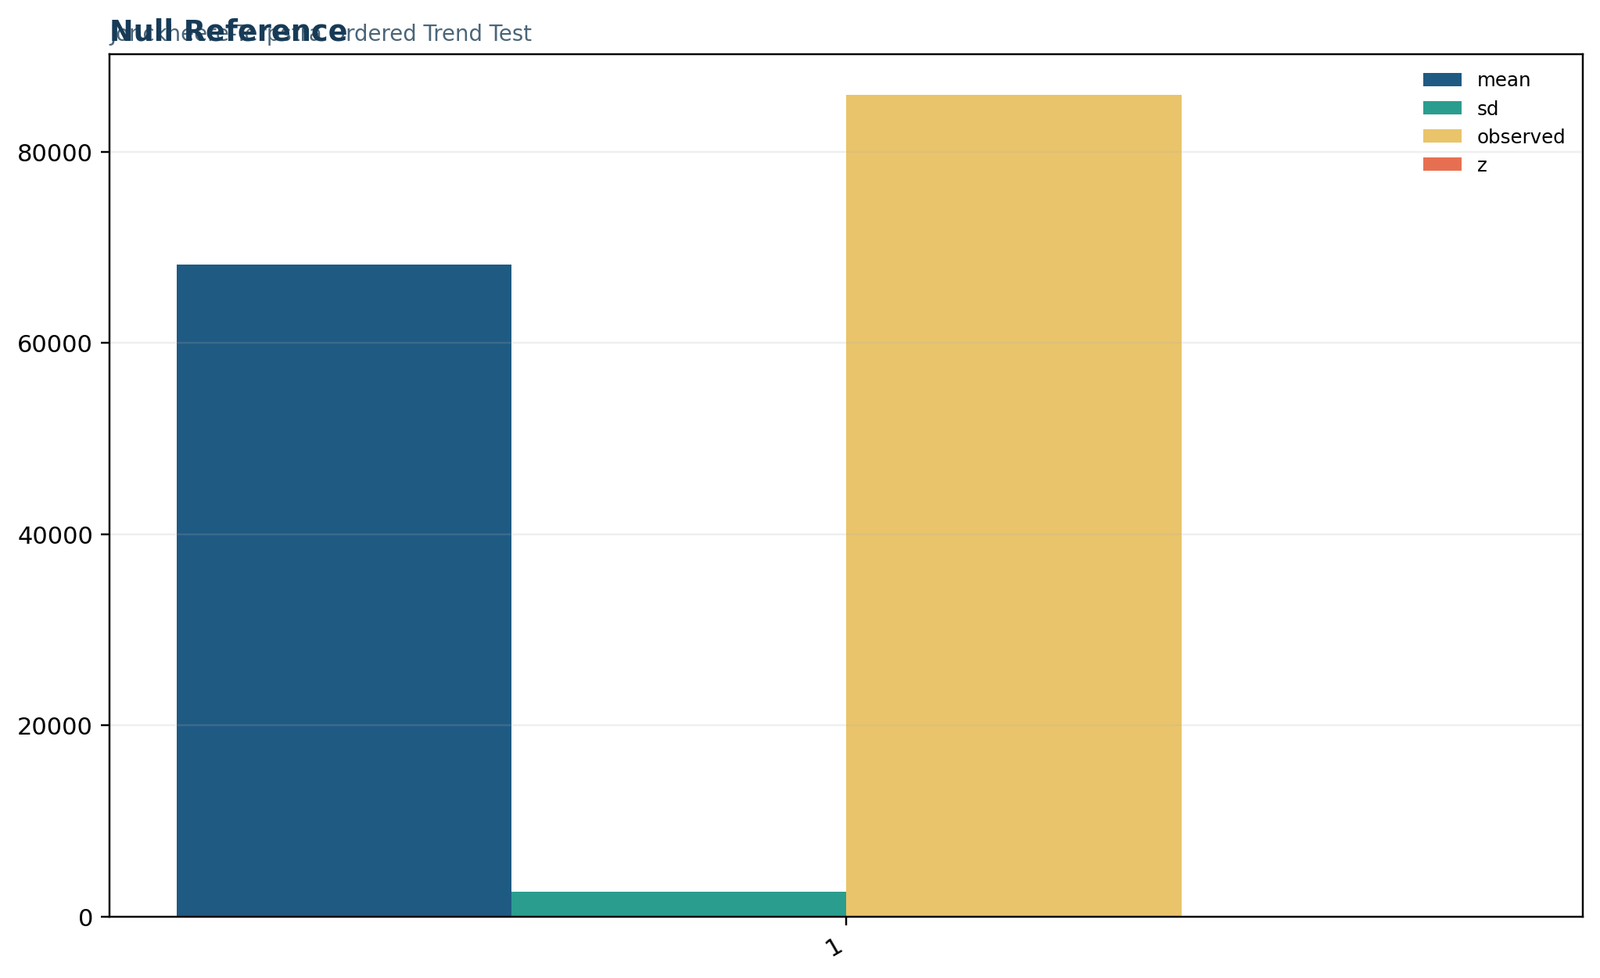
Python chart 4: observed statistic against the null reference
The observed JT lies well to the increasing side of the null center. Its distance of 17,725.02 above the simulated mean corresponds to 6.84 null standard deviations. This separation visually explains the very small one-sided p-value.
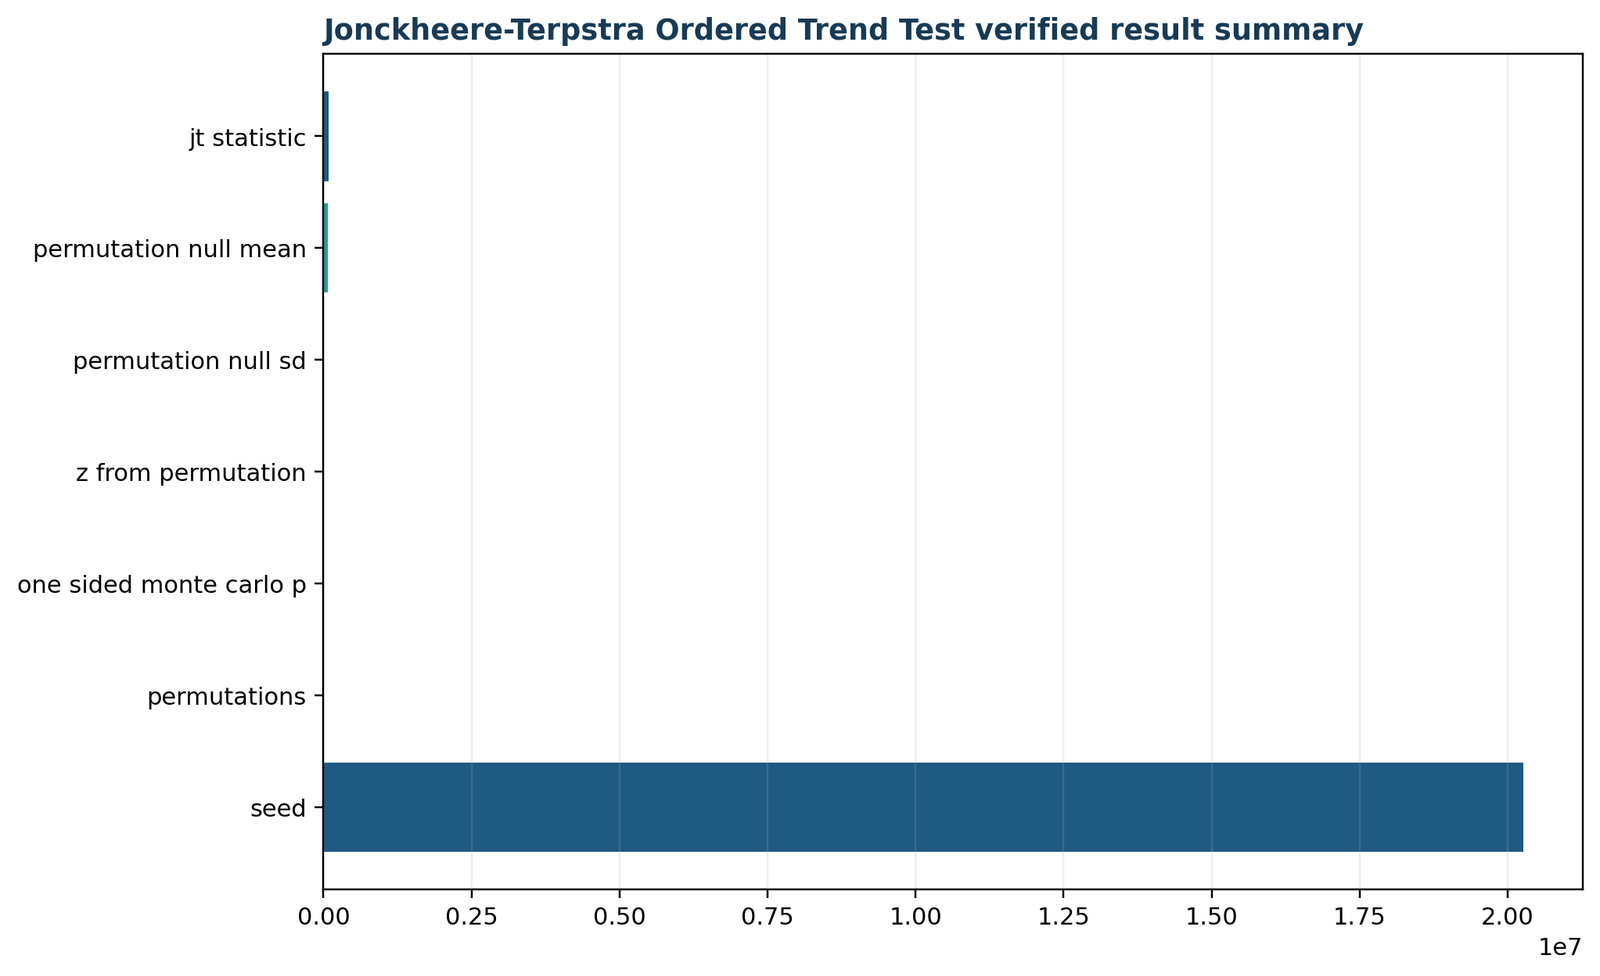
Python chart 5: verified ordered-trend conclusion
The final summary combines the hypothesis, statistic, simulation settings, and decision. It confirms that the increasing G3 pattern is statistically significant at α = .05 and that the workbook, Python calculations, and reproducibility checks agree on the exact JT statistic and permutation z value.
groups = [g3[studytime == level] for level in [1, 2, 3, 4]]jt = 0.0
for i in range(len(groups) - 1):
for j in range(i + 1, len(groups)):
lower = groups[i][:, None]
higher = groups[j][None, :]
jt += (higher > lower).sum() + 0.5 * (higher == lower).sum()
# Permute ordered-group labels while preserving the group sizes,
# recalculate JT, and use the plus-one Monte Carlo p-value.
Jonckheere Terpstra test in R
R supports exact, asymptotic, and permutation-oriented Jonckheere Terpstra test implementations.
The Jonckheere Terpstra test in R is commonly performed with functions that accept the outcome, an ordered grouping variable, a directional alternative, and an optional permutation count. For the current large tied dataset, permutation inference matches the workbook design. Related R resources include categorical data analysis in R, correlation in R, and ANOVA in R.
R chart 1: primary ordered-trend metrics
The R metrics reproduce the same observed statistic and permutation reference as Python and Excel. Agreement on JT = 85,922, z = 6.8387, and p = 0.0004998 demonstrates that the result is a property of the data and scoring rule rather than one software’s default formatting.
R chart 2: ordered studytime summary
The ordered group profile shows that studytime 1 has the lowest grade distribution, level 2 is higher, and levels 3 and 4 occupy the upper part of the outcome scale. This pattern is consistent with a monotone rise that levels off at the highest categories.
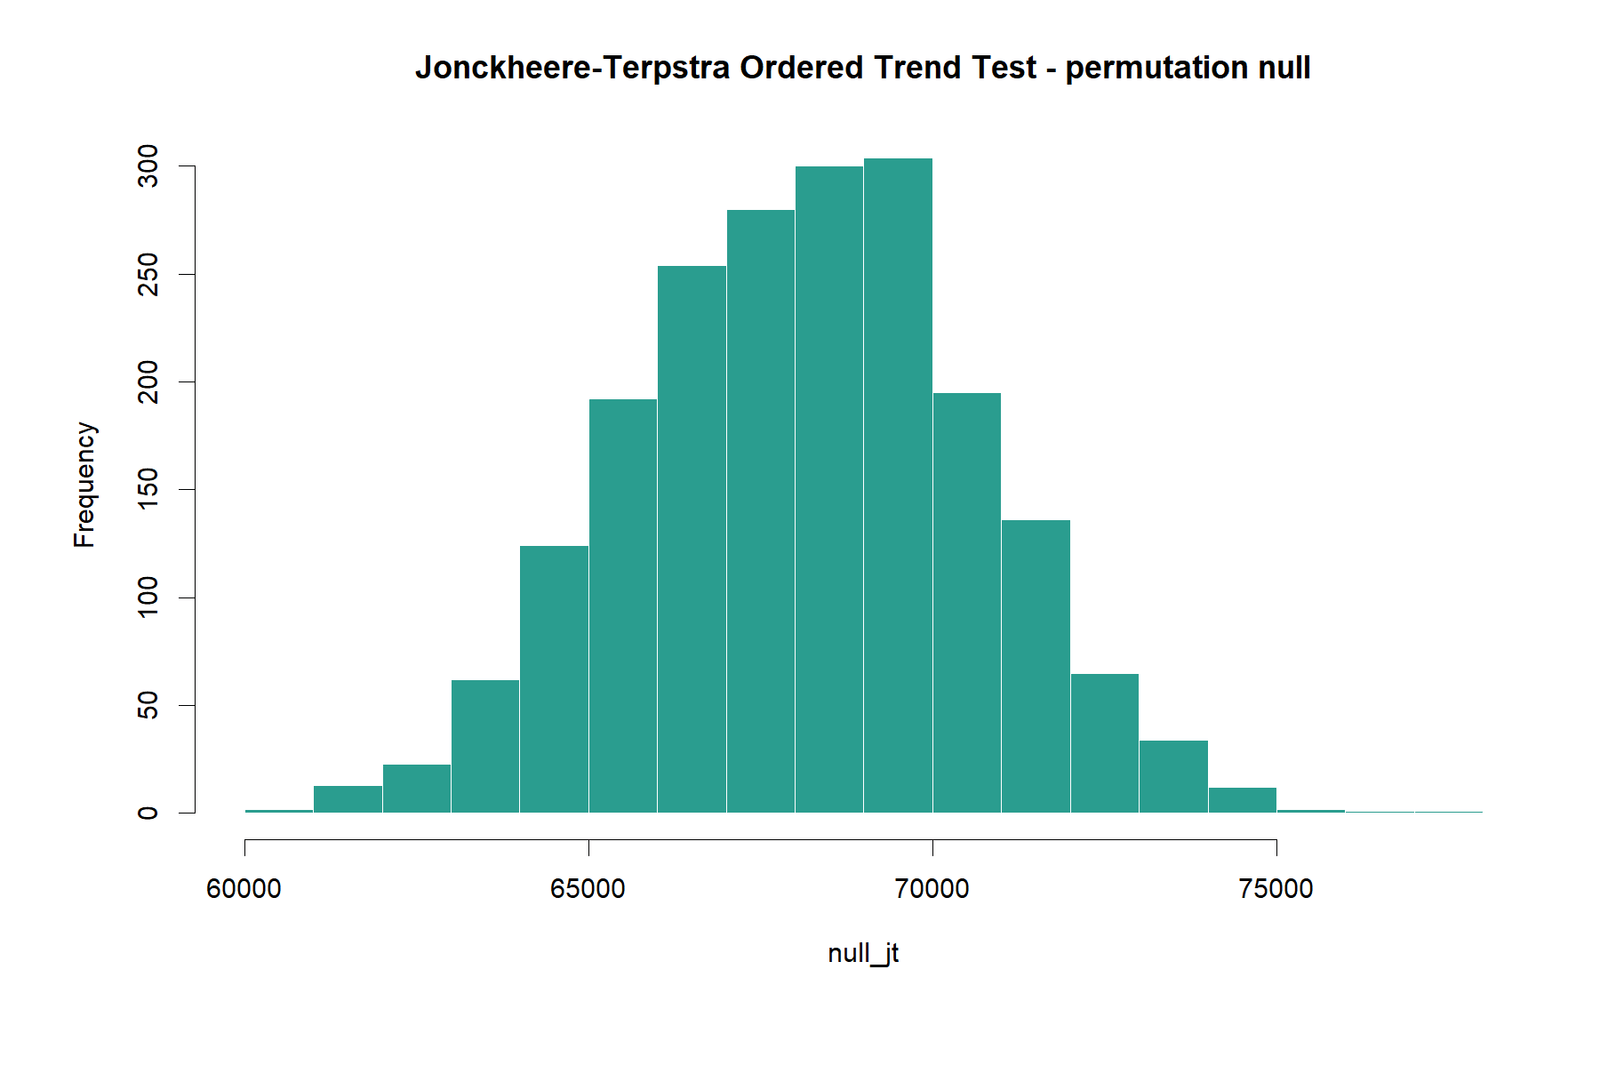
R chart 3: permutation null distribution
The permutation histogram places the observed statistic in the extreme right tail of the null distribution. The random-label statistics cluster around roughly 68,197, while the observed 85,922 is so far to the right that none of the 2,000 simulated values equals or exceeds it.
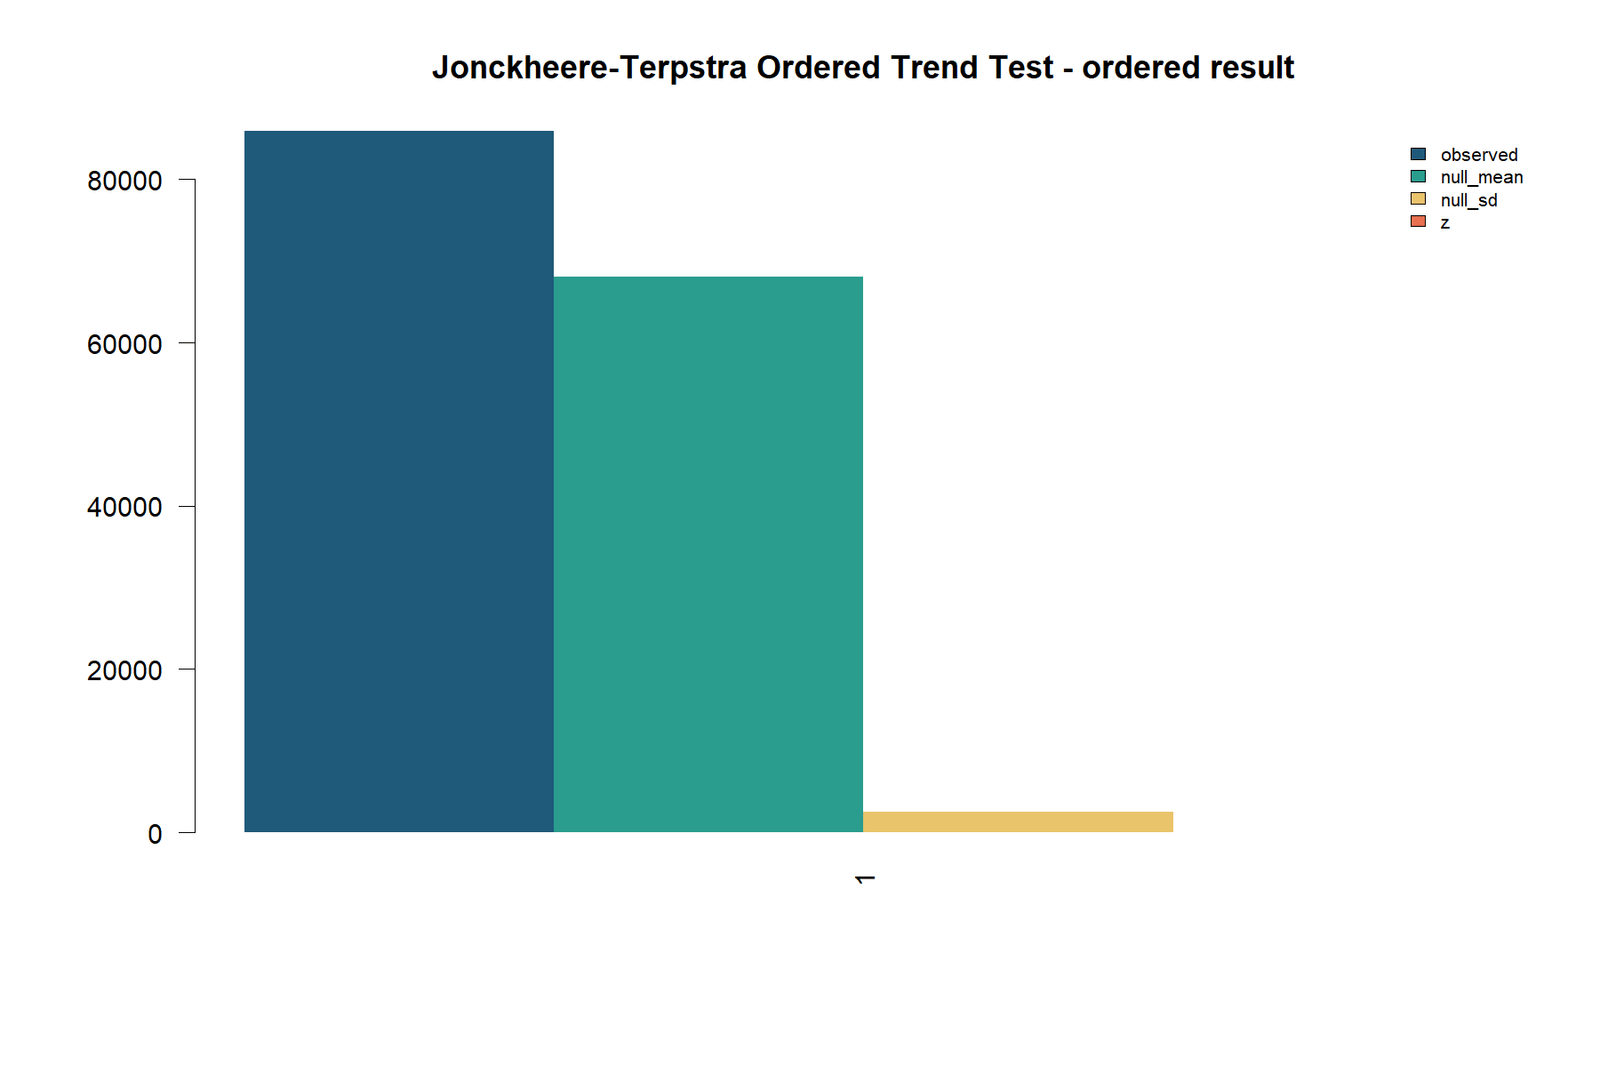
R chart 4: ordered result
This visual emphasizes the substantive direction rather than only the p-value. Final grades generally increase as the ordered studytime category rises. The small level-3-to-level-4 reversal is visible, but the combined evidence across all ordered group pairs remains strongly positive.
R chart 5: verified result summary
The verified summary records the planned increasing alternative, the fixed simulation settings, and the final decision to reject the null hypothesis. It provides a concise end point for reporting the Jonckheere-Terpstra test in R.
library(clinfun)dat$studytime_ordered <- factor(
dat$studytime,
levels = c(1, 2, 3, 4),
ordered = TRUE
)
jonckheere.test(
x = dat$G3,
g = dat$studytime_ordered,
alternative = "increasing",
nperm = 2000
)
Jonckheere Terpstra test in SPSS
SPSS provides a Jonckheere Terpstra test option for independent samples when the grouping codes are correctly ordered.
The Jonckheere Terpstra test SPSS workflow requires one numeric outcome column and one grouping column whose numeric codes represent the intended order. In the current example, G3 is the test variable and studytime is coded 1 through 4. Readers can place this workflow beside categorical data analysis in SPSS, correlation in SPSS, and ANOVA in SPSS.
SPSS analysis sequence
- Verify that studytime codes increase in the intended theoretical direction.
- Specify G3 as the test field and studytime as the group field.
- Select the independent-samples nonparametric procedure.
- Request the Jonckheere–Terpstra ordered-alternative test.
- Choose an increasing alternative for 1 < 2 < 3 < 4.
- Retain exact or Monte Carlo output when the software license and procedure support it.
- Report the group order, standardized statistic, directional p-value, and descriptive summaries.
SPSS interpretation
A positive standardized statistic supports an increase when the group codes are ordered from low to high and the requested alternative matches that sequence. The central interpretive requirement is not the menu path but the coding: changing 1, 2, 3, 4 to an arbitrary or reversed order changes the hypothesis.
The SPSS report documents the same G3-by-studytime analysis and reconciles with JT = 85,922 and the strong directional conclusion. Minor differences in displayed standardized statistics can occur when software uses an asymptotic tie-corrected variance rather than the empirical standard deviation of the 2,000 permutation statistics.
Jonckheere Terpstra test in Excel
The Jonckheere Terpstra test Excel workbook exposes every observation-level contribution and the verified simulation summary.
The Jonckheere-Terpstra test in Excel workbook is organized as an auditable analysis rather than a black-box calculator. Raw values are separated from working columns, the ordered-pair contribution is visible for every record, the final statistic is cross-checked, and the reporting sheet compares workbook results with verified reference values. Readers interested in spreadsheet-based methods can also review correlation in Excel, regression in Excel, and t tests in Excel.
| Workbook sheet | Purpose | Key content |
|---|---|---|
| Guide | Method identity and design | Ordered alternative, variables, sample size, α, formula, and reproducibility description. |
| Data_Input | Raw analysis variables | 649 rows of G3 and studytime without calculated outputs. |
| Working | Observation-level pair scoring | For each row, the favorable-plus-half-tied comparisons with all prespecified higher studytime groups. |
| Calculations | Primary inference | Observed JT, permutation mean, permutation SD, z, p-value, permutation count, and seed. |
| Diagnostics | Method checks | Ordered alternative, pair-scoring rule, and fixed-size permutation inference. |
| Reporting | Independent verification | Exact agreement for JT, z, permutation count, and seed. |
Observation-level formula logic
For a student in studytime group g, the working sheet counts grades in every later group that exceed the student’s G3, then adds one-half of the equal grades. Summing this row-level contribution across all students in groups 1, 2, and 3 yields the overall JT statistic.
This structure makes the workbook particularly useful for checking ties, group order, and the effect of each record.
Verified Excel outputs
Jonckheere Terpstra test in SAS, Stata and MATLAB
The same Jonckheere Terpstra test hypothesis can be implemented in several statistical environments.
Keyword searches include Jonckheere Terpstra test SAS, Jonckheere Terpstra test SAS code, Jonckheere Terpstra test Stata, and MATLAB implementations. Software availability varies, but the statistical specification remains the same: independent ordered groups, a directional alternative, tie-aware scoring, and a suitable reference distribution.
SAS
SAS trend procedures can provide a Jonckheere–Terpstra statistic for ordered categories. The critical setup is to ensure that the class values sort in the intended order and that the requested direction matches the research hypothesis. Exact or Monte Carlo options are valuable for tied or modest samples.
Stata
Stata users may rely on community-contributed commands or implement the statistic from cross-group order counts. A reproducible workflow should document the command version, category order, handling of ties, and whether the reported probability is exact, asymptotic, or permutation-based.
MATLAB
MATLAB implementations commonly accept a matrix or grouped vectors and return the JT statistic with a normal or permutation probability. Results should be checked against the transparent formula: higher-group wins plus one-half of ties across all i < j group pairs.
Jonckheere Terpstra test compared with alternative methods
The best alternative to the Jonckheere Terpstra test depends on whether the hypothesis is directional, general, independent, repeated, or model-based.
| Method | Design and question | Difference from the Jonckheere Terpstra test |
|---|---|---|
| Jonckheere Terpstra test | Three or more independent ordered groups; prespecified increase or decrease | Uses all cross-group order counts and concentrates power on a monotone alternative. |
| Kruskal–Wallis test | Three or more independent groups; any distributional difference | Omnibus and non-directional; does not use a planned category order. |
| Mann–Whitney U test | Two independent groups | One group pair only; JT can be viewed as a structured sum of U-style comparisons across multiple ordered groups. |
| One-way ANOVA | Independent groups; differences in means under a parametric model | Mean-based and not specifically directional. See one-way ANOVA and ANOVA assumptions. |
| Welch’s ANOVA | Independent means with unequal variances | Parametric mean comparison; Welch’s ANOVA addresses heteroscedasticity rather than ordered ranks. |
| Page trend test | Repeated or blocked observations with a predicted treatment order | Designed for related samples, whereas JT requires independent groups. |
| Spearman correlation | Monotonic association between two rankable variables | Treats both variables as measured ranks rather than one variable defining independent ordered groups. |
| Kendall’s tau | Ordinal concordance between two variables | Produces an association coefficient; see Kendall’s tau-b for tie-adjusted correlation. |
| Ordinal logistic regression | Ordinal outcome with predictors and covariate adjustment | Model-based and capable of adjustment; see ordinal logistic regression. |
| Linear regression trend | Numeric outcome modeled against scored group levels | Imposes a functional mean relationship; review simple linear regression and regression assumptions. |
Diagnostics, sensitivity analysis, power and effect interpretation
A complete Jonckheere Terpstra test analysis checks the design, ordering, data structure, and practical pattern.
The Jonckheere Terpstra test power depends on sample size, group balance, outcome separation, tie frequency, and whether the true population pattern matches the specified direction. The current sample is large, but the highest studytime group contains only 35 students, so uncertainty is greater at the upper end of the order.
Diagnostic checklist
Descriptive effect interpretation
The observed ordered-pair share is 0.6304, compared with a null center of 0.5. This means that a randomly selected higher-studytime student has a 63.04% favorable-plus-half-tie score against a randomly selected lower-studytime student when all six group pairs are weighted by their numbers of possible comparisons.
The standardized permutation distance is z = 6.8387. A simple z/√N summary equals approximately 0.268, but this is not a universal named effect size for the Jonckheere Terpstra test. The ordered-pair share and group descriptives provide a more transparent substantive account.
Outliers
Ranks reduce the direct numerical influence of extreme observations, but extremes still affect cross-group order counts. Use outlier detection to understand data quality rather than automatically deleting valid cases.
Distribution shape
Compare percentiles and quartiles, IQRs, and histograms. A significant stochastic order can coexist with different spreads or shapes.
Power planning
Simulation under plausible ordered distributions is often the clearest planning method. Power should be evaluated before data collection alongside α, sample allocation, and expected tie rates.
APA reporting, downloads and related statistical guides
Report the Jonckheere Terpstra test direction, statistic, reference method, simulation settings, and substantive pattern.
A strong answer to how to report the Jonckheere Terpstra test states the group order before the result, identifies whether the p-value is one-sided, and distinguishes the global ordered tendency from perfect step-by-step increase.
APA-style reporting example
A one-sided Jonckheere–Terpstra test was conducted to evaluate whether final grade increased across the ordered study-time levels 1, 2, 3, and 4. The analysis indicated a significant increasing trend, JT = 85,922, permutation z = 6.84, Monte Carlo p = .00050, based on 2,000 fixed-size label permutations. Group medians were 11, 12, 13, and 13, respectively. Thus, higher study-time categories generally showed higher final-grade distributions, although levels 3 and 4 formed a high plateau rather than a strictly increasing final step.
Minimum reporting elements
- Name the Jonckheere Terpstra test and state the directional alternative.
- List the ordered categories exactly as analyzed.
- Name the outcome and provide group sample sizes.
- Report JT, the reference method, z when available, and the one-sided p-value.
- State the number of permutations and seed for reproducible Monte Carlo inference.
- Add medians, means, IQRs, or an ordered-pair interpretation for practical context.
Interpretation language
- Use “evidence of an increasing ordered trend” rather than “all groups are different.”
- Do not interpret p as the probability that the null hypothesis is true.
- Do not claim causality from an observational grouping variable.
- Do not hide local departures such as the level-3-to-level-4 plateau.
These principles align with broader guides to null and alternative hypotheses, confidence intervals, and margin of error.
Download the complete Jonckheere Terpstra analysis
Python reportOrdered-pair calculations, permutation inference, charts, and verified findings.Open Python PDF
R reportR implementation, permutation null distribution, and ordered result summary.Open R PDF
SPSS outputSPSS ordered-alternative analysis and inferential output.Open SPSS PDF
Worked Excel analysisRaw data, observation-level scores, calculations, diagnostics, and verification.Open Excel workbook
Related guides
Jonckheere Terpstra test FAQs
Answers to the most common interpretation, software, formula and reporting questions.
What is the Jonckheere Terpstra test?
The Jonckheere Terpstra test is a nonparametric trend test for three or more independent groups with a prespecified order. It evaluates whether outcomes tend to increase or decrease across that order.
What is the Jonckheere Terpstra test null hypothesis?
The null hypothesis states that the outcome distributions are the same across the ordered groups. The directional alternative states that later groups tend to produce systematically larger or smaller outcomes.
When should the Jonckheere Terpstra test be used?
Use it when there are at least three independent groups, the categories have a meaningful order, the outcome is ordinal or continuous, and an increasing or decreasing trend was predicted before analysis.
How is the JT statistic calculated?
Every lower-group observation is compared with every observation in each higher group. A favorable higher-group value scores 1, a tie scores 0.5, and an unfavorable comparison scores 0. The scores are summed across all ordered group pairs.
What does a large JT statistic mean?
For an increasing alternative, a large JT means that higher ordered groups frequently have larger outcomes than lower groups. Its extremeness must be judged relative to the exact, asymptotic, or permutation null distribution.
Can group sizes be unequal?
Yes. Unequal group sizes are allowed. The maximum contribution from each group pair is ninj, so the statistic naturally reflects the number of available comparisons.
How are ties handled?
A cross-group tie receives one-half point. Permutation inference retains the observed tied values and therefore provides a direct null reference for the actual data structure.
Is the Jonckheere Terpstra test one-sided?
Its principal use is directional: increasing or decreasing. Some software offers two-sided output, but a general non-directional multi-group question is usually better matched to an omnibus test.
Is the test the same as Kruskal–Wallis?
No. Kruskal–Wallis tests for any difference among independent groups. The Jonckheere Terpstra test uses a prespecified order and is designed to detect a monotone trend.
Is it the same as Kendall’s tau?
No. Both use concordance concepts, but Kendall’s tau is an association coefficient for two rankable variables. The Jonckheere Terpstra test is a hypothesis test for ordered independent groups.
What did the worked example find?
The observed statistic was JT = 85,922 with permutation z = 6.8387 and one-sided p = 0.0004998. Final grades tended to rise across studytime levels 1 through 4.
Did every adjacent studytime level increase?
No. Levels 3 and 4 had the same median, and level 4 had a slightly lower mean. The overall result remains significant because the full set of ordered comparisons strongly favors the increasing direction.
Why was permutation inference used?
The dataset is large, tied, and unbalanced. Fixed-size label permutations preserve the grades, ties, and group counts while generating a direct null distribution for the ordered statistic.
What is the minimum Monte Carlo p-value with 2,000 permutations?
With the plus-one rule, the minimum is 1/(2,000 + 1) = 0.00049975. That is the reported value because no permuted JT equaled or exceeded the observed statistic.
Can the Jonckheere Terpstra test be run in R?
Yes. R packages provide exact, asymptotic, and permutation implementations. The group factor must be explicitly ordered and the alternative must be set to increasing or decreasing.
Can it be run in Python?
Yes. The statistic is straightforward to implement from pairwise comparisons, and permutation inference can be programmed by shuffling group labels while retaining the original group sizes.
Can it be run in SPSS?
Yes. SPSS independent-samples nonparametric procedures can evaluate the Jonckheere–Terpstra ordered alternative when the group codes reflect the intended order.
How should the result be reported?
Report the ordered categories, direction, group sizes, JT statistic, reference method, standardized statistic if available, one-sided p-value, permutation count and seed, and descriptive evidence for the trend.