
Robust One-Way ANOVA, Unequal Variances, Unequal Sample Sizes and Welch F Test
Welch’s ANOVA: Formula, Interpretation, SPSS, Python, R and Excel Guide
Welch’s ANOVA is a robust alternative to the ordinary one-way ANOVA when group variances or group sizes may not be equal. In this worked Salar Cafe example, the dependent variable is G3 final grade, the grouping factor is studytime, and the Welch test shows that mean G3 differs significantly across the four studytime groups.
Quick Answer: Welch’s ANOVA Result
The Welch’s ANOVA result compares mean G3 final grade across four studytime groups without relying on the strict equal-variance assumption used by ordinary one-way ANOVA. The group means are approximately 10.84, 12.09, 13.23 and 13.06. The result is statistically significant: Welch F(3, 139.10) = 18.183, p = 5.188e-10.
The decision is to reject the null hypothesis of equal group means. Students in different studytime groups do not have the same average G3 final grade in this dataset. The mean pattern increases from studytime 1 to studytime 3, while studytime 4 remains high but has a much smaller sample size.
Final interpretation: Welch’s ANOVA found a significant difference in mean G3 across studytime groups. The highest mean appears in studytime group 3, followed closely by studytime group 4. Studytime group 1 has the lowest mean G3.
Important reporting point: In this dataset, Levene’s test based on the mean does not reject homogeneity of variance, but Welch’s ANOVA is still valid as a robust one-way ANOVA. It is especially useful because the group sizes are unequal, with n = 212, 305, 97 and 35.
Table of Contents
- What Is Welch’s ANOVA?
- Welch’s ANOVA Formula
- Classic One-Way ANOVA vs Welch’s ANOVA
- Welch’s ANOVA Hypotheses
- Dataset and Variables Used
- Assumptions for Welch’s ANOVA
- SPSS Output Interpretation
- Python Chart-by-Chart Interpretation
- R Chart-by-Chart Validation
- SPSS, R, Python and Excel Workflows
- Code Blocks for Welch’s ANOVA
- APA Reporting Wording
- Common Mistakes
- When to Use Welch’s ANOVA
- Downloads and Resources
- Related Guides
- FAQs
What Is Welch’s ANOVA?
Welch’s ANOVA is a robust version of one-way ANOVA that compares group means while adjusting for unequal variances and unequal group sizes. Ordinary one-way ANOVA pools the group variances into one common error term. Welch’s ANOVA does not depend on that same equal-variance assumption, so it is safer when variances are unequal or sample sizes differ strongly across groups.
In this example, the dependent variable is G3 final grade, and the grouping factor is studytime with four groups. The studytime group sizes are unequal: 212, 305, 97 and 35. Welch’s ANOVA uses group-specific variance and sample-size information to build a robust F statistic and adjusted denominator degrees of freedom.
The important result is that the Welch test is significant. This means the four studytime groups do not have equal mean G3 scores. It does not automatically tell which groups differ from each other. For group-to-group comparisons after Welch’s ANOVA, a Games-Howell post hoc test is usually more appropriate than Tukey when equal variances are not assumed.
Simple definition: Welch’s ANOVA answers this question: “Do the group means differ when we do not fully trust the equal-variance assumption?”
This guide connects naturally with One Way ANOVA, ANOVA Assumptions, Brown Forsythe ANOVA, Brown-Forsythe Test, Levene Test, Bartlett’s Test, F Distribution, ANOVA Effect Size and Eta Squared.
Welch’s ANOVA Formula
The ordinary one-way ANOVA F statistic uses a pooled within-group variance. Welch’s ANOVA instead gives each group a weight based on its sample size and variance. Groups with larger sample sizes and smaller variances receive more weight in the adjusted test.
Here, wi is the Welch weight for group i, ni is the group sample size, and si2 is the group variance. The weighted mean is calculated as:
The Welch F statistic then compares weighted group mean differences with an adjusted error structure. The denominator degrees of freedom are not the same as ordinary one-way ANOVA. In this example, the denominator df is 139.10, not 645.
Welch Weights in This Example
| Studytime Group | n | Mean G3 | SD | Variance | Welch Weight | Interpretation |
|---|---|---|---|---|---|---|
| 1 | 212 | 10.8 | 3.22 | 10.4 | 20.5 | Large group but relatively higher variance. |
| 2 | 305 | 12.1 | 3.24 | 10.5 | 29.0 | Largest weight because this group has the largest n. |
| 3 | 97 | 13.2 | 2.50 | 6.26 | 15.5 | Smaller n but lower variance gives useful weight. |
| 4 | 35 | 13.1 | 3.04 | 9.23 | 3.79 | Smallest weight because the group is small. |
Decision Formula
In this example, p = 5.188e-10, which is far below α = .05. Therefore, the null hypothesis of equal studytime group means is rejected.
Classic One-Way ANOVA vs Welch’s ANOVA
Classic one-way ANOVA and Welch’s ANOVA both test whether group means differ. The difference is how they treat variance and sample size. Classic ANOVA assumes a common within-group variance. Welch’s ANOVA adjusts the test when variances and sample sizes are not perfectly equal.
| Feature | Classic One-Way ANOVA | Welch’s ANOVA | Practical Meaning |
|---|---|---|---|
| Variance assumption | Assumes equal variances. | Does not require equal variances in the same strict way. | Welch is safer when variance equality is doubtful. |
| Group size issue | More sensitive when group sizes are unequal and variances differ. | Adjusts using weights and degrees of freedom. | Welch is useful for unequal n designs. |
| Degrees of freedom | Uses df based on total sample and number of groups. | Uses adjusted denominator df. | The denominator df can be decimal. |
| Example result | F(3, 645) = 15.876, p = 5.706e-10 | F(3, 139.10) = 18.183, p = 5.188e-10 | Both reject equal means in this dataset. |
| Post hoc choice | Tukey is common when equal variances are assumed. | Games-Howell is common when equal variances are not assumed. | Use a post hoc test that matches the assumption decision. |
Practical rule: When Levene’s test is significant, group sizes are very unequal, or variance equality is doubtful, report Welch’s ANOVA. If the Welch result is significant, use a variance-robust post hoc test such as Games-Howell.
Welch’s ANOVA Hypotheses
Welch’s ANOVA tests whether all group means are equal. The hypothesis is the same general mean-comparison hypothesis as one-way ANOVA, but the test statistic and denominator degrees of freedom are adjusted.
| Hypothesis | Statement | Meaning in This Example |
|---|---|---|
| Null hypothesis | H0: μ1 = μ2 = μ3 = μ4 | All studytime groups have the same mean G3. |
| Alternative hypothesis | H1: At least one group mean is different. | At least one studytime group differs in mean G3. |
| Decision rule | Reject H0 if p < .05. | Because p = 5.188e-10, reject H0. |
Decision for this example: The Welch p-value is far below .05, so the studytime group means are not equal. The analysis supports a real mean difference in G3 across studytime groups.
Dataset and Variables Used
The worked example uses student performance data. The dependent variable is G3 final grade. The grouping variable is studytime, which has four groups. The analysis uses 649 valid cases.
| Variable | Role | Levels / Type | Why It Matters |
|---|---|---|---|
| G3 | Dependent variable | Numeric final grade | The outcome whose mean is compared across studytime groups. |
| studytime | Grouping variable | 1, 2, 3, 4 | Defines the four groups in Welch’s ANOVA. |
Descriptive Statistics
| Studytime | N | Mean | SD | SE | 95% CI Lower | 95% CI Upper | Variance |
|---|---|---|---|---|---|---|---|
| 1 | 212 | 10.8443 | 3.21862 | 0.22106 | 10.4086 | 11.2801 | 10.360 |
| 2 | 305 | 12.0918 | 3.24313 | 0.18570 | 11.7264 | 12.4572 | 10.518 |
| 3 | 97 | 13.2268 | 2.50210 | 0.25405 | 12.7225 | 13.7311 | 6.261 |
| 4 | 35 | 13.0571 | 3.03841 | 0.51358 | 12.0134 | 14.1009 | 9.232 |
| Total | 649 | 11.9060 | 3.23066 | 0.12681 | 11.6570 | 12.1550 | 10.437 |
The descriptive table shows the same story as the charts. Mean G3 increases from studytime 1 to studytime 3. Studytime 4 remains high, but the group contains only 35 students, so its confidence interval is wider.
For supporting concepts, review Descriptive Statistics, Mean Median and Mode, Standard Deviation, Variance, Standard Error, Confidence Interval, P Value and Null and Alternative Hypothesis.
Assumptions for Welch’s ANOVA
Welch’s ANOVA relaxes the equal-variance assumption, but it does not remove all assumptions. The dependent variable should be numeric, the groups should be independent, and the observations should be reasonably independent within groups. The method is more robust than ordinary one-way ANOVA when variances and sample sizes are unequal.
| Assumption | Meaning | How This Example Handles It |
|---|---|---|
| Continuous outcome | The dependent variable should be numeric. | G3 is a numeric final-grade variable. |
| Categorical grouping factor | The independent variable should define groups. | Studytime defines four groups. |
| Independent observations | Each case should contribute one independent score. | Each student contributes one G3 value. |
| Unequal variance robustness | Equal variances are not required in the same strict way. | Welch adjusts weights and denominator df. |
| Unequal group sizes | Groups can have different n values. | Group sizes are 212, 305, 97 and 35. |
| Normality sensitivity | Residuals should not be extremely non-normal in very small groups. | The sample is large overall, but group 4 is small and should be interpreted carefully. |
The SPSS Levene table does not reject equal variance in this dataset, with p = .400 based on the mean and p = .380 based on the median. This does not make Welch’s ANOVA wrong. It simply means Welch is being used as a robust confirmation rather than because the variance test strongly failed.
For assumption support, use ANOVA Assumptions, Levene Test, Bartlett’s Test, Brown-Forsythe Test, Hartley F Max Test, Cochran C Test, Q-Q Plot Normality Check and Outlier Detection.
SPSS Output Interpretation for Welch’s ANOVA
The SPSS output uses ONEWAY G3 BY studytime with /STATISTICS DESCRIPTIVES HOMOGENEITY WELCH. This produces the ordinary one-way ANOVA table, the test of homogeneity of variances, and the robust Welch test of equality of means.
SPSS Reading Order
| SPSS Output Area | What to Read | Why It Matters |
|---|---|---|
| Case Processing Summary | 649 included, 0 excluded | Confirms all cases were used. |
| Descriptives | N, mean, SD, SE and confidence intervals | Shows the group mean pattern before the test. |
| Test of Homogeneity | Levene based on mean p = .400 | Checks variance assumption context. |
| ANOVA table | Classic F(3, 645) = 15.876, p < .001 | Shows the ordinary one-way ANOVA result. |
| Robust Tests | Welch F(3, 139.101) = 18.183, p < .001 | Main Welch’s ANOVA decision table. |
SPSS Descriptive Statistics
| Studytime | N | Mean | Std. Deviation | Std. Error | 95% CI | Minimum | Maximum |
|---|---|---|---|---|---|---|---|
| 1 | 212 | 10.8443 | 3.21862 | .22106 | 10.4086 to 11.2801 | 0 | 18 |
| 2 | 305 | 12.0918 | 3.24313 | .18570 | 11.7264 to 12.4572 | 0 | 19 |
| 3 | 97 | 13.2268 | 2.50210 | .25405 | 12.7225 to 13.7311 | 8 | 18 |
| 4 | 35 | 13.0571 | 3.03841 | .51358 | 12.0134 to 14.1009 | 6 | 19 |
SPSS Homogeneity and ANOVA Results
| Output | Statistic | df1 | df2 | p | Interpretation |
|---|---|---|---|---|---|
| Levene based on mean | .985 | 3 | 645 | .400 | Variance equality is not rejected. |
| Levene based on median | 1.026 | 3 | 645 | .380 | Median-based variance test is also not significant. |
| Classic ANOVA | 15.876 | 3 | 645 | < .001 | Ordinary one-way ANOVA rejects equal means. |
| Welch robust test | 18.183 | 3 | 139.101 | < .001 | Welch’s ANOVA rejects equal means. |
SPSS interpretation summary: The robust Welch test is statistically significant, F(3, 139.101) = 18.183, p < .001. Therefore, mean G3 differs across studytime groups. The result agrees with the ordinary one-way ANOVA, but Welch’s ANOVA gives a robust confirmation with adjusted degrees of freedom.
Python Chart-by-Chart Interpretation
The Python chart sequence explains Welch’s ANOVA through group means, distribution shape, the observed Welch F statistic, p-value decision, variance context, group weights, group size with standard deviation, and the final summary table.
Python Chart 1: Welch’s Group Means with 95% Confidence Intervals
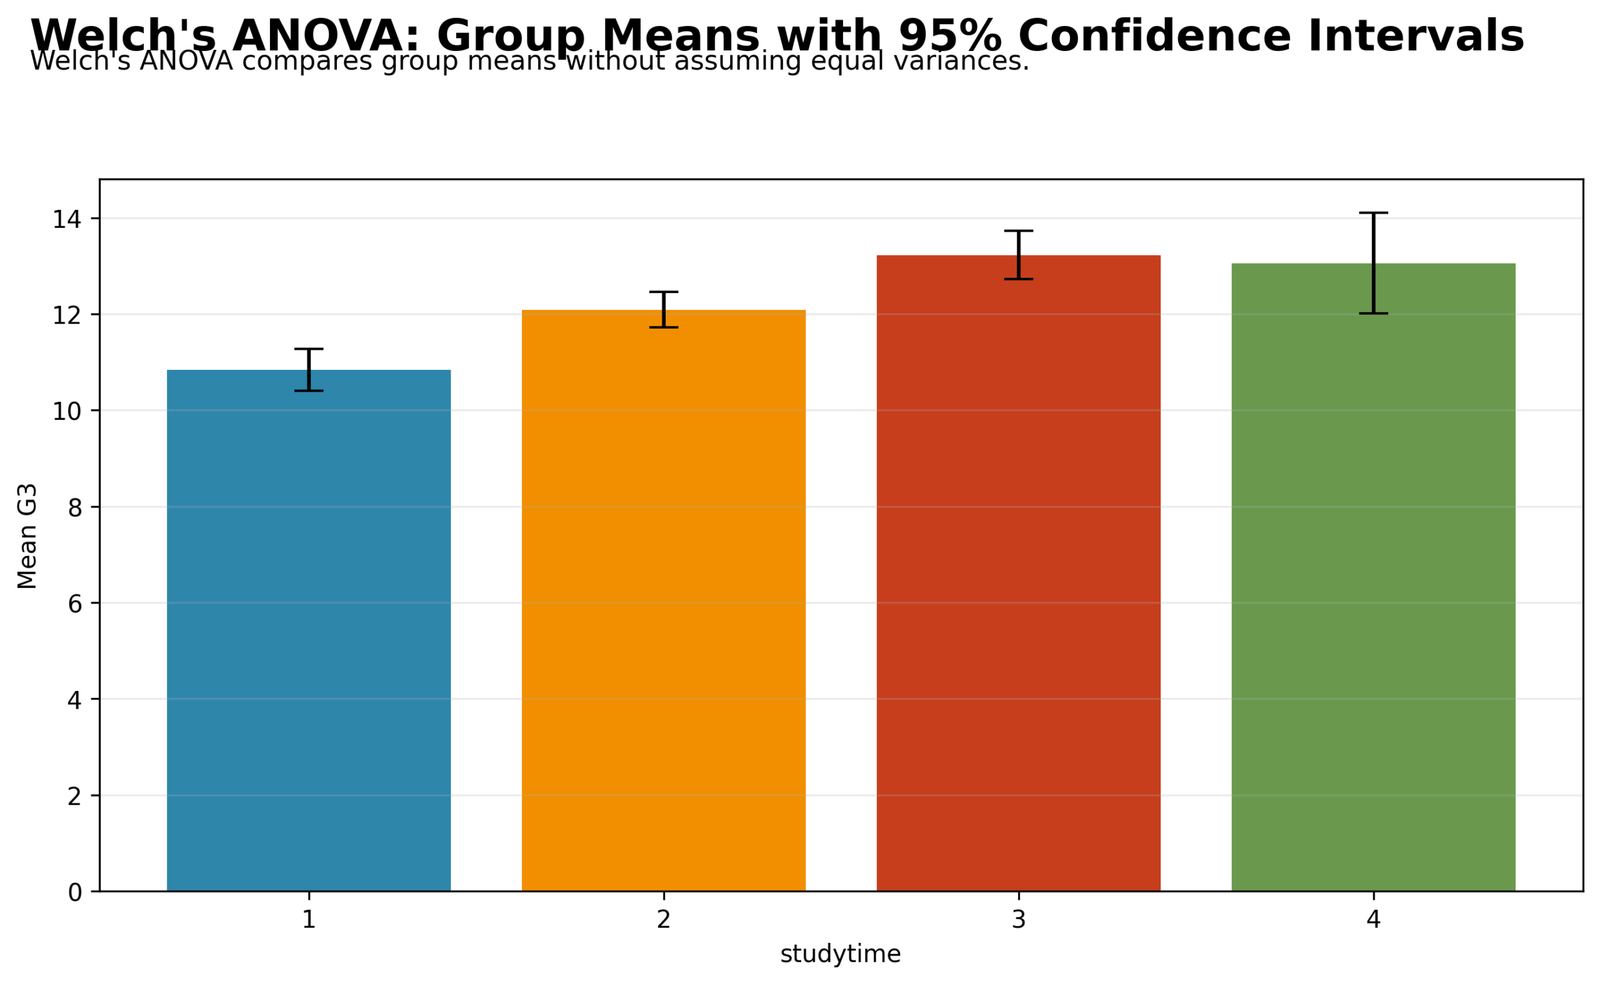
The first chart shows that mean G3 rises from studytime group 1 to studytime group 3. Studytime group 1 has the lowest average final grade, while studytime group 3 has the highest average final grade. Studytime group 4 remains high but has a wider interval because its sample size is much smaller.
This chart explains why Welch’s ANOVA rejects equal means. The group means are not flat across studytime levels. The visible pattern supports a practical conclusion: students in higher studytime groups tend to have higher G3 final grades.
Python Chart 2: Distribution by Studytime Group
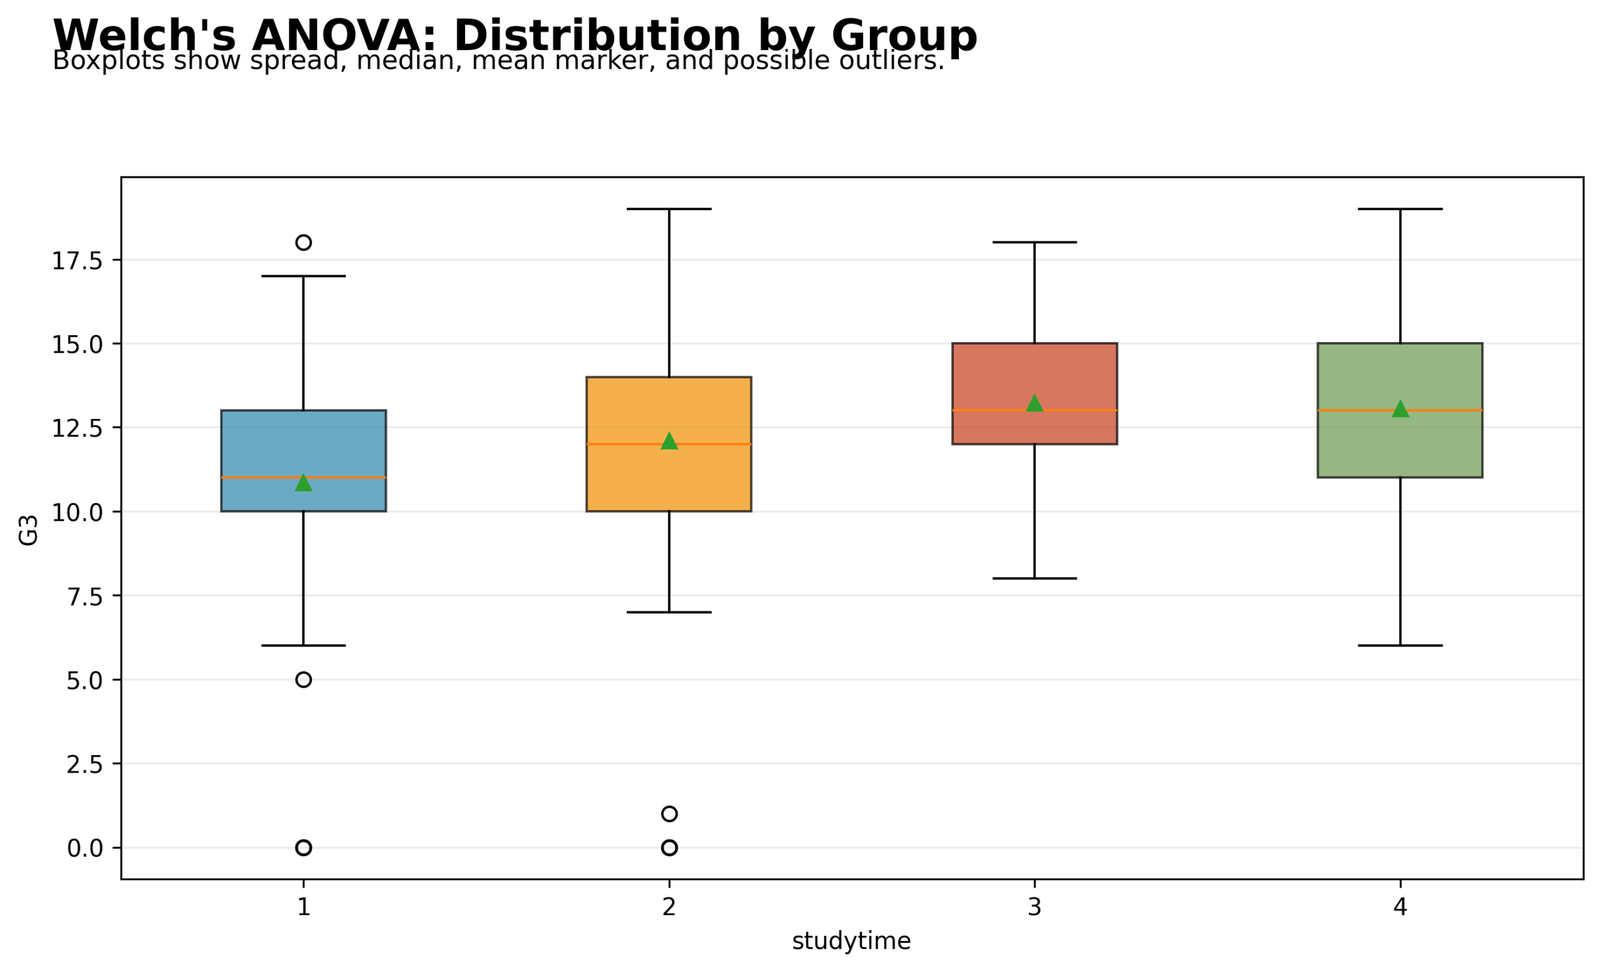
The distribution chart shows central tendency, spread and possible outliers within each studytime group. Studytime group 1 has a lower distribution, while studytime groups 3 and 4 show higher central values.
The chart is important because Welch’s ANOVA is often used when group spreads may differ. Here, group 3 has a smaller standard deviation than groups 1 and 2, while group 4 is small and has a wider confidence interval.
Python Chart 3: Observed Welch F on F Distribution
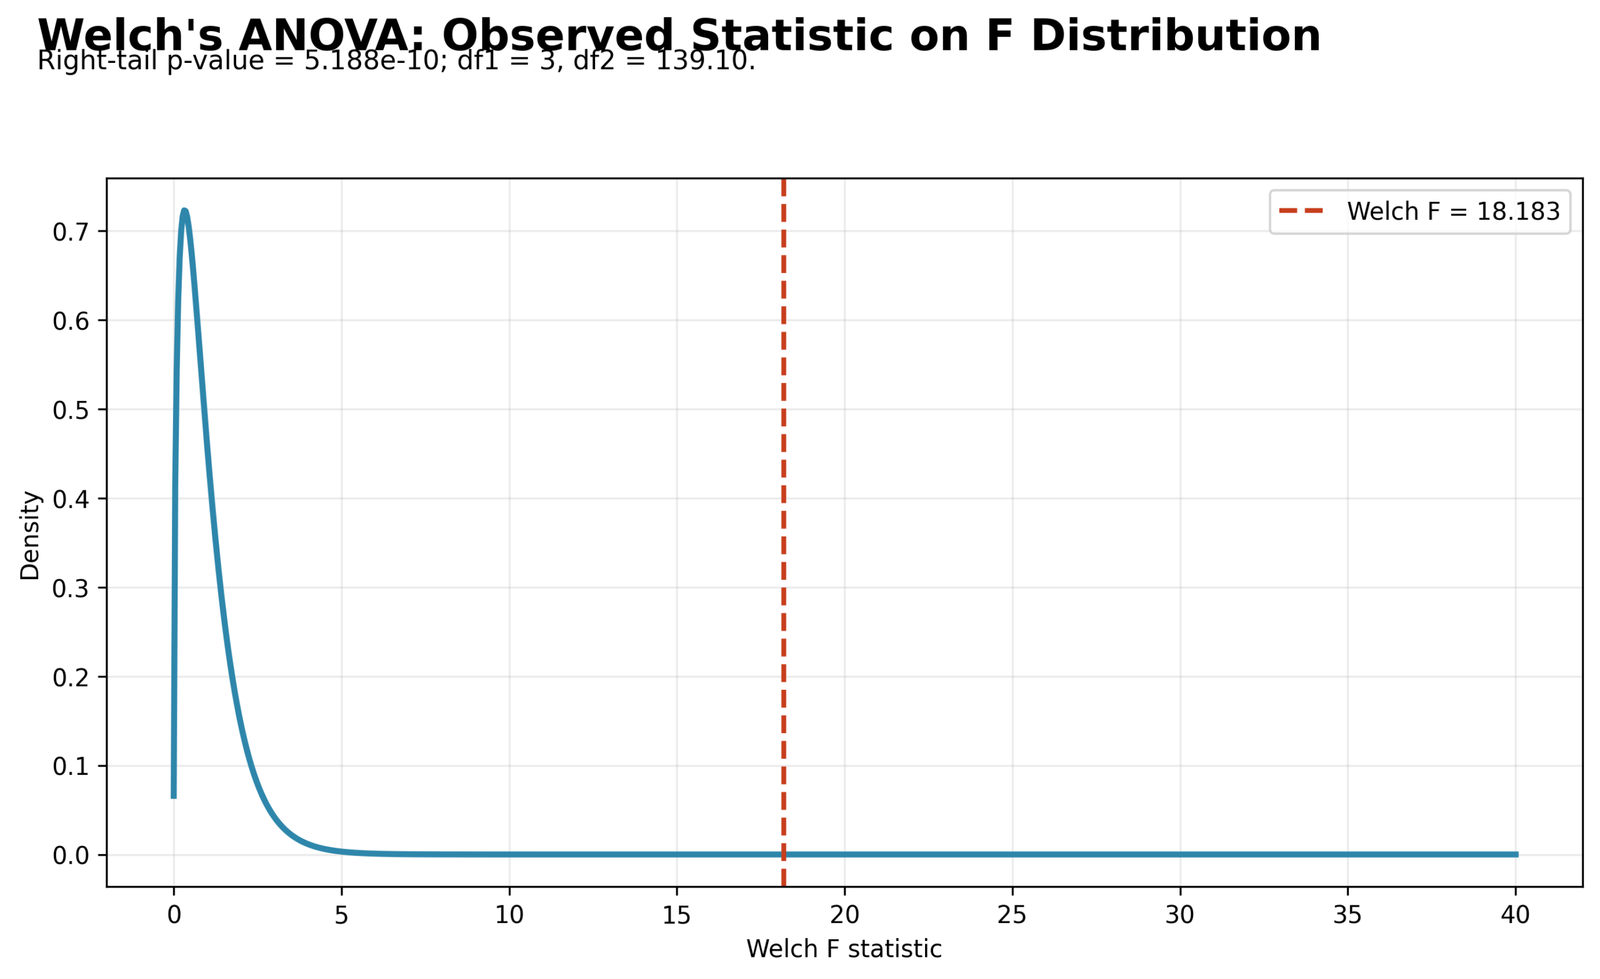
The observed Welch F statistic is 18.183, plotted far into the right tail of the F distribution. The chart subtitle reports df1 = 3, df2 = 139.10, and p = 5.188e-10.
This visual makes the hypothesis decision clear. The observed F statistic is much larger than what would be expected if all four group means were equal, so the null hypothesis is rejected.
Python Chart 4: Welch’s ANOVA p-value Decision
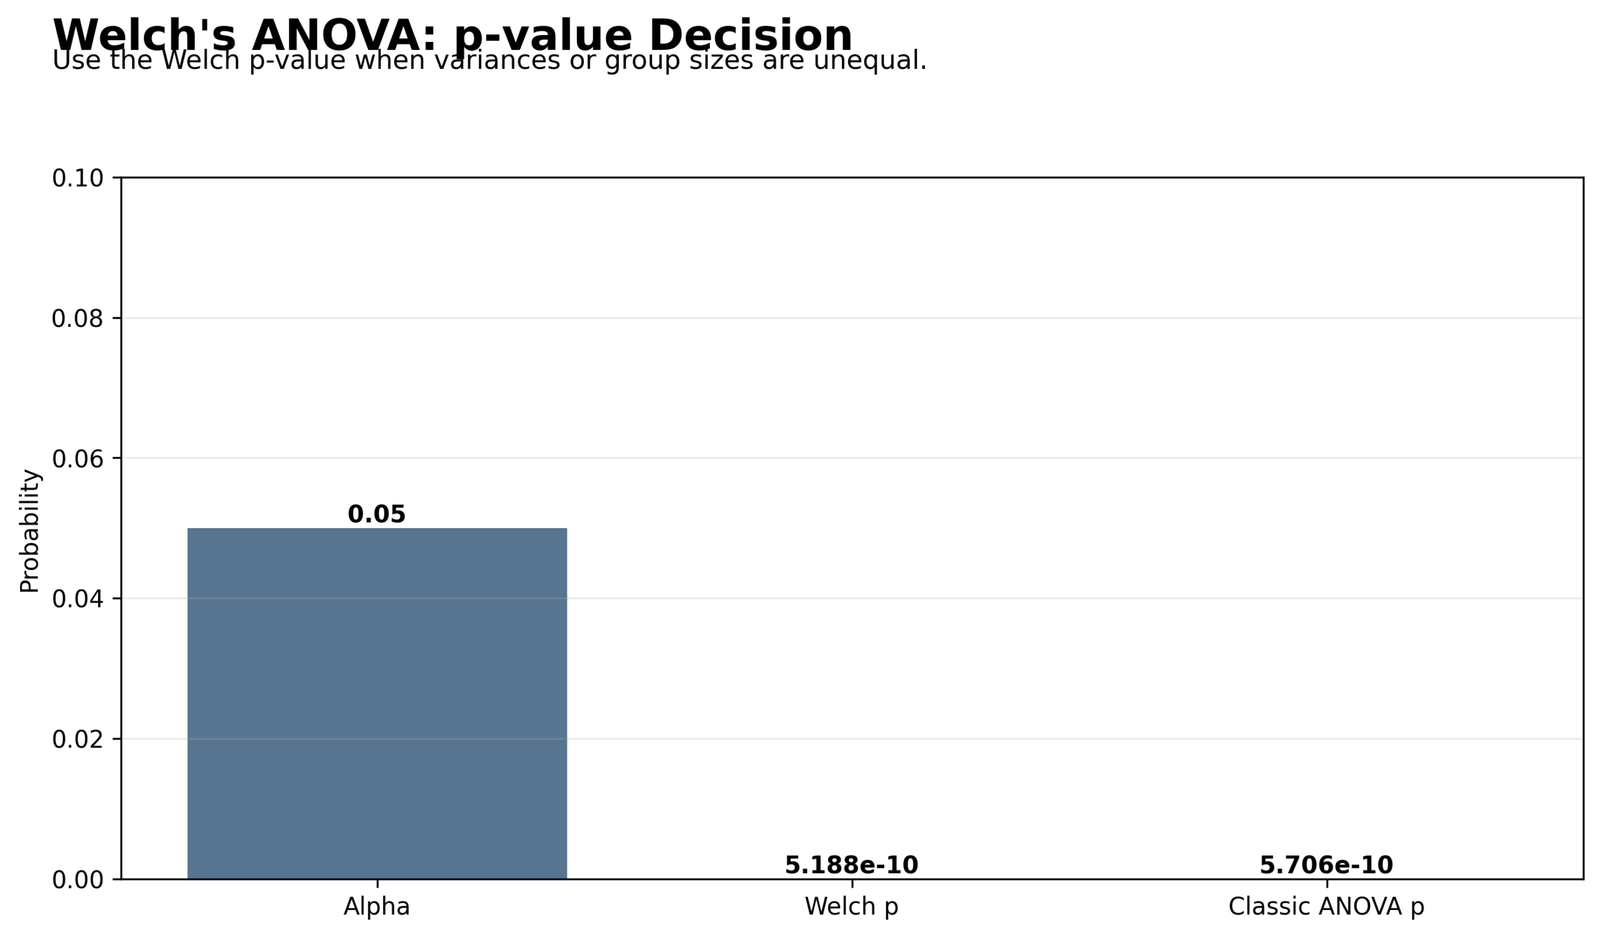
The p-value chart compares α = .05, Welch p = 5.188e-10, and classic ANOVA p = 5.706e-10. Both p-values are far below .05.
This means the conclusion is stable in this dataset. Whether the analyst reads the ordinary one-way ANOVA table or the Welch robust table, the decision is the same: reject equal studytime group means.
Python Chart 5: Variance Context by Group
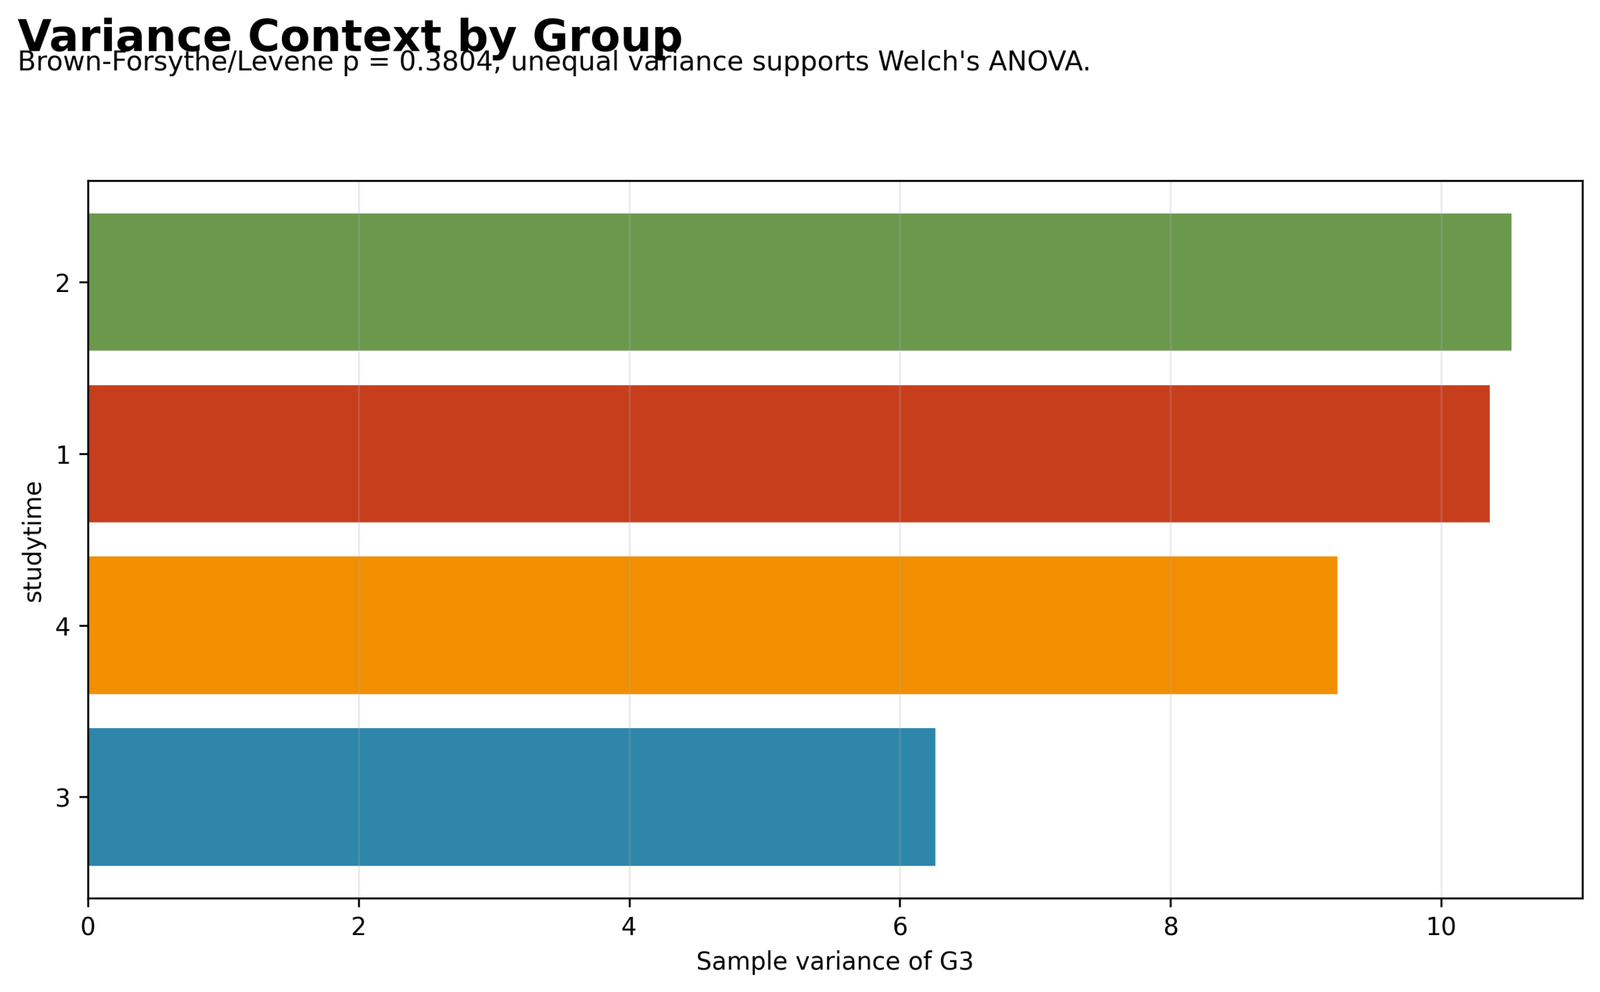
The variance chart shows that groups 1 and 2 have the largest sample variances, group 4 has a moderate variance, and group 3 has the smallest variance. This variance context helps explain why Welch weights are useful.
In this dataset, the formal Levene test does not reject equal variances, but the variance chart still explains the logic of Welch’s ANOVA. Welch gives different groups different weights based on sample size and variance rather than treating all group variances as one common pooled value.
Python Chart 6: Welch’s Group Weights
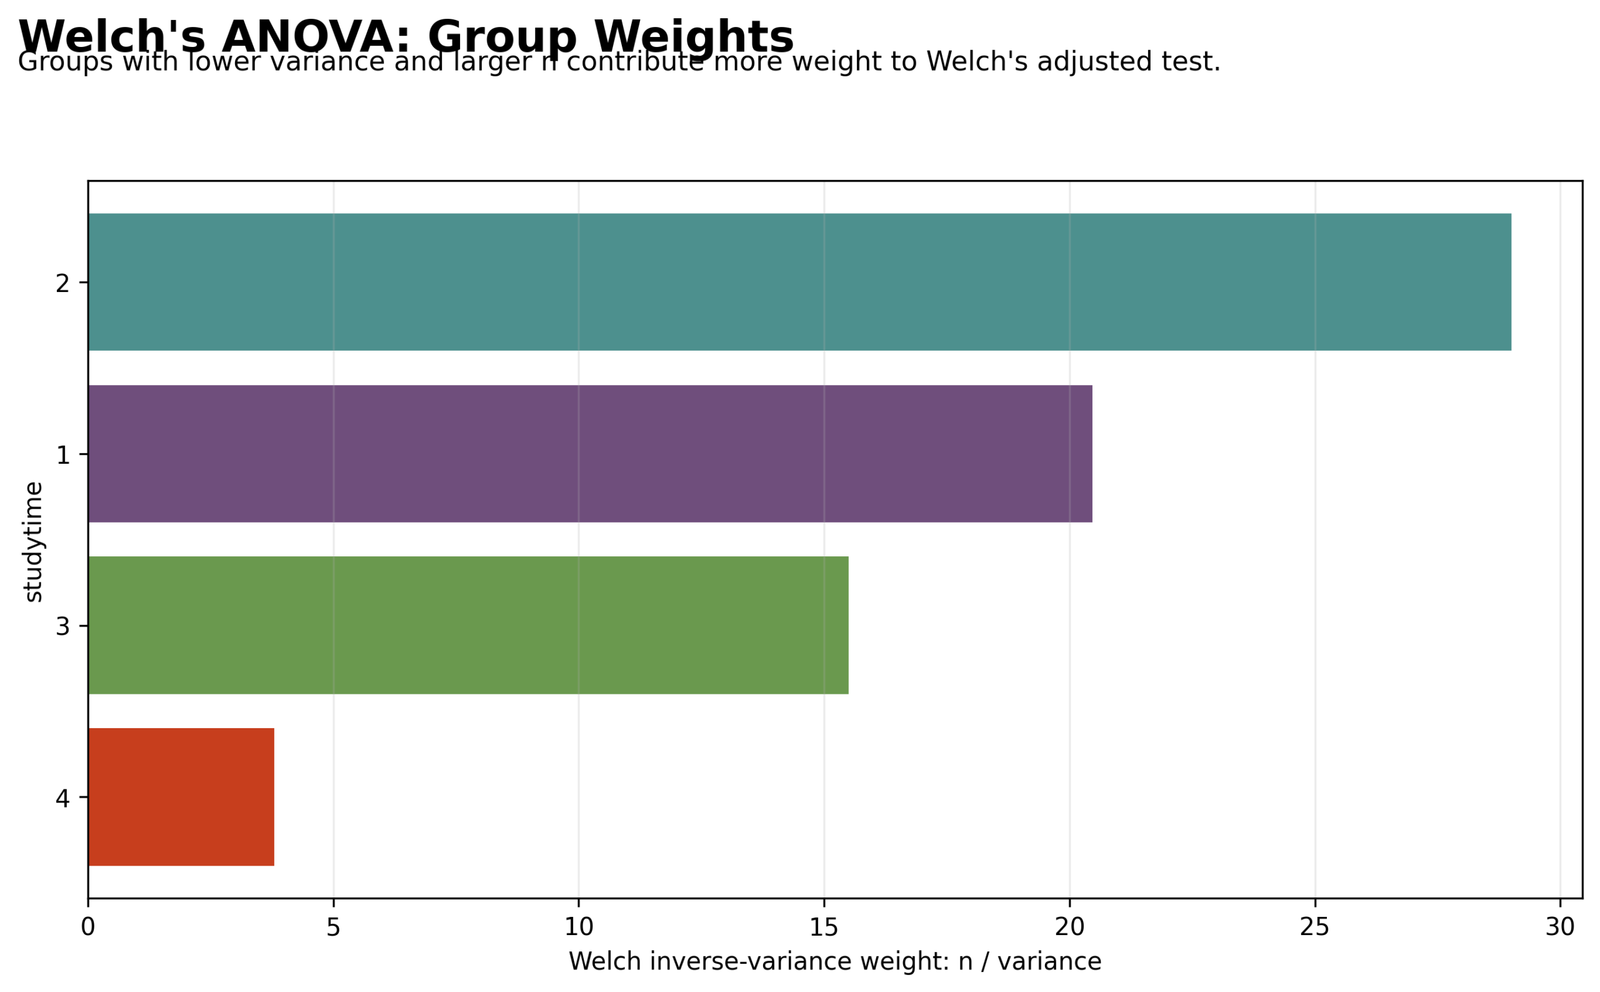
The group weight chart shows that studytime group 2 receives the largest Welch weight because it has the largest sample size. Group 1 receives the second-largest weight. Group 3 receives a moderate weight because its variance is smaller, even though its sample size is lower than groups 1 and 2.
Studytime group 4 receives the smallest weight because it has only 35 cases. This is a central feature of Welch’s ANOVA: smaller and more variable groups contribute less weight to the adjusted test.
Python Chart 7: Group Size and Standard Deviation
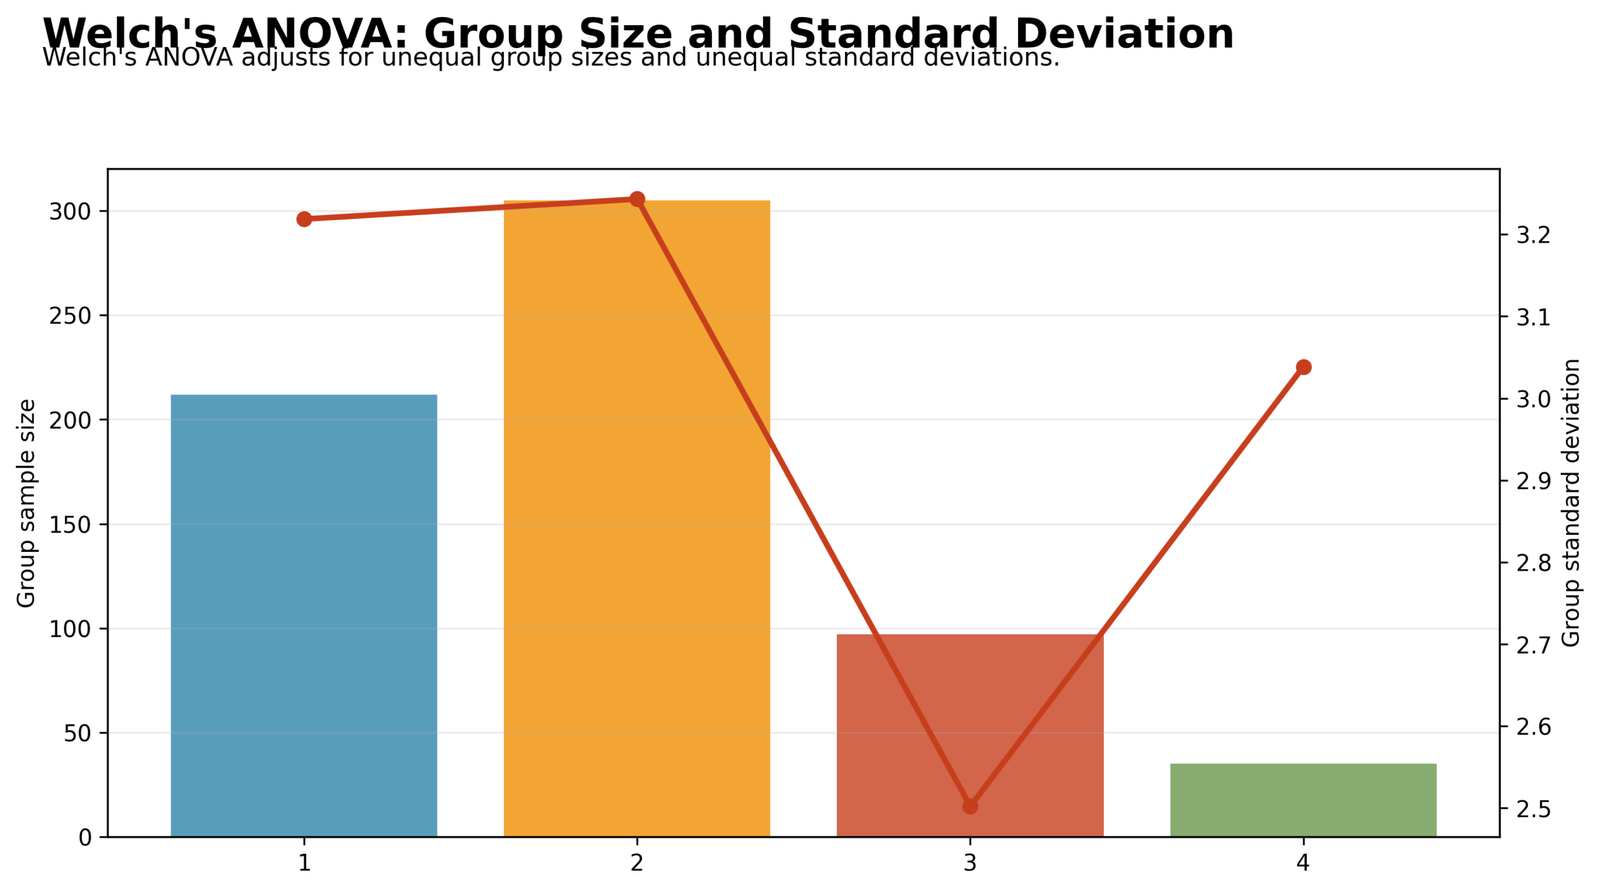
The group size and standard deviation chart shows why Welch’s ANOVA is useful for real datasets. Group sizes are not equal: group 2 is the largest, group 1 is also large, group 3 is smaller, and group 4 is much smaller.
The standard deviation line shows that group spread is not identical across groups. Welch’s ANOVA adjusts the test to account for this combination of unequal group size and group variability.
Python Chart 8: Welch’s ANOVA Summary Table
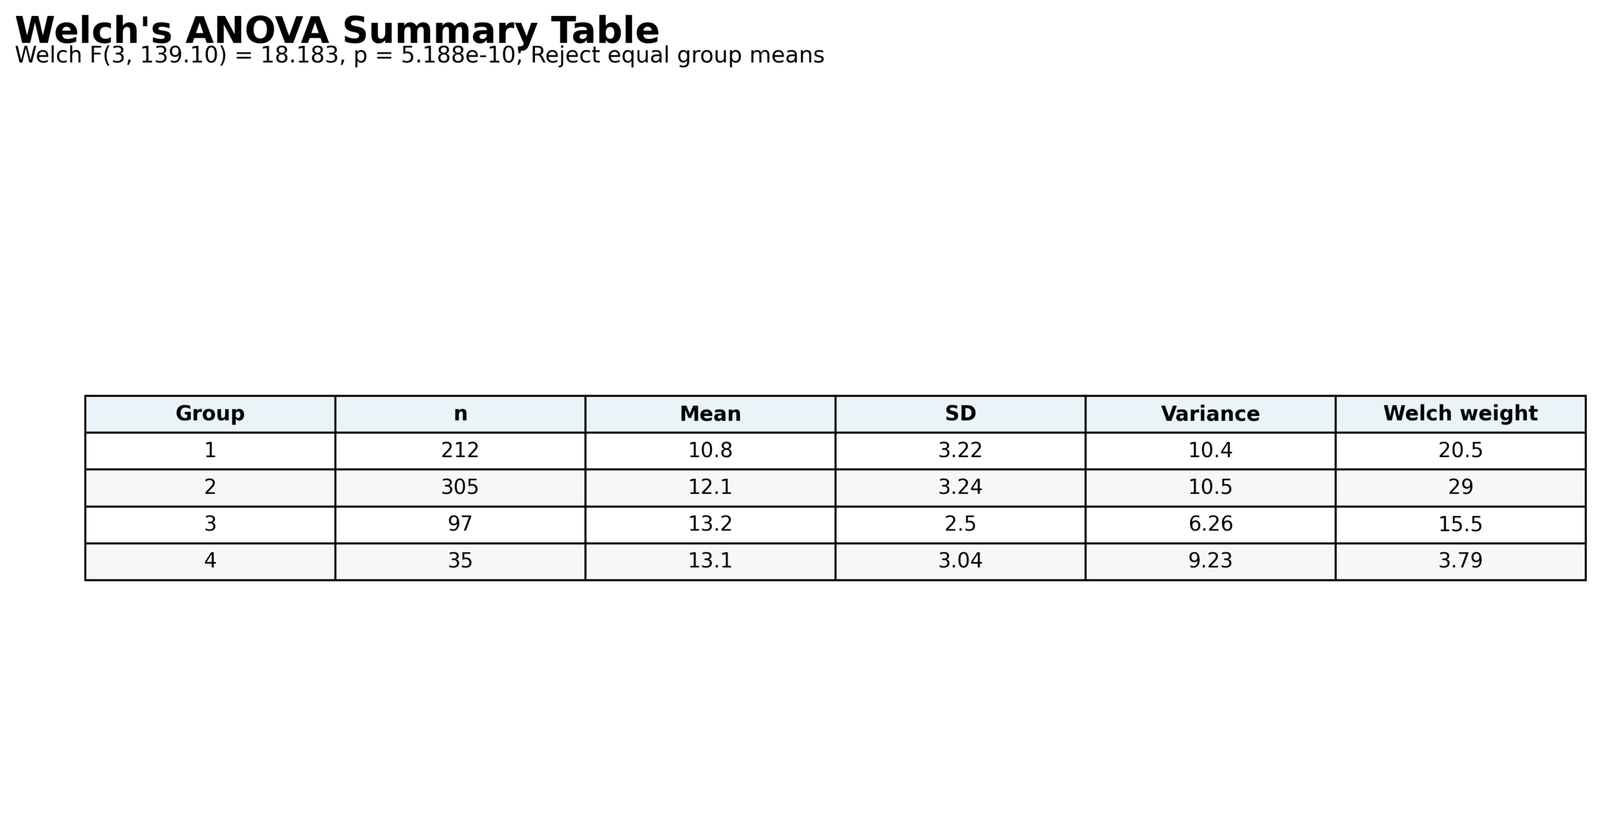
The summary table gives the final Python result: Welch F(3, 139.10) = 18.183, p = 5.188e-10. The decision is to reject equal group means.
The same table also shows the group means, standard deviations, variances and weights. This is the best single figure for reporting because it connects the inferential decision with the group-level descriptive statistics.
R Chart-by-Chart Validation
The R charts validate the Python and SPSS results using a second workflow. The R sequence confirms the same mean pattern, distribution pattern, Welch F decision, p-value decision, variance context, group weights, and final summary interpretation.
R Chart 1: Welch’s Group Means with Confidence Intervals
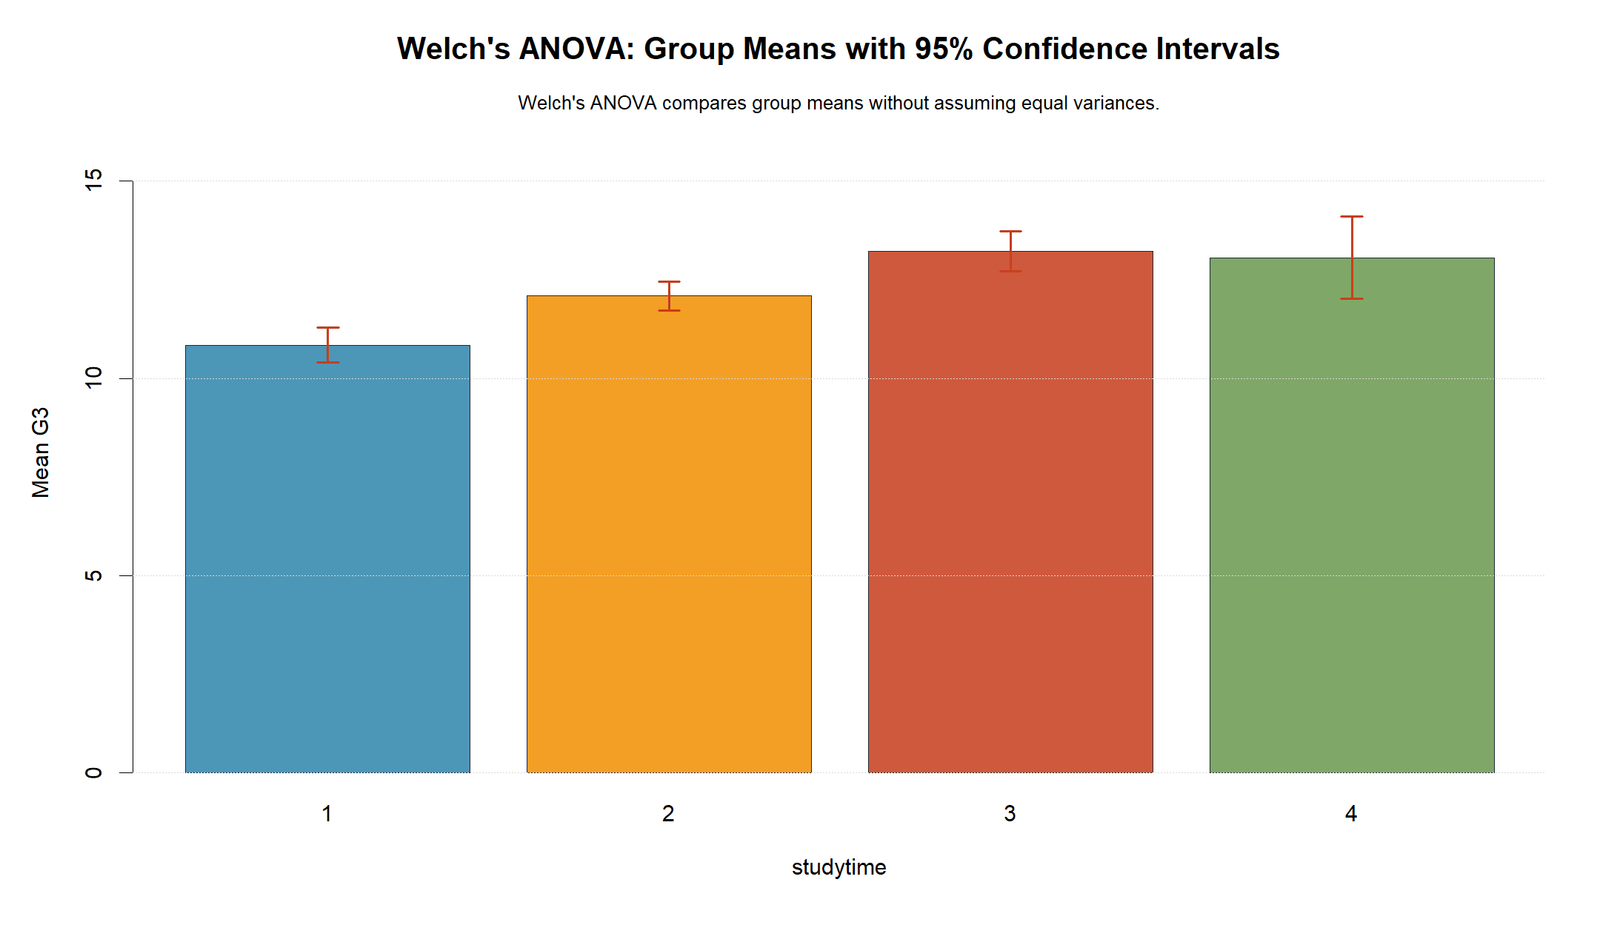
The R group mean chart confirms the same upward pattern across studytime groups. The lowest mean appears in studytime group 1, while the highest mean appears around studytime group 3.
This validates the Python chart and supports the conclusion that the significant Welch result reflects real differences in group means.
R Chart 2: Distribution by Group
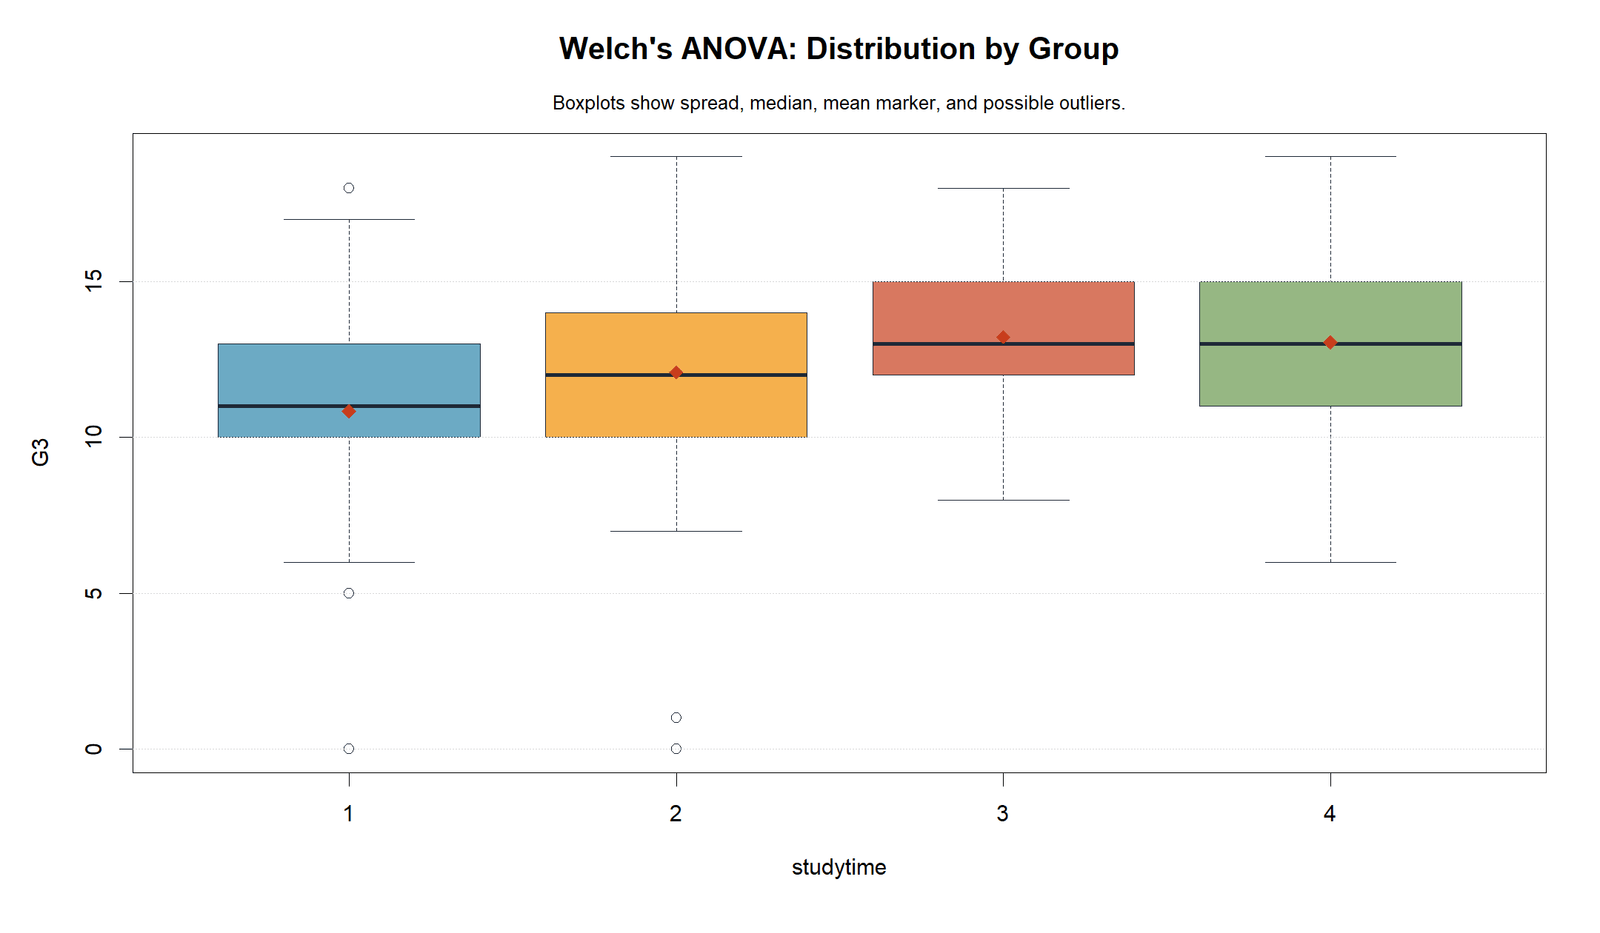
The R boxplots confirm the same distribution story. Higher studytime groups show higher central G3 values, while lower studytime groups include lower scores.
This chart supports using Welch’s ANOVA as part of an assumption-aware workflow rather than relying only on a single p-value.
R Chart 3: Observed Welch F Distribution
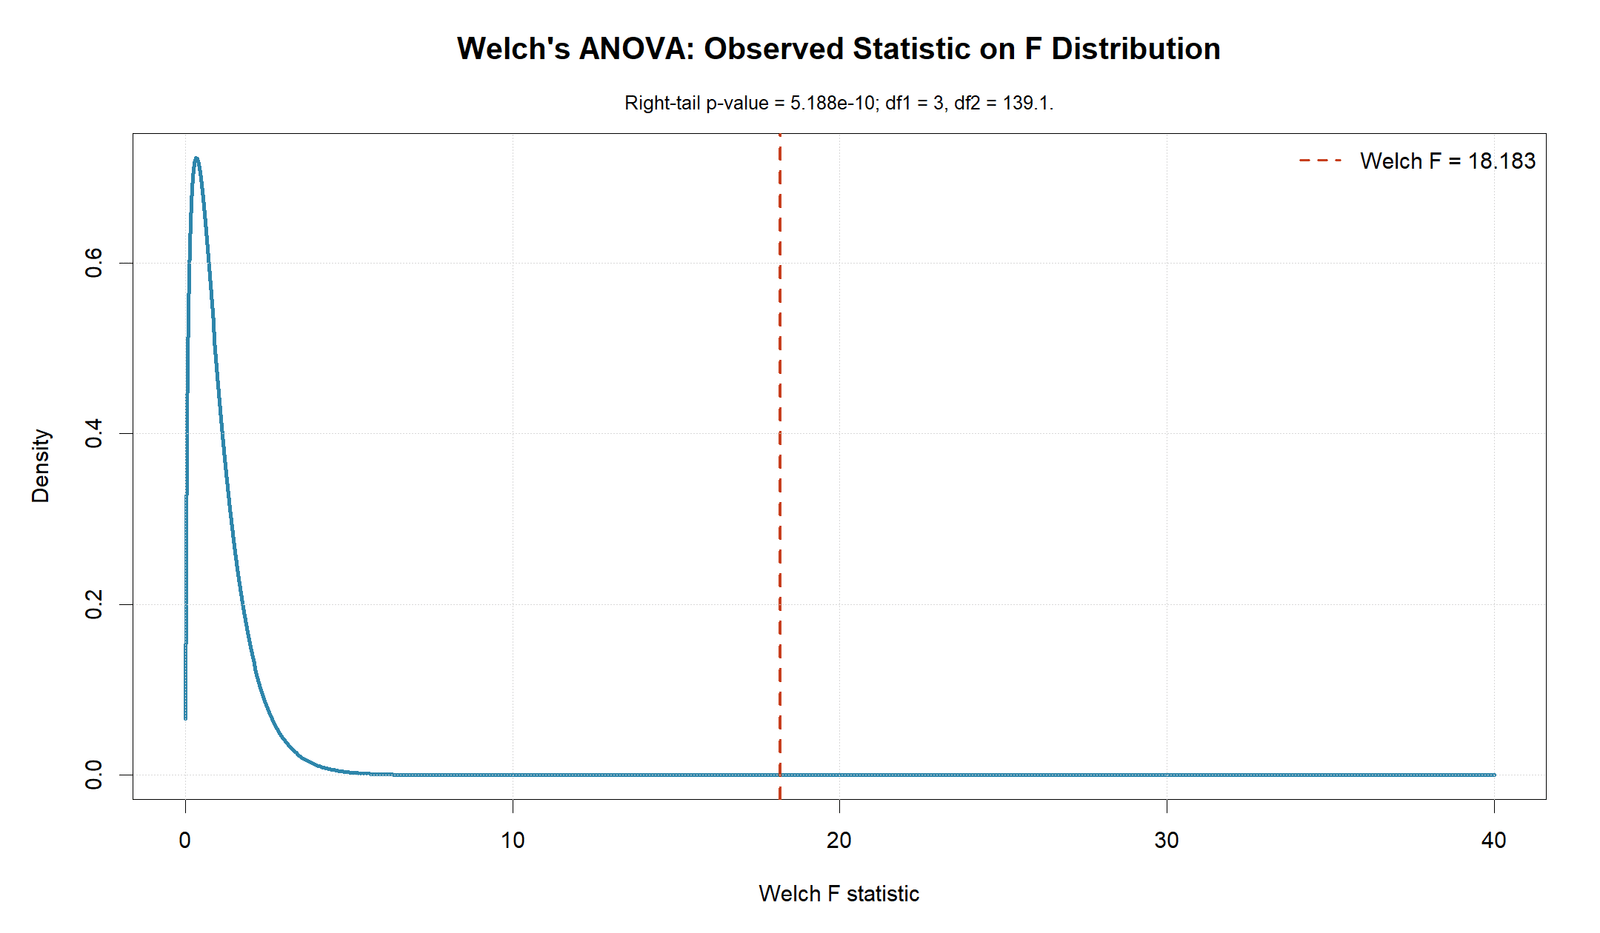
The R F distribution chart confirms that the observed Welch statistic is far into the right tail. The visual decision is the same as in Python: the statistic is too large to support equal group means.
This software-to-software agreement strengthens confidence in the statistical conclusion.
R Chart 4: p-value Decision
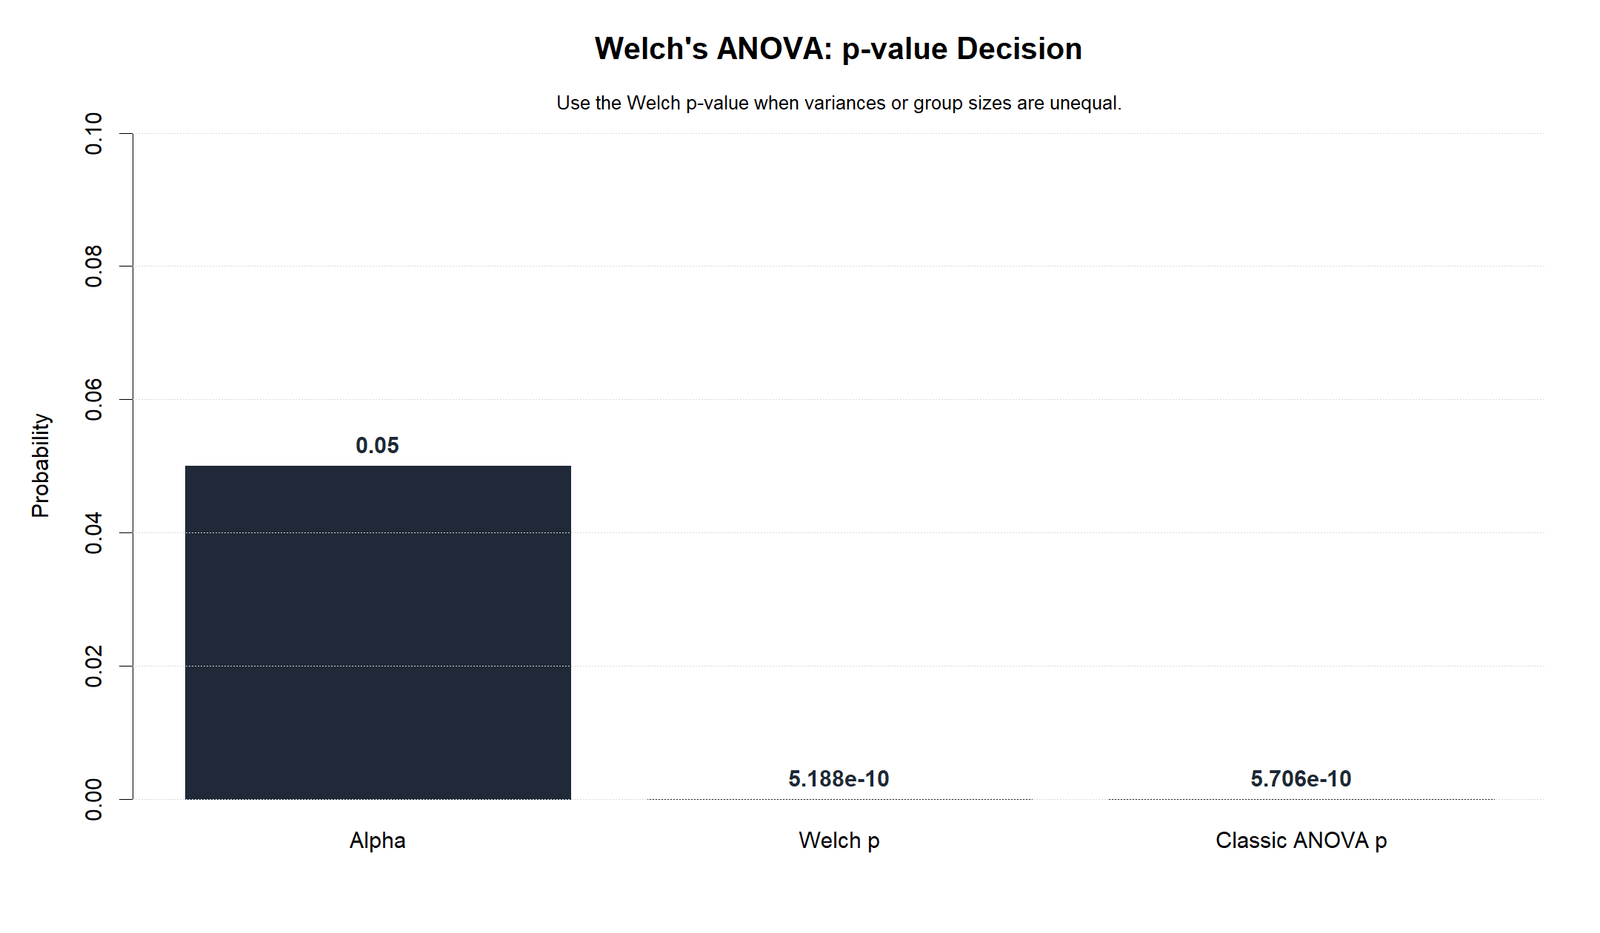
The R p-value chart confirms that the Welch p-value is far below .05. The null hypothesis of equal studytime group means is rejected.
This chart is useful for readers because it shows the decision visually without requiring them to read a dense ANOVA table first.
R Chart 5: Variance Context by Group
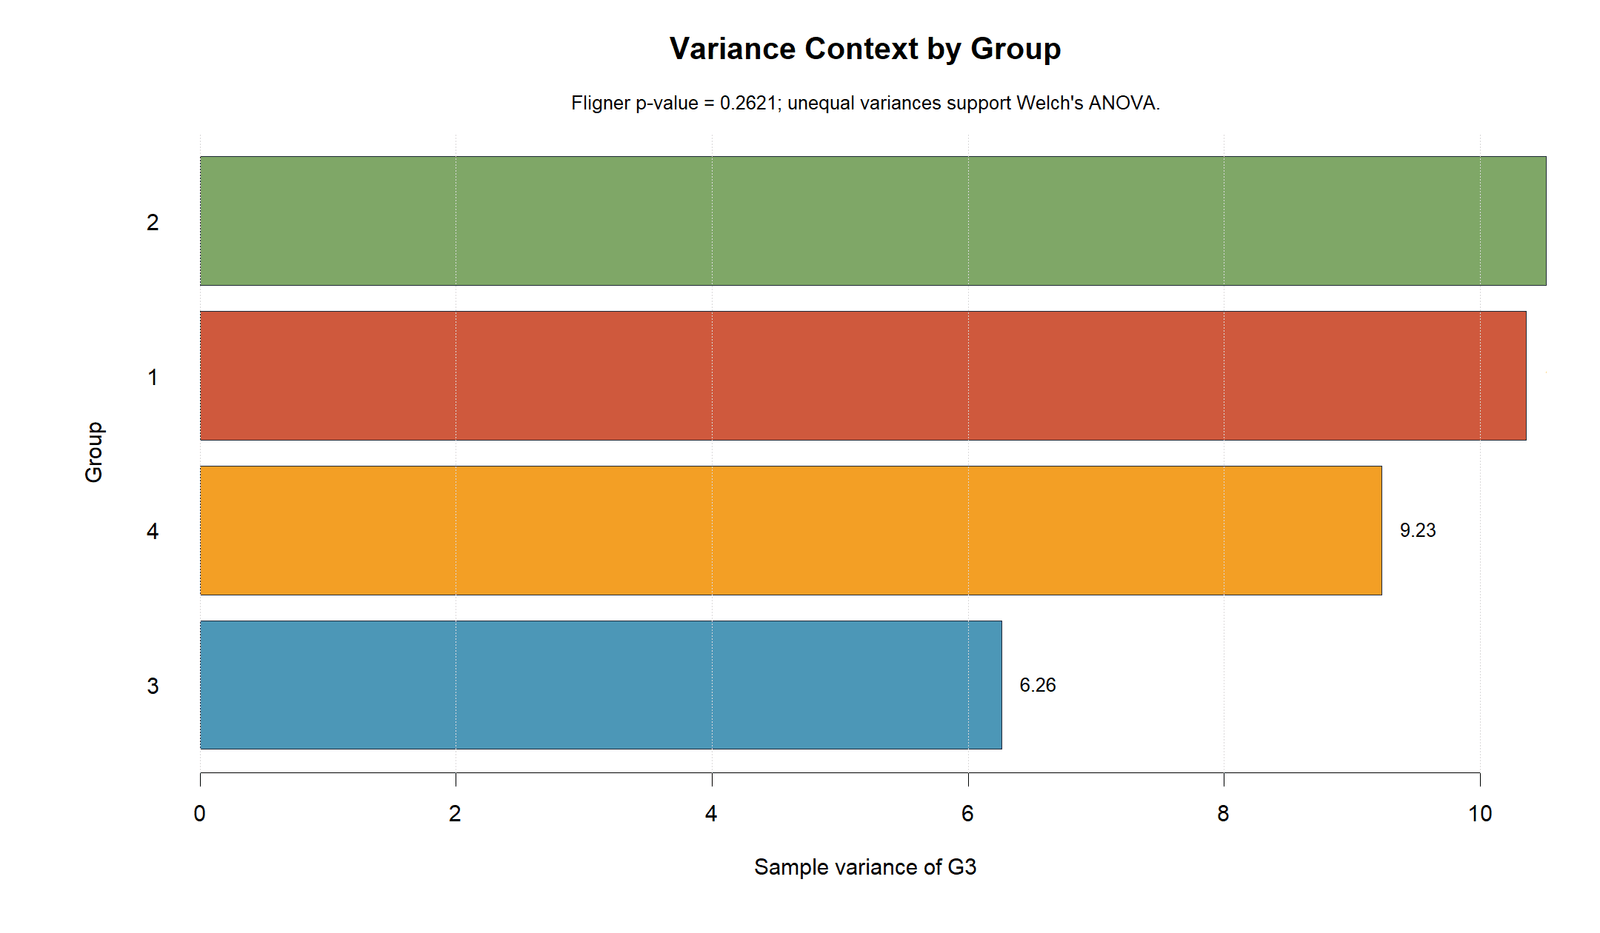
The R variance chart confirms that variance is not identical across groups. Group 3 has the smallest variance, while groups 1 and 2 have larger variances.
This validates the Welch weighting explanation and helps readers understand why Welch’s ANOVA is a robust alternative to ordinary one-way ANOVA.
R Chart 6: Welch’s Group Weights
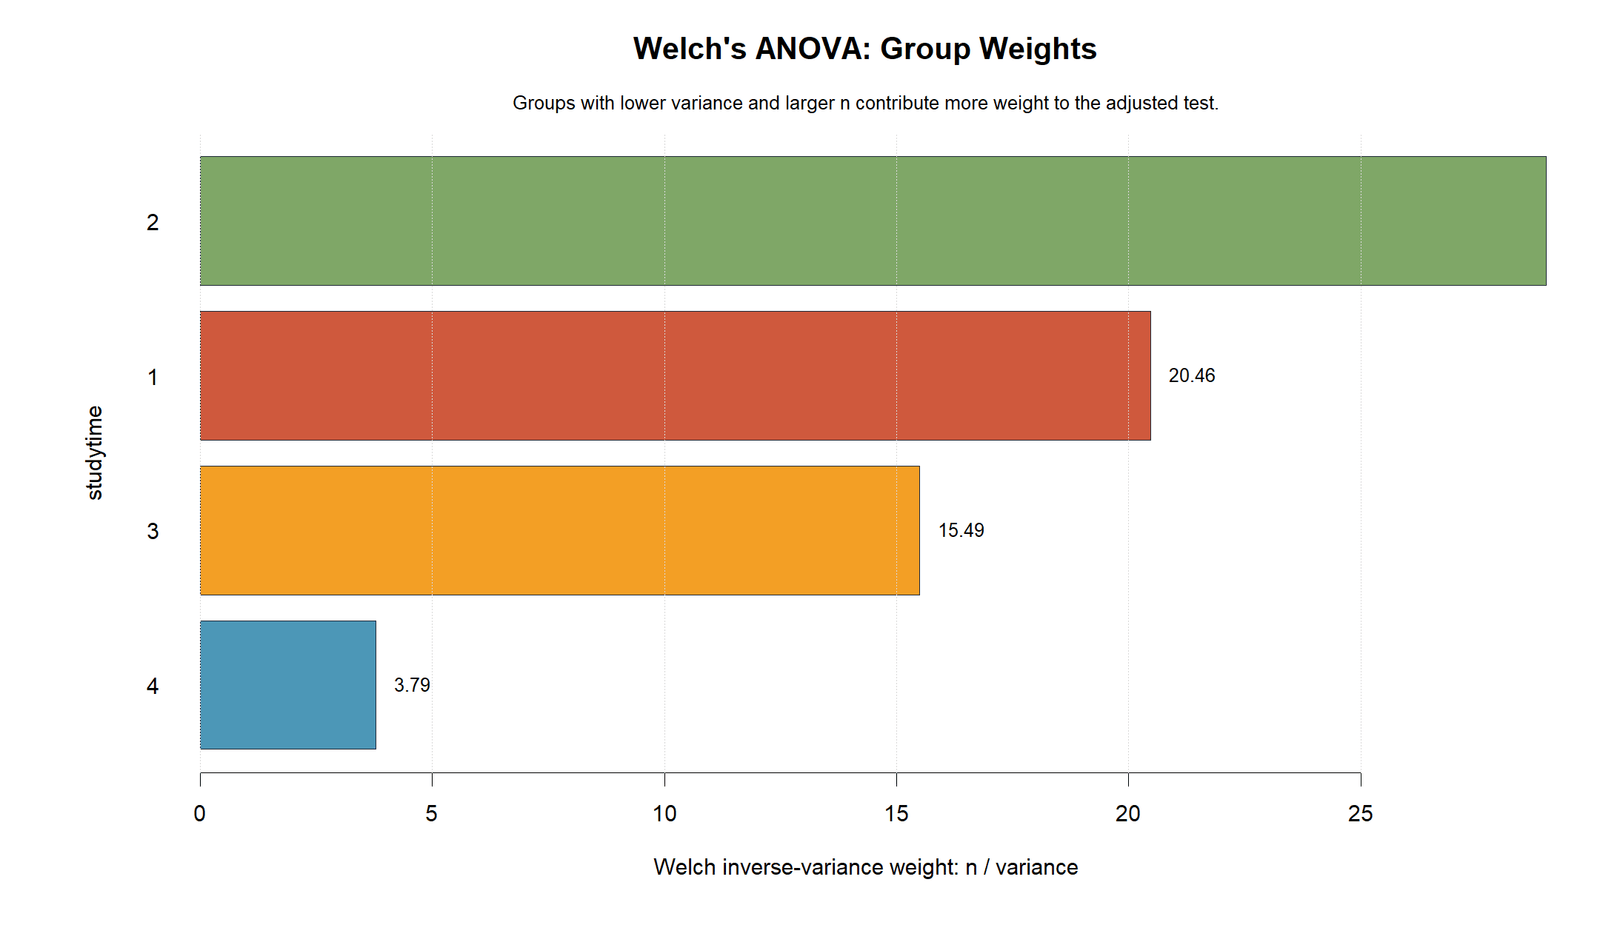
The R group weight chart confirms that studytime group 2 receives the largest weight, while studytime group 4 receives the smallest weight.
This reinforces the main technical point of Welch’s ANOVA: the test accounts for sample size and variance instead of using a single pooled error term in the same way as classic ANOVA.
R Chart 7: Group Size and Standard Deviation
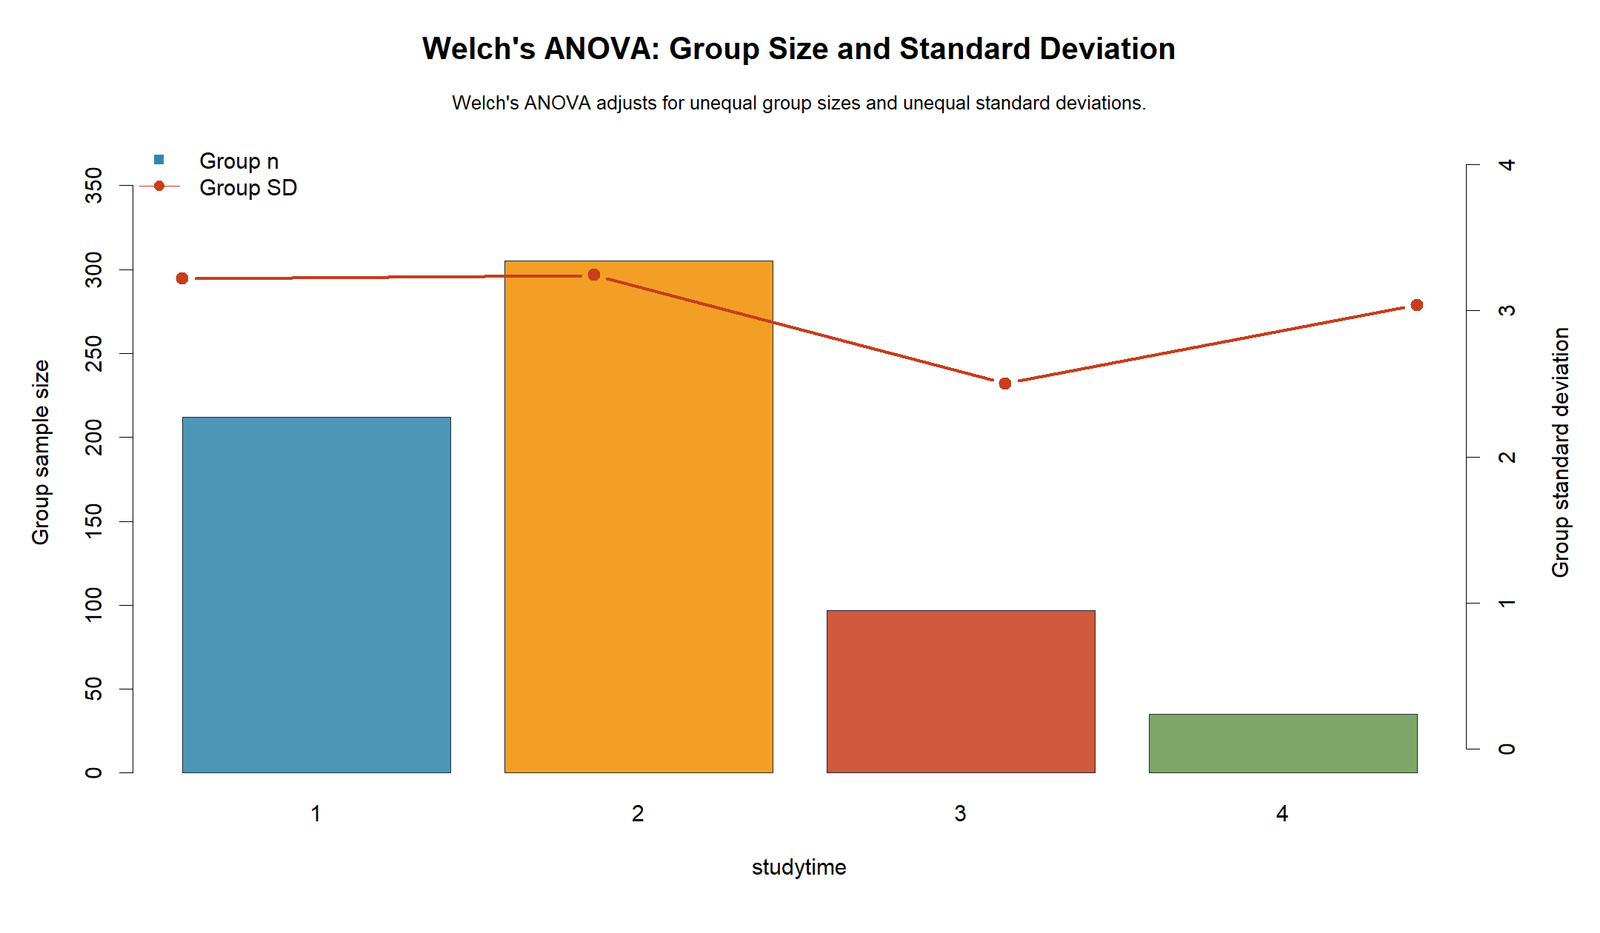
The R group-size chart confirms the unequal sample sizes across studytime levels. It also shows that the group standard deviations are not identical.
This chart supports the recommendation to use Welch’s ANOVA when group sizes and variances deserve careful treatment.
R Chart 8: Welch’s ANOVA Summary Table
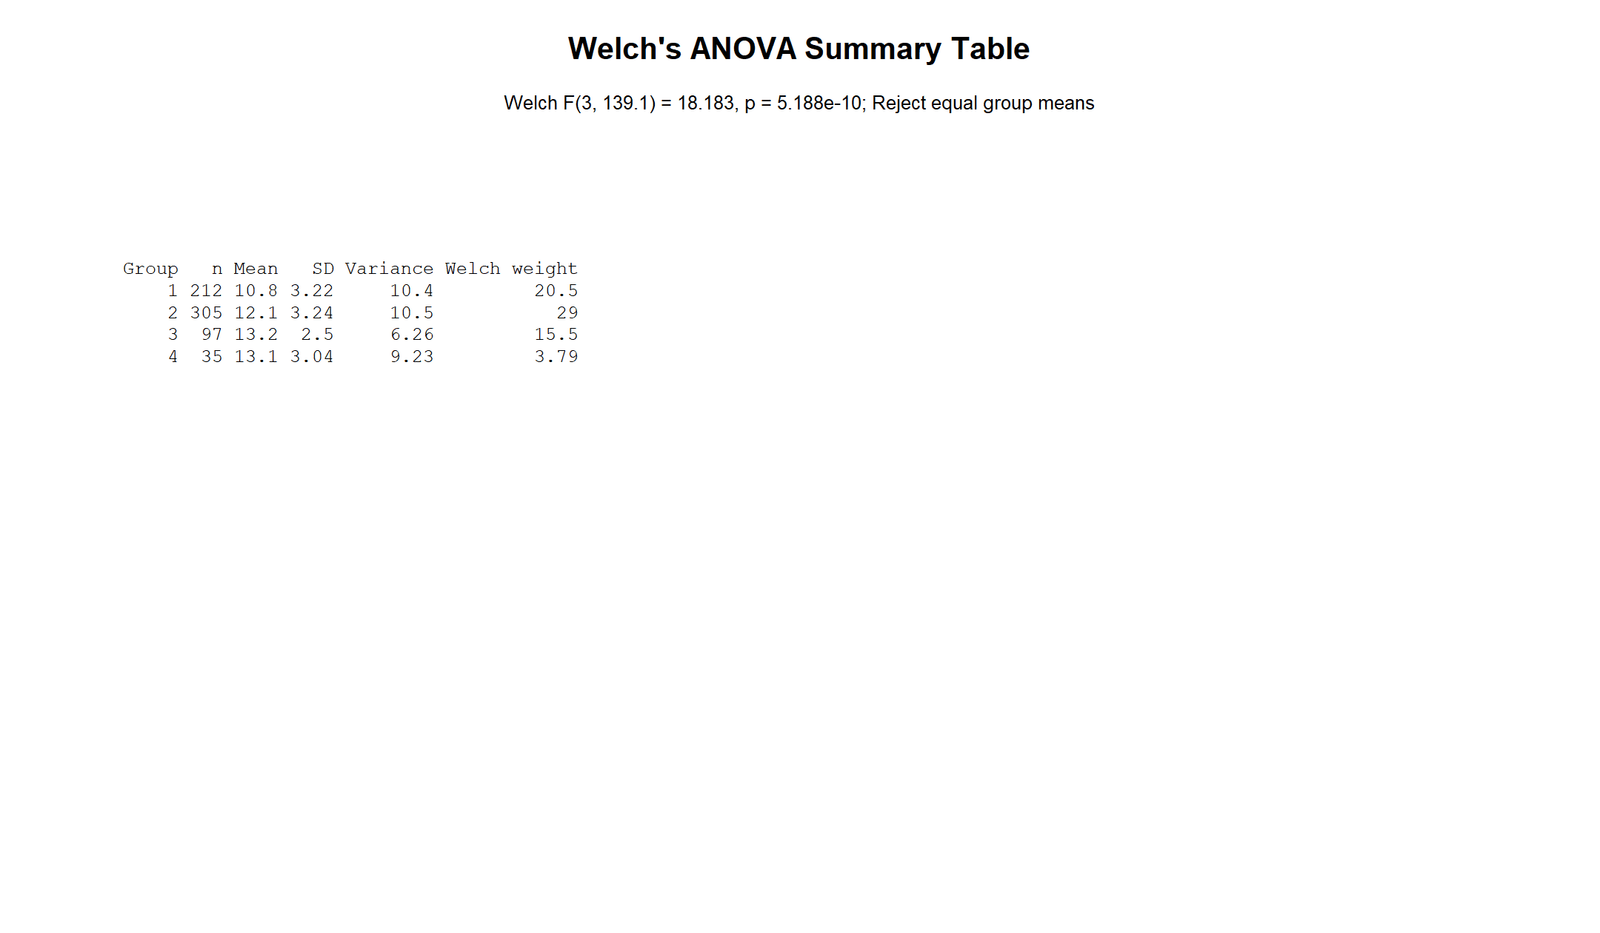
The R summary table confirms the final decision: Welch’s ANOVA rejects equal studytime group means.
The agreement across Python, R and SPSS makes the result strong for publication. The final report can state that the robust Welch test found significant mean differences across studytime groups.
SPSS, R, Python and Excel Workflows for Welch’s ANOVA
The same Welch’s ANOVA workflow can be reproduced in SPSS, R, Python and Excel. SPSS has a built-in Welch option under one-way ANOVA. R can run Welch’s one-way test with oneway.test(). Python can run Welch ANOVA using packages such as statsmodels or pingouin. Excel can support the descriptive and weighting steps, but SPSS, R or Python is better for final p-value reporting.
SPSS Workflow
| Step | SPSS Menu or Syntax | Purpose |
|---|---|---|
| Open dataset | File > Open > Data | Load G3 and studytime. |
| Run one-way ANOVA | Analyze > Compare Means > One-Way ANOVA | Set up group mean comparison. |
| Dependent variable | G3 | Outcome variable. |
| Factor | studytime | Grouping variable. |
| Options | Descriptive, Homogeneity, Welch | Request means, Levene and Welch test. |
| Read robust table | Robust Tests of Equality of Means | Use Welch F, df1, df2 and p. |
R Workflow
| Step | R Action | Purpose |
|---|---|---|
| Read data | read.csv("dataset.csv") | Load the dataset. |
| Convert group | factor(studytime) | Define studytime as categorical. |
| Descriptives | group_by(studytime) | Calculate n, mean, SD and variance. |
| Variance check | leveneTest(G3 ~ studytime) | Check variance context. |
| Welch test | oneway.test(G3 ~ studytime, var.equal = FALSE) | Run Welch’s ANOVA. |
| Post hoc | Games-Howell or pairwise Welch tests | Compare specific groups if needed. |
Python Workflow
| Step | Python Action | Purpose |
|---|---|---|
| Read data | pandas.read_csv() | Load G3 and studytime. |
| Clean variables | Convert G3 numeric and studytime category | Prepare analysis-ready data. |
| Group statistics | groupby() | Calculate n, mean, SD and variance. |
| Welch ANOVA | pingouin.welch_anova() or custom formula | Get Welch F, df and p. |
| Visualization | Mean chart, boxplot, p-value chart and weights | Explain results visually. |
| Report | Save PDF and summary table | Create reproducible output. |
Excel Workflow
| Excel Task | Formula or Tool | Purpose |
|---|---|---|
| Prepare data | Columns for G3 and studytime | Organize the dataset. |
| Group means | PivotTable average of G3 by studytime | Show the mean pattern. |
| Group SD | =STDEV.S(range) | Calculate group spread. |
| Group variance | =VAR.S(range) | Calculate group variance. |
| Welch weight | =n/variance | Approximate the weighting logic. |
| Final Welch p-value | Use SPSS, R or Python | Excel is not ideal for final Welch df and p-value reporting. |
Code Blocks for Welch’s ANOVA
SPSS Syntax for Welch’s ANOVA
* Welch's ANOVA in SPSS.
* Dependent variable: G3.
* Grouping factor: studytime.

TITLE "Welch's ANOVA: G3 by Studytime".

ONEWAY G3 BY studytime
  /STATISTICS DESCRIPTIVES HOMOGENEITY WELCH
  /MISSING ANALYSIS.

GRAPH
  /BAR(SIMPLE)=MEAN(G3) BY studytime
  /TITLE='Welch ANOVA: Mean G3 by Studytime'.

OUTPUT EXPORT
  /CONTENTS EXPORT=VISIBLE
  /PDF DOCUMENTFILE="welchs_anova_spss_output.pdf".
Python Code for Welch’s ANOVA
import pandas as pd
import numpy as np
from scipy import stats

df = pd.read_csv("dataset.csv")

df["G3"] = pd.to_numeric(df["G3"], errors="coerce")
df["studytime"] = df["studytime"].astype("category")

data = df[["G3", "studytime"]].dropna().copy()

# Group statistics
summary = data.groupby("studytime")["G3"].agg(
    n="count",
    mean="mean",
    sd="std",
    variance="var"
).reset_index()

summary["welch_weight"] = summary["n"] / summary["variance"]
print(summary)

# Welch ANOVA using scipy's unequal-variance option if available
groups = [
    group["G3"].to_numpy()
    for _, group in data.groupby("studytime", observed=True)
]

try:
    result = stats.f_oneway(*groups, equal_var=False)
    print("Welch F:", result.statistic)
    print("Welch p:", result.pvalue)
except TypeError:
    print("Your SciPy version does not support equal_var=False in f_oneway.")
    print("Use pingouin.welch_anova(data=data, dv='G3', between='studytime') instead.")

# Optional pingouin workflow:
# import pingouin as pg
# welch_table = pg.welch_anova(data=data, dv="G3", between="studytime")
# print(welch_table)
R Code for Welch’s ANOVA
# Welch's ANOVA in R

library(tidyverse)
library(car)

df <- read.csv("dataset.csv")

df$G3 <- as.numeric(df$G3)
df$studytime <- as.factor(df$studytime)

data <- df %>%
  select(G3, studytime) %>%
  drop_na()

# Descriptive statistics
data %>%
  group_by(studytime) %>%
  summarise(
    n = n(),
    mean_G3 = mean(G3),
    sd_G3 = sd(G3),
    variance_G3 = var(G3),
    welch_weight = n / variance_G3,
    .groups = "drop"
  )

# Variance context
leveneTest(G3 ~ studytime, data = data)

# Welch's one-way ANOVA
welch_result <- oneway.test(G3 ~ studytime, data = data, var.equal = FALSE)
print(welch_result)

# Classic ANOVA for comparison
classic_model <- aov(G3 ~ studytime, data = data)
summary(classic_model)
Excel Notes for Welch’s ANOVA
Excel support workflow:

1. Arrange the data:
   G3 | studytime

2. Create groups:
   Studytime 1, Studytime 2, Studytime 3, Studytime 4

3. Calculate group statistics:
   n = COUNT(group_range)
   mean = AVERAGE(group_range)
   SD = STDEV.S(group_range)
   variance = VAR.S(group_range)

4. Calculate Welch weights:
   weight = n / variance

5. Create charts:
   - group mean chart
   - boxplot by studytime
   - variance context chart
   - group size and SD chart

6. Formal Welch F and p-value:
   Use SPSS, R or Python for the final robust test result,
   adjusted degrees of freedom and p-value.
APA Reporting Wording
When reporting Welch’s ANOVA, include the test name, numerator degrees of freedom, adjusted denominator degrees of freedom, Welch F statistic, p-value and the group means. Also explain why Welch was used, especially if group sizes or variances are unequal.
APA-style report: Welch’s ANOVA was conducted to compare G3 final grade across four studytime groups. The mean G3 scores were 10.8443 for studytime 1, 12.0918 for studytime 2, 13.2268 for studytime 3, and 13.0571 for studytime 4. Welch’s test showed a statistically significant difference among the studytime groups, F(3, 139.10) = 18.183, p < .001. Therefore, the null hypothesis of equal group means was rejected. The result indicates that mean final grade differs across studytime levels.
Short reporting version: Welch’s ANOVA showed that mean G3 differed significantly across studytime groups, F(3, 139.10) = 18.183, p < .001. The lowest mean was observed in studytime group 1, and the highest mean was observed in studytime group 3.
Post hoc note: Welch’s ANOVA only says that at least one group mean differs. It does not identify exactly which pairs differ. Use Games-Howell post hoc comparisons or pairwise Welch tests when equal variances are not assumed.
Common Mistakes
| Mistake | Why It Is Wrong | Correct Practice |
|---|---|---|
| Calling Welch’s ANOVA a post hoc test | Welch’s ANOVA is an omnibus mean-comparison test. | Use Games-Howell or pairwise tests after a significant Welch result. |
| Using ordinary ANOVA only when variances differ | Classic ANOVA is more sensitive to unequal variances and unequal sample sizes. | Use Welch’s ANOVA as the robust alternative. |
| Ignoring adjusted denominator df | Welch df2 can be decimal and differs from ordinary ANOVA df. | Report F(3, 139.10), not F(3, 645), for the Welch test. |
| Reporting only the p-value | The reader also needs the group means and test statistic. | Report means, F statistic, df and p-value. |
| Thinking Levene must be significant before Welch can be used | Welch can be used as a robust default or confirmation. | Explain the variance and group-size context transparently. |
| Using Tukey automatically after Welch | Tukey assumes equal variances in the standard setup. | Use Games-Howell when equal variances are not assumed. |
When to Use Welch’s ANOVA
Use Welch’s ANOVA when you need to compare three or more independent group means and you are not comfortable assuming equal variances. It is also useful when the group sizes are unequal, especially when smaller groups have different variance patterns.
| Situation | Use Welch’s ANOVA? | Reporting Note |
|---|---|---|
| Three or more independent groups | Yes | Welch compares all group means in one robust test. |
| Unequal variances | Yes | This is the main reason to prefer Welch over classic ANOVA. |
| Unequal group sizes | Often yes | Welch adjusts the test using weights and adjusted df. |
| Only two groups | Use Welch’s t-test | Welch’s t-test is the two-group version. |
| Dependent or repeated measures | No | Use repeated measures ANOVA or a mixed model. |
| Severe non-normality with small groups | Use caution | Consider robust or nonparametric alternatives. |
Compare this guide with Welch’s T Test, One Way ANOVA, Brown Forsythe ANOVA, ANOVA Assumptions, T Test vs ANOVA, T Test for Unequal Variances, ANOVA in SPSS, ANOVA in R and ANOVA in Python.
Downloads and Resources for Welch’s ANOVA
Use these resources to reproduce the Welch’s ANOVA workflow. The Python report, R report and SPSS output PDF are included as verification files. Script and workbook placeholders can be replaced after the final downloadable files are uploaded to the WordPress Media Library.
Download Dataset
Practice dataset with G3 and studytime variables.
Download Welch’s ANOVA Python Report PDF
Python report PDF for group means, Welch F statistic, p-value and charts.
Download Welch’s ANOVA R Report PDF
R validation PDF for Welch’s ANOVA interpretation.
Download Welch’s ANOVA SPSS Output PDF
SPSS output PDF with one-way ANOVA, homogeneity test and Welch robust test.
Download Python Script
Python code for Welch’s ANOVA, group weights and charts.
Download R Script and Excel Workbook
R workflow and Excel support workbook for Welch’s ANOVA.
FAQs About Welch’s ANOVA
What is Welch’s ANOVA?
Welch’s ANOVA is a robust one-way ANOVA used to compare three or more group means when equal variances should not be assumed.
What was tested in this example?
The example tested whether mean G3 final grade differs across four studytime groups.
What was the Welch’s ANOVA result?
The result was Welch F(3, 139.10) = 18.183, p = 5.188e-10, so equal group means were rejected.
Which group had the highest mean?
Studytime group 3 had the highest mean G3, about 13.23.
Which group had the lowest mean?
Studytime group 1 had the lowest mean G3, about 10.84.
How is Welch’s ANOVA different from one-way ANOVA?
Classic one-way ANOVA assumes equal variances, while Welch’s ANOVA adjusts the test using group-specific variances, sample sizes and adjusted degrees of freedom.
When should I use Welch’s ANOVA?
Use Welch’s ANOVA when comparing three or more independent group means and equal variances or equal group sizes are doubtful.
Can Welch’s ANOVA be done in SPSS?
Yes. In SPSS, use One-Way ANOVA and request the Welch robust test in the options, or use ONEWAY syntax with HOMOGENEITY WELCH.
Can Welch’s ANOVA be done in Excel?
Excel can calculate group means, variances and weights, but SPSS, R or Python is better for the final Welch F statistic, adjusted degrees of freedom and p-value.
What post hoc test should follow Welch’s ANOVA?
Games-Howell is commonly used after a significant Welch’s ANOVA when equal variances are not assumed.

