
Rank correlation, ordinal data, concordant pairs, discordant pairs and tie correction
Kendall’s Tau: Formula, Interpretation, Python, R, SPSS and Excel Guide
Kendall’s Tau is a nonparametric rank correlation coefficient used to measure monotonic association between two ordered variables. It compares all observation pairs and checks whether they move in the same order or opposite order. This guide explains Kendall’s tau-b with Python charts, R charts, SPSS output, Excel formulas, concordant pairs, discordant pairs, tied ranks, p-values, matrix interpretation and APA reporting.
Quick Answer: Kendall’s Tau Result
The main analysis tested the monotonic association between G1 and G3. G1 is the first-period grade, and G3 is the final grade. Kendall’s tau-b was used because grade data contain many tied values.
The result was Kendall’s tau-b = 0.766198, with N = 649 complete pairs and p = 2.108694e-155. The direction is positive, the practical strength label is strong, and the decision is Reject H0: significant monotonic association.
Final interpretation: Students with higher G1 ranks tend to have higher G3 ranks. The association is strong, positive and statistically significant. Because many grade values are tied, Kendall’s tau-b is the correct version to report.
Important rule: Kendall’s Tau measures ordered agreement, not necessarily a straight-line relationship. Use it when the relationship is monotonic and when ordinal ranks or tied values make Pearson correlation less ideal.
Table of Contents
- What Is Kendall’s Tau?
- Kendall’s Tau Formula
- Null and Alternative Hypotheses
- Dataset and Variables Used
- Verified Kendall’s Tau Results
- Python Chart-by-Chart Interpretation
- R Chart-by-Chart Interpretation
- SPSS Output Interpretation
- Excel Worked File Explanation
- Python, R, SPSS and Excel Workflows
- Code Blocks and Excel Formulas
- How to Report Kendall’s Tau
- Common Mistakes
- Downloads and Resources
- Related Statistical Guides
- FAQs About Kendall’s Tau
What Is Kendall’s Tau?
Kendall’s Tau is a rank-based measure of association between two variables. Instead of using raw distances between values, it studies the ordering of observations. If higher values of one variable usually match higher values of the other variable, tau is positive. If higher values of one variable usually match lower values of the other variable, tau is negative.
Kendall’s Tau is useful for ordinal data, ranked data, non-normal data and data with many repeated values. In this guide, G1 and G3 are numeric grade variables, but the repeated grade values create many ties. That is why Kendall’s tau-b is used instead of a tie-free tau-a version.
Kendall’s Tau is related to Correlation in Python, Correlation in R, Correlation Matrix, Correlation Assumptions, p-value, effect size and descriptive statistics explained.
Simple definition: Kendall’s Tau measures how often paired observations are ordered in the same direction compared with the opposite direction.
Kendall’s Tau Formula
The simple tie-free Kendall tau idea is:
Here, C is the number of concordant pairs, D is the number of discordant pairs, and n(n − 1) / 2 is the total number of observation pairs.
Because real datasets often contain ties, Kendall’s tau-b uses a tie-corrected denominator:
| Symbol | Meaning | Value in G1 vs G3 Example |
|---|---|---|
| C | Concordant pairs | 158,466 |
| D | Discordant pairs | 13,791 |
| Tx | Ties in X only | 16,516 |
| Ty | Ties in Y only | 16,614 |
| Ties on both | Pairs tied on both variables | 4,889 |
| τb | Kendall’s tau-b | 0.766198 |
The large number of concordant pairs compared with discordant pairs explains why the coefficient is strongly positive.
Null and Alternative Hypotheses
The Kendall’s Tau hypothesis test checks whether the population rank association is zero.
| Statement | Hypothesis | Meaning |
|---|---|---|
| Null hypothesis | H0: Kendall’s tau-b = 0 | There is no monotonic association between G1 and G3. |
| Alternative hypothesis | H1: Kendall’s tau-b ≠ 0 | A monotonic association exists between G1 and G3. |
| Decision rule | Reject H0 if p < .05 | The observed rank association is statistically significant. |
Decision: Because p = 2.108694e-155 is far below .05, the null hypothesis is rejected. There is a statistically significant positive monotonic association between G1 and G3.
Dataset and Variables Used
The analysis used the student performance dataset. The main variables were G1 and G3. A wider Kendall’s tau-b matrix also included age, Medu, Fedu, traveltime, studytime, failures, famrel, freetime, goout, Dalc, Walc, health, absences, G1, G2 and G3.
| Variable | Role | Scale Type | Reason for Kendall’s Tau |
|---|---|---|---|
| G1 | Primary X variable | Numeric grade | Ranked first-period grade score. |
| G3 | Primary Y variable | Numeric grade | Ranked final grade score. |
| G2 | Additional grade variable | Numeric grade | Included in top pairwise matrix. |
| failures | Academic risk variable | Ordinal/count-like | Shows negative rank association with grades. |
| Medu and Fedu | Parent education variables | Ordinal | Good example of ordinal Kendall correlation. |
Before interpreting Kendall’s Tau, check whether the variables are ordered, whether rows are independent, whether the relationship is monotonic, and whether ties are present. In this dataset, ties are common, so tau-b is the appropriate version.
Verified Kendall’s Tau Results
The main result and top pairwise results are shown below. Pairs are ranked by absolute tau-b strength.
| Rank | Pair | N | Kendall’s tau-b | p-value | Direction | Interpretation |
|---|---|---|---|---|---|---|
| 1 | G2 vs G3 | 649 | 0.869595 | 2.113285e-199 | Positive | Very strong ordered grade association. |
| 2 | G1 vs G2 | 649 | 0.780639 | 4.403489e-161 | Positive | Strong ordered grade association. |
| 3 | G1 vs G3 | 649 | 0.766198 | 2.108694e-155 | Positive | Main result; strong monotonic association. |
| 4 | Medu vs Fedu | 649 | 0.569954 | 5.622318e-68 | Positive | Moderate-to-strong parent education association. |
| 5 | Dalc vs Walc | 649 | 0.555407 | 4.096093e-59 | Positive | Weekday and weekend alcohol use are ordered together. |
| 6 | failures vs G3 | 649 | -0.378883 | 2.182742e-30 | Negative | Higher failures are associated with lower final grade ranks. |
| 7 | failures vs G2 | 649 | -0.367969 | 9.916502e-29 | Negative | Higher failures are associated with lower G2 ranks. |
| 8 | failures vs G1 | 649 | -0.365780 | 1.963360e-28 | Negative | Higher failures are associated with lower G1 ranks. |
| 9 | goout vs Walc | 649 | 0.314907 | 1.732229e-22 | Positive | Going out and weekend alcohol use move together. |
| 10 | freetime vs goout | 649 | 0.303904 | 6.841912e-21 | Positive | Free time and going out are positively ordered. |
The strongest overall pair is G2 vs G3, while the primary teaching example is G1 vs G3. The failures variable has the strongest negative grade relationships.
Python Chart-by-Chart Interpretation
The Python report includes six charts: rank scatterplot, pair classification counts, Kendall matrix heatmap, p-value heatmap, top tau pairs and primary variable distributions.
Python Chart 1: Kendall’s Tau Rank Scatterplot
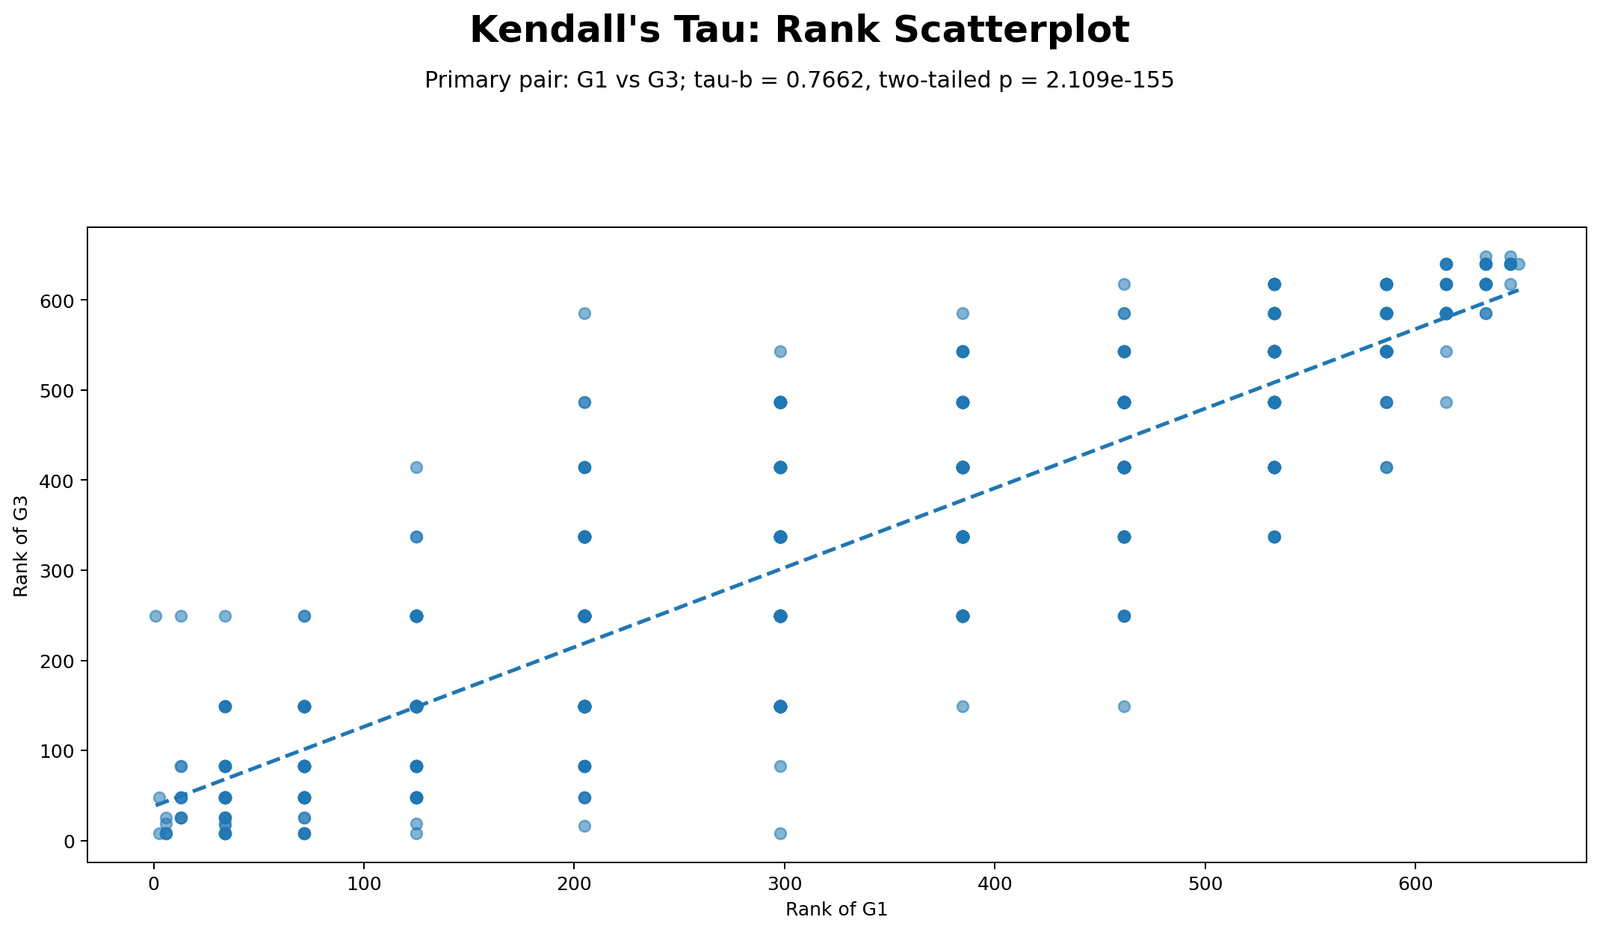
The rank scatterplot shows that higher G1 ranks generally align with higher G3 ranks. The pattern is upward and monotonic, which supports the positive Kendall’s tau-b value of 0.766198.
This chart is useful because Kendall’s Tau is a rank-based method. The chart does not require a perfect straight line; it only needs a consistent ordered pattern. The strong upward rank pattern supports the final conclusion.
Python Chart 2: Pair Classification Counts
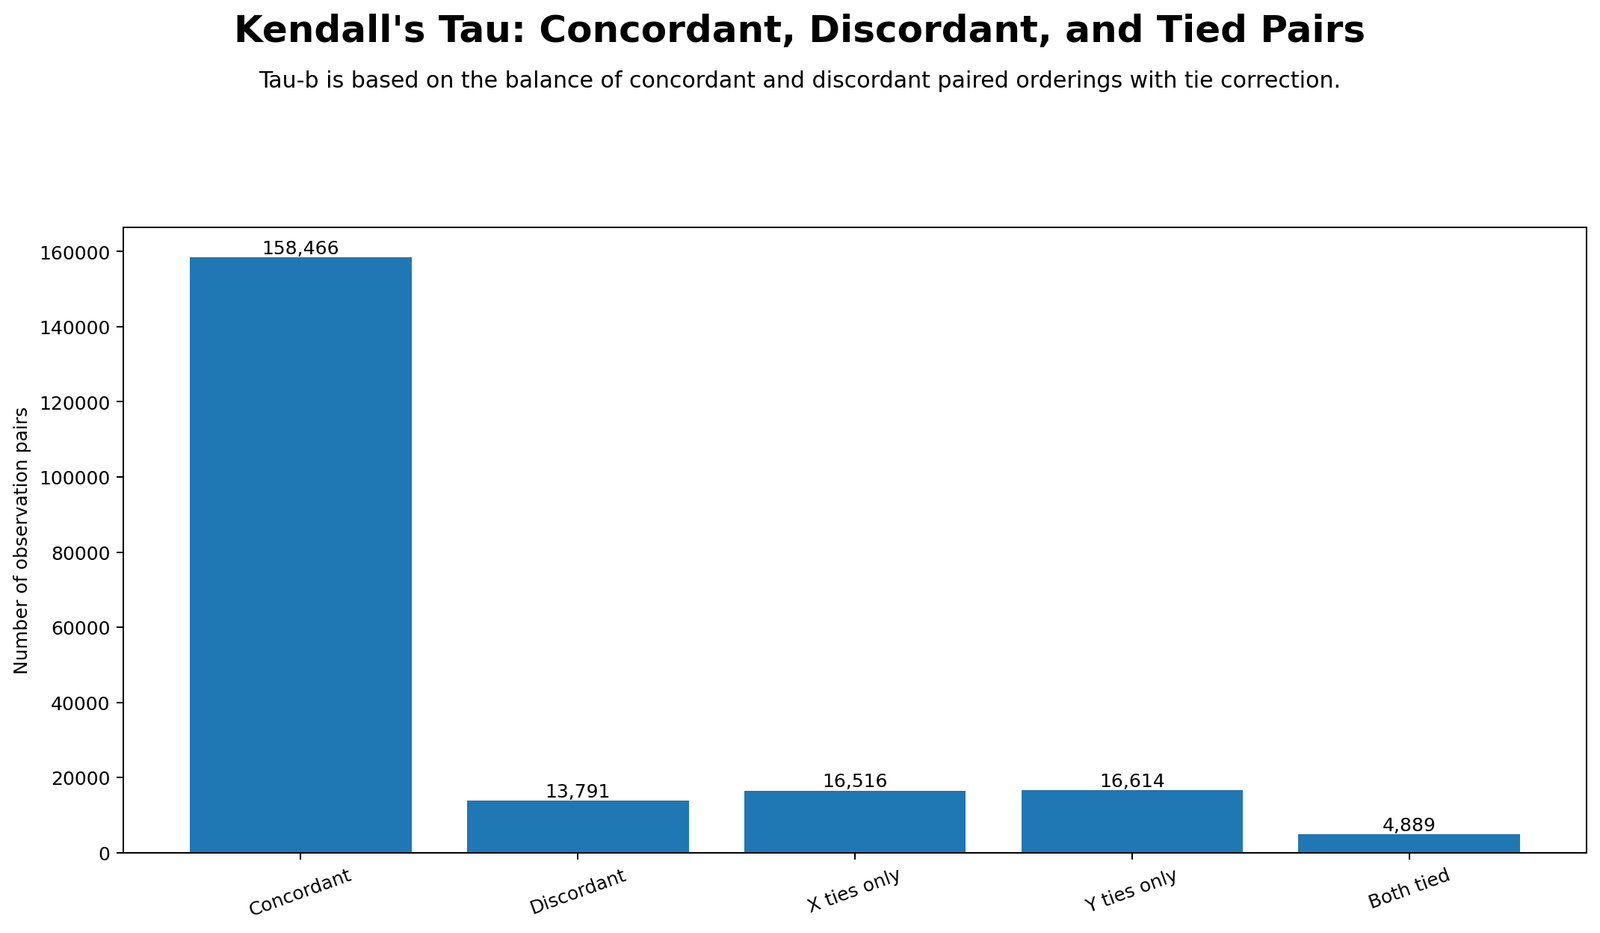
This chart explains the tau-b calculation directly. The analysis found 158,466 concordant pairs and 13,791 discordant pairs. Concordant pairs dominate the result, which is why tau-b is strongly positive.
The chart also shows ties in X only, ties in Y only and ties on both variables. These ties are expected because grade scores repeat across many students. Kendall’s tau-b corrects for those ties.
Python Chart 3: Kendall’s Tau Matrix Heatmap
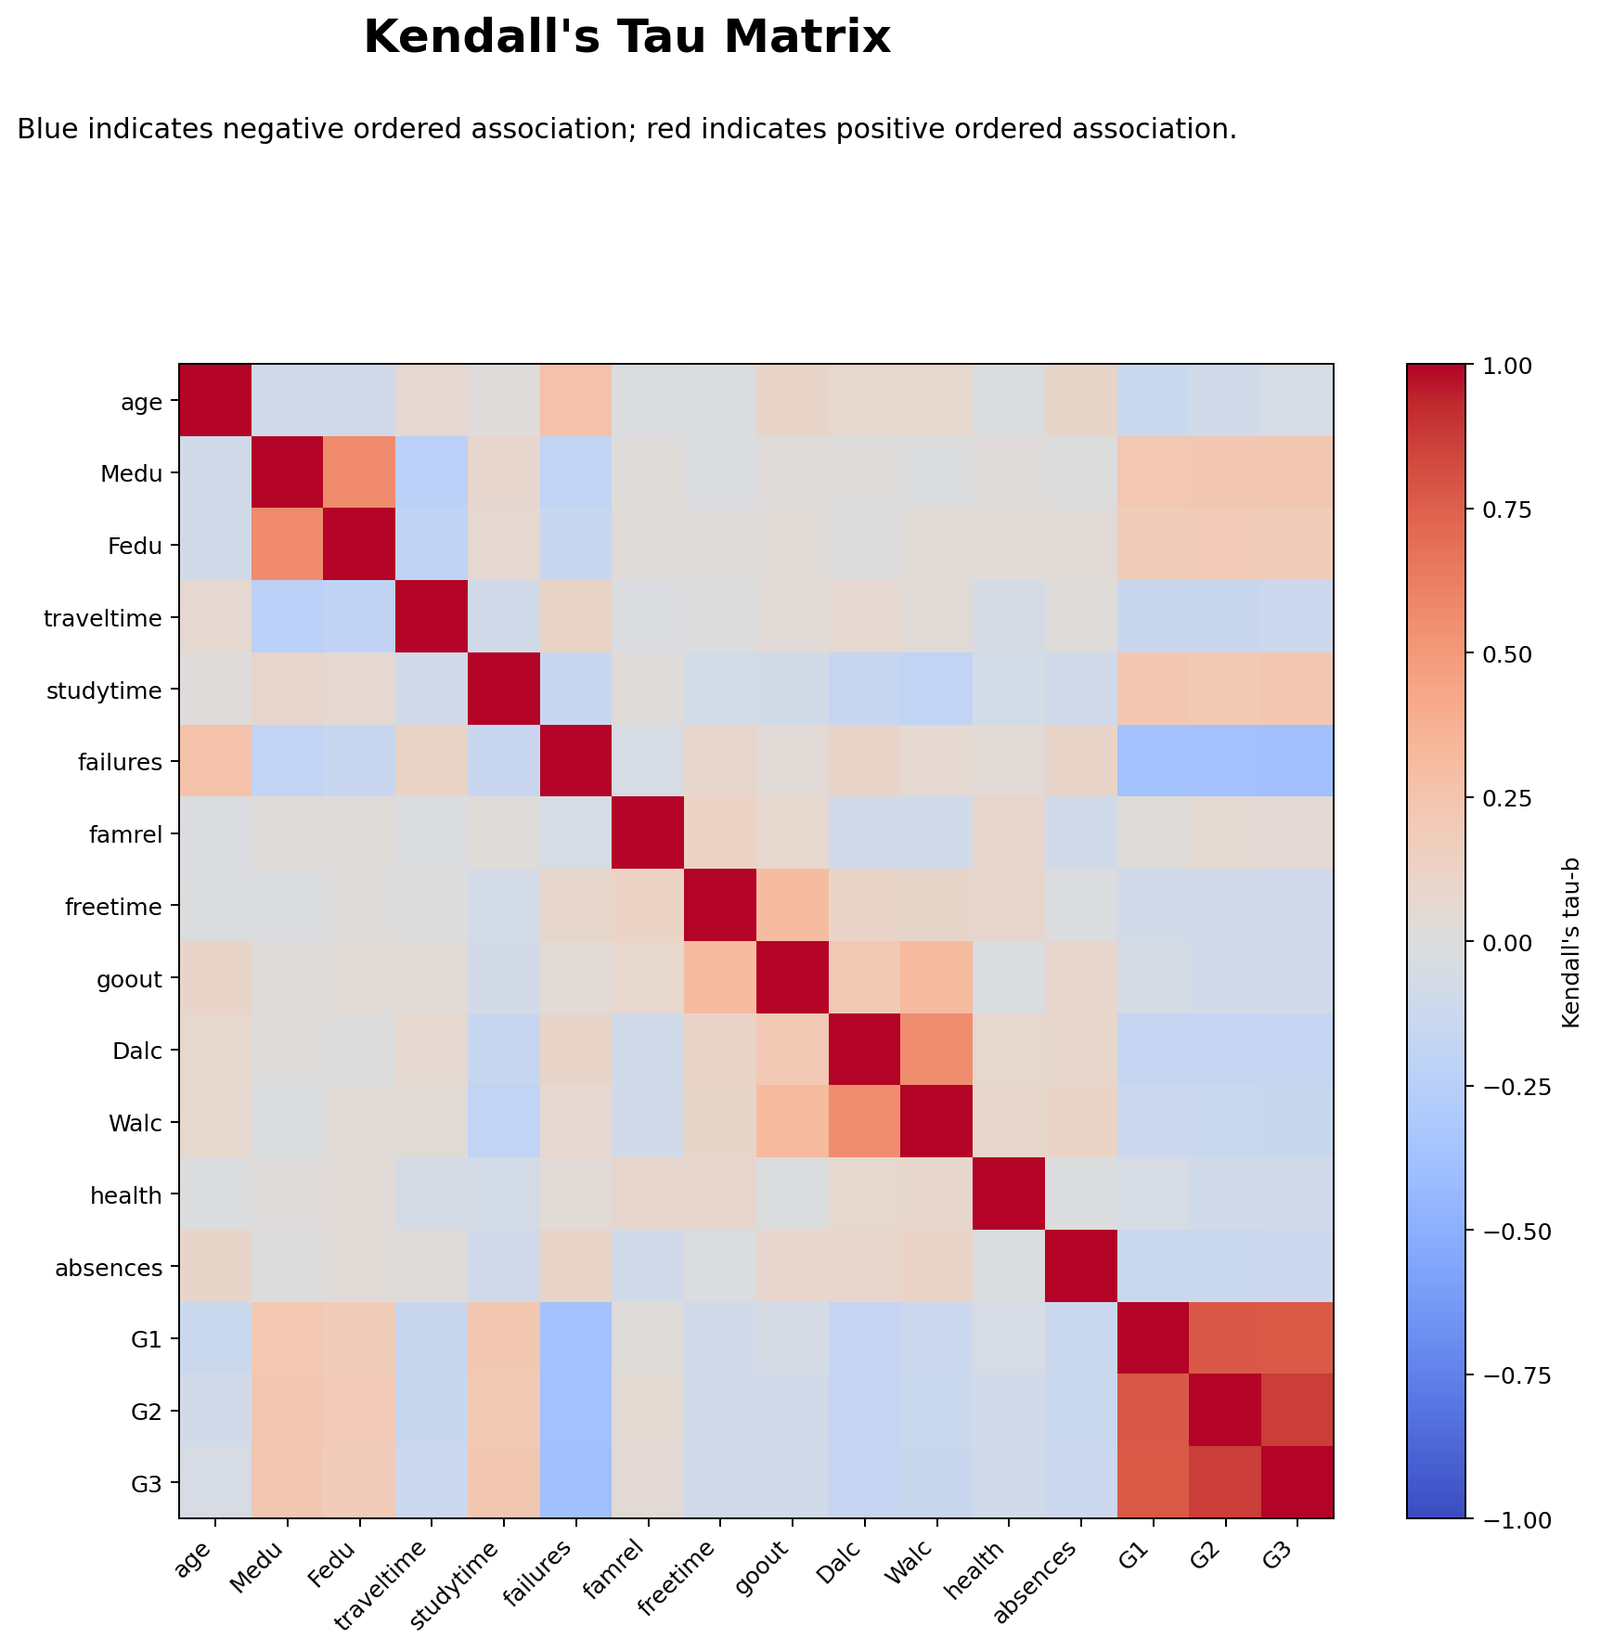
The matrix heatmap shows ordered associations across all selected numeric and ordinal variables. The grade block stands out clearly: G1, G2 and G3 have strong positive tau-b relationships.
The heatmap also shows meaningful negative grade relationships involving failures. This means students with more previous failures tend to have lower ordered grade positions.
Python Chart 4: Kendall’s Tau p-value Heatmap
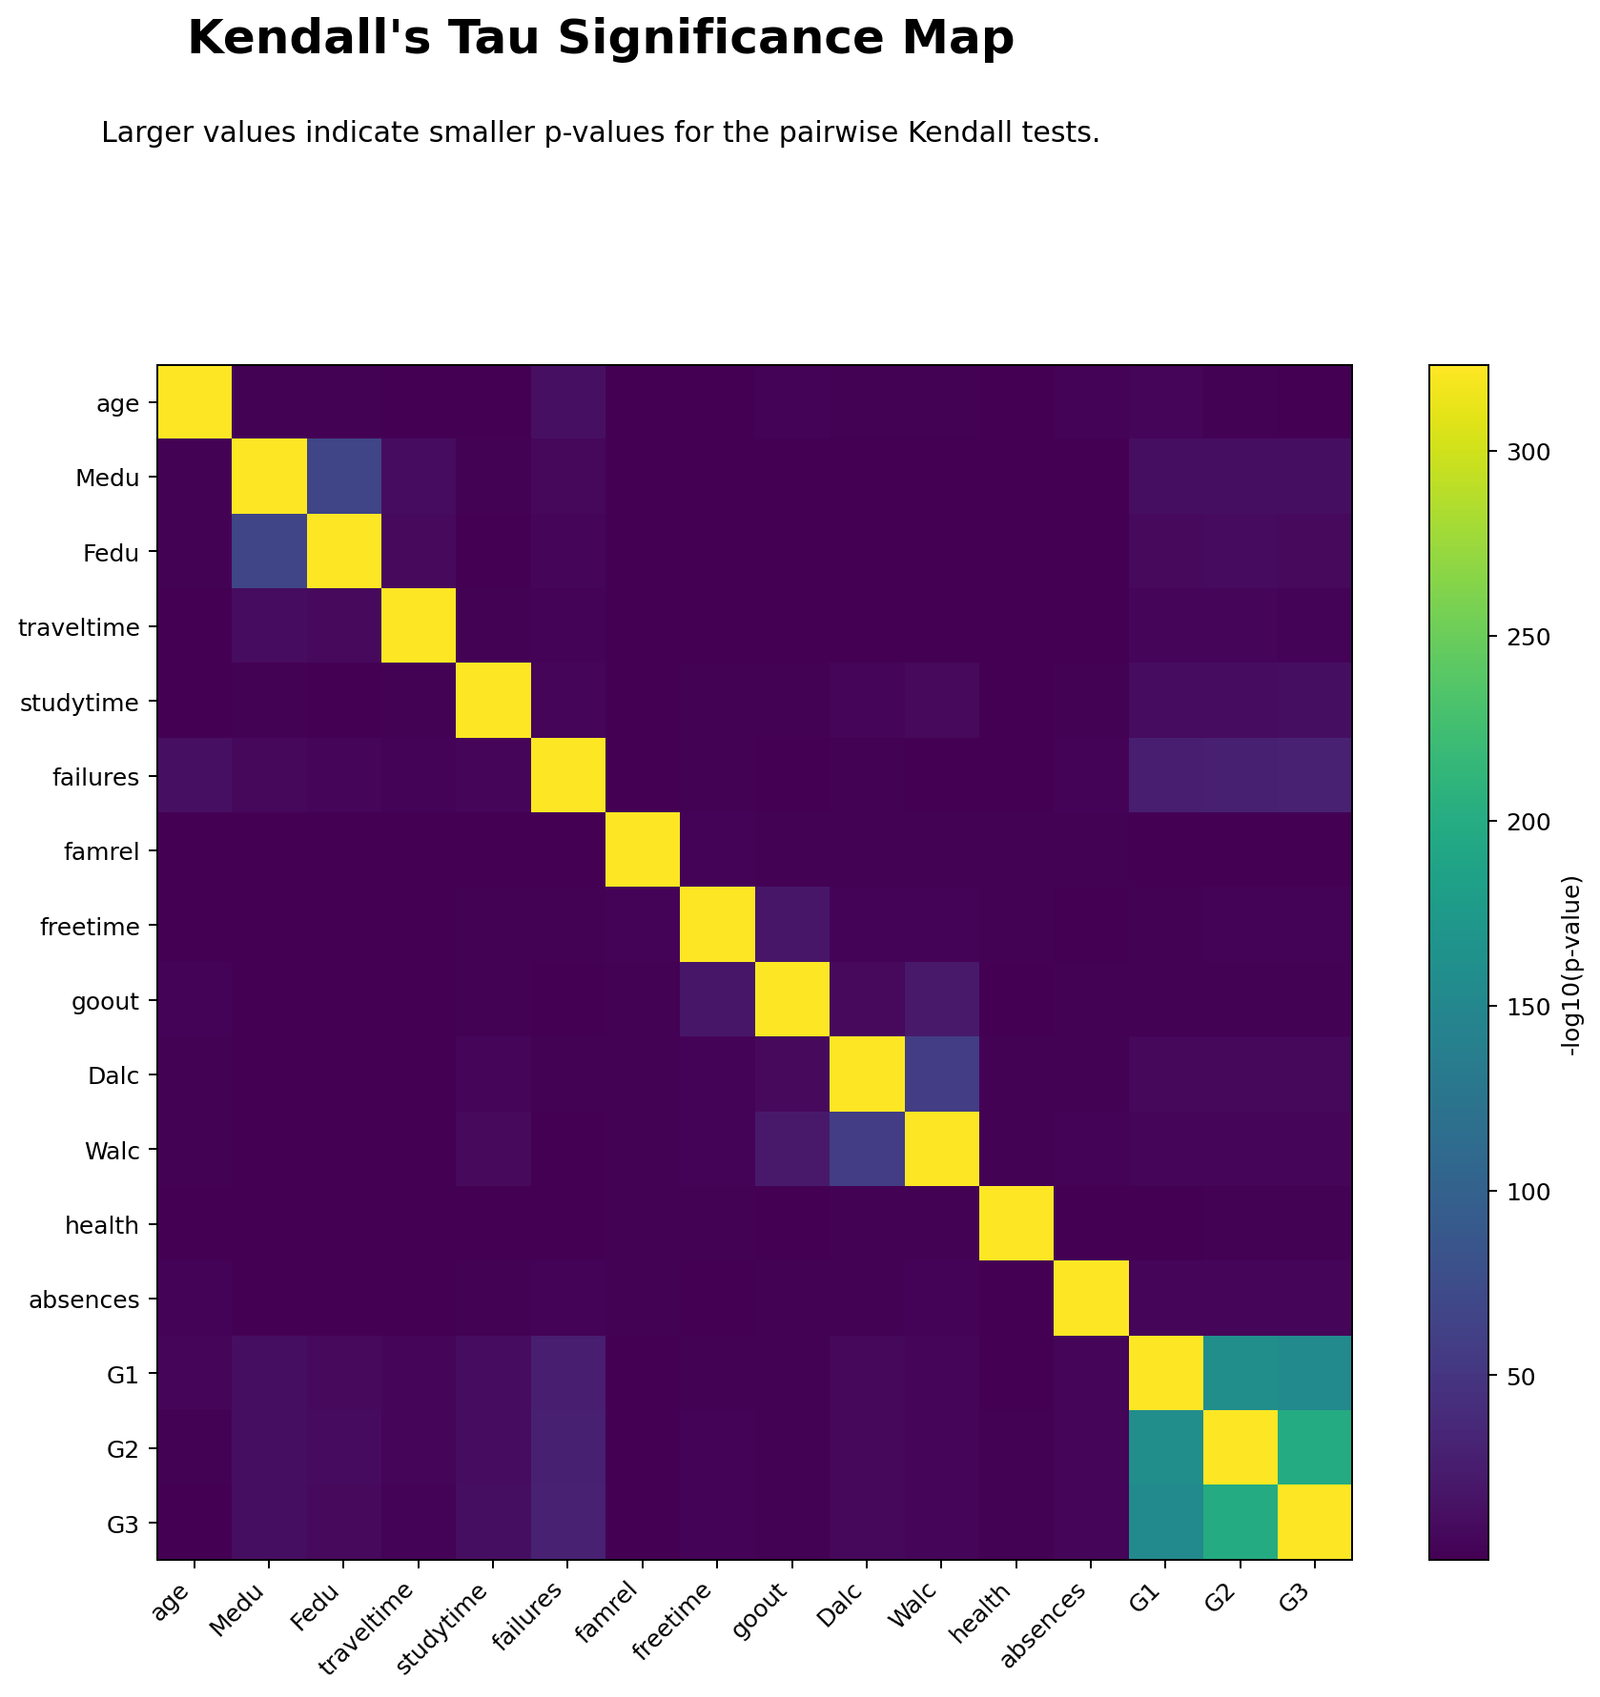
The p-value heatmap separates statistical evidence from practical strength. Strong grade relationships have extremely small p-values. Some weaker associations may also be significant because the sample size is large.
This chart should be interpreted together with the tau-b matrix. The tau-b value tells strength and direction, while the p-value tells whether the association is statistically detectable.
Python Chart 5: Top Kendall’s Tau Pairs
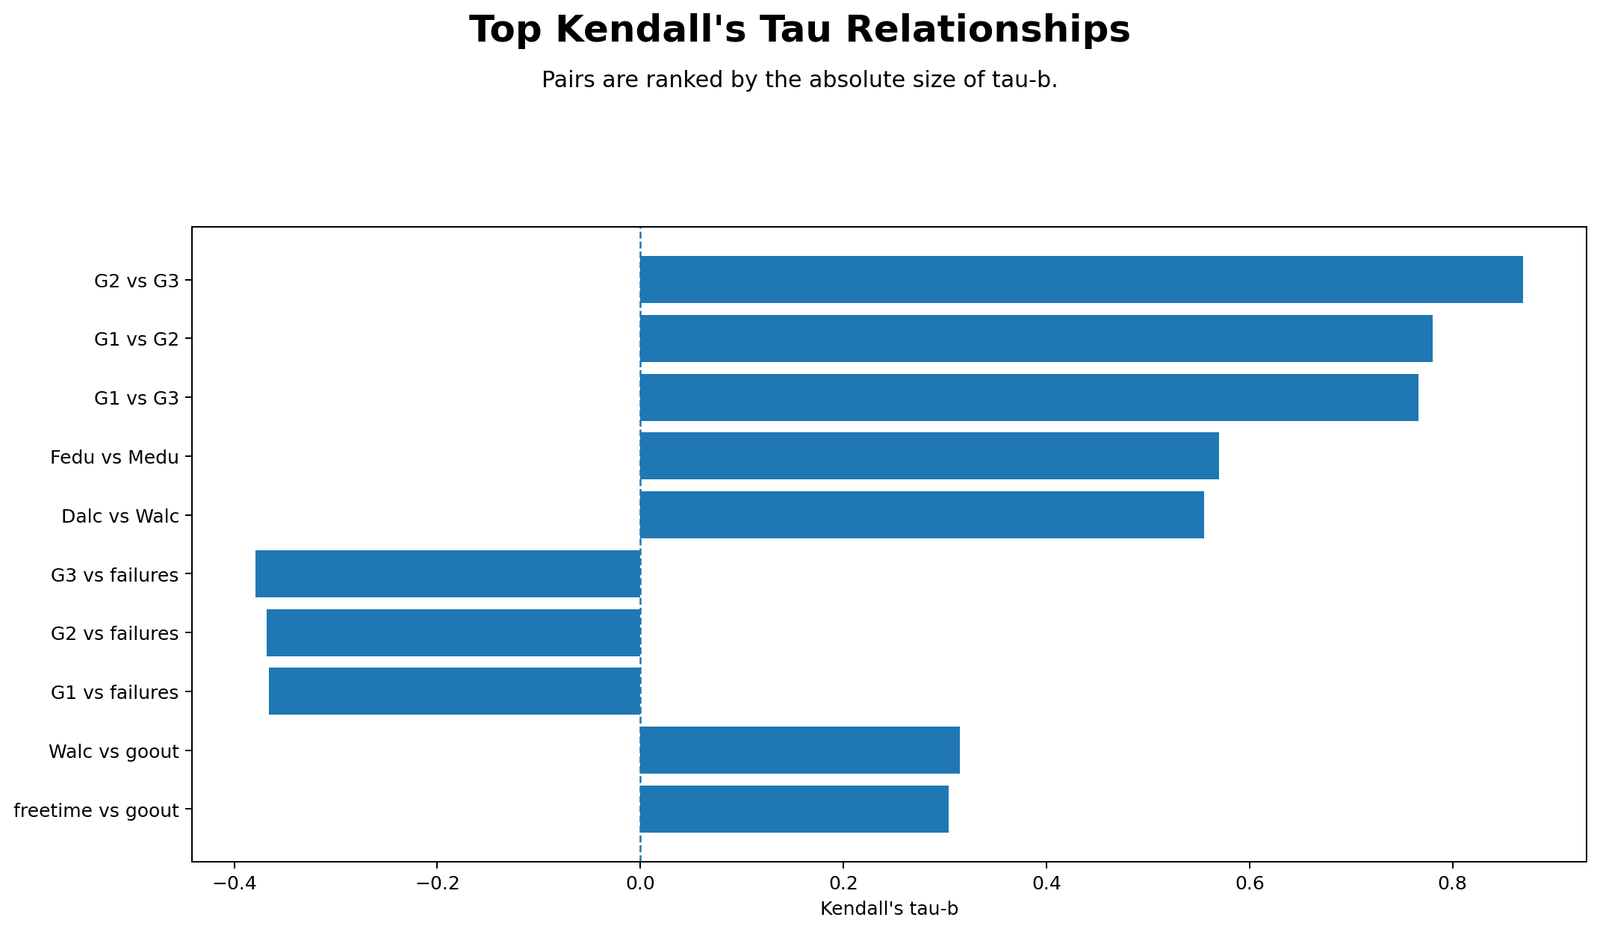
The top-pairs chart ranks relationships by absolute tau-b value. The strongest pair is G2 vs G3, followed by G1 vs G2 and G1 vs G3. This shows that the grade variables form the strongest ordered cluster.
Negative relationships involving failures also appear in the ranking. These should be described as negative monotonic relationships, not causal effects.
Python Chart 6: Primary Variable Distributions
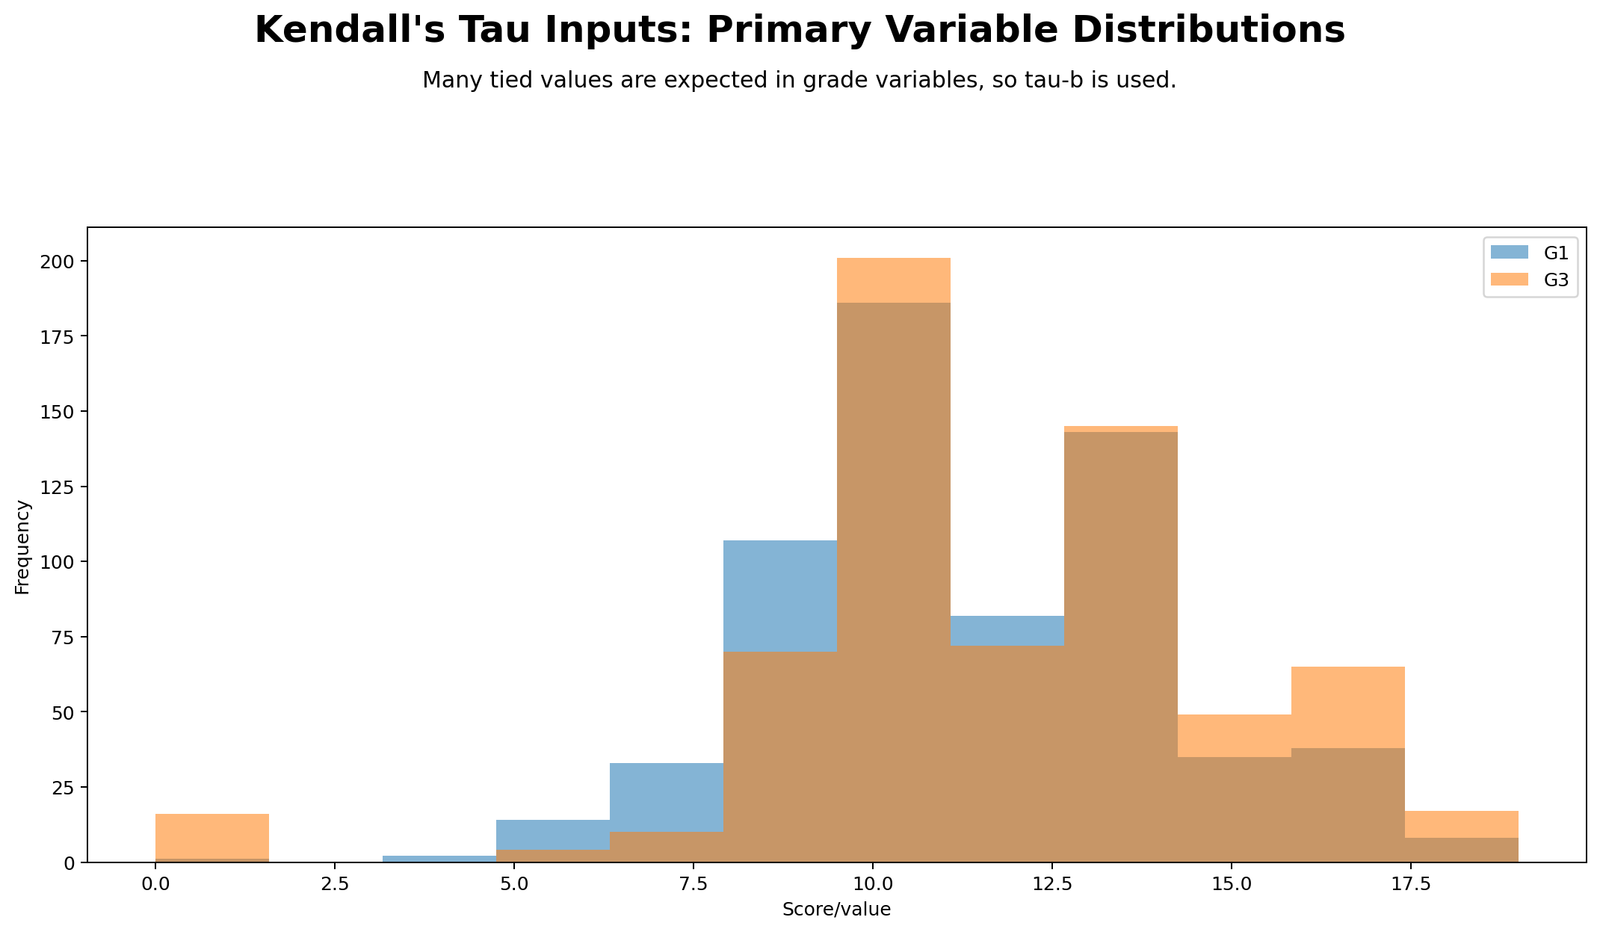
The distribution chart shows that G1 and G3 contain repeated grade values. These repeated values create tied ranks. Because ties are present, tau-b is better than tau-a.
This chart supports the method choice. Kendall’s tau-b is designed for ordered data with ties, making it appropriate for grade variables with repeated scores.
R Chart-by-Chart Interpretation
The R report validates the same result using a separate workflow. It includes colorful charts for rank scatterplot, pair classification counts, tau matrix, top tau pairs and primary variable distributions.
R Chart 1: Colorful Kendall’s Tau Rank Scatterplot
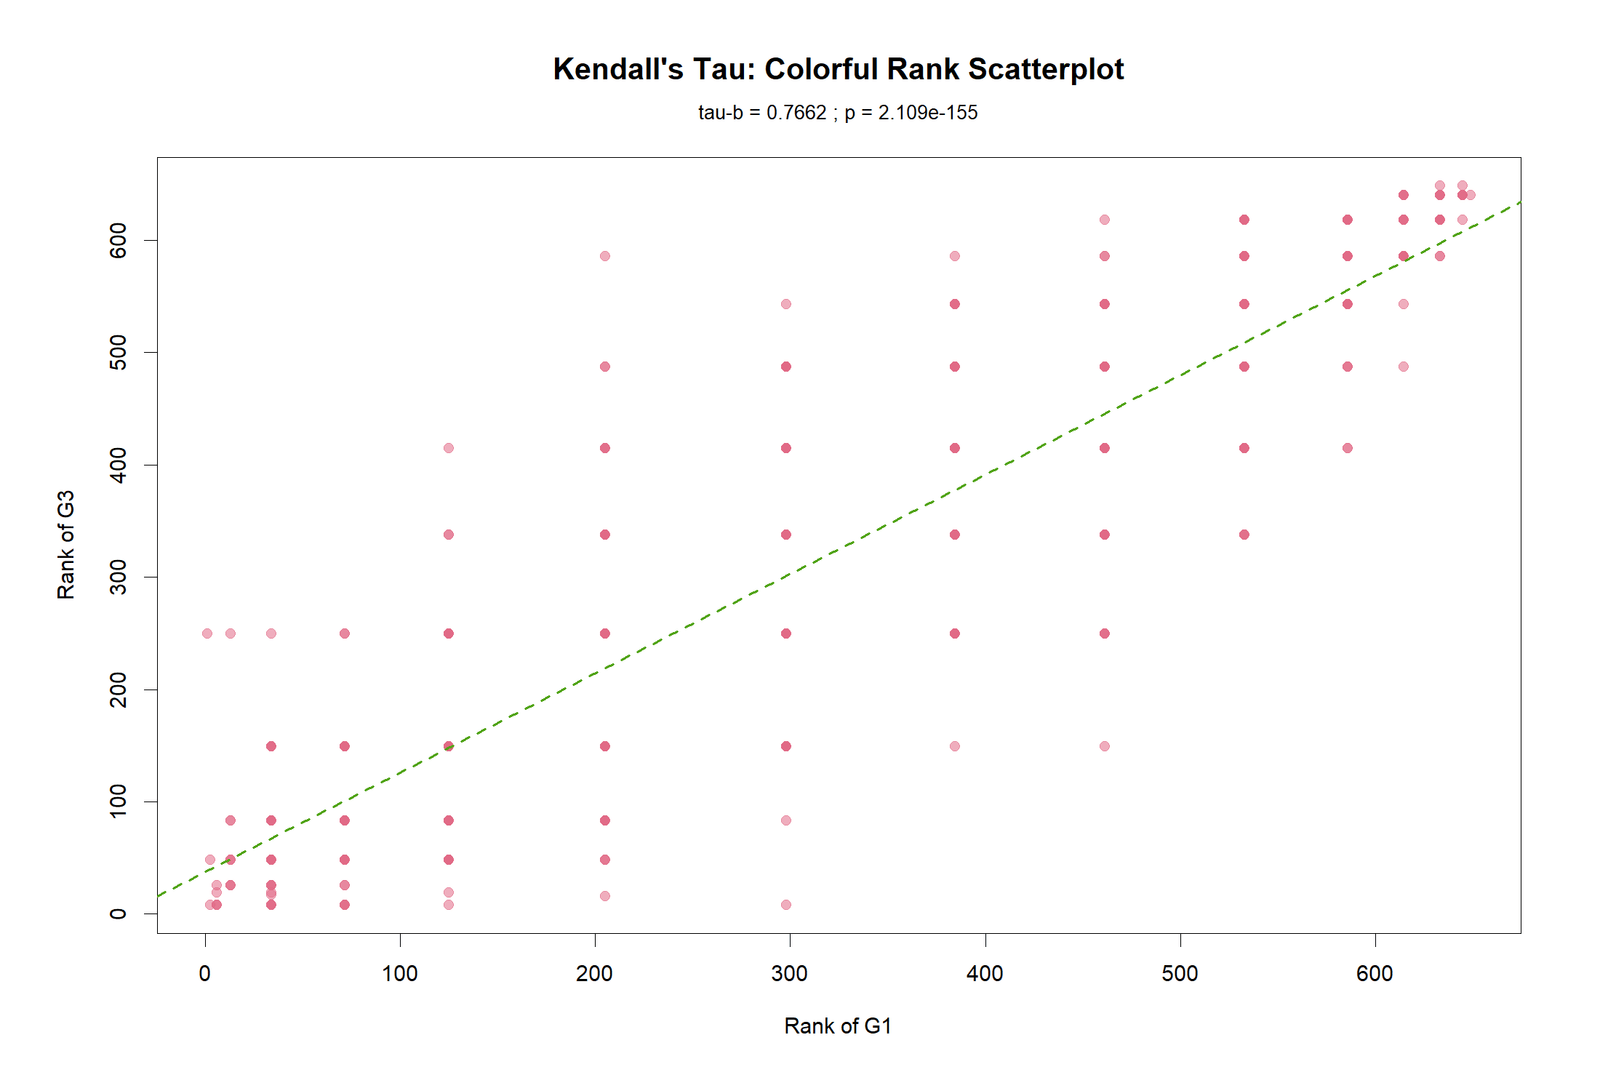
The R rank scatterplot confirms the same upward ordered pattern. Higher G1 ranks generally match higher G3 ranks. This visual pattern agrees with tau-b = 0.766198.
R Chart 2: Colorful Pair Classification Counts
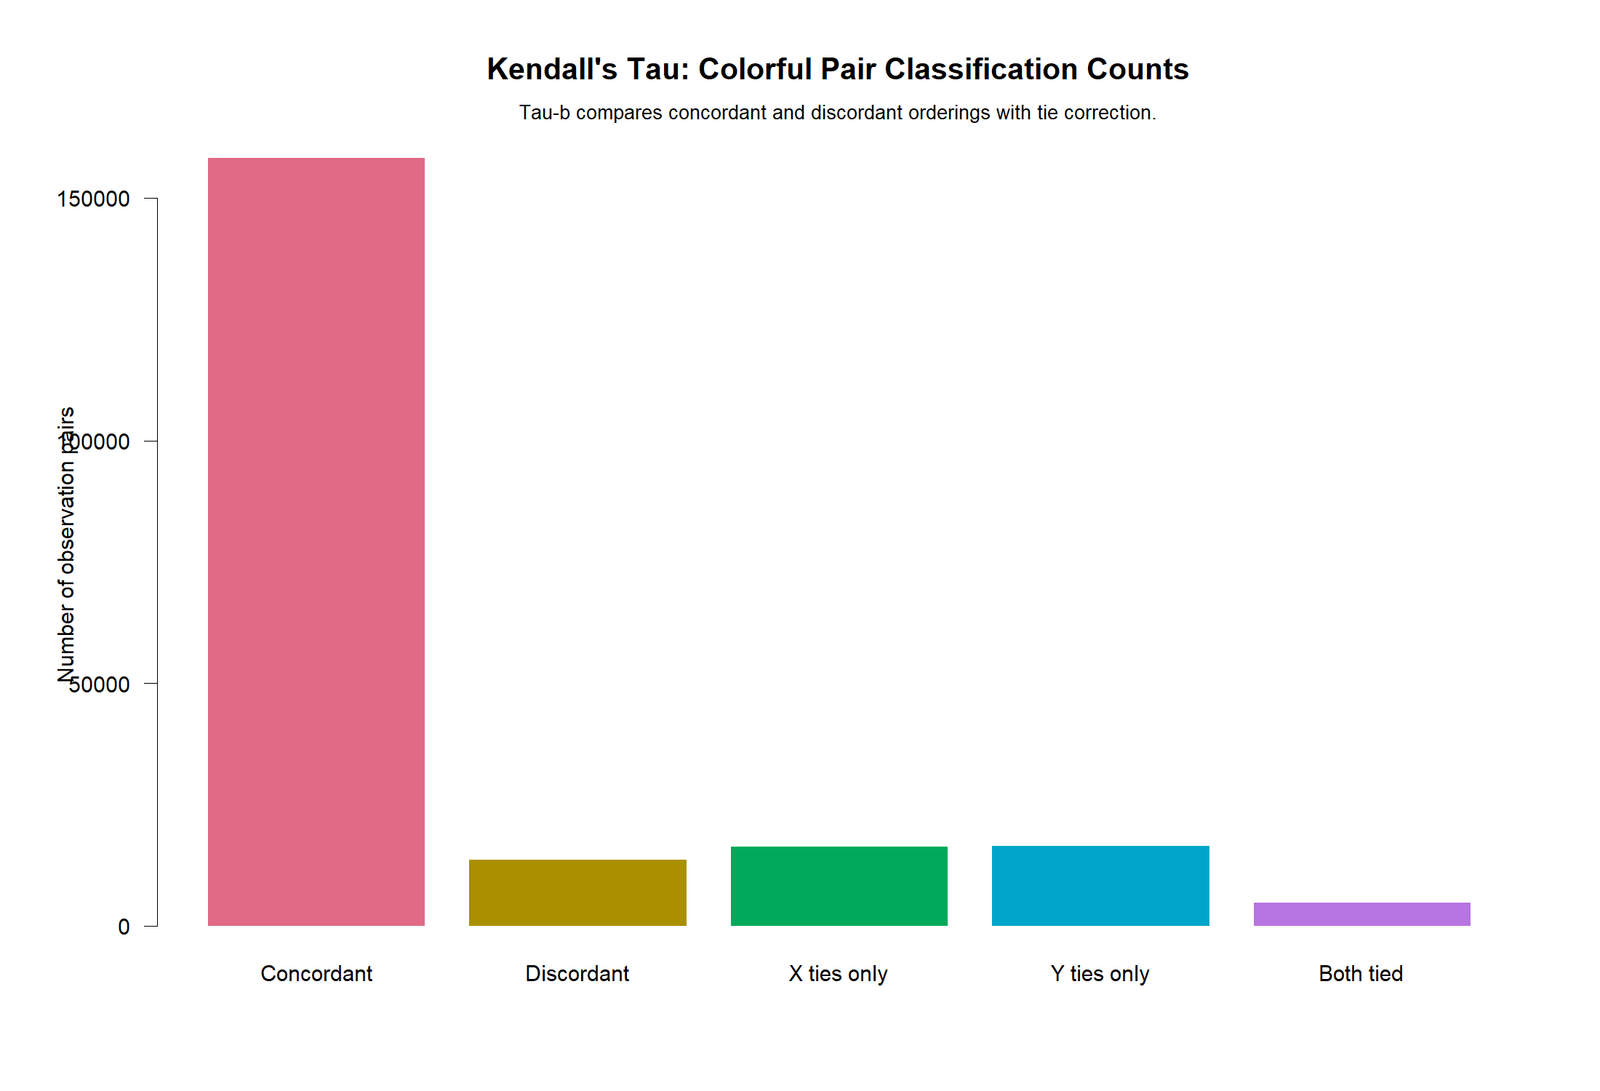
The R pair-count chart confirms that concordant pairs are far more common than discordant pairs. This explains the strong positive coefficient. The tie categories again show why tau-b is reported.
R Chart 3: Colorful Kendall’s Tau Matrix Heatmap
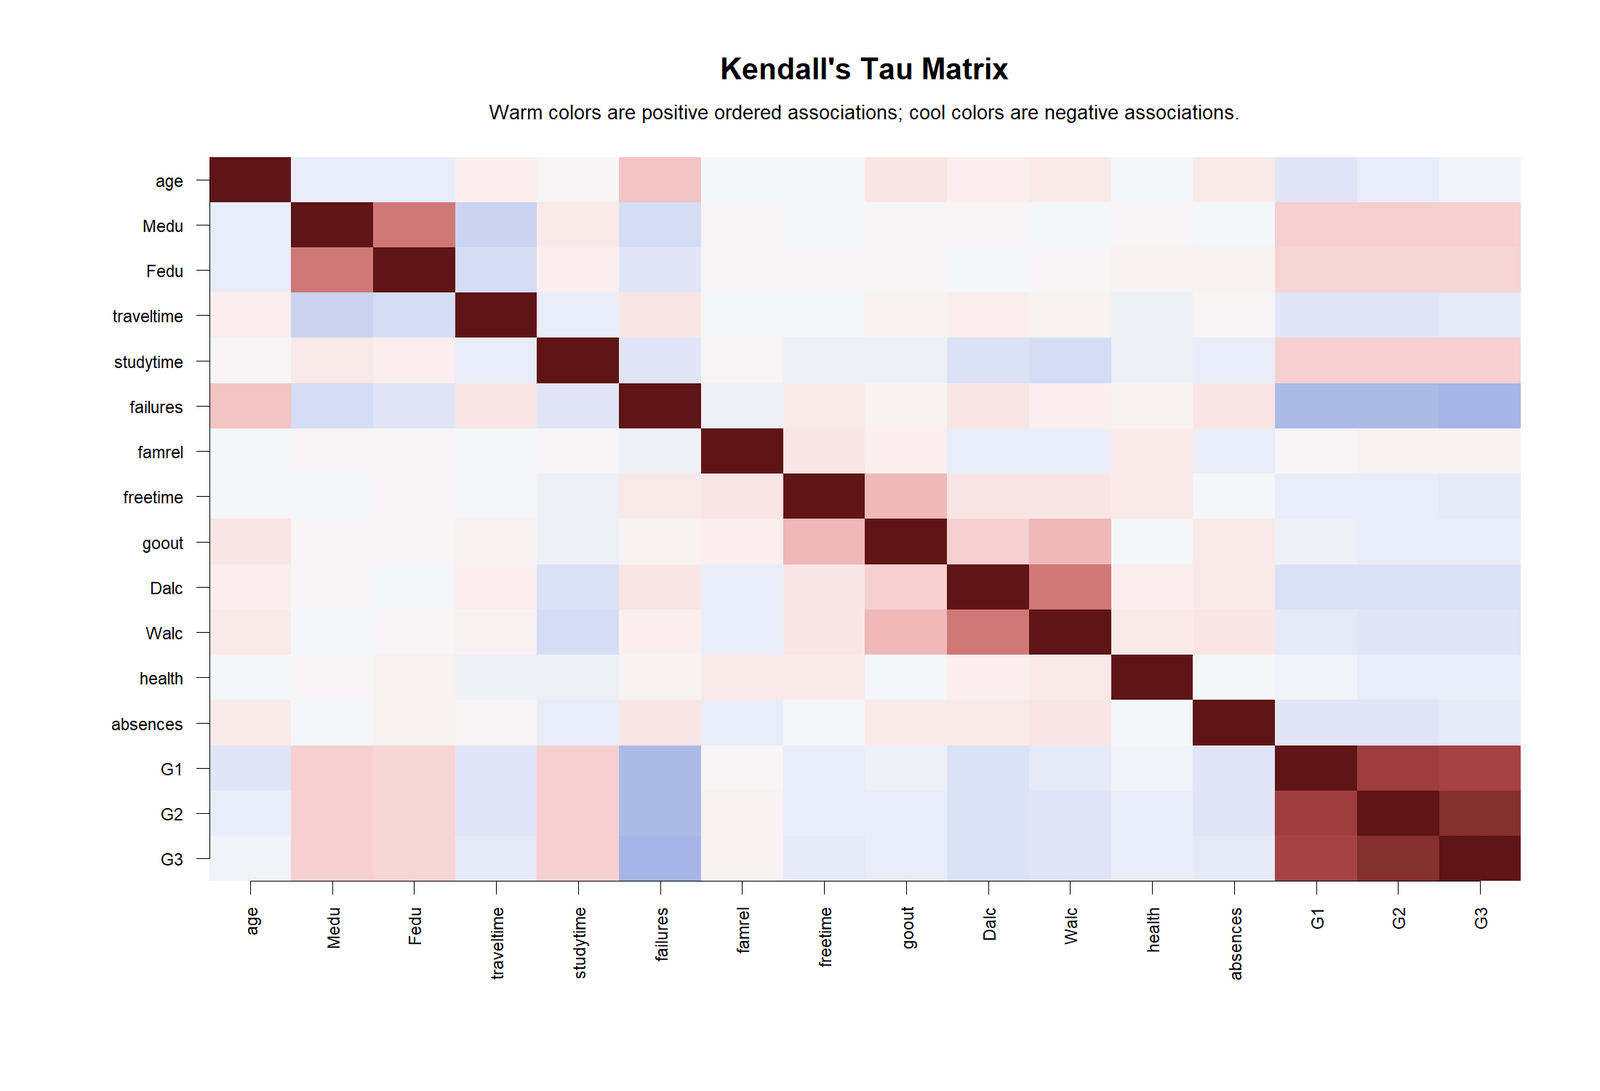
The R tau matrix confirms the same strongest ordered relationships. The G1, G2 and G3 block is strongly positive, while failures have negative relationships with grade variables.
R Chart 4: Colorful Top Kendall’s Tau Pairs
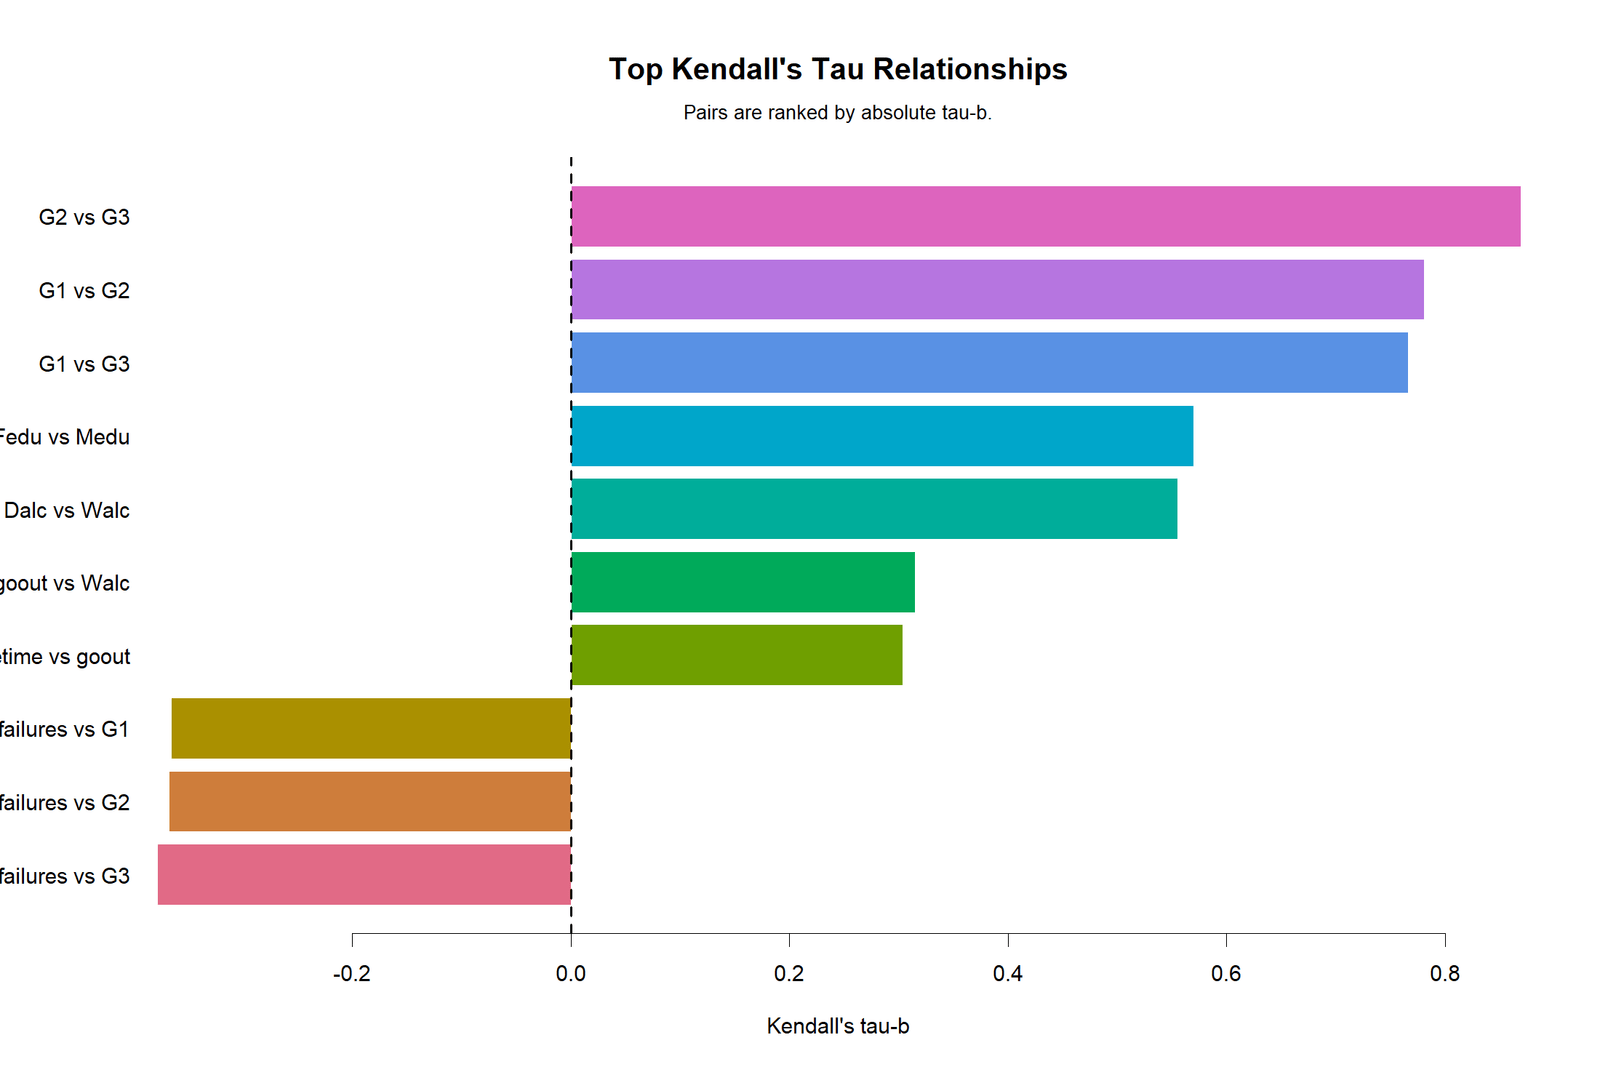
The top-pairs chart confirms the ranking: G2 vs G3 is strongest, G1 vs G2 is second, and G1 vs G3 is third. The repeated agreement across Python, R and Excel strengthens the result.
R Chart 5: Colorful Primary Variable Distributions
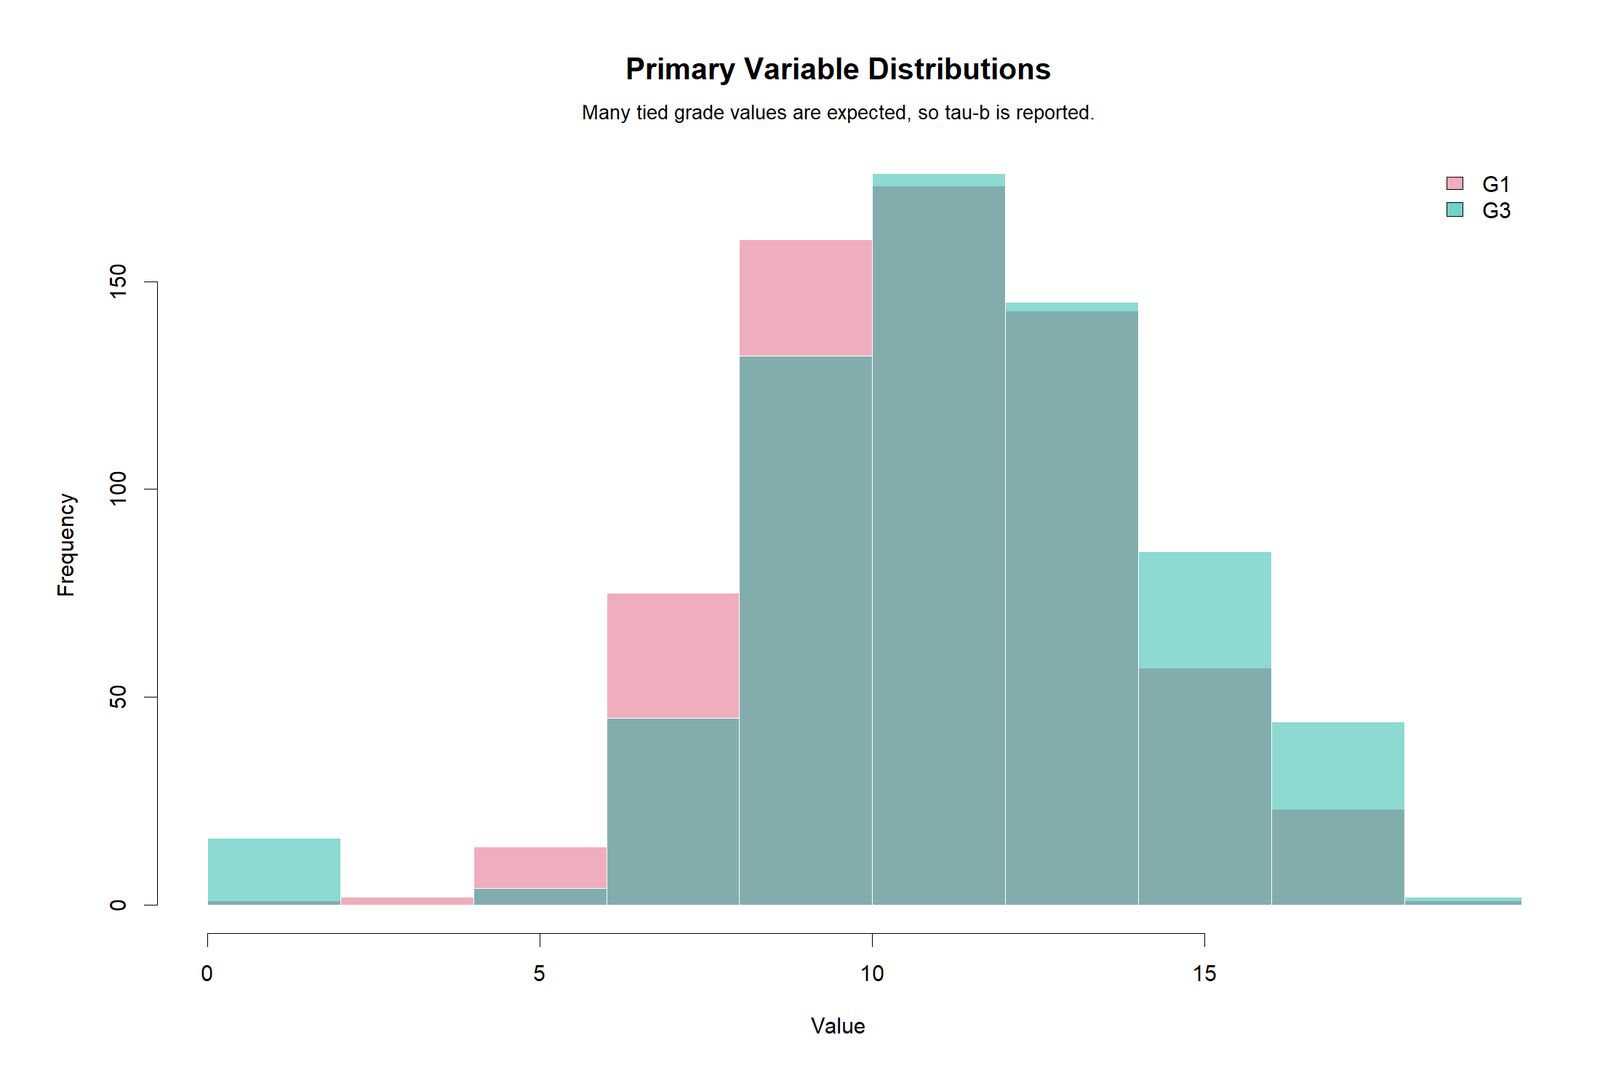
The R distribution chart again shows many tied values in G1 and G3. This supports the choice of Kendall’s tau-b and helps explain why tie correction is required.
SPSS Output Interpretation
The SPSS output confirms the primary nonparametric correlation between G1 and G3. SPSS reports Kendall’s tau-b correlation coefficient of approximately .766, Sig. (2-tailed) = .000, and N = 649.
Open the SPSS Kendall’s Tau Output PDF
| SPSS Output Item | Value | Interpretation |
|---|---|---|
| Primary pair | G1 and G3 | First-period grade compared with final grade. |
| Kendall’s tau-b | .766 | Strong positive monotonic association. |
| Sig. (2-tailed) | .000 | Statistically significant at the .01 level. |
| N | 649 | Complete valid pair count. |
| Decision | Reject H0 | There is significant monotonic association. |
The SPSS result is shorter than the Python and R reports, but it gives the formal nonparametric correlation table many students need for assignments, theses and research reports.
Excel Worked File Explanation
The Excel workbook gives a fully worked Kendall’s Tau analysis. It includes the original dataset, primary G1 and G3 data, a first-30-observation pairwise demo, a full Kendall matrix, top pairwise results and an assumptions sheet.
Download the Kendall’s Tau Fully Worked Excel File
| Excel Sheet | Purpose | Main Content |
|---|---|---|
| Dashboard | Quick result summary. | Shows G1 vs G3 tau-b, p-value, decision and top pairs. |
| Dataset | Original uploaded dataset. | All variables used for the correlation matrix. |
| Primary_Data | Main G1 and G3 calculation area. | Ranks, complete n and Kendall’s tau-b summary. |
| Pairwise_Demo_30 | Manual pair classification demo. | Shows concordant, discordant and tied pair formulas for first 30 rows. |
| Kendall_Matrix | Full pairwise tau-b matrix. | Pairwise tau-b values across numeric and ordinal variables. |
| Top_Pairs | Ranked pairwise results. | Top relationships sorted by absolute tau-b. |
| Assumptions | Reporting and assumption guide. | Scale, independence, monotonicity, ties and missing-value rules. |
The Excel dashboard confirms the primary result: Kendall’s tau-b = 0.7661978205, p = 2.1086936598e-155, and decision Reject H0: significant monotonic association. The pairwise demo also shows how pair classification works for the first 30 observations.
| Pairwise Demo Item | First 30 Observation Value | Meaning |
|---|---|---|
| Demo pairs | 435 | Total i < j observation pairs for first 30 rows. |
| Concordant pairs | 291 | Pairs ordered in the same direction. |
| Discordant pairs | 26 | Pairs ordered in opposite directions. |
| X ties only | 49 | Pairs tied only on G1. |
| Y ties only | 51 | Pairs tied only on G3. |
| Ties on both | 18 | Pairs tied on both G1 and G3. |
| Demo tau-b | 0.7221 | Manual tau-b formula applied to the demo rows. |
This workbook is especially useful for teaching because it shows the logic behind the coefficient instead of only presenting the final value.
Python, R, SPSS and Excel Workflows
| Software | Main Workflow | Best Use |
|---|---|---|
| Python | Use pandas for data handling, scipy.stats.kendalltau for tau-b and matplotlib for rank/pair charts. | Automated analysis, charts and matrix reporting. |
| R | Use cor.test(method = “kendall”, exact = FALSE), matrix calculations and R graphics. | Statistical validation and colorful publication charts. |
| SPSS | Use Nonparametric Correlations with Kendall’s tau-b selected. | Formal output table and thesis-style reporting. |
| Excel | Use rank formulas, pair classification, COUNT/SUM formulas and tau-b denominator calculation. | Manual learning and formula-based checking. |
Code Blocks and Excel Formulas
Python Code for Kendall’s Tau
import pandas as pd
from scipy.stats import kendalltau

df = pd.read_csv("dataset.csv")

x_var = "G1"
y_var = "G3"

work = df[[x_var, y_var]].dropna()
tau, p_value = kendalltau(work[x_var], work[y_var])

print("Complete pairs:", len(work))
print("Kendall tau-b:", tau)
print("Two-tailed p-value:", p_value)

if p_value < 0.05:
    print("Reject H0: significant monotonic association")
else:
    print("Fail to reject H0")
Python Code for Pair Classification
import numpy as np

x = work[x_var].to_numpy()
y = work[y_var].to_numpy()

C = D = Tx = Ty = Tboth = 0

for i in range(len(x)):
    for j in range(i + 1, len(x)):
        dx = np.sign(x[j] - x[i])
        dy = np.sign(y[j] - y[i])

        if dx == 0 and dy == 0:
            Tboth += 1
        elif dx == 0:
            Tx += 1
        elif dy == 0:
            Ty += 1
        elif dx == dy:
            C += 1
        else:
            D += 1

tau_b_manual = (C - D) / np.sqrt((C + D + Tx) * (C + D + Ty))

print("Concordant:", C)
print("Discordant:", D)
print("X ties only:", Tx)
print("Y ties only:", Ty)
print("Ties on both:", Tboth)
print("Manual tau-b:", tau_b_manual)
R Code for Kendall's Tau
df <- read.csv("dataset.csv", stringsAsFactors = FALSE)

x_var <- "G1"
y_var <- "G3"

work <- na.omit(df[, c(x_var, y_var)])

test <- cor.test(
  work[[x_var]],
  work[[y_var]],
  method = "kendall",
  exact = FALSE
)

print(test)

cat("Complete pairs:", nrow(work), "\n")
cat("Kendall tau-b:", unname(test$estimate), "\n")
cat("p-value:", test$p.value, "\n")
SPSS Syntax for Kendall's Tau
* Kendall's Tau in SPSS.
OUTPUT CLOSE ALL.
OUTPUT NEW NAME=Kendalls_Tau_Output.

DESCRIPTIVES VARIABLES=G1 G3
  /STATISTICS=MEAN STDDEV MIN MAX.

NONPAR CORR
  /VARIABLES=G1 G3
  /PRINT=KENDALL TWOTAIL
  /MISSING=PAIRWISE.

NONPAR CORR
  /VARIABLES=age Medu Fedu traveltime studytime failures famrel freetime goout Dalc Walc health absences G1 G2 G3
  /PRINT=KENDALL TWOTAIL
  /MISSING=PAIRWISE.

OUTPUT EXPORT
  /CONTENTS EXPORT=VISIBLE
  /PDF DOCUMENTFILE='Kendalls-Tau-SPSS-Output.pdf'.
Excel Formula Patterns for Kendall's Tau
For each observation pair i < j:

Difference in X:
=X_j-X_i

Difference in Y:
=Y_j-Y_i

Sign of X difference:
=SIGN(X_j-X_i)

Sign of Y difference:
=SIGN(Y_j-Y_i)

Pair class:
=IF(AND(sign_dx=0,sign_dy=0),"Both tied",
 IF(sign_dx=0,"Tie X only",
 IF(sign_dy=0,"Tie Y only",
 IF(sign_dx=sign_dy,"Concordant","Discordant"))))

Concordant count:
=COUNTIF(pair_class_range,"Concordant")

Discordant count:
=COUNTIF(pair_class_range,"Discordant")

X ties only:
=COUNTIF(pair_class_range,"Tie X only")

Y ties only:
=COUNTIF(pair_class_range,"Tie Y only")

Kendall tau-b:
=(C-D)/SQRT((C+D+Tx)*(C+D+Ty))
How to Report Kendall's Tau
A good Kendall's Tau report should name the variables, sample size, tau-b value, p-value, direction, practical strength and tie handling.
APA-style report: Kendall's tau-b was calculated to examine the monotonic association between G1 and G3. The analysis included 649 complete pairs. There was a strong positive monotonic association between G1 and G3, τb = .766, p < .001. The null hypothesis of no monotonic association was rejected. Because many tied grade values were present, Kendall's tau-b was reported.
Expanded report: The G1 and G3 pair produced 210,276 total observation pairs, including 158,466 concordant pairs and 13,791 discordant pairs. The large excess of concordant over discordant pairs produced a strong positive Kendall's tau-b coefficient of .766.
Common Mistakes in Kendall's Tau Interpretation
| Mistake | Why It Is a Problem | Better Practice |
|---|---|---|
| Calling Kendall's Tau a linear correlation | Kendall's Tau measures ordered monotonic association, not linear slope. | Use monotonic association wording. |
| Ignoring ties | Grade and ordinal data often contain tied values. | Report Kendall's tau-b when ties are present. |
| Reporting only p-value | p-value does not show strength. | Report tau-b value and practical interpretation. |
| Using Pearson correlation for ordinal data | Ordinal spacing may not be equal. | Use Kendall's Tau or Spearman correlation for ranked/ordinal data. |
| Ignoring monotonicity | Tau is not meant to detect every complex pattern. | Check rank scatterplots and distribution charts. |
| Assuming causation | Correlation does not prove cause and effect. | Use association wording unless research design supports causality. |
Downloads and Resources
Download R Report PDFR validation report with colorful Kendall's Tau charts.
Download SPSS Output PDFSPSS nonparametric correlation output for Kendall's tau-b.
Download Excel Worked FileFormula-based Kendall's Tau workbook with dashboard, pair demo and matrix.
Open Python Rank ScatterplotRank-based view of G1 and G3 monotonic association.
Open R Top Tau PairsColorful chart ranking strongest Kendall relationships.
External References
For software documentation, see SciPy documentation for kendalltau, R documentation for cor.test, IBM SPSS documentation for nonparametric correlations and Microsoft Excel documentation for ranking and COUNT formulas.
FAQs About Kendall's Tau
What is Kendall's Tau?
Kendall's Tau is a nonparametric rank correlation coefficient. It measures monotonic association by comparing concordant and discordant observation pairs.
What was the Kendall's Tau result in this guide?
The main result was Kendall's tau-b = 0.766198 for G1 and G3, with N = 649 and p < .001. This is a strong positive monotonic association.
What is the difference between tau-a and tau-b?
Tau-a does not correct for ties. Tau-b corrects for ties in the two variables. Because grade data contain many repeated values, tau-b is the correct version here.
Is Kendall's Tau the same as Spearman correlation?
No. Both are rank-based, but Kendall's Tau is based on concordant and discordant pair counts, while Spearman correlation is Pearson correlation applied to ranks.
Can SPSS calculate Kendall's Tau?
Yes. In SPSS, use Nonparametric Correlations and select Kendall's tau-b. The SPSS output reports the coefficient, two-tailed significance and N.
Can Excel calculate Kendall's Tau?
Yes, but it requires manual pair classification formulas or a prepared workbook. The downloadable Excel file in this guide shows the full calculation.

