
Python-only correlation analysis with pandas, scipy, heatmaps and report interpretation
Correlation in Python: Pearson Correlation, Matrix, Heatmap and p-value Guide
Correlation in Python helps you measure how numeric variables move together. This guide is written only for the Python workflow. It explains Pearson correlation, Spearman comparison, p-value heatmaps, strongest variable pairs, pairwise sample size checks, target variable correlations and the final Python report interpretation using the student performance dataset.
Quick Answer: Correlation in Python Result
The Python correlation analysis used 16 numeric variables and focused on G3 final grade as the target variable. Pearson, Spearman and Kendall correlations were calculated to compare linear, rank-based and ordinal association patterns. The main Pearson matrix shows that the strongest linear relationship is between G2 and G3, with r = 0.919. This means students with higher second-period grades usually also have higher final grades.
The next strongest Pearson relationships are G1 vs G2 with r = 0.865 and G1 vs G3 with r = 0.826. The strongest negative relationship involving G3 is failures vs G3, with approximately r = -0.393. Therefore, prior failures are associated with lower final grades, while earlier grade scores are strongly associated with final grade performance.
Final interpretation: The Python results show that final grade G3 is strongly related to previous grades G1 and G2. The G2-G3 relationship is very strong and statistically significant, while failures show a meaningful negative relationship with G3. This is a strong example of how Python can identify the variables most closely connected to a target outcome.
Python-only note: This article is not a SPSS, R or Excel tutorial. Every workflow section below is written for Python users who want to calculate, visualize and report correlation results using pandas, scipy and Python charting.
Table of Contents
- What Is Correlation in Python?
- Pearson, Spearman and Kendall Correlation in Python
- Pearson Correlation Formula
- Dataset and Variables Used
- Verified Python Correlation Results
- Python Chart-by-Chart Interpretation
- Python Workflow for Correlation Analysis
- Complete Python Code Blocks
- How to Report Correlation in Python
- Common Mistakes
- Downloads and Resources
- Related Statistical Guides
- FAQs About Correlation in Python
What Is Correlation in Python?
Correlation in Python means using Python libraries to measure the direction and strength of association between variables. The result is usually a coefficient between -1 and +1. A positive value means the variables tend to increase together. A negative value means one variable tends to increase while the other decreases. A value near zero means there is little linear relationship.
Python is useful for correlation analysis because it can calculate a full correlation matrix, calculate p-values for each pair, sort the strongest relationships, compare Pearson and Spearman methods, and automatically create publication-ready heatmaps. In this report, Python found a very strong positive Pearson correlation between G2 and G3. That result is easy to see in the heatmap, strongest-pairs chart and scatterplot.
Correlation should be interpreted with descriptive statistics, p-values, effect size, confidence interval thinking and visual checks. A large correlation can reveal a strong relationship, but it does not automatically prove causation.
Pearson, Spearman and Kendall Correlation in Python
Python can calculate several types of correlation. The best method depends on the type of relationship, scale and assumptions. In the current Python report, all three methods were included so that the linear pattern and rank-based pattern could be compared.
| Correlation Method | Python Function | Best Use | Interpretation |
|---|---|---|---|
| Pearson correlation | df.corr(method="pearson") or stats.pearsonr() | Two numeric variables with a roughly linear relationship. | Measures linear association. This is the main method used in the heatmap and p-value matrix. |
| Spearman correlation | df.corr(method="spearman") or stats.spearmanr() | Ranked, ordinal or monotonic relationships. | Measures whether variables move together in rank order, even if the pattern is not perfectly linear. |
| Kendall correlation | df.corr(method="kendall") or stats.kendalltau() | Ordinal concordance and small-sample rank association. | Measures agreement in pair ordering. It is often more conservative than Spearman. |
Practical rule: Use Pearson when you want the standard linear correlation coefficient. Use Spearman when ranks or monotonic patterns matter. Use Kendall when ordinal concordance is the focus.
Pearson Correlation Formula
The Pearson correlation coefficient compares how two variables vary together relative to how much each variable varies on its own. In Python, the coefficient can be calculated directly using pandas or scipy, but the formula helps explain what the result means.
If r is close to +1, the variables have a strong positive linear relationship. If r is close to -1, they have a strong negative linear relationship. If r is close to 0, the linear relationship is weak.
The p-value for a Pearson correlation tests the null hypothesis that the population correlation is zero. In the G2-G3 result, the p-value is extremely small, so the relationship is statistically significant. However, the coefficient itself tells the strength and direction, while the p-value tells whether the relationship is unlikely to be zero in the population.
Dataset and Variables Used in Python
The Python analysis used a student performance dataset with 649 complete observations across the numeric variables. The target variable was G3, which represents the final grade. Earlier grades G1 and G2 were also included, along with study habits, family education variables, absences, failures and lifestyle variables.
| Variable Group | Variables | Purpose in Correlation Analysis |
|---|---|---|
| Grade variables | G1, G2, G3 | Measure how previous grades relate to final grade performance. |
| Academic background | studytime, failures, absences | Show whether study time, prior failures and absence counts relate to grades. |
| Family education | Medu, Fedu | Compare mother’s and father’s education with student performance and with each other. |
| Student context | age, traveltime, famrel, freetime, goout, health | Check weaker background and lifestyle associations. |
| Alcohol variables | Dalc, Walc | Compare weekday and weekend alcohol use and their association with grade variables. |
The pairwise sample size matrix shows 649 valid paired observations for every displayed variable pair. This is important because correlation matrices can be misleading when different cells are based on different sample sizes. Here, the Python result is easier to compare because every pair uses the same N.
Verified Python Correlation Results
The strongest Pearson correlation is G2 vs G3, with r = 0.919. This is a very strong positive linear relationship. Students who scored high in G2 also tended to score high in G3. The next strongest Pearson relationships are G1 vs G2 with r = 0.865 and G1 vs G3 with r = 0.826. These three grade variables form the main high-correlation cluster in the matrix.
| Rank | Variable Pair | Pearson r | Direction | Interpretation |
|---|---|---|---|---|
| 1 | G2 vs G3 | 0.919 | Positive | Very strong relationship between second-period grade and final grade. |
| 2 | G1 vs G2 | 0.865 | Positive | Strong continuity between earlier grade measurements. |
| 3 | G1 vs G3 | 0.826 | Positive | Strong relationship between first-period grade and final grade. |
| 4 | Medu vs Fedu | 0.647 | Positive | Moderate family-education relationship. |
| 5 | Dalc vs Walc | 0.617 | Positive | Moderate relationship between weekday and weekend alcohol-use variables. |
| 6 | failures vs G3 | -0.393 | Negative | Students with more prior failures tend to have lower final grades. |
For the target variable G3, the strongest positive Pearson correlations are with G2, G1, studytime, Medu and Fedu. The strongest negative Pearson relationships with G3 are failures, Dalc, Walc, traveltime and freetime. This means previous academic performance is the clearest positive signal, while failures are the clearest negative signal.
Python Chart-by-Chart Interpretation
The Python charts turn the correlation output into a visual report. The heatmap gives the full matrix, the p-value heatmap adds statistical significance, the strongest-pairs chart ranks the most important relationships, and the scatterplot confirms the shape of the strongest pair.
Python Chart 1: Pearson Correlation Matrix Heatmap
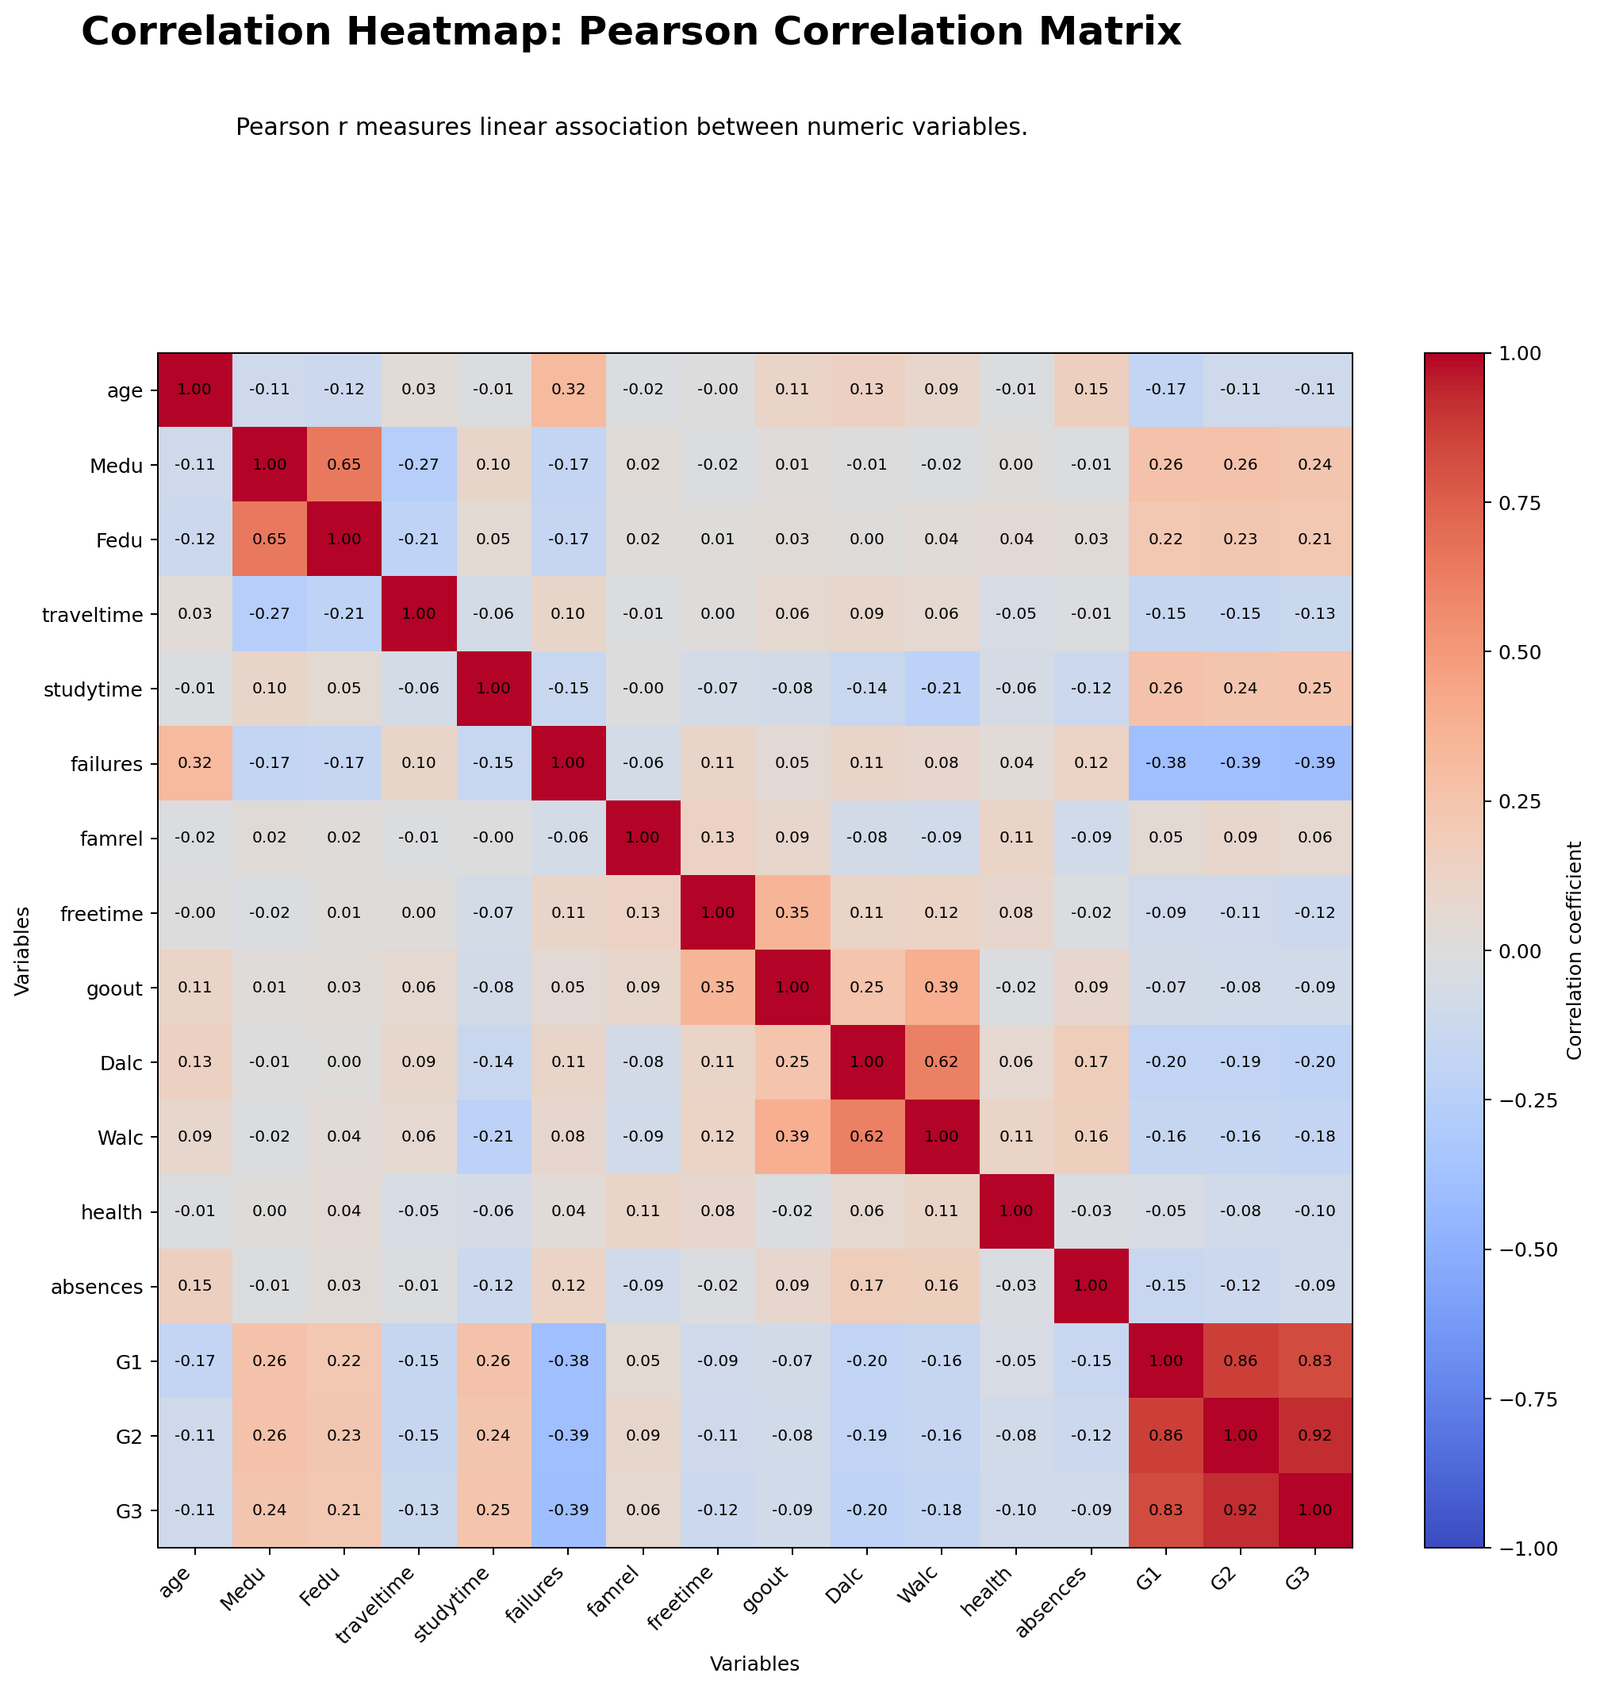
The Pearson heatmap shows the complete linear correlation matrix. The darkest positive area appears around G1, G2 and G3, confirming that grade variables are strongly connected. The cell for G2 and G3 is approximately 0.92, making it the strongest Pearson relationship in the matrix. The cells for G1-G2 and G1-G3 are also strongly positive.
The heatmap also shows moderate relationships outside the grade cluster. Mother’s education and father’s education have a positive relationship, and weekday alcohol use is positively related to weekend alcohol use. Negative cells around failures and grade variables show that more failures are associated with lower grades. This chart is the best first view because it summarizes the full correlation structure in one place.
Python Chart 2: Pearson p-value Heatmap
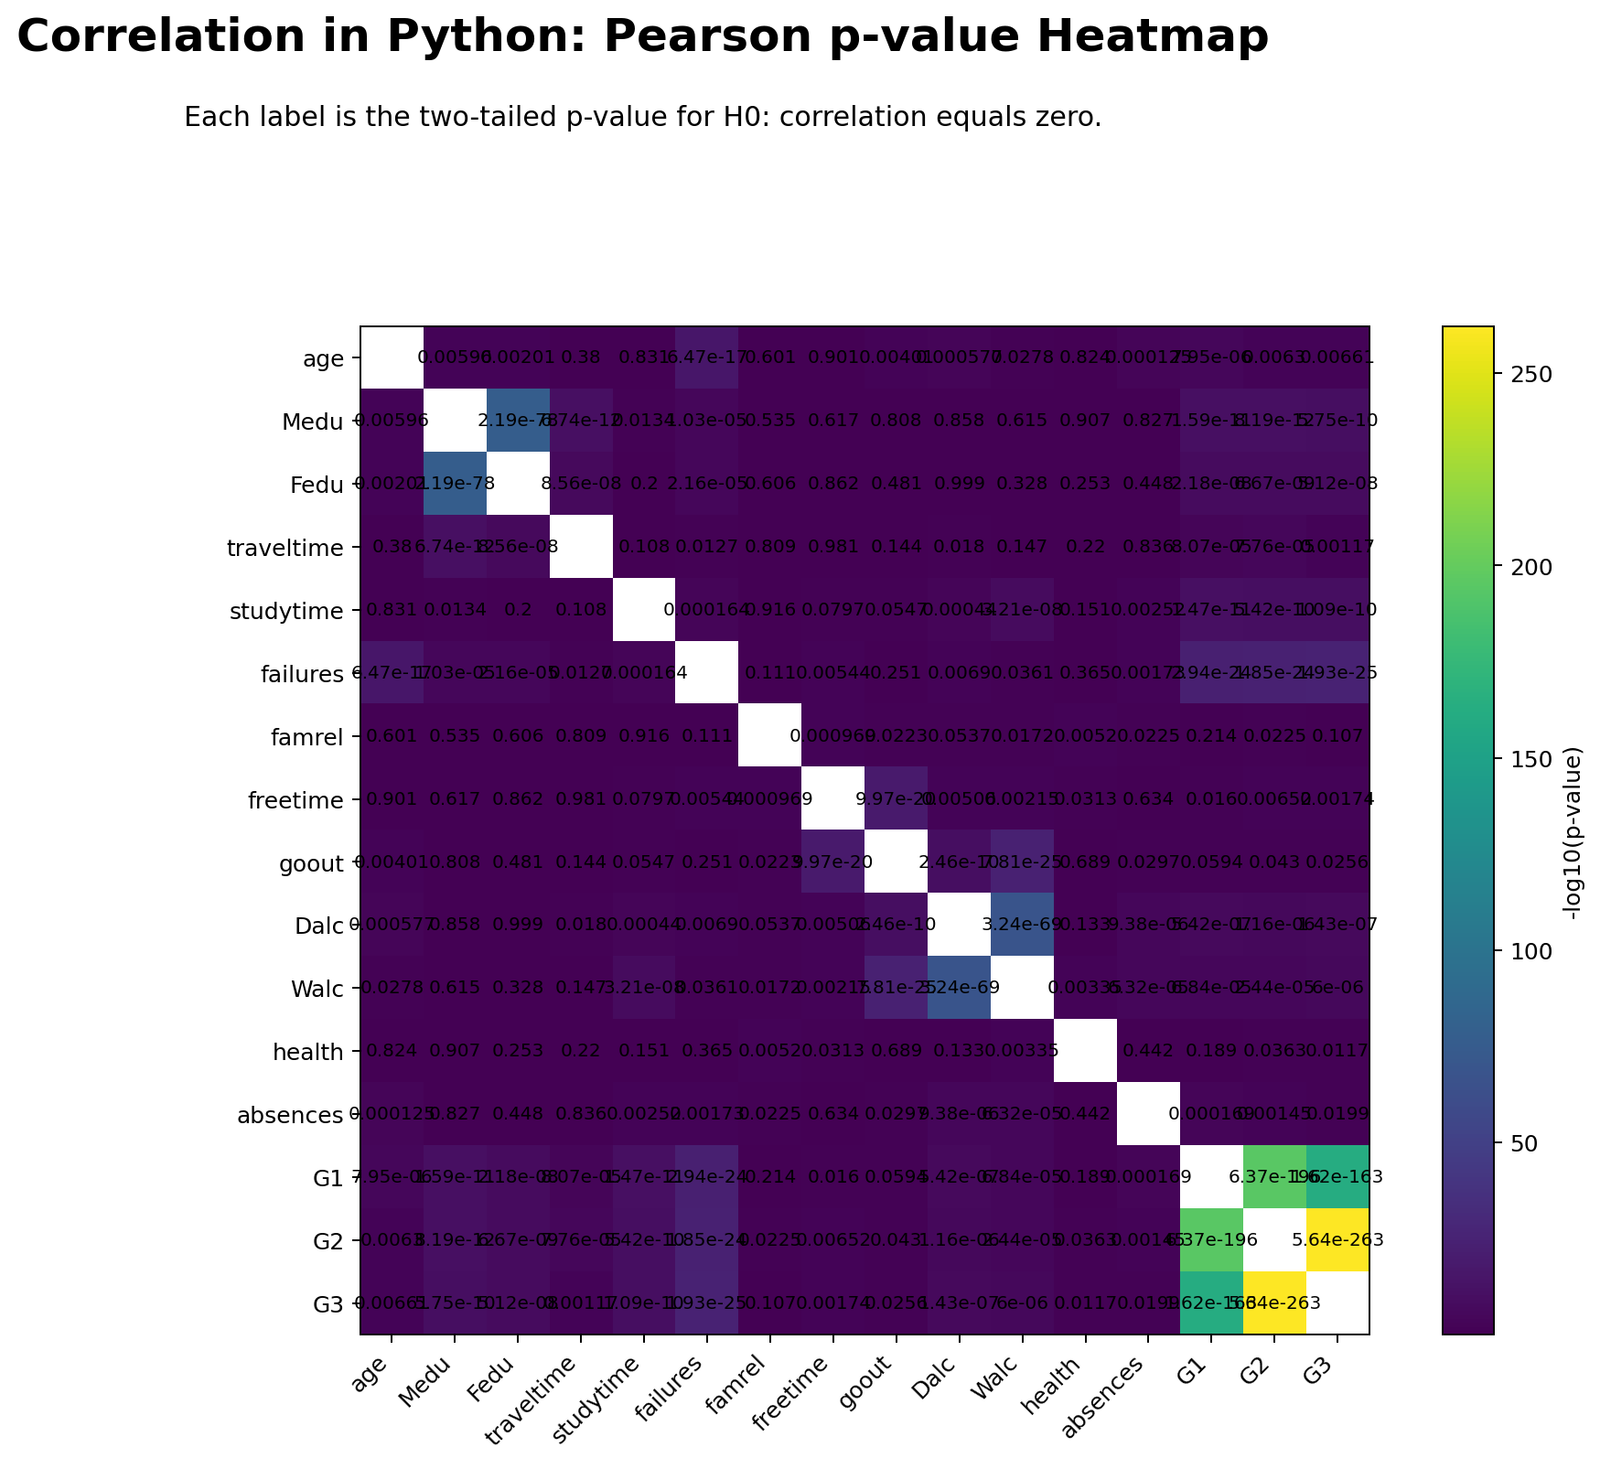
The p-value heatmap answers a different question from the correlation heatmap. The correlation heatmap shows strength and direction, while the p-value heatmap tests whether the population correlation could reasonably be zero. Very small p-values appear for the major grade relationships, especially G2-G3, G1-G2 and G1-G3.
This chart helps separate statistical significance from practical strength. In a sample of 649 students, even smaller correlations can become statistically significant. Therefore, the best interpretation should report both the coefficient and the p-value. A p-value alone is not enough; the value of r tells whether the relationship is weak, moderate or strong.
Python Chart 3: Strongest Pearson Variable Pairs
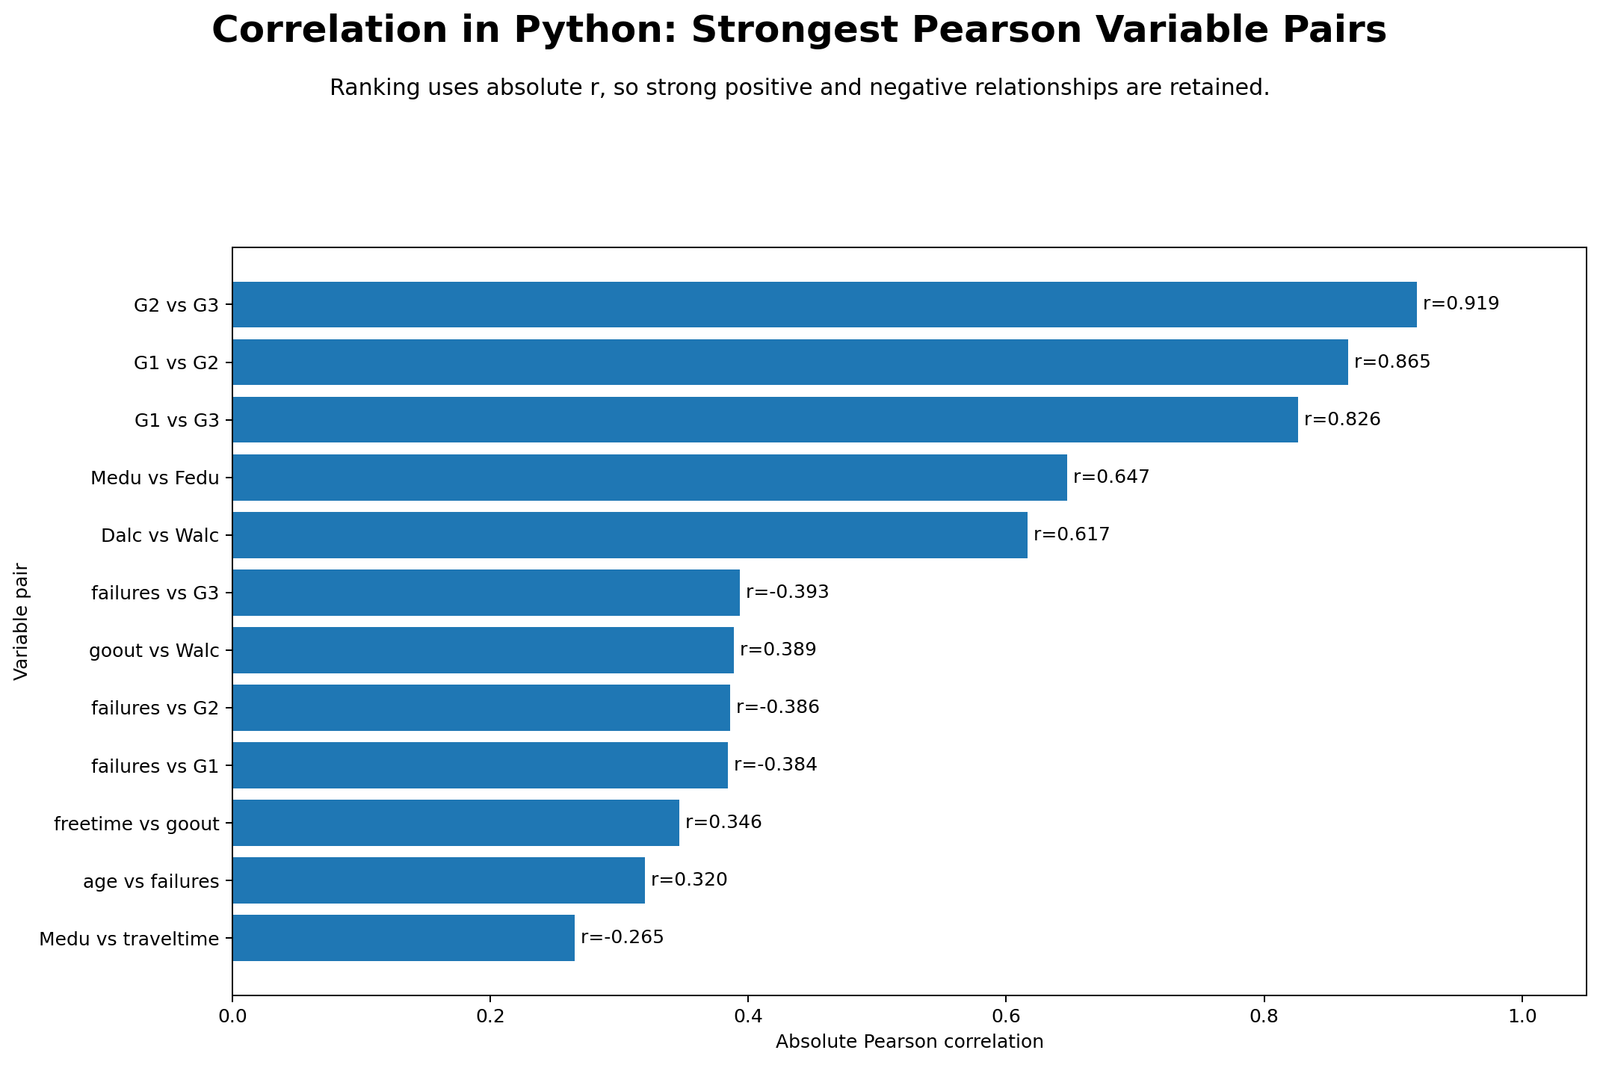
The strongest-pairs chart ranks variable pairs by absolute Pearson correlation. The largest bar is G2 vs G3, with r = 0.919. The second and third bars are G1 vs G2 and G1 vs G3, confirming that grade variables dominate the correlation structure. Because these are positive relationships, higher earlier grades are associated with higher later grades.
The chart also keeps important negative relationships. The pair failures vs G3 appears with a negative coefficient near -0.393. This means failures are not just statistically significant; they are also one of the more meaningful relationships in the dataset. The chart is especially useful when a full heatmap is too dense and the reader only wants the strongest relationships.
Python Chart 4: Pearson Correlations with G3
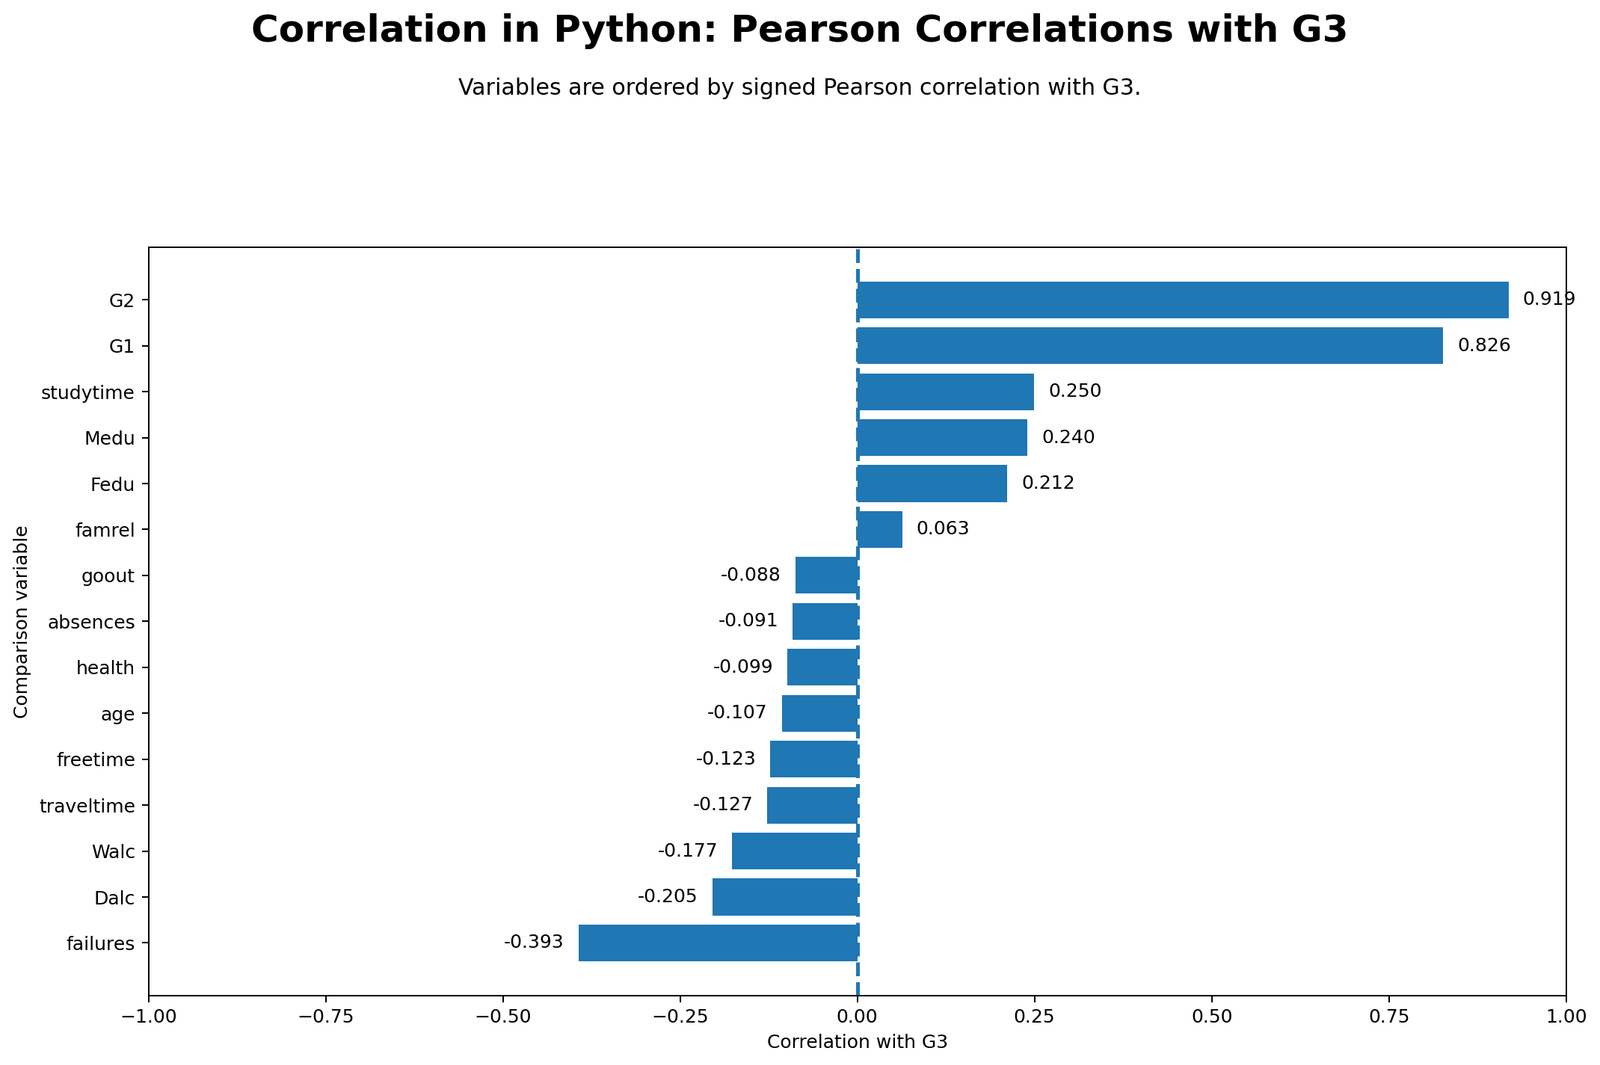
This chart focuses only on correlations with G3. The two largest positive bars are G2 at about 0.919 and G1 at about 0.826. Studytime, mother’s education and father’s education are also positive, but their relationships are much smaller. This shows that previous grade performance is far more strongly linked to final grade than most background variables.
The negative side of the chart shows that failures has the strongest negative relationship with G3. Alcohol-use variables, travel time, free time, age, health and absences are also negative, but weaker. This target-variable view is the most useful chart for a prediction-oriented reader because it directly answers which variables are most related to final grade.
Python Chart 5: Pearson vs Spearman Comparison
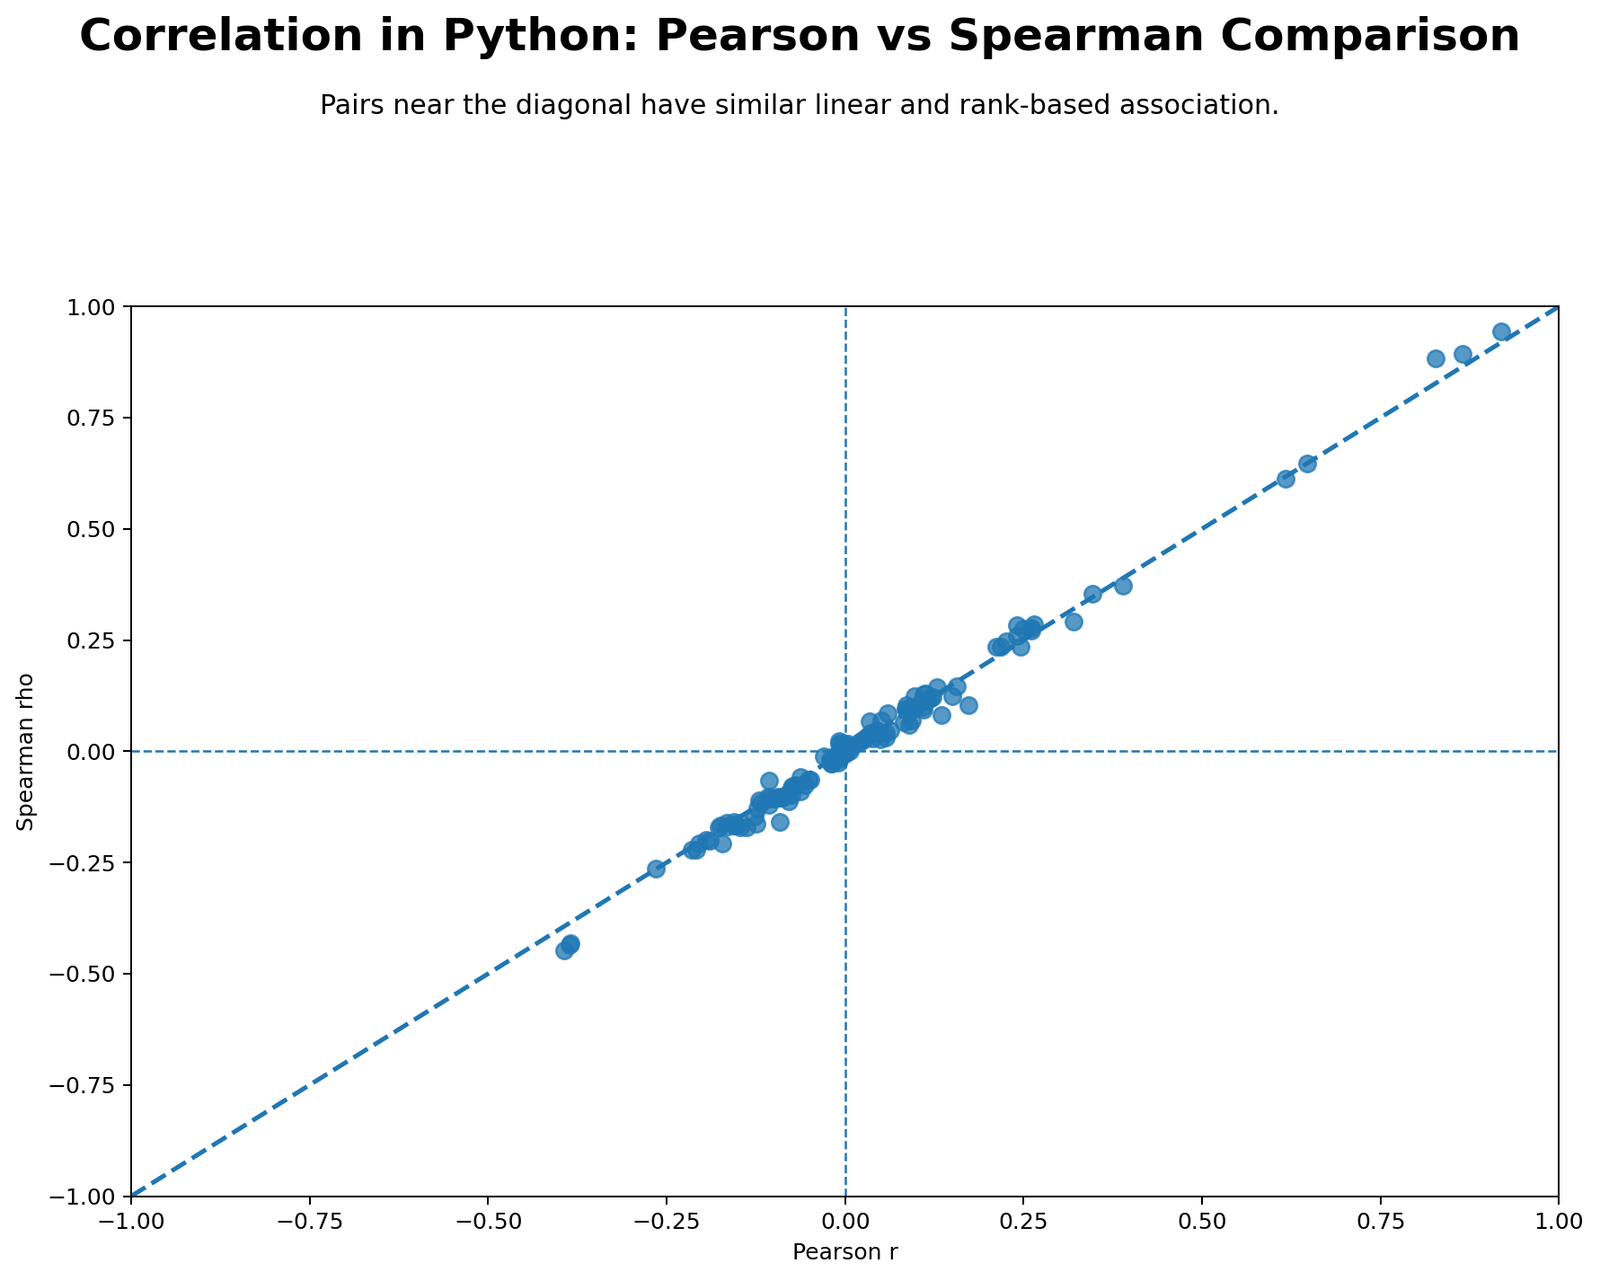
The Pearson versus Spearman comparison places each variable pair on a scatterplot. Points near the diagonal line mean Pearson and Spearman give similar conclusions. In this report, most points fall near the diagonal, which means the linear and rank-based association patterns are broadly consistent.
This chart is useful because it checks whether the Pearson results are being distorted by unusual nonlinear ranking patterns. When the points follow the diagonal, the Pearson matrix can be interpreted with more confidence. If many points were far from the line, Spearman results would deserve more attention.
Python Chart 6: Pairwise Sample Size Matrix
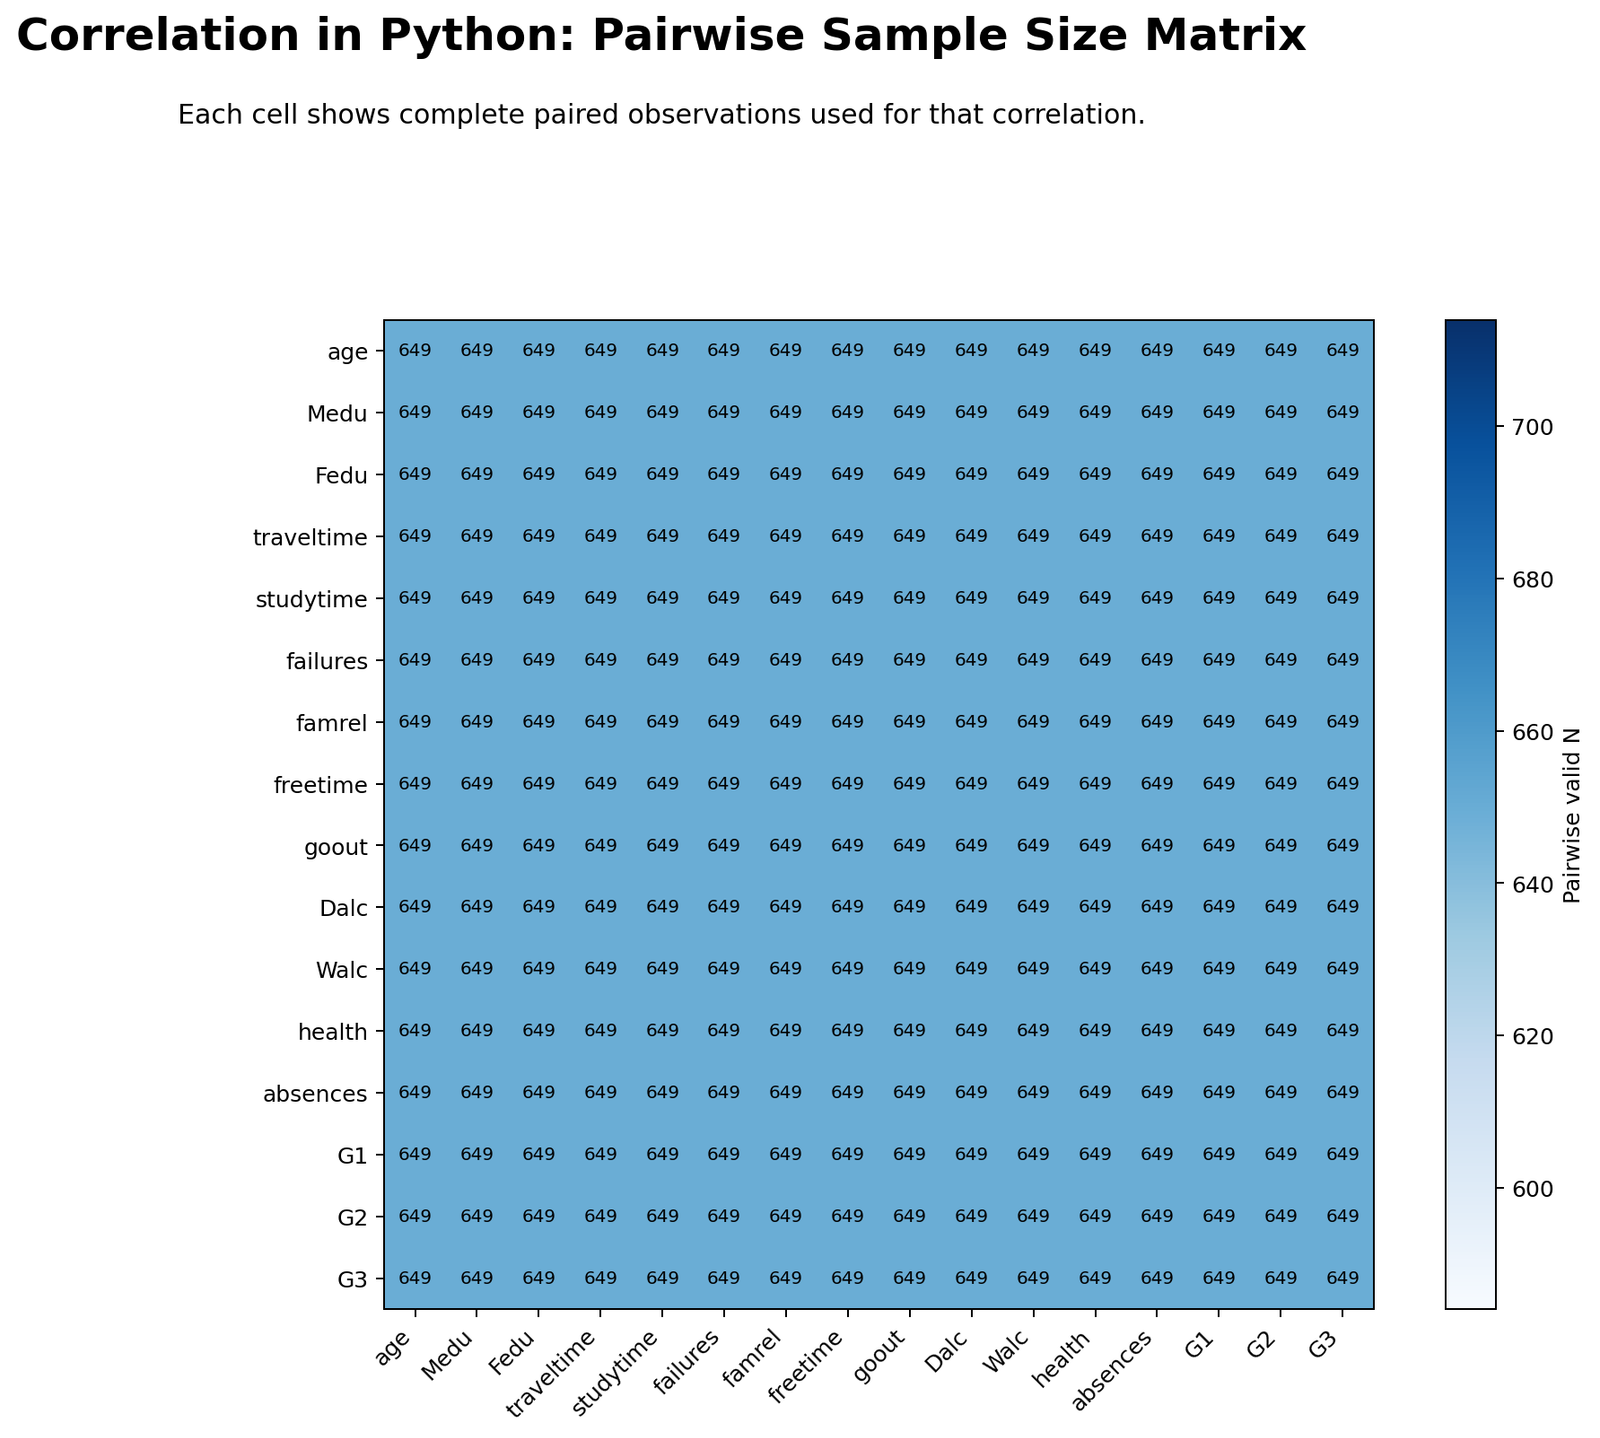
The pairwise sample size matrix shows 649 valid observations for every displayed pair. This is an excellent result because all correlations are based on the same number of observations. When a dataset has missing values, different cells in a correlation matrix may use different sample sizes, which can make comparisons less stable.
Because every cell uses the same N here, the strongest-pairs ranking is easier to trust. The chart also confirms that the correlation results are not being driven by one pair having many more observations than another pair.
Python Chart 7: Strongest Pair Scatterplot
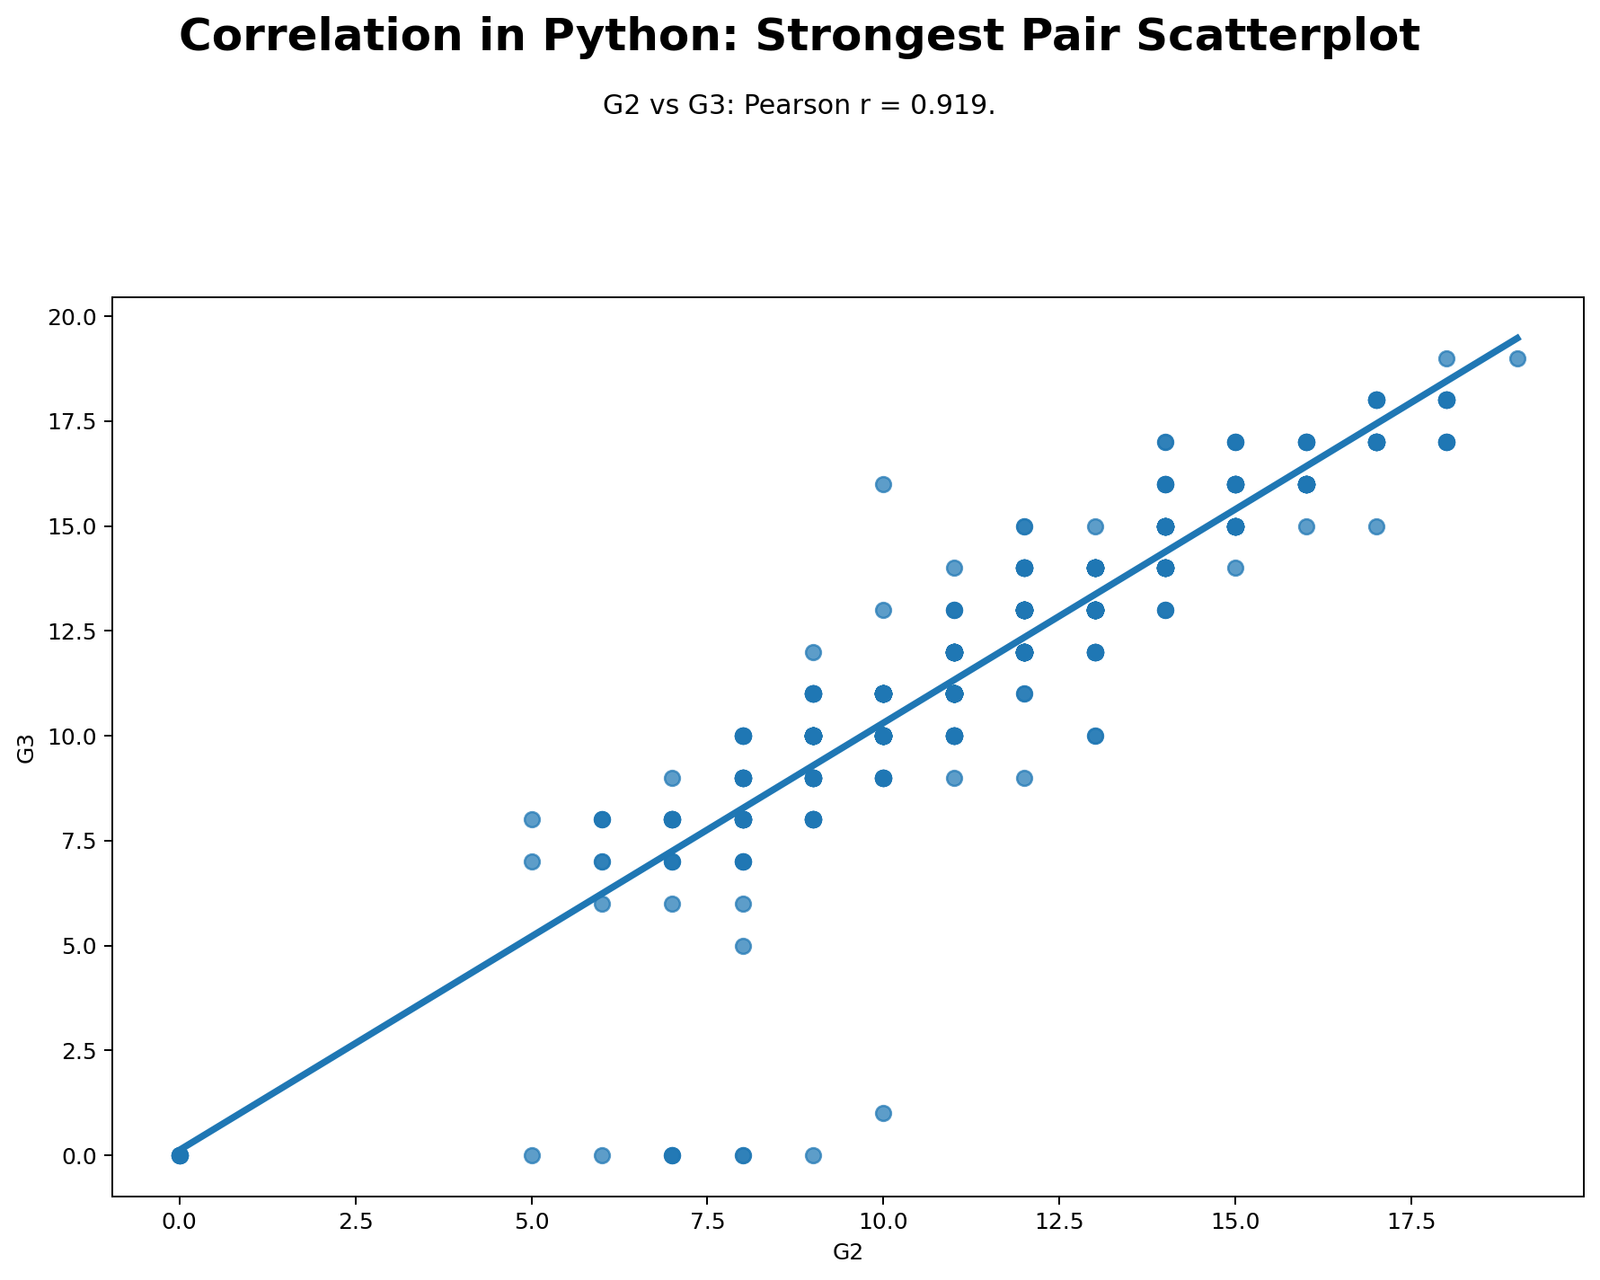
The scatterplot confirms the strongest Pearson result visually. The points rise from left to right, and the fitted line is strongly positive. The relationship is not perfect because some students with similar G2 values have different G3 outcomes, but the overall trend is very clear. This is why the Pearson coefficient is close to 0.919.
This scatterplot is important because correlation should not be interpreted from a number alone. A scatterplot shows whether the relationship is roughly linear, whether outliers exist, and whether the coefficient is visually believable. Here, the pattern supports the conclusion that G2 and G3 have a very strong positive linear relationship.
Python Workflow for Correlation Analysis
A good Python correlation workflow should not stop at df.corr(). The complete workflow should clean the numeric variables, calculate Pearson/Spearman/Kendall matrices, calculate p-values, check pairwise sample sizes, rank the strongest pairs, focus on a target variable and create charts.
| Step | Python Task | Purpose |
|---|---|---|
| 1 | Load the dataset with pandas | Bring the CSV file into Python. |
| 2 | Select numeric variables | Correlation coefficients require numeric data. |
| 3 | Calculate descriptive statistics | Check sample size, mean, standard deviation, skewness and missing values. |
| 4 | Calculate Pearson correlation matrix | Measure linear association between all numeric variables. |
| 5 | Calculate p-value matrix | Test whether each Pearson correlation differs from zero. |
| 6 | Rank strongest pairs | Find the most important positive and negative relationships. |
| 7 | Focus on target variable G3 | Identify variables most related to final grade. |
| 8 | Create heatmaps and scatterplots | Make the results easier to interpret and publish. |
Complete Python Code Blocks for Correlation in Python
1. Install and Import Python Libraries
import os
import itertools
import numpy as np
import pandas as pd
import matplotlib.pyplot as plt
from scipy import stats
2. Load Dataset and Select Numeric Variables
DATA_PATH = "dataset.csv"

df = pd.read_csv(DATA_PATH)

numeric_df = df.select_dtypes(include=[np.number]).copy()

print("Number of rows:", len(df))
print("Number of numeric variables:", numeric_df.shape[1])
print(numeric_df.columns.tolist())
3. Calculate Pearson, Spearman and Kendall Matrices
pearson_corr = numeric_df.corr(method="pearson")
spearman_corr = numeric_df.corr(method="spearman")
kendall_corr = numeric_df.corr(method="kendall")

pearson_corr.to_csv("pearson_correlation_matrix.csv")
spearman_corr.to_csv("spearman_correlation_matrix.csv")
kendall_corr.to_csv("kendall_correlation_matrix.csv")

print(pearson_corr.round(3))
4. Calculate Pearson p-value Matrix
def pearson_pvalue_matrix(data):
    cols = data.columns
    pvals = pd.DataFrame(np.nan, index=cols, columns=cols)

    for col1 in cols:
        for col2 in cols:
            pair = data[[col1, col2]].dropna()
            if len(pair) >= 3:
                r, p = stats.pearsonr(pair[col1], pair[col2])
                pvals.loc[col1, col2] = p

    return pvals

pearson_pvals = pearson_pvalue_matrix(numeric_df)
pearson_pvals.to_csv("pearson_p_value_matrix.csv")

print(pearson_pvals.round(5))
5. Rank the Strongest Pearson Variable Pairs
def strongest_pairs(corr_matrix):
    rows = []
    cols = corr_matrix.columns

    for i, j in itertools.combinations(cols, 2):
        r = corr_matrix.loc[i, j]
        rows.append({
            "variable_1": i,
            "variable_2": j,
            "correlation": r,
            "absolute_correlation": abs(r),
            "direction": "Positive" if r > 0 else "Negative" if r < 0 else "Zero"
        })

    return pd.DataFrame(rows).sort_values("absolute_correlation", ascending=False)

strongest = strongest_pairs(pearson_corr)
strongest.to_csv("strongest_pearson_pairs.csv", index=False)

print(strongest.head(12))
6. Find Correlations with Target Variable G3
TARGET = "G3"

target_corr = (
    pearson_corr[TARGET]
    .drop(labels=[TARGET])
    .sort_values(ascending=False)
    .reset_index()
)

target_corr.columns = ["comparison_variable", "pearson_correlation"]
target_corr["absolute_correlation"] = target_corr["pearson_correlation"].abs()

target_corr.to_csv("target_variable_correlations.csv", index=False)

print(target_corr)
7. Create Pearson Heatmap in Python
fig, ax = plt.subplots(figsize=(12, 10))

im = ax.imshow(pearson_corr, vmin=-1, vmax=1, cmap="coolwarm")

ax.set_xticks(range(len(pearson_corr.columns)))
ax.set_yticks(range(len(pearson_corr.columns)))
ax.set_xticklabels(pearson_corr.columns, rotation=45, ha="right")
ax.set_yticklabels(pearson_corr.columns)

for i in range(len(pearson_corr.columns)):
    for j in range(len(pearson_corr.columns)):
        ax.text(j, i, f"{pearson_corr.iloc[i, j]:.2f}",
                ha="center", va="center", fontsize=8)

ax.set_title("Correlation Heatmap: Pearson Correlation Matrix", fontsize=18, fontweight="bold")
fig.colorbar(im, ax=ax, label="Correlation coefficient")
fig.tight_layout()
fig.savefig("chart_01_pearson_correlation_heatmap.png", dpi=160)
plt.close(fig)
8. Create Scatterplot for the Strongest Pair
top_pair = strongest.iloc[0]
x_var = top_pair["variable_1"]
y_var = top_pair["variable_2"]
r_value = top_pair["correlation"]

plot_df = numeric_df[[x_var, y_var]].dropna()

slope, intercept, r, p, se = stats.linregress(plot_df[x_var], plot_df[y_var])

fig, ax = plt.subplots(figsize=(10, 7))
ax.scatter(plot_df[x_var], plot_df[y_var], alpha=0.75)

x_line = np.linspace(plot_df[x_var].min(), plot_df[x_var].max(), 100)
y_line = intercept + slope * x_line
ax.plot(x_line, y_line, linewidth=3)

ax.set_title(f"Strongest Pair Scatterplot: {x_var} vs {y_var}", fontsize=18, fontweight="bold")
ax.text(0.5, 1.02, f"Pearson r = {r_value:.3f}", transform=ax.transAxes, ha="center")
ax.set_xlabel(x_var)
ax.set_ylabel(y_var)
fig.tight_layout()
fig.savefig("chart_07_top_pair_scatterplot.png", dpi=160)
plt.close(fig)
How to Report Correlation in Python
When reporting correlation results from Python, include the method, variables, sample size, coefficient, p-value and interpretation. The coefficient should be rounded clearly, and the practical strength should be described in words.
APA-style report: A Pearson correlation was calculated in Python to examine the relationship between G2 and G3. The result showed a very strong positive correlation, r = .919, N = 649, p < .001. Students with higher G2 scores tended to have higher G3 final grades.
Target-variable report: Pearson correlations with G3 showed that G2 had the strongest positive relationship with final grade, followed by G1. Failures had the strongest negative relationship with G3, indicating that students with more previous failures tended to score lower on the final grade.
A complete report should also mention that correlation does not prove causation. For example, the strong G2-G3 correlation shows association between grade periods, but it does not by itself prove that G2 causes G3. For predictive modeling, this relationship may also raise multicollinearity concerns if G1 and G2 are used together as predictors. In regression work, you may also check variance inflation factor.
Common Mistakes in Correlation in Python
| Mistake | Why It Is a Problem | Better Python Practice |
|---|---|---|
| Using correlation on non-numeric variables without coding | Pearson correlation requires numeric variables. | Use select_dtypes() for numeric variables or encode categories properly. |
| Reporting only the heatmap | A heatmap does not show p-values, sample sizes or scatterplot shape. | Include a p-value matrix, pairwise N matrix and scatterplot for important pairs. |
| Ignoring missing values | Different correlations may be based on different N values. | Create a pairwise sample size matrix before comparing coefficients. |
| Assuming correlation means causation | Correlation only measures association. | Use cautious wording such as “is associated with” or “is related to.” |
| Confusing Pearson and Spearman | Pearson measures linear association; Spearman measures rank-based association. | Compare both methods when monotonic but nonlinear relationships are possible. |
| Ignoring outliers | A few unusual points can change Pearson correlation. | Use scatterplots and outlier checks before final reporting. |
Downloads and Resources for Correlation in Python
Use the following Python output files and charts for review, reporting and WordPress media placement.
Open Pearson HeatmapFull Pearson correlation matrix chart created in Python.
Open p-value HeatmapPython p-value matrix for Pearson correlations.
Open Strongest Pair ScatterplotPython scatterplot for G2 vs G3.
External Python Documentation
For function details, see the official pandas documentation for DataFrame.corr(), the scipy documentation for scipy.stats.pearsonr(), and the NumPy documentation for numpy.corrcoef().
FAQs About Correlation in Python
How do I calculate correlation in Python?
Use df.corr() for a full correlation matrix. For a single Pearson correlation with p-value, use scipy.stats.pearsonr(x, y). For Spearman correlation, use scipy.stats.spearmanr(x, y).
How do I create a correlation matrix in Python?
Select the numeric columns with df.select_dtypes(include=[np.number]), then run numeric_df.corr(method="pearson"). You can export the matrix to CSV or plot it as a heatmap.
What is the strongest correlation in this Python report?
The strongest Pearson correlation is between G2 and G3, with r = 0.919. This is a very strong positive relationship between second-period grade and final grade.
What does a negative correlation mean in Python?
A negative correlation means that as one variable increases, the other tends to decrease. In this report, failures have a negative relationship with G3, meaning students with more previous failures tend to have lower final grades.
Should I use Pearson or Spearman correlation in Python?
Use Pearson when the relationship is numeric and roughly linear. Use Spearman when variables are ordinal, ranked or monotonic but not necessarily linear. In this report, Pearson and Spearman patterns are broadly similar.
Does correlation prove causation?
No. Correlation measures association, not causation. A strong G2-G3 relationship shows that the variables move together, but it does not prove that one variable directly causes the other.

