
Tie-corrected rank correlation, ordinal association and monotonic relationship testing
Kendall’s Tau-b: Formula, Interpretation, Python, R, SPSS and Excel Guide
Kendall’s Tau-b is a nonparametric rank correlation coefficient that measures monotonic association while correcting for tied ranks. It is especially useful for ordinal variables, grade data, Likert-type responses, non-normal data and datasets where repeated values are common. This guide explains the tau-b formula, concordant pairs, discordant pairs, tie correction, Python charts, R charts, SPSS output, Excel formulas and APA reporting.
Quick Answer: Kendall’s Tau-b Result
The worked and strongest pair in this analysis is G2 vs G3. G2 is the second-period grade and G3 is the final grade. Kendall’s tau-b was selected because the grade variables have repeated values, meaning ties are common.
The result is Kendall’s tau-b = 0.869595, with N = 649 valid paired observations and p = 2.113285e-199. This is a very strong positive monotonic association. The null hypothesis of no monotonic association is rejected.
Final interpretation: Students with higher G2 ranks tend to have higher G3 ranks. The relationship is very strong, positive and statistically significant. Because repeated grade values create tied ranks, Kendall’s tau-b is the correct coefficient to report.
Important distinction: Kendall’s tau-b is not the same as Pearson correlation. Pearson focuses on linear association using raw values, while Kendall’s tau-b focuses on ordered agreement between pairs and corrects for tied ranks.
Table of Contents
- What Is Kendall’s Tau-b?
- Kendall’s Tau-a vs Tau-b vs Spearman
- Kendall’s Tau-b Formula
- Null and Alternative Hypotheses
- Dataset and Variables Used
- Verified Kendall’s Tau-b Results
- Python Chart-by-Chart Interpretation
- R Chart-by-Chart Interpretation
- SPSS Output Interpretation
- Excel Worked File Explanation
- Python, R, SPSS and Excel Workflows
- Code Blocks and Excel Formulas
- How to Report Kendall’s Tau-b
- Common Mistakes
- Downloads and Resources
- Related Statistical Guides
- FAQs About Kendall’s Tau-b
What Is Kendall’s Tau-b?
Kendall’s Tau-b is a rank-based correlation coefficient used to measure monotonic association between two variables while correcting for ties. A monotonic association means that as one variable increases, the other variable tends to increase or decrease consistently, even if the pattern is not perfectly linear.
Tau-b compares every pair of observations. If the order of two observations is the same on both variables, the pair is concordant. If the order is opposite, the pair is discordant. If one or both variables have equal values for the pair, ties are counted and corrected in the denominator.
Kendall’s Tau-b is closely related to Correlation in Python, Correlation in R, Correlation in SPSS, Correlation in Excel, Correlation Matrix, Correlation Assumptions, p-value, effect size and parametric vs nonparametric tests.
Simple definition: Kendall’s tau-b measures whether two variables have the same rank order more often than the opposite rank order, while adjusting for tied values.
Kendall’s Tau-a vs Tau-b vs Spearman
Students often confuse Kendall’s tau-a, Kendall’s tau-b and Spearman correlation. They are all rank-based ideas, but they do not handle ties in the same way.
| Measure | Best Use | Tie Handling | Example |
|---|---|---|---|
| Kendall’s tau-a | Rank data with no ties. | Does not correct for ties. | Unique competition ranks from 1 to n. |
| Kendall’s tau-b | Ordinal or numeric data with ties. | Corrects for ties in X and Y. | G2 and G3 grade scores with repeated values. |
| Spearman correlation | Ranked or monotonic data. | Uses ranked values and average ranks for ties. | Checking a monotonic relationship using rank-transformed data. |
| Pearson correlation | Continuous variables with linear association. | Not a rank method. | Linear correlation between two normally distributed variables. |
Best choice here: Since G2 and G3 contain many repeated grade values, tau-b is more appropriate than tau-a.
Kendall’s Tau-b Formula
The tie-corrected Kendall’s tau-b formula is:
In this formula, C is the number of concordant pairs, D is the number of discordant pairs, Tx is the number of pairs tied only on X, and Ty is the number of pairs tied only on Y.
| Formula Element | Meaning | G2 vs G3 Value |
|---|---|---|
| C | Concordant pairs | 169,536 |
| D | Discordant pairs | 5,460 |
| Tx | Pairs tied only on G2 | 13,777 |
| Ty | Pairs tied only on G3 | 13,593 |
| Both ties | Pairs tied on both G2 and G3 | 7,910 |
| Total pairs | n(n − 1) / 2 | 210,276 |
| τb | Kendall’s tau-b | 0.869595 |
The result is strongly positive because concordant pairs greatly outnumber discordant pairs. The tie correction is necessary because grade values repeat often.
Null and Alternative Hypotheses
Kendall’s tau-b tests whether the population monotonic rank association is zero.
| Statement | Hypothesis | Meaning |
|---|---|---|
| Null hypothesis | H0: τb = 0 | There is no monotonic association between G2 and G3. |
| Alternative hypothesis | H1: τb ≠ 0 | There is a monotonic association between G2 and G3. |
| Decision rule | Reject H0 if p < .05 | The rank association is statistically significant. |
Decision: Since p = 2.113285e-199 is far below .05, the null hypothesis is rejected. There is a statistically significant very strong positive monotonic association between G2 and G3.
Dataset and Variables Used
The analysis used 16 numeric or ordinal variables from the student performance dataset. The strongest worked pair was G2 vs G3. The matrix also included age, Medu, Fedu, traveltime, studytime, failures, famrel, freetime, goout, Dalc, Walc, health, absences, G1, G2 and G3.
| Variable | Role | Scale Type | Reason for Tau-b |
|---|---|---|---|
| G2 | Worked X variable | Numeric grade with ties | Second-period grade; strongest pair with G3. |
| G3 | Worked Y variable | Numeric grade with ties | Final grade; strongly ordered with G2. |
| G1 | Additional grade variable | Numeric grade with ties | Strongly associated with G2 and G3. |
| Medu and Fedu | Parent education variables | Ordinal | Good examples of ordered categorical variables. |
| Dalc and Walc | Alcohol-use variables | Ordinal | Show strong ordinal association with ties. |
| failures | Academic risk variable | Ordinal/count-like | Negatively associated with grade variables. |
The diagnostic table shows that all 16 variables had N = 649 valid values and no missing values. Several ordinal-style variables had large tie groups, such as failures, Dalc, traveltime and studytime. This supports the use of Kendall’s tau-b instead of a tie-free rank correlation.
Verified Kendall’s Tau-b Results
The strongest association is G2 vs G3, followed by G1 vs G2 and G1 vs G3. The grade variables form the strongest positive rank-correlation block in the matrix.
| Rank | Pair | N | Kendall’s tau-b | p-value | Direction | Interpretation |
|---|---|---|---|---|---|---|
| 1 | G2 vs G3 | 649 | 0.869595 | 2.113285e-199 | Positive | Very strong monotonic association. |
| 2 | G1 vs G2 | 649 | 0.780639 | 4.403489e-161 | Positive | Strong monotonic association. |
| 3 | G1 vs G3 | 649 | 0.766198 | 2.108694e-155 | Positive | Strong monotonic association. |
| 4 | Medu vs Fedu | 649 | 0.569954 | 5.622318e-68 | Positive | Moderate-to-strong ordered association. |
| 5 | Dalc vs Walc | 649 | 0.555407 | 4.096093e-59 | Positive | Weekday and weekend alcohol use move together. |
| 6 | failures vs G3 | 649 | -0.378883 | 2.182742e-30 | Negative | Higher failures align with lower final grade ranks. |
| 7 | failures vs G2 | 649 | -0.367969 | 9.916502e-29 | Negative | Higher failures align with lower G2 ranks. |
| 8 | failures vs G1 | 649 | -0.365780 | 1.963360e-28 | Negative | Higher failures align with lower G1 ranks. |
| 9 | goout vs Walc | 649 | 0.314907 | 1.732229e-22 | Positive | Going out and weekend alcohol use increase together. |
| 10 | freetime vs goout | 649 | 0.303904 | 6.841912e-21 | Positive | Free time and going out show positive order. |
The practical conclusion is that grade variables have the strongest positive monotonic relationships, while failures has the strongest negative relationship with grades.
Python Chart-by-Chart Interpretation
The Python report includes six charts: tau-b heatmap, p-value heatmap, top tau-b pairs, worked pair jittered scatterplot, tie profile and concordant-discordant-tie counts.
Python Chart 1: Kendall’s Tau-b Heatmap
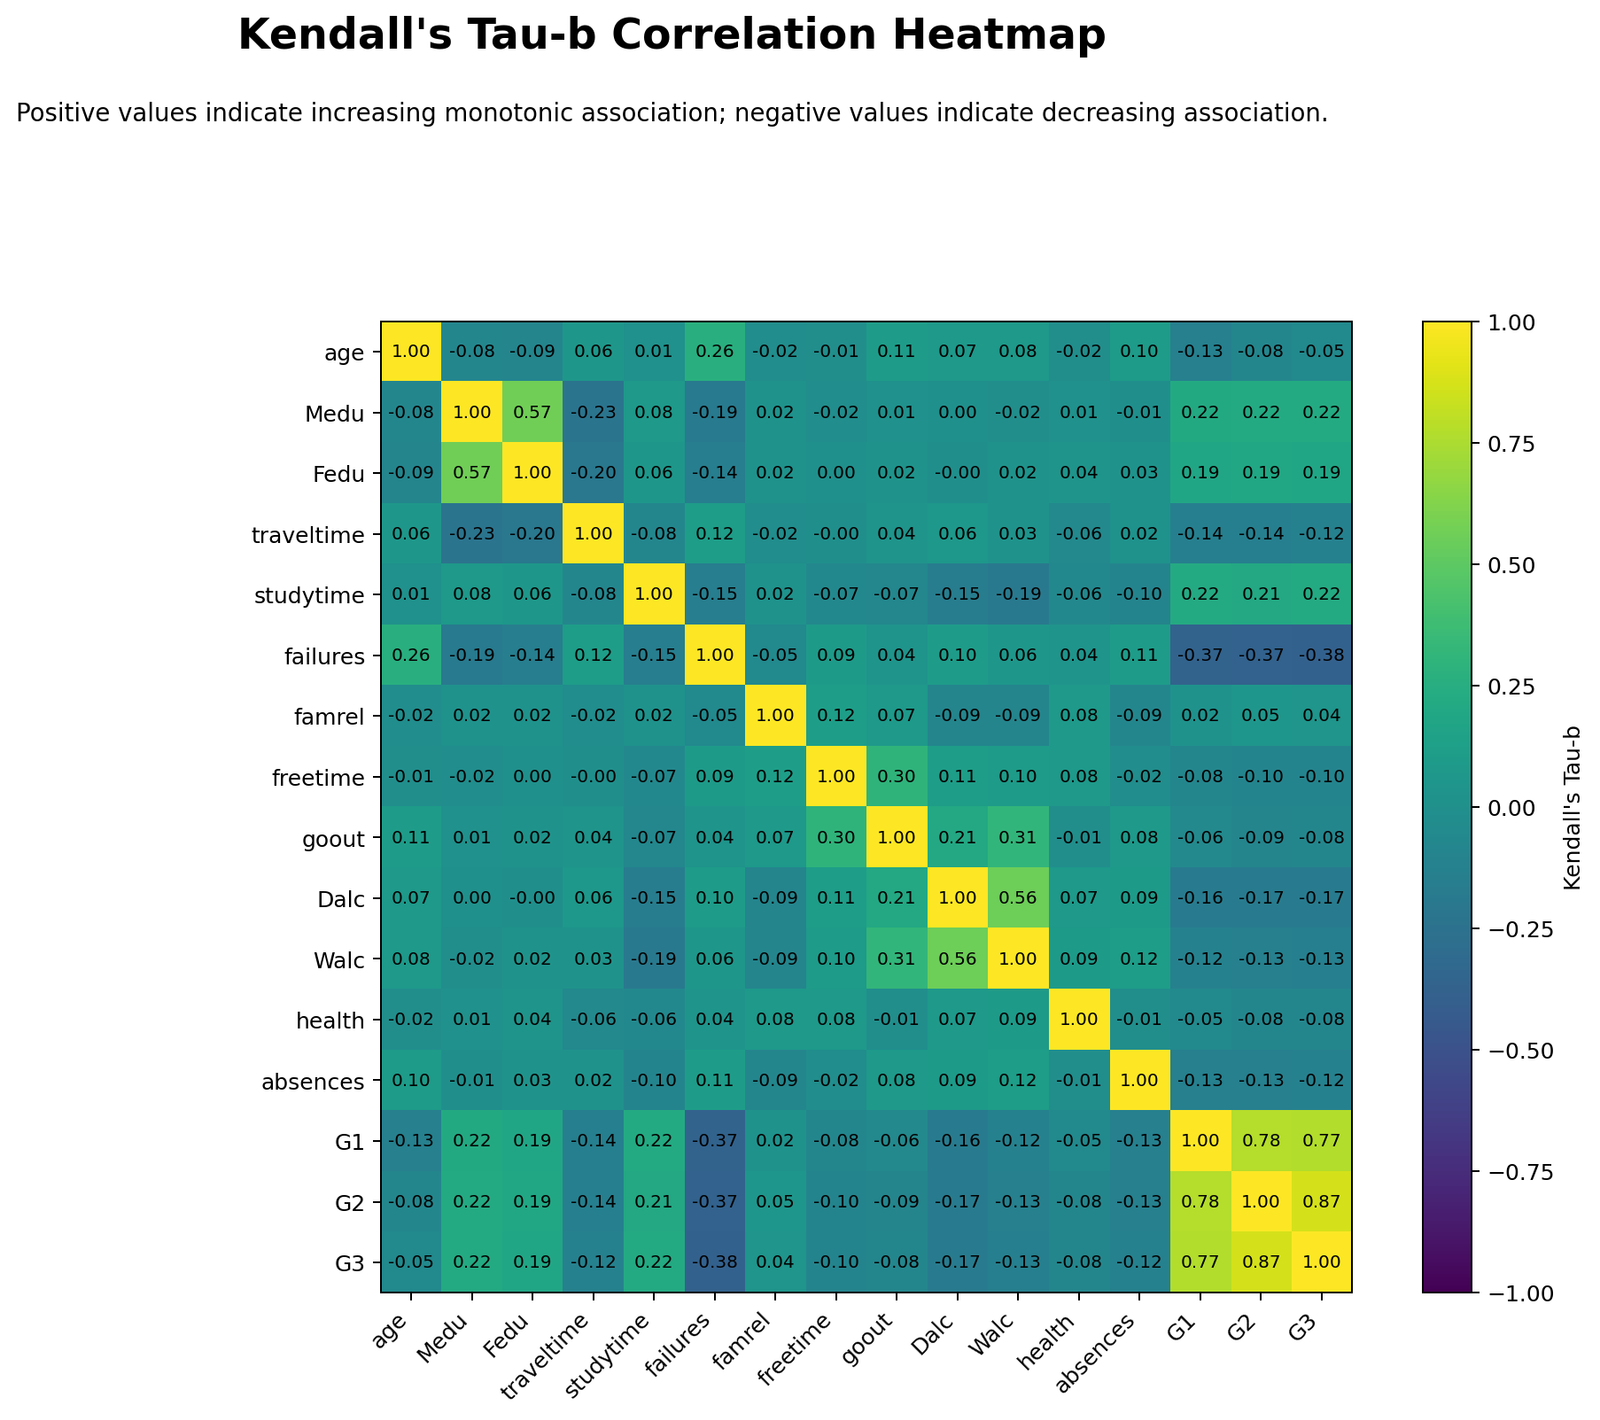
The tau-b heatmap shows the direction and strength of monotonic association across the full variable set. Positive cells indicate that higher ranks on one variable tend to match higher ranks on the other variable. Negative cells indicate that higher ranks on one variable tend to match lower ranks on the other variable.
The strongest positive block appears among the grade variables G1, G2 and G3. The strongest negative pattern appears between failures and the grade variables. This visual summary supports the ranked top-pair table.
Python Chart 2: Kendall’s Tau-b p-value Heatmap
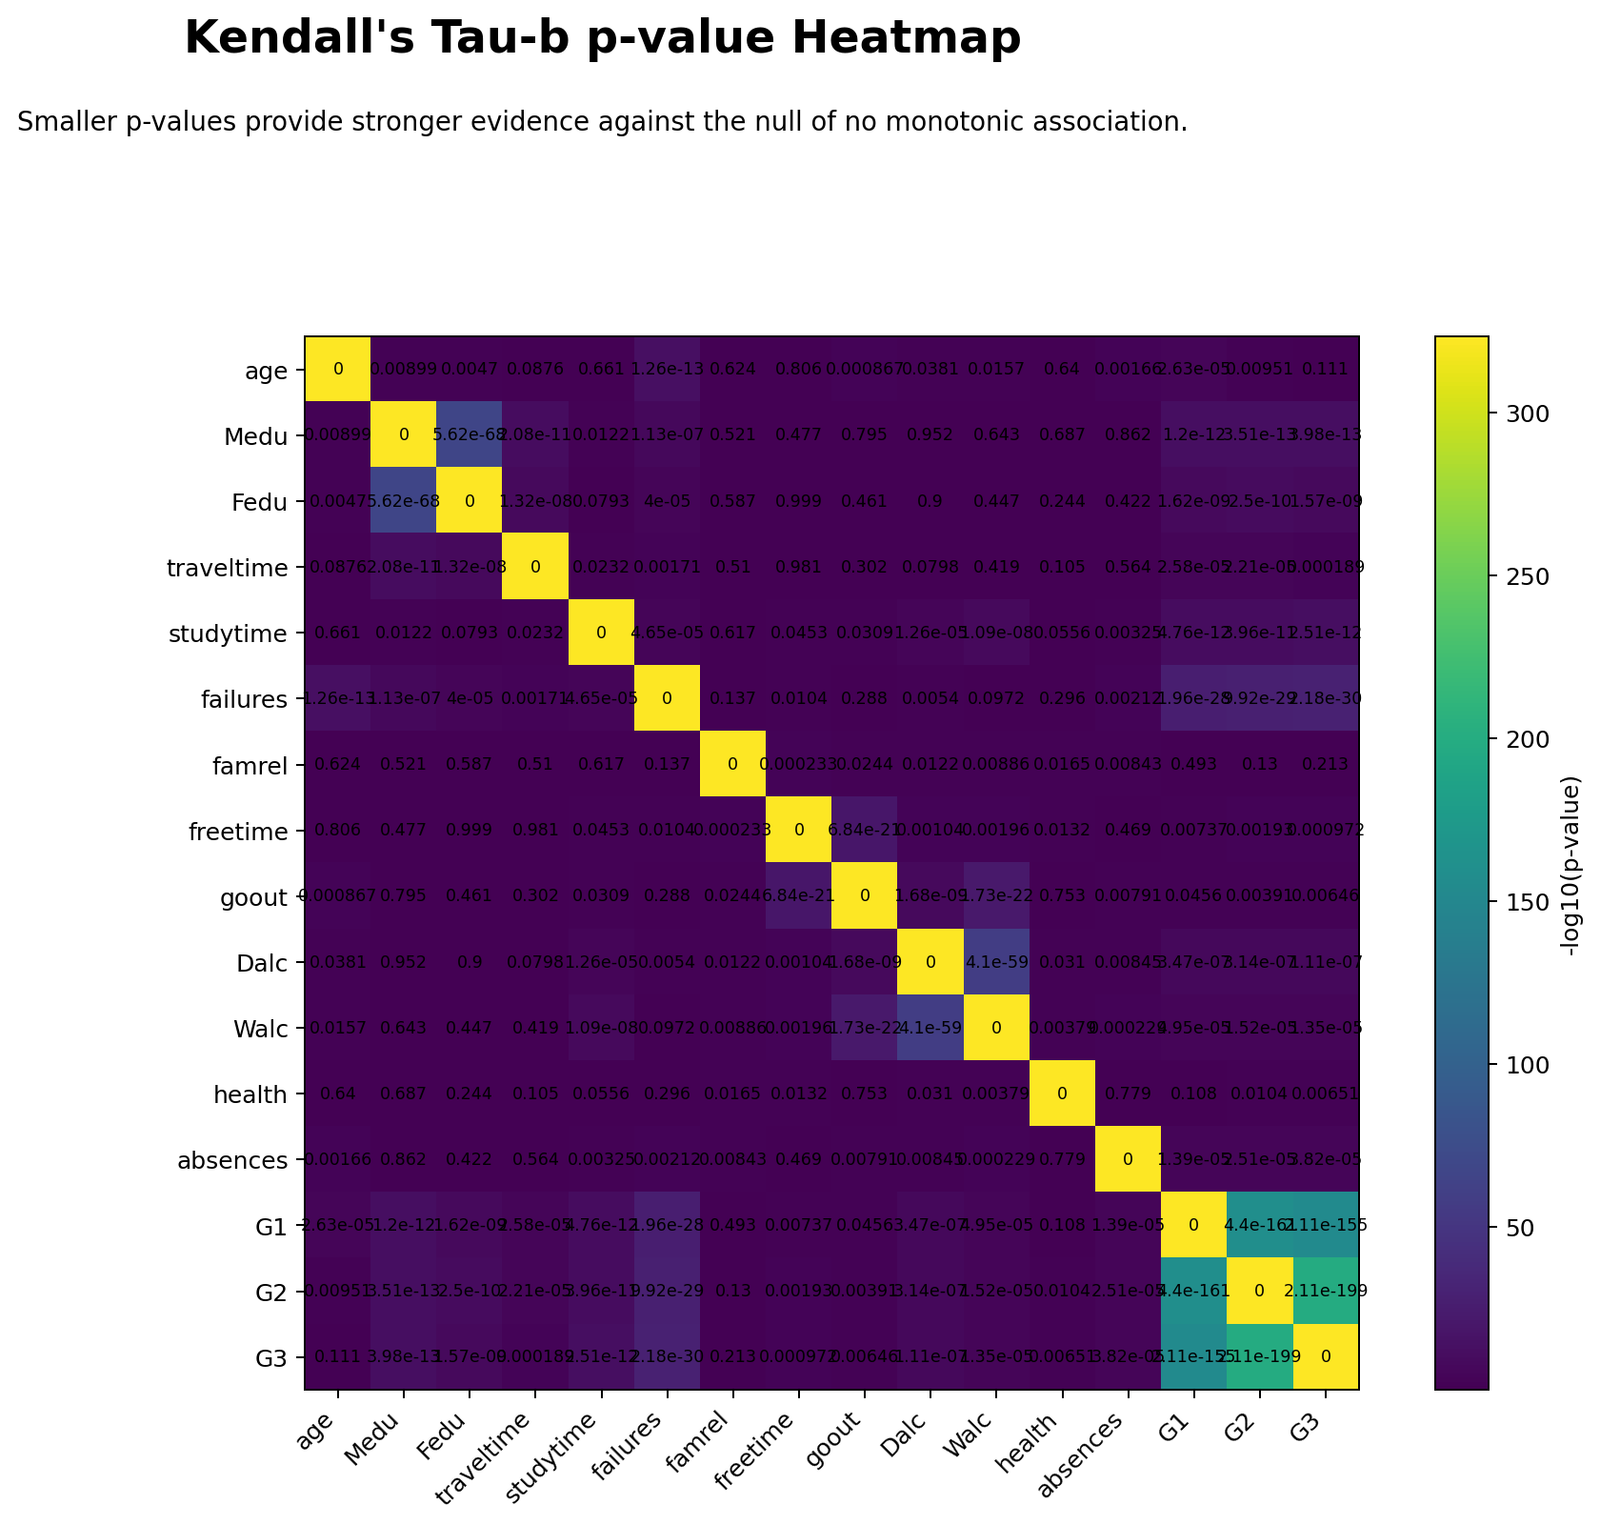
The p-value heatmap shows where the statistical evidence is strongest. The grade relationships have extremely small p-values, especially G2 vs G3, G1 vs G2 and G1 vs G3.
This chart should be read alongside the tau-b heatmap. The tau-b heatmap gives strength and direction, while the p-value heatmap gives statistical evidence. A small p-value does not automatically mean a strong effect, so both charts are necessary.
Python Chart 3: Top Kendall’s Tau-b Pairs
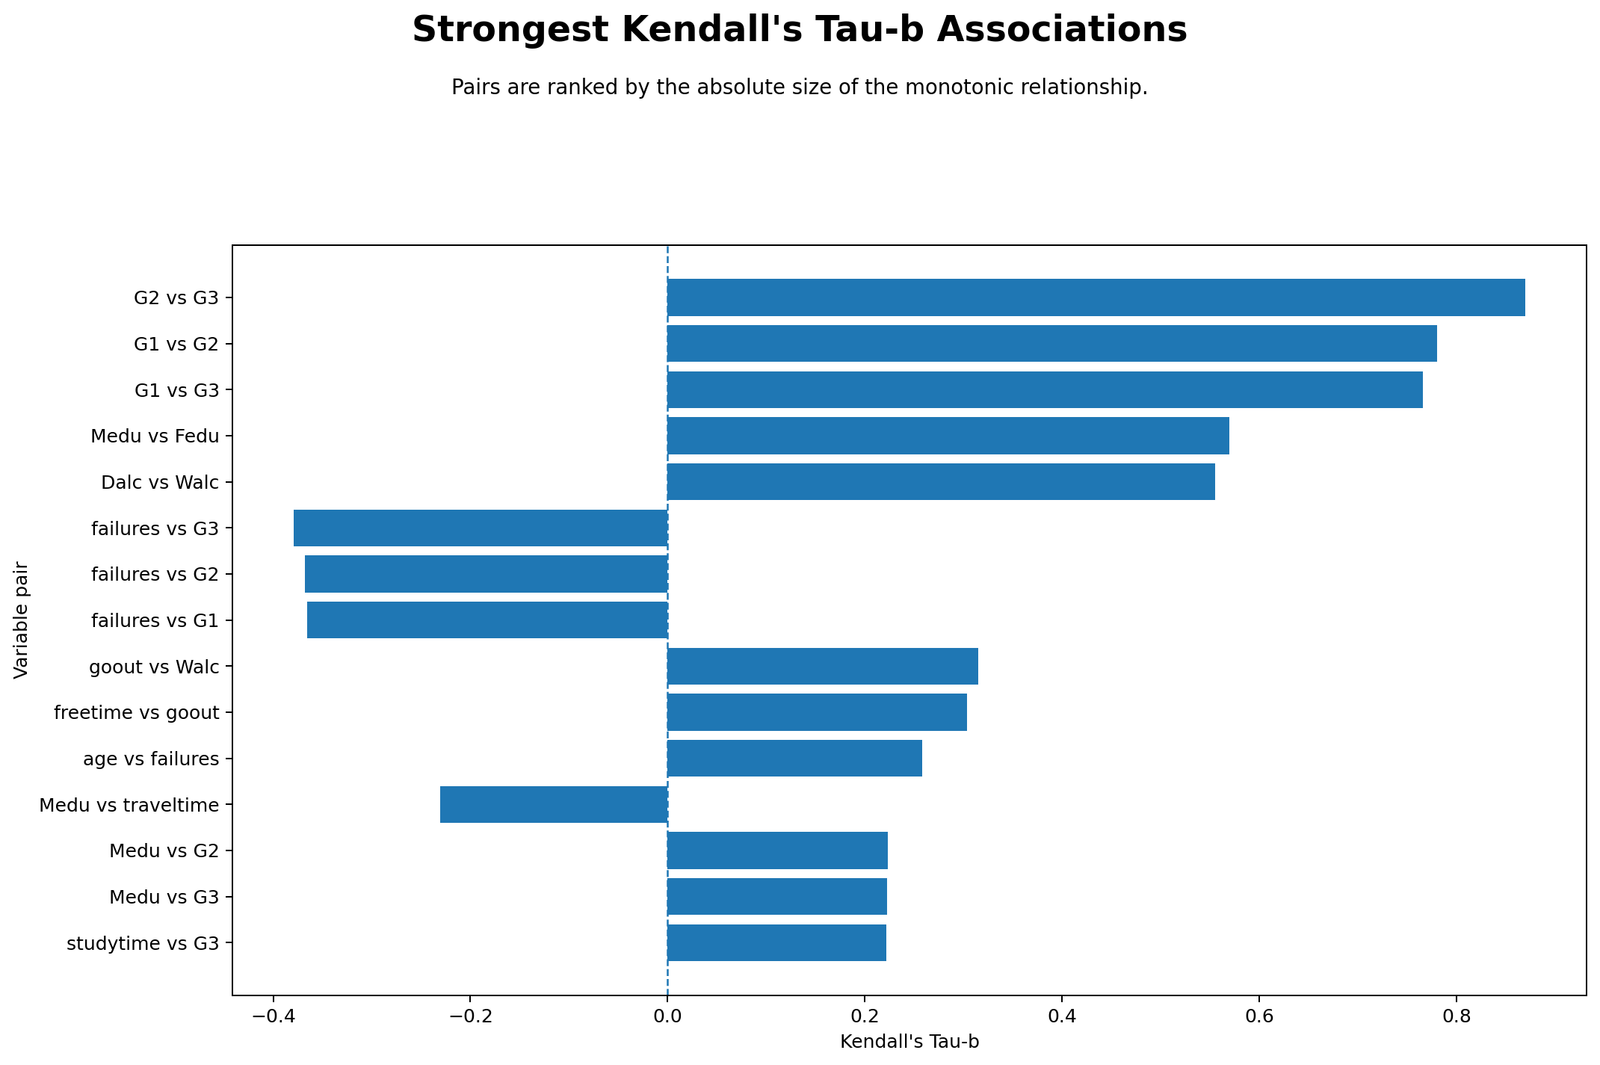
The top-pairs chart clearly ranks the strongest monotonic relationships. G2 vs G3 is the strongest with tau-b about 0.8696. G1 vs G2 and G1 vs G3 follow closely, showing that the grade measurements are highly ordered together.
The failures pairs are negative, meaning students with more past failures tend to rank lower on grade outcomes. This should be reported as association, not causation.
Python Chart 4: Worked Pair Jittered Scatterplot
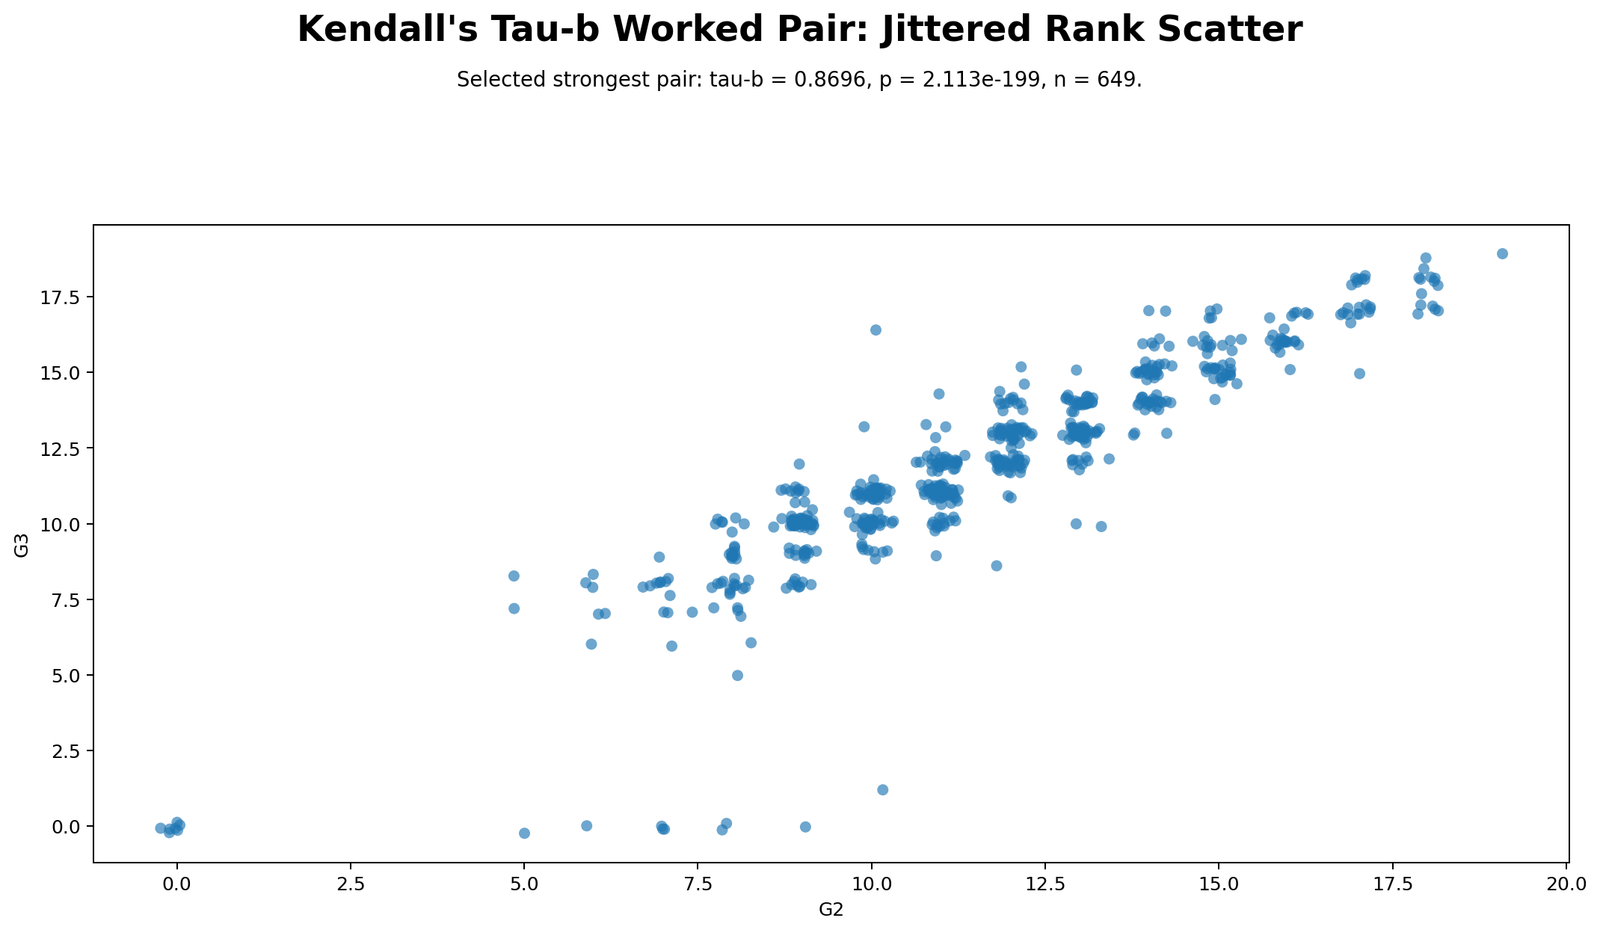
The jittered scatterplot shows the relationship between G2 and G3. Because grades are repeated integer values, many points would overlap without jittering. Jitter makes the dense tied values easier to see while preserving the overall pattern.
The upward pattern is very clear: higher G2 values are strongly associated with higher G3 values. This matches the very high tau-b value of 0.8696.
Python Chart 5: Tie Profile
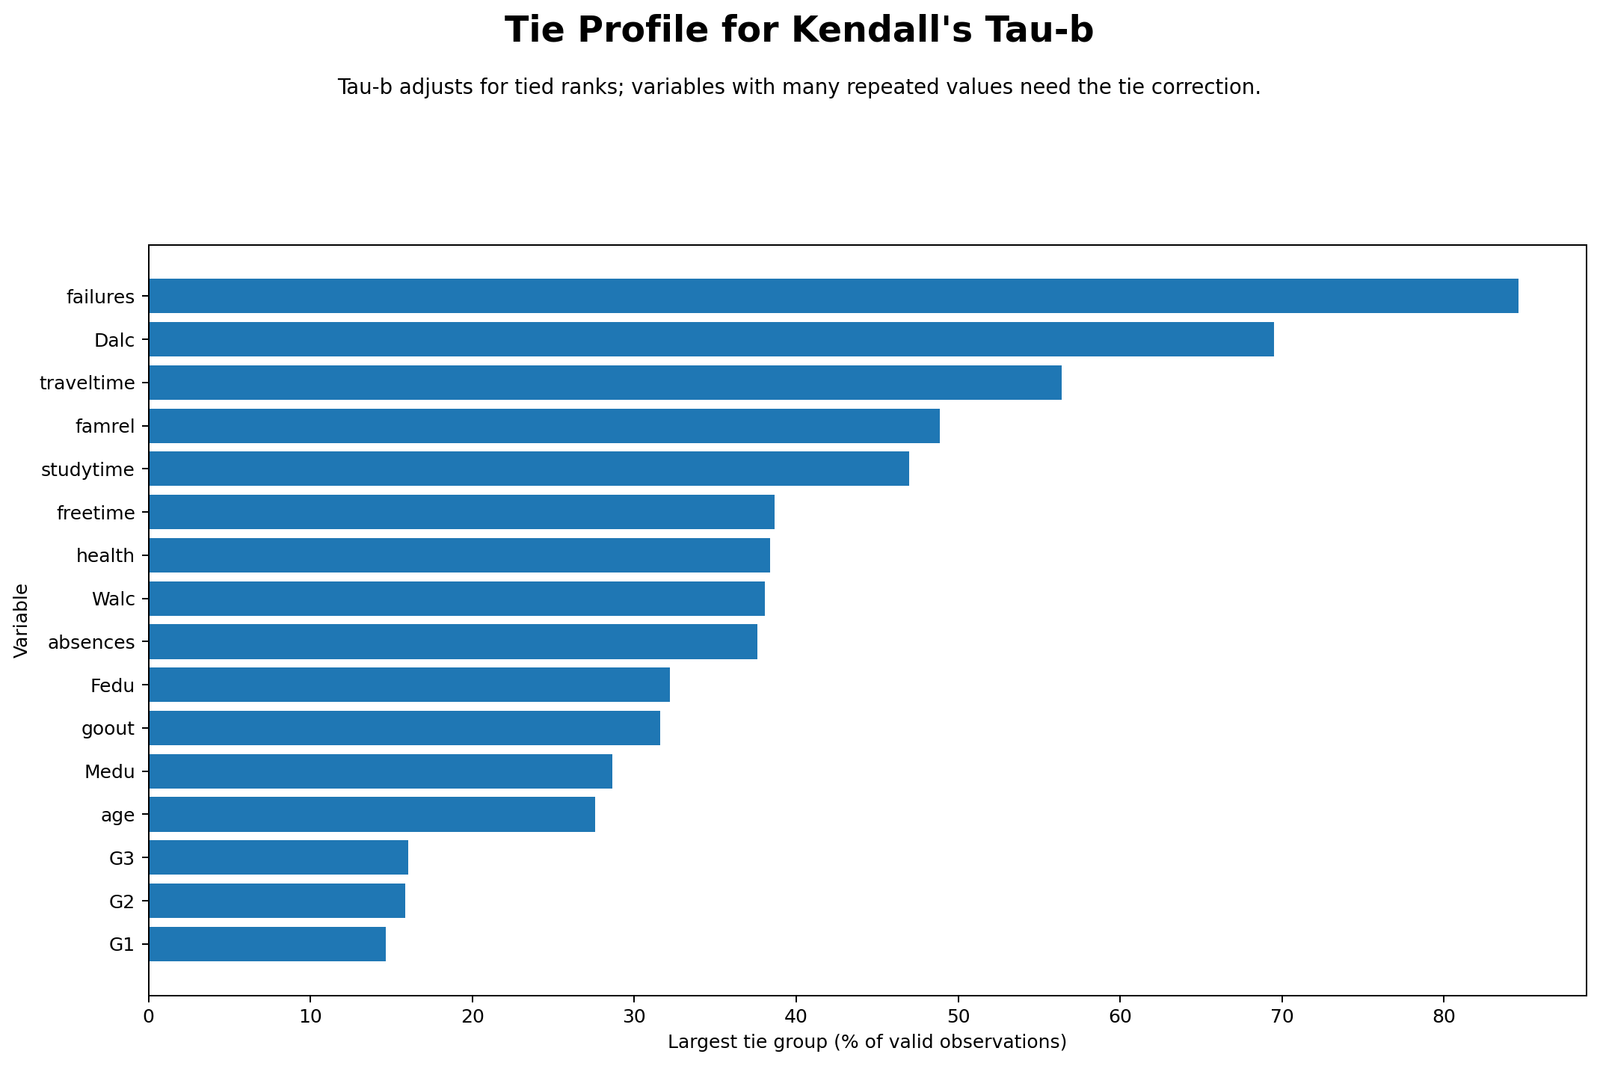
The tie profile explains why Kendall’s tau-b is needed. Some variables have very large tie groups. For example, failures has many observations at zero, Dalc has many observations at one, and several ordinal variables have repeated category values.
When ties are common, tau-b is preferred because it adjusts the denominator for ties in each variable. Without tie correction, the coefficient can be misleading.
Python Chart 6: Concordant, Discordant and Tie Counts
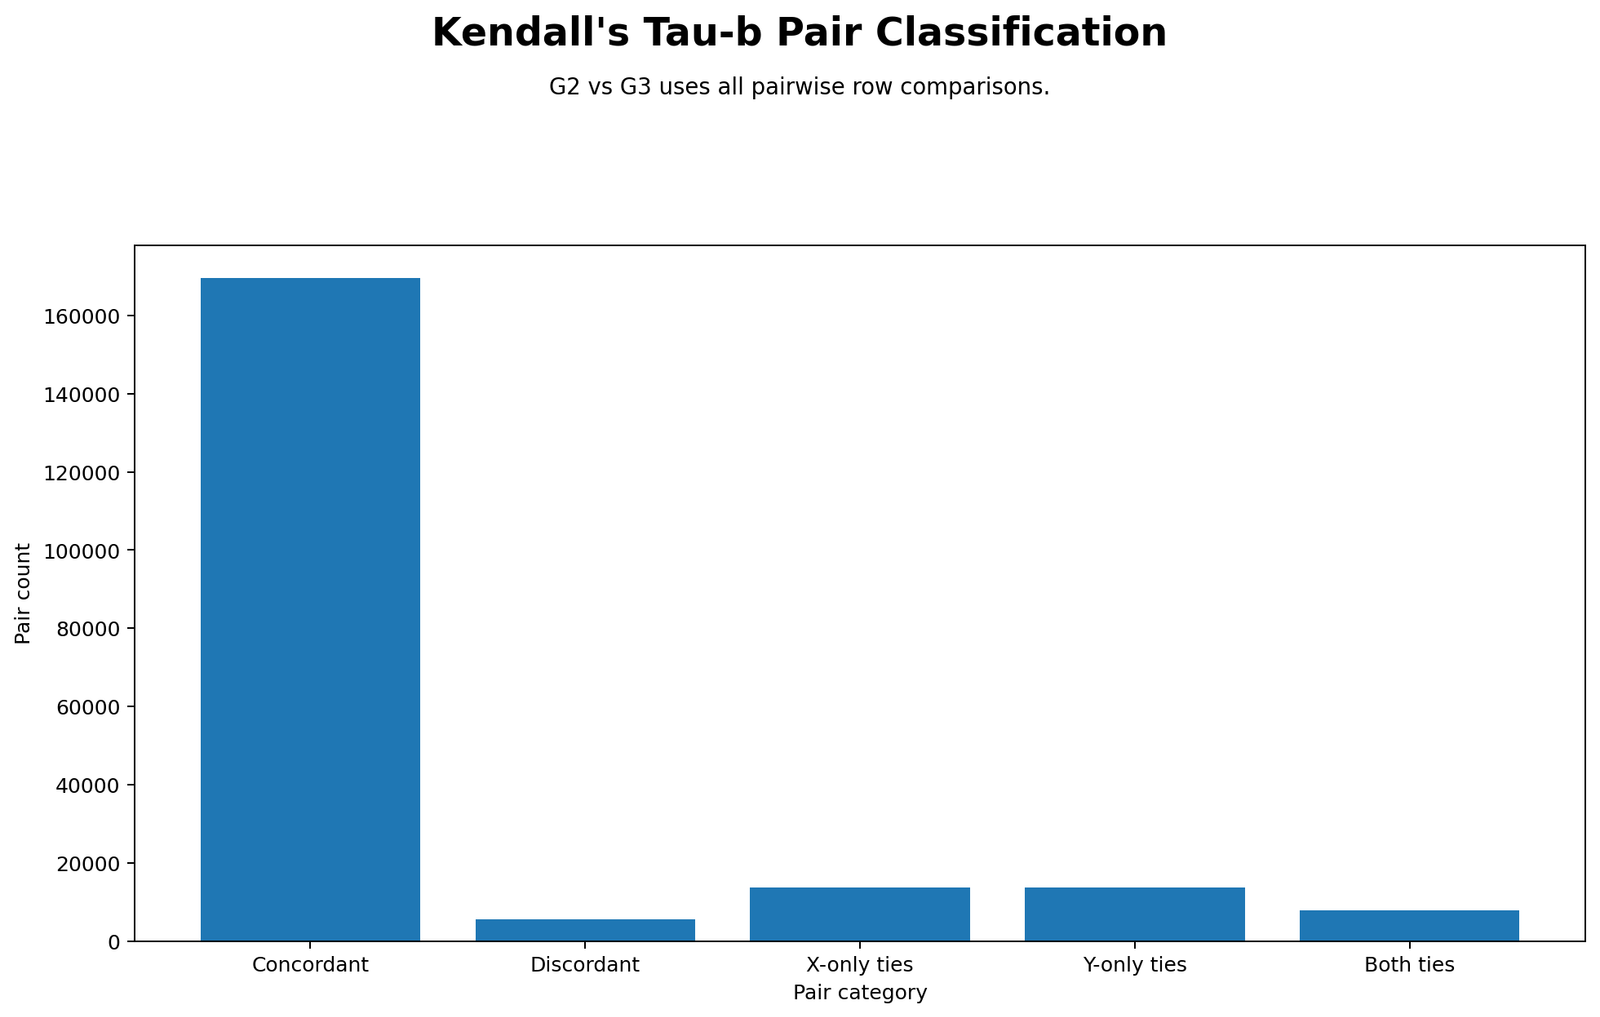
This chart directly explains the formula. For G2 vs G3, there are 169,536 concordant pairs and only 5,460 discordant pairs. This large excess of concordant pairs produces the strong positive tau-b value.
The chart also shows X-only ties, Y-only ties and both-variable ties. These tied values are part of the reason tau-b is used instead of tau-a.
R Chart-by-Chart Interpretation
The R report validates the Python results using colorful charts. The same six ideas are repeated: tau-b heatmap, p-value heatmap, top pairs, worked scatterplot, tie profile and pair classification counts.
R Chart 1: Colorful Kendall’s Tau-b Heatmap
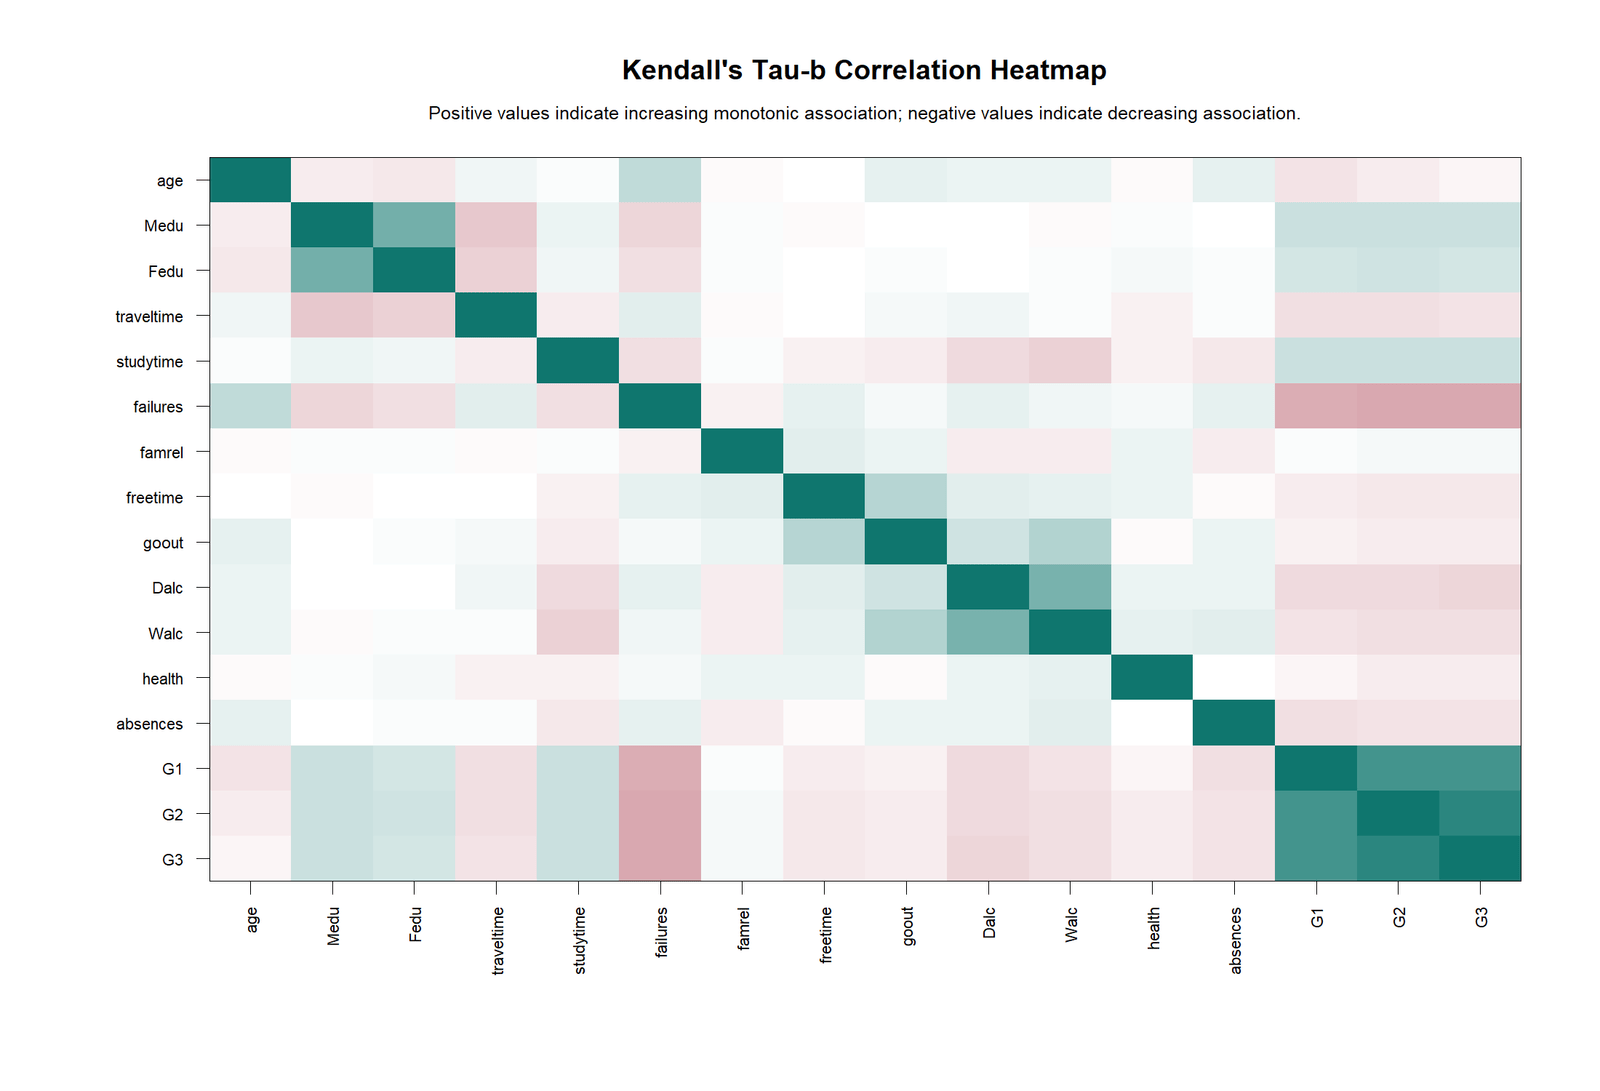
The R heatmap confirms the same pattern: grade variables form the strongest positive cluster, while failures has negative associations with G1, G2 and G3. This confirms that the Python heatmap is not a software-specific result.
R Chart 2: Colorful Kendall’s Tau-b p-value Heatmap
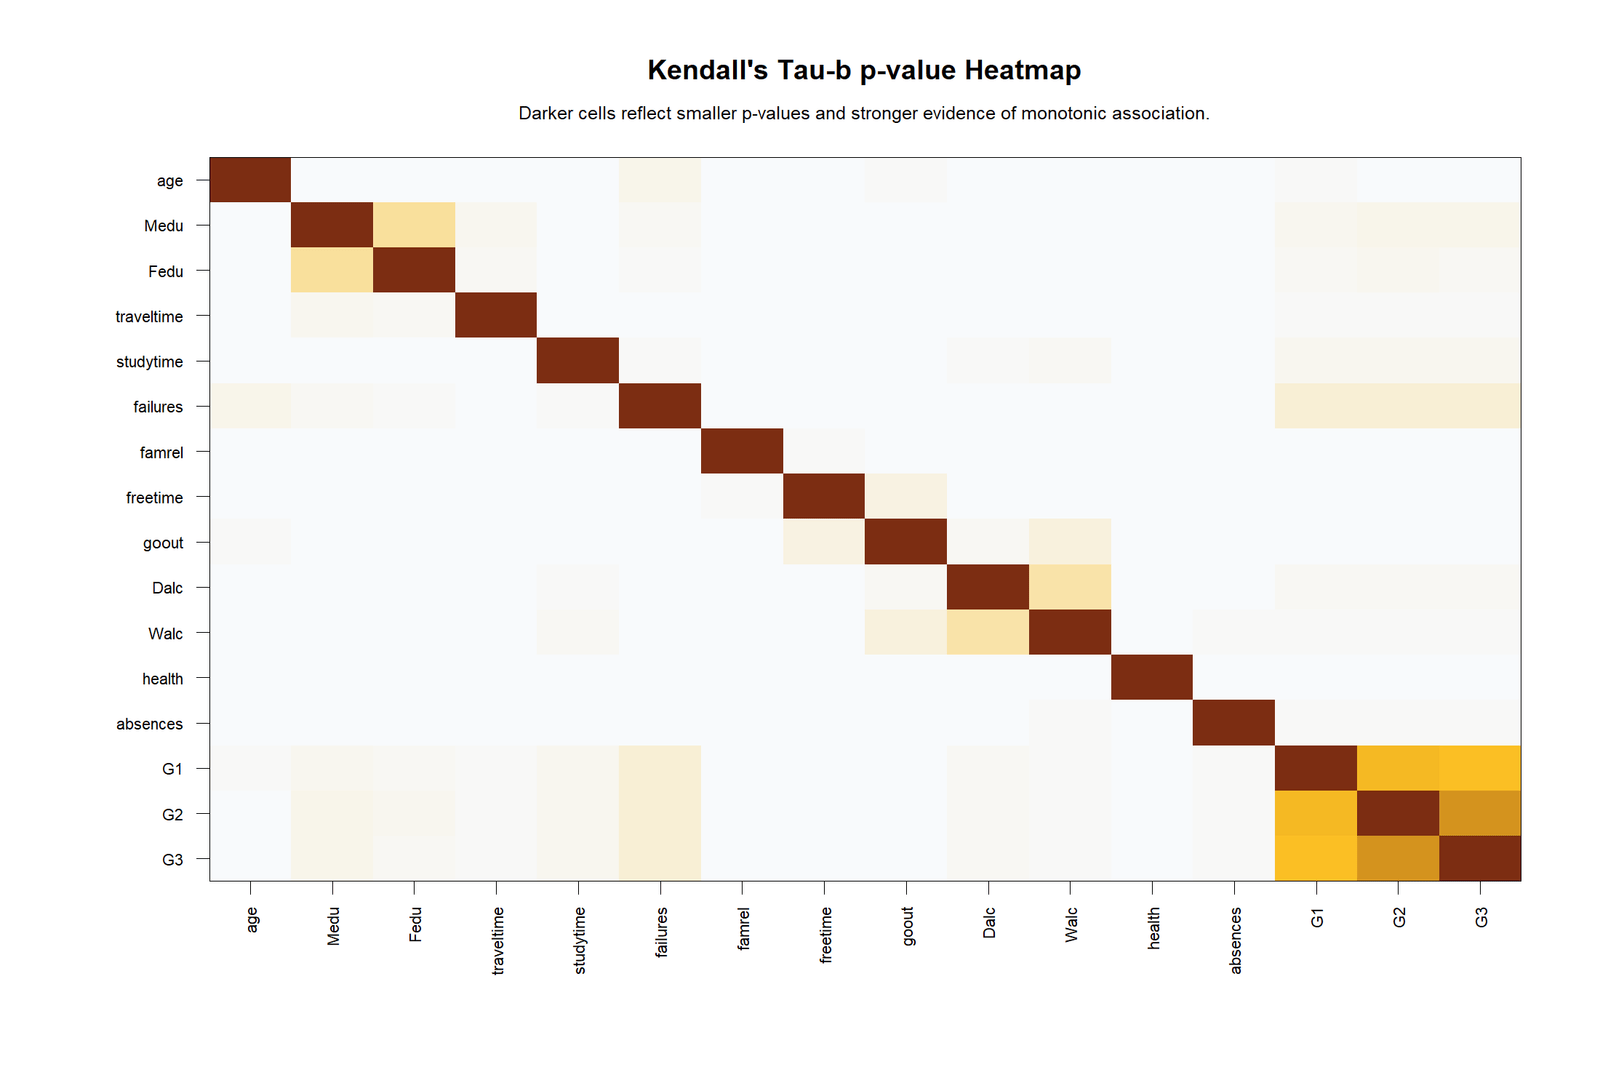
The R p-value heatmap confirms the extremely small p-values for the strongest grade relationships. G2 vs G3, G1 vs G2 and G1 vs G3 show very strong statistical evidence of monotonic association.
R Chart 3: Colorful Top Kendall’s Tau-b Pairs
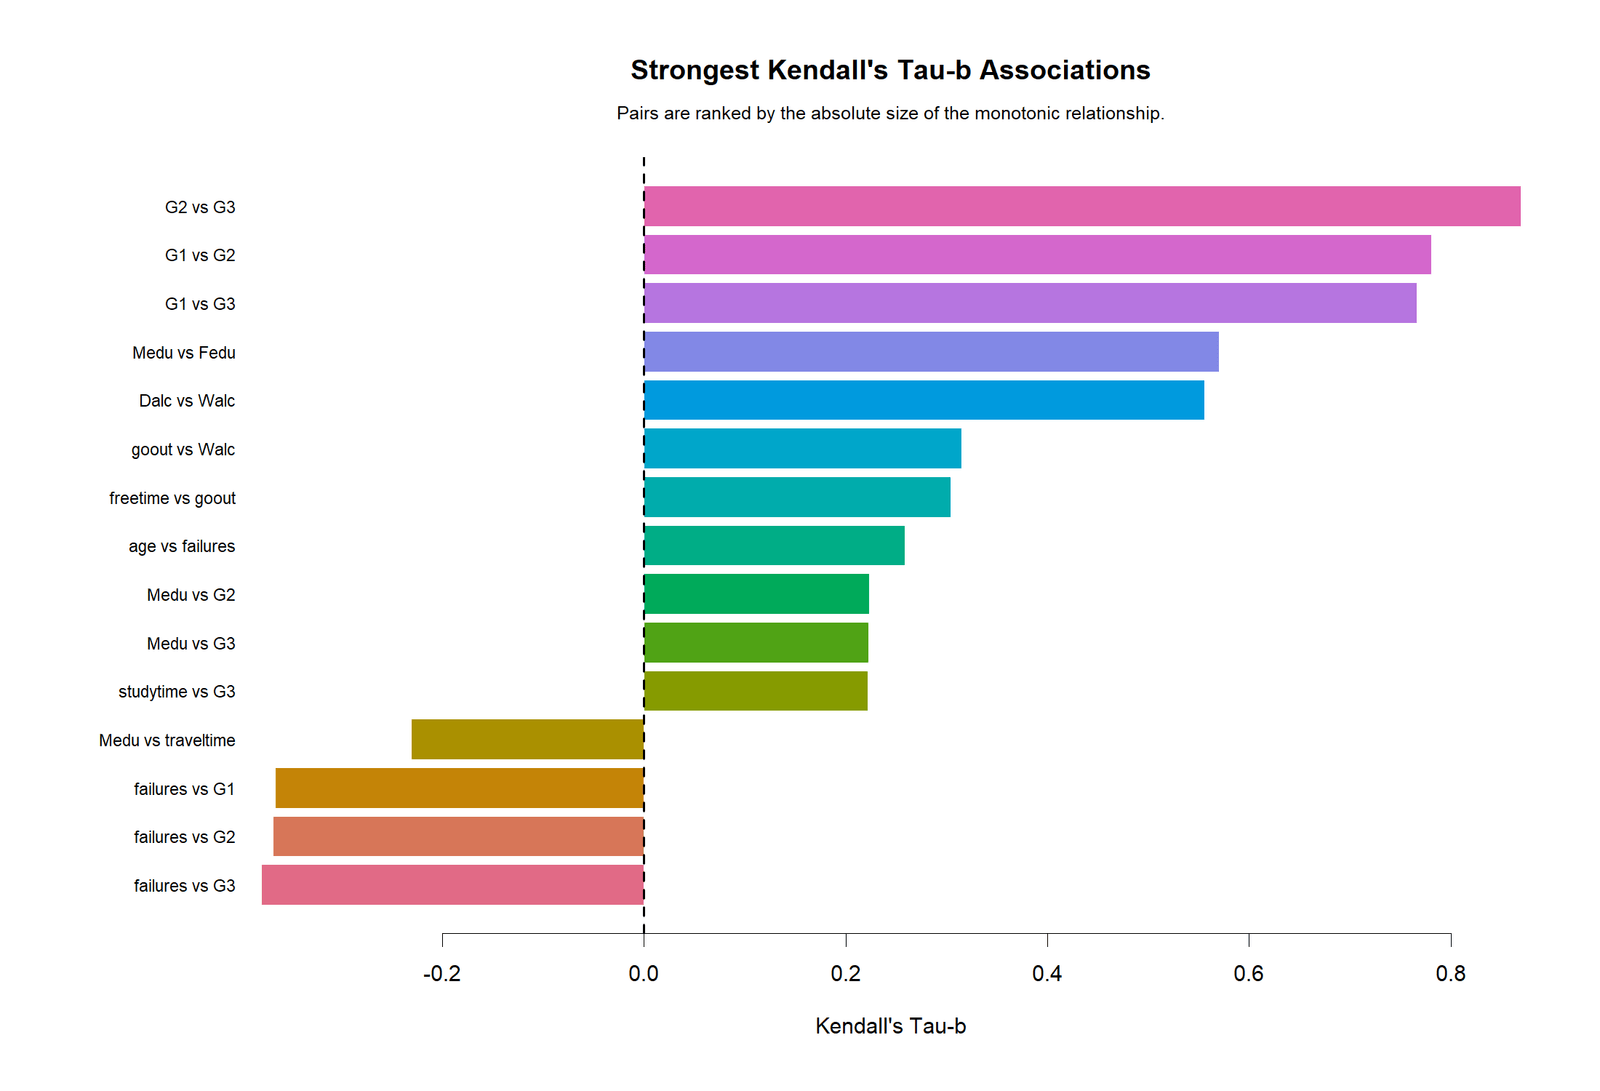
The R top-pairs chart confirms that G2 vs G3 is the strongest pair, followed by G1 vs G2 and G1 vs G3. The same ordering appears in the Python report and Excel workbook.
R Chart 4: Colorful Worked Pair Jittered Scatterplot
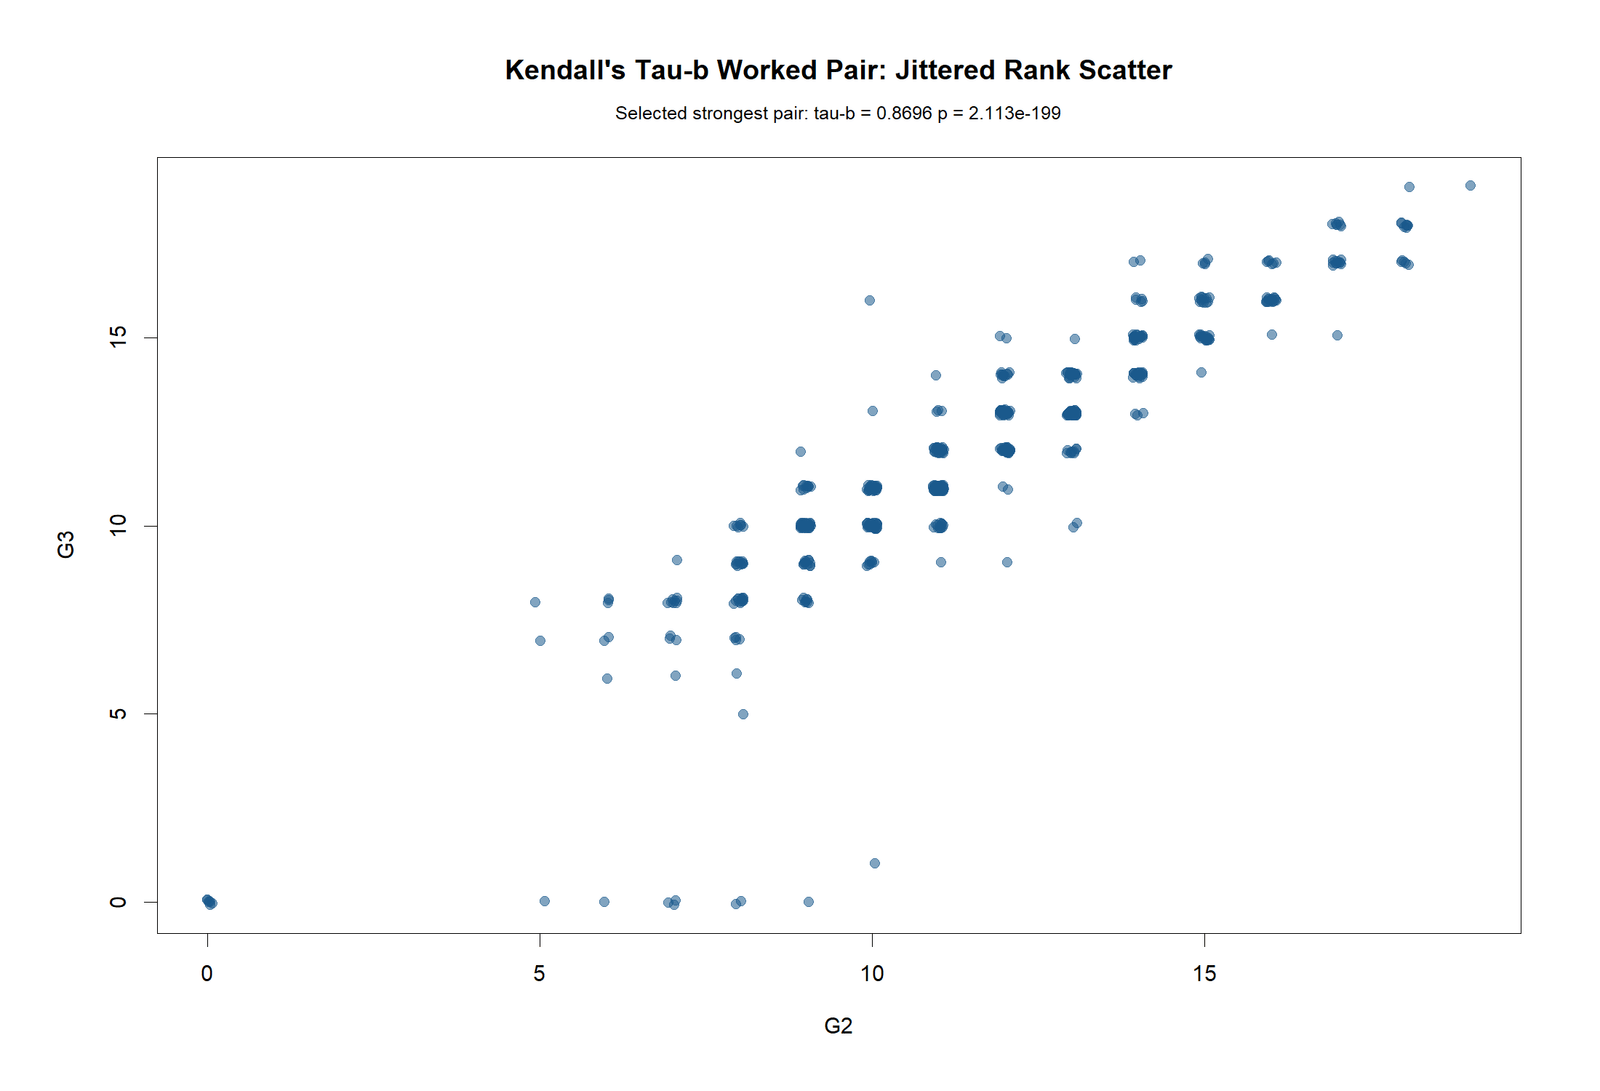
The R scatterplot again shows a strong upward monotonic pattern between G2 and G3. Jittering helps reveal repeated grade combinations where many points overlap.
R Chart 5: Colorful Tie Profile
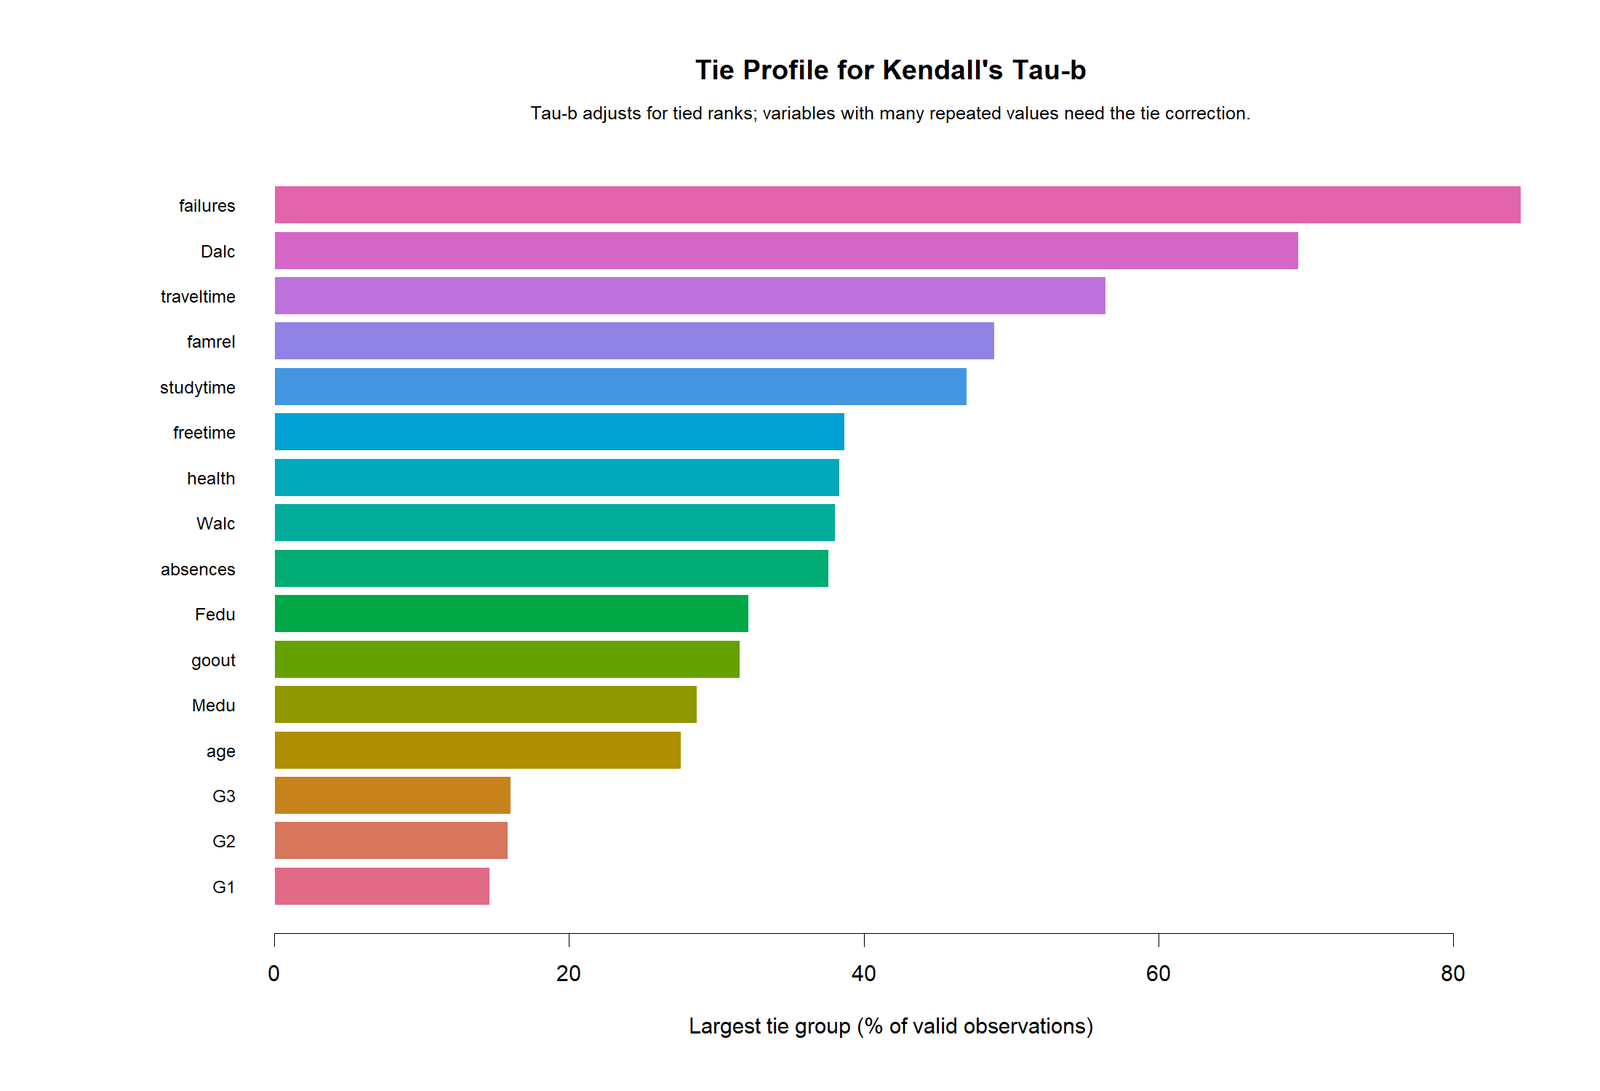
The R tie profile reinforces the methodological choice. Variables with repeated categories or repeated grade values need tie correction. Kendall’s tau-b handles this directly.
R Chart 6: Colorful Concordant, Discordant and Tie Counts
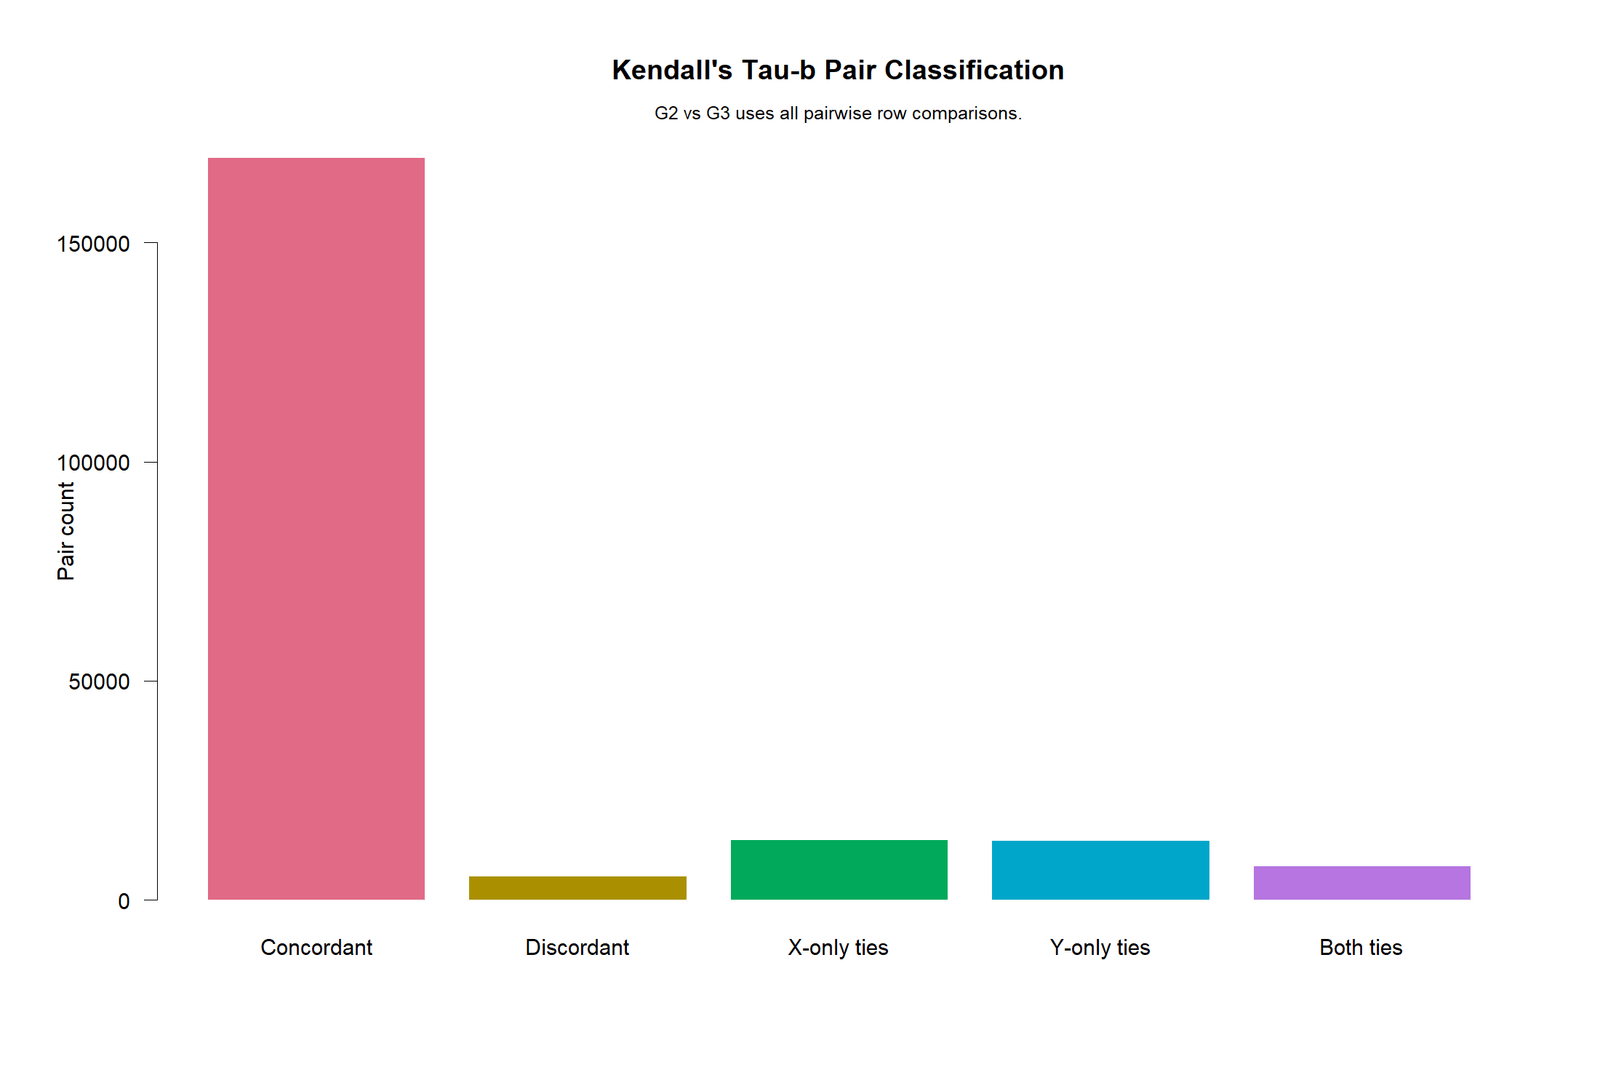
The R pair-classification chart confirms the formula logic: concordant pairs dominate discordant pairs. That is why the final coefficient is strongly positive.
SPSS Output Interpretation
The SPSS output provides a formal Kendall’s tau-b correlation matrix. SPSS confirms the strongest grade relationships, including G2 with G3, G1 with G2 and G1 with G3.
Open the SPSS Kendall’s Tau-b Output PDF
| SPSS Output Item | Value | Interpretation |
|---|---|---|
| Primary strongest pair | G2 with G3 | Second-period grade and final grade. |
| Kendall’s tau-b | .870 | Very strong positive monotonic association. |
| Sig. (2-tailed) | .000 | Statistically significant at .01 level. |
| N | 649 | Complete valid paired observations. |
| G1 with G2 | .781 | Strong positive monotonic association. |
| G1 with G3 | .766 | Strong positive monotonic association. |
The SPSS result should be reported with rounded values. For example, G2 and G3 showed a very strong positive monotonic relationship, τb = .870, p < .001, N = 649.
Excel Worked File Explanation
The Excel workbook is a fully worked Kendall’s tau-b analysis. It includes a report sheet, raw data, numeric data, variable diagnostics, pairwise tau-b table, tau-b matrix, p-value matrix, top-pairs table and worked formula example.
Download the Kendall’s Tau-b Fully Worked Excel File
| Excel Sheet | Purpose | Main Content |
|---|---|---|
| Report | Quick result summary. | Shows strongest pair, top 10 associations, assumptions and reporting sentence. |
| Raw_Data | Original dataset. | Full uploaded student performance dataset. |
| Numeric_Data | Numeric and ordinal variables. | 16 variables used in the tau-b matrix. |
| Variable_Diagnostics | Tie and scale checks. | Valid N, missing values, unique values, largest tie group and measurement notes. |
| Pairwise_Tau_b | All pairwise tau-b tests. | 120 pairwise tests with coefficient, p-value and decision. |
| Tau_b_Matrix | Coefficient matrix. | Matrix layout of tau-b values. |
| P_Value_Matrix | Significance matrix. | Pairwise two-tailed p-values. |
| Top_Pairs | Ranked strongest associations. | Top tau-b pairs sorted by absolute coefficient. |
| Worked_Example | Manual formula demonstration. | Concordant, discordant and tied pair counts for G2 vs G3. |
The workbook’s worked example uses G2 vs G3. It calculates 169,536 concordant pairs, 5,460 discordant pairs, 13,777 G2-only ties, 13,593 G3-only ties and 7,910 ties on both variables. These values produce Kendall’s tau-b = 0.8695948161.
Python, R, SPSS and Excel Workflows
| Software | Main Workflow | Best Use |
|---|---|---|
| Python | Use pandas for data handling, scipy.stats.kendalltau for tau-b, and matplotlib for heatmaps, tie profiles and pair-count charts. | Automated charts, matrices and reproducible reports. |
| R | Use cor.test(method = “kendall”, exact = FALSE), pairwise loops and ggplot-style charts. | Statistical validation and colorful chart output. |
| SPSS | Use Nonparametric Correlations with Kendall’s tau-b selected. | Formal correlation matrix and thesis/report output. |
| Excel | Use rank logic, pair classification formulas, COUNTIF, SQRT and manual tau-b formula. | Formula learning and transparent manual calculation. |
Code Blocks and Excel Formulas
Python Code for Kendall’s Tau-b
import pandas as pd
from scipy.stats import kendalltau

df = pd.read_csv("dataset.csv")

x_var = "G2"
y_var = "G3"

work = df[[x_var, y_var]].dropna()

tau_b, p_value = kendalltau(work[x_var], work[y_var])

print("Complete pairs:", len(work))
print("Kendall's tau-b:", tau_b)
print("Two-tailed p-value:", p_value)

if p_value < 0.05:
    print("Reject H0: significant monotonic association")
else:
    print("Fail to reject H0")
Python Code for Concordant, Discordant and Tie Counts
import numpy as np

x = work[x_var].to_numpy()
y = work[y_var].to_numpy()

C = 0
D = 0
Tx = 0
Ty = 0
Tboth = 0

for i in range(len(x)):
    for j in range(i + 1, len(x)):
        dx = np.sign(x[j] - x[i])
        dy = np.sign(y[j] - y[i])

        if dx == 0 and dy == 0:
            Tboth += 1
        elif dx == 0:
            Tx += 1
        elif dy == 0:
            Ty += 1
        elif dx == dy:
            C += 1
        else:
            D += 1

tau_b_manual = (C - D) / np.sqrt((C + D + Tx) * (C + D + Ty))

print("Concordant pairs:", C)
print("Discordant pairs:", D)
print("X-only ties:", Tx)
print("Y-only ties:", Ty)
print("Both ties:", Tboth)
print("Manual Kendall's tau-b:", tau_b_manual)
R Code for Kendall's Tau-b
df <- read.csv("dataset.csv", stringsAsFactors = FALSE)

x_var <- "G2"
y_var <- "G3"

work <- na.omit(df[, c(x_var, y_var)])

test <- cor.test(
  work[[x_var]],
  work[[y_var]],
  method = "kendall",
  exact = FALSE
)

cat("Complete pairs:", nrow(work), "\n")
cat("Kendall's tau-b:", unname(test$estimate), "\n")
cat("p-value:", test$p.value, "\n")

print(test)
SPSS Syntax for Kendall's Tau-b
* Kendall's Tau-b in SPSS.
OUTPUT CLOSE ALL.
OUTPUT NEW NAME=Kendalls_Tau_b_Output.

DESCRIPTIVES VARIABLES=G1 G2 G3
  /STATISTICS=MEAN STDDEV MIN MAX.

NONPAR CORR
  /VARIABLES=G2 G3
  /PRINT=KENDALL TWOTAIL
  /MISSING=PAIRWISE.

NONPAR CORR
  /VARIABLES=age Medu Fedu traveltime studytime failures famrel freetime goout Dalc Walc health absences G1 G2 G3
  /PRINT=KENDALL TWOTAIL
  /MISSING=PAIRWISE.

OUTPUT EXPORT
  /CONTENTS EXPORT=VISIBLE
  /PDF DOCUMENTFILE='Kendalls-Tau-b-SPSS-Output.pdf'.
Excel Formula Patterns for Kendall's Tau-b
For each observation pair i < j:

Difference in X:
=X_j-X_i

Difference in Y:
=Y_j-Y_i

Sign of X difference:
=SIGN(X_j-X_i)

Sign of Y difference:
=SIGN(Y_j-Y_i)

Pair class:
=IF(AND(sign_dx=0,sign_dy=0),"Both tied",
 IF(sign_dx=0,"Tie X only",
 IF(sign_dy=0,"Tie Y only",
 IF(sign_dx=sign_dy,"Concordant","Discordant"))))

Concordant pairs:
=COUNTIF(pair_class_range,"Concordant")

Discordant pairs:
=COUNTIF(pair_class_range,"Discordant")

X-only ties:
=COUNTIF(pair_class_range,"Tie X only")

Y-only ties:
=COUNTIF(pair_class_range,"Tie Y only")

Kendall's tau-b:
=(C-D)/SQRT((C+D+Tx)*(C+D+Ty))

Decision:
=IF(p_value<0.05,"Significant monotonic association","Not significant")
How to Report Kendall's Tau-b
A complete Kendall's tau-b report should include the variables, sample size, coefficient, p-value, direction, strength and tie handling.
APA-style report: Kendall's tau-b was calculated to examine the monotonic association between G2 and G3. The analysis included 649 complete paired observations. There was a very strong positive monotonic association between G2 and G3, τb = .870, p < .001. The null hypothesis of no monotonic association was rejected. Because the grade variables contained tied values, Kendall's tau-b was reported.
Expanded interpretation: The G2 and G3 worked pair produced 210,276 observation pairs, including 169,536 concordant pairs and 5,460 discordant pairs. Concordant pairs greatly outnumbered discordant pairs, producing a very strong positive tau-b coefficient of .870.
Common Mistakes in Kendall's Tau-b Interpretation
| Mistake | Why It Is a Problem | Better Practice |
|---|---|---|
| Using tau-a when ties exist | Tau-a does not correct for tied ranks. | Use tau-b for grade, Likert or ordinal data with repeated values. |
| Calling tau-b a linear correlation | Tau-b measures monotonic rank association, not linear slope. | Use monotonic association wording. |
| Reporting only p-value | p-value does not show practical strength. | Report tau-b coefficient and p-value together. |
| Ignoring direction | Positive and negative tau-b values have different meanings. | State whether higher ranks move together or in opposite directions. |
| Forgetting tie profile | Ties explain why tau-b is selected. | Mention tied ranks when reporting tau-b. |
| Claiming causation | Correlation does not prove cause and effect. | Use association wording unless the study design supports causal claims. |
Downloads and Resources
Download R Report PDFR validation report with colorful Kendall's tau-b charts.
Download SPSS Output PDFSPSS nonparametric correlation matrix for Kendall's tau-b.
Download Excel Worked FileFormula-based tau-b workbook with matrices, diagnostics and worked example.
Open Python Tau-b HeatmapPairwise tau-b matrix chart.
Open R Pair Count ChartColorful concordant, discordant and tie-count chart.
External References
For software documentation, see SciPy documentation for kendalltau, R documentation for cor.test, IBM SPSS documentation for nonparametric correlations and Microsoft Excel documentation for COUNTIF and SQRT formulas.
FAQs About Kendall's Tau-b
What is Kendall's Tau-b?
Kendall's Tau-b is a nonparametric rank correlation coefficient that measures monotonic association while correcting for tied ranks.
What was the Kendall's Tau-b result in this guide?
The strongest worked pair was G2 vs G3 with Kendall's tau-b = 0.869595, N = 649 and p < .001. This indicates a very strong positive monotonic association.
Why use tau-b instead of tau-a?
Tau-b corrects for ties in both variables. Since grade variables have repeated values, tau-b is more appropriate than tau-a.
Is Kendall's Tau-b the same as Spearman correlation?
No. Kendall's tau-b is based on concordant and discordant pairs with tie correction. Spearman correlation is Pearson correlation applied to ranked values.
Can SPSS calculate Kendall's Tau-b?
Yes. In SPSS, use Nonparametric Correlations and select Kendall's tau-b. SPSS reports the coefficient, two-tailed significance and N.
Can Excel calculate Kendall's Tau-b?
Yes, but it requires pair classification formulas. The Excel workbook in this guide shows concordant pairs, discordant pairs, tie counts and the final tau-b formula.

