
Intra-Rater Reliability: 7 Essential Steps, ICC Formula and Worked Example
Intra-rater reliability measures how consistently the same rater, examiner, coder, instrument operator, or scoring process evaluates the same targets on repeated occasions. This complete guide explains the two-way mixed-effects consistency intraclass correlation coefficient, ICC(3,1), and applies it to 649 paired G1 and G2 observations with verified Python, R, SPSS, and Excel results.
The repeated measurements showed strong single-measure consistency.
The worked intra-rater reliability analysis used a two-way mixed-effects model because the two sessions, G1 and G2, were the fixed occasions of interest. The consistency ICC for one measurement was ICC(3,1) = 0.863451, with a 95% confidence interval from 0.842 to 0.882. The reliability test was statistically significant, F(648, 648) = 13.6468, p < .001. A randomly selected target measured once under one of these fixed sessions would therefore be expected to retain a large proportion of its relative standing across sessions.
The two session means were 11.3991 for G1 and 11.5701 for G2. The average increase of 0.1710 points was statistically detectable, paired t(648) = -2.945, p = .003 for G1 minus G2, but it was small compared with the between-target variation. That distinction is central: consistency can remain high even when one session is systematically a little higher than the other.
What does intra-rater reliability measure?
A repeatability question about measurements made by the same evaluator or scoring process.
Intra-rater reliability, also written intrarater reliability, intra-observer reliability, or intra-examiner reliability, describes the degree to which the same evaluator gives comparable ratings when the same targets are assessed again. The targets might be patients, images, essays, laboratory specimens, movement recordings, interview transcripts, radiographs, behavioral events, or any other units that require human or instrument-assisted scoring.
The practical question
The practical question is simple: when the same rater repeats the measurement under comparable conditions, do the targets keep approximately the same relative positions? A highly reliable rater scores high-performing targets high on both occasions and low-performing targets low on both occasions. A poorly reliable rater changes the ordering unpredictably, even when the targets have not meaningfully changed.
For continuous measurements, intra-rater reliability is often summarized with an intraclass correlation coefficient. The intra-rater reliability coefficient incorporates both association and variance components, so it is more suitable for repeated-measure reliability than relying only on a simple Pearson correlation.
Reliability is not validity
A rater may be highly consistent but consistently wrong. For example, an examiner could always measure a joint angle five degrees too high. The repeated scores would show excellent stability, yet the instrument or technique would be biased. Reliability concerns reproducibility; validity concerns whether the measurement represents the intended quantity accurately.
That distinction is why a complete study often combines an ICC with a difference plot, calibration evidence, criterion comparison, or a Bland-Altman plot. The intra-rater reliability coefficient answers how consistently targets are distinguished, while agreement diagnostics reveal systematic shifts and the size of individual differences.
The keyword questions “what is intra rater reliability,” “what does intra rater reliability mean,” and “what is intra rater reliability in research” all point to the same idea: reproducibility within one evaluator. Readers comparing it with reliability between evaluators should also review Cohen’s kappa, Fleiss kappa, and the broader kappa statistic guide.
When should you use intra-rater reliability?
Use it whenever within-rater repeatability can affect the trustworthiness of a score or decision.
A study should evaluate intra-rater reliability whenever intra-rater reliability could affect conclusions and scores depend on a person’s judgment, tracing, coding decision, landmark placement, visual classification, manual measurement, or instrument positioning. Repeatability matters especially when the same evaluator will score many cases over time or when a measurement will be used for diagnosis, eligibility, research outcomes, or progress monitoring.
Same targets
The same targets must be rated on both occasions so differences can be attributed to repeat measurement rather than different samples.
Same rater
The same person or scoring process performs both sessions. Different raters create an inter-rater design.
Comparable conditions
Instructions, equipment, scale definitions, environment, and target presentation should be controlled.
Appropriate delay
The interval should reduce recall without allowing genuine target change to dominate.
Correct statistic
Choose ICC for continuous values, weighted kappa for ordered categories, or a category-specific agreement method.
Clinical and imaging measurements
Examples include repeated lesion dimensions, ultrasound measurements, radiographic angles, palpation grades, mobility scores, gait-event labels, and image segmentation. The same examiner may place landmarks differently on a second occasion, so intra-rater reliability quantifies that uncertainty.
Education and behavioral coding
A teacher may rescore essays, or a researcher may recode classroom behavior, interview themes, or video events. Continuous totals can use ICC, while ordinal rubrics may require weighted kappa. The operational definitions should be explicit enough that the same coder can apply them consistently.
Laboratory and engineering work
Repeatability can depend on specimen preparation, instrument placement, threshold selection, or manual feature extraction. A strong coefficient supports process stability, but calibration and measurement uncertainty still require separate evaluation.
How to measure intra-rater reliability
Plan two or more repeated sessions, randomize target order, conceal prior scores, retain an appropriate interval, record every score at the target level, inspect differences, then fit a reliability statistic matched to the scale and design. For continuous outcomes with the same fixed rater and fixed sessions, ICC(3,1) is a common consistency model. For nominal classifications, use a chance-corrected method such as Cohen’s kappa. For ordered categories, use weighted kappa and state the weighting scheme.
Do not choose a statistic solely because software makes it easy. The estimand should determine the method. If exact equality of repeated scores is required, use an absolute-agreement ICC and examine differences. If maintaining rank order is the main goal, a consistency ICC is appropriate. This distinction parallels the broader difference between association and agreement discussed in correlation versus regression and correlation assumptions.
Intra-rater reliability assumptions: conditions to check
The method is dependable only when the repeated-rating design, pairing, scale, and ICC model are defensible.
The assumptions of intra-rater reliability are not limited to normality. The most important requirements concern independent targets, comparable repeated conditions, correct pairing, a stable measurement scale, and an ICC model aligned with the intended generalization.
Independent targets
Targets should be independent sampling units. Measurements nested within families, classrooms, clinicians, sites, or repeated body regions may require multilevel modeling or cluster-aware uncertainty.
Paired repeated scores
Every row must join measurements from the same target. Misalignment can create artificially low or misleading reliability.
Comparable conditions
Equipment, instructions, positioning, units, scoring rubric, and target presentation should remain comparable unless the changed condition is part of the design.
No meaningful target change
When the target itself changes between sessions, the coefficient no longer isolates rater repeatability. Select an interval appropriate to the construct.
Relevant target variation
ICC depends on between-target heterogeneity. A restricted sample can yield a lower coefficient even when measurement error is unchanged.
Model-appropriate residuals
Inspect residual differences, heteroscedasticity, extreme pairs, and nonconstant error. Outliers can influence variance components.
Diagnostic checklist
Distributional considerations
ICC is based on variance components and commonly uses F-based confidence intervals. Severe skew, heavy tails, influential outliers, floor effects, or ceiling effects can affect estimation and interpretation. With 649 targets, the estimate is precise, but large n does not correct invalid pairing or a poorly chosen model.
Use histogram interpretation, Q-Q plots, skewness and kurtosis checks, and distance diagnostics when appropriate.
For individual-level use, complement intra-rater reliability with the standard error of measurement and a smallest detectable change. The intra-rater reliability coefficient alone does not express error in the original score units. That is why variance ratios, change distributions, and agreement plots belong in the same report.
Intra-rater reliability hypotheses and practical criteria
The formal null concerns zero reliability, while the practical decision concerns magnitude and precision.
A formal intra-rater reliability hypothesis test asks whether the population ICC exceeds a reference value, commonly zero in standard software output. A useful research report goes beyond the significance decision and evaluates whether the confidence interval is sufficiently high for the intended application.
Null hypothesis
H0: ρICC(C,1) = 0. The repeated sessions do not reliably distinguish targets beyond residual variation.
Alternative hypothesis
H1: ρICC(C,1) > 0. Targets retain some consistent relative ordering across sessions.
Practical criterion
The lower confidence bound should meet a prespecified minimum that reflects the consequences of measurement error.
Example research question
“To what extent does the same scoring process produce consistent G1 and G2 values for the same 649 targets?” The statistical answer is ICC(3,1) = 0.863 with a 95% confidence interval from 0.842 to 0.882.
A stronger protocol question might be: “Is the lower 95% confidence bound above 0.80?” In this example, the observed lower bound of 0.842 satisfies that criterion. The threshold must be justified before analysis rather than selected after seeing the result.
Significance is not adequacy
With 649 targets, even a modest nonzero ICC could be highly significant. A small p-value therefore does not by itself establish acceptable intra-rater reliability. The intra-rater reliability coefficient, interval width, measurement scale, intended decisions, and cost of disagreement determine practical adequacy.
This is the same distinction discussed in the guides to p-values, confidence intervals, effect size, and statistical power.
Intra-rater reliability ICC formula and ANOVA components
ICC(3,1) compares stable between-target variation with residual inconsistency across fixed sessions.
The formula for intra-rater reliability under a two-way mixed-effects consistency model is built from an ANOVA decomposition. Each target has repeated scores across k fixed sessions. The analysis separates stable target differences, fixed session differences, and residual target-by-session inconsistency.
MSR is the target or row mean square, MSE is the residual mean square, and k is the number of fixed sessions. Because the target is consistency, the fixed session mean square does not appear in the denominator.
Why the coefficient is high
The target mean square of 14.932 is much larger than the residual mean square of 1.094. Most of the relevant variability is therefore associated with stable differences among targets rather than unpredictable changes across sessions. This produces a high ratio of reliable target variance to total consistency variance.
The F statistic of 13.647 is the same ratio before it is transformed onto the 0-to-1 reliability scale. With 648 numerator and 648 denominator degrees of freedom, the p-value is approximately 4.73 × 10−195.
Average-measures formula
For k = 2, the result is (14.931623 − 1.094148)/14.931623 = 0.926723, reported by SPSS as 0.927.
The average-measures estimate describes the reliability of the mean of G1 and G2. It should not replace the single-measure coefficient when future practice uses one score.
A reliable calculation should preserve full precision until reporting. Premature rounding of mean squares can change the final digits of the coefficient. The workbook, Python report, R report, and SPSS output all reconcile to the same result, which provides stronger verification than relying on a single software display.
Intra-rater reliability worked example and data structure
The 649 paired G1 and G2 records show how repeated measurements must be aligned and documented.
Correct row alignment is essential for intra-rater reliability. G1 and G2 in the same row must refer to the same target. Sorting one session independently, deleting rows from only one column, or merging files without a stable identifier would destroy the repeated-measures pairing and produce a meaningless coefficient.
| Variable | Role | Scale | Observed summary | Interpretation |
|---|---|---|---|---|
| Target ID | Independent unit | Identifier | 649 targets | Each target contributes one paired G1-G2 record. |
| G1 | Fixed session 1 | Numeric, 0 to 19 | Mean 11.399; SD 2.745; median 11 | First repeated score from the same process. |
| G2 | Fixed session 2 | Numeric, 0 to 19 | Mean 11.570; SD 2.914; median 11 | Second repeated score from the same process. |
| Target mean | Stable target level | Derived numeric | Mean 11.485; SD 2.732 | Average of G1 and G2 for each target. |
| Change | Session difference | Derived numeric | Mean 0.171; SD 1.479; range −9 to 11 | G2 minus G1; used to inspect bias and unusual changes. |
Direction of change
G2 exceeded G1 for 273 targets, the two scores were equal for 189 targets, and G2 was lower for 187 targets. The most frequent changes were +1 for 201 targets, 0 for 189 targets, and −1 for 135 targets. This concentration around zero supports repeatability, while a small number of extreme changes deserve case-level review.
Missing values
The verified analysis retained all 649 rows, with no paired observations excluded. In other datasets, the analysis set should be defined before calculation. Complete-case deletion can narrow the target population if missingness is related to score level, difficulty, or rater confidence.
Measurement scale
ICC assumes the numeric differences are meaningful. If scores are merely nominal labels, use a categorical agreement coefficient. If values are ordered categories with meaningful closeness, weighted kappa may be preferable. See categorical and quantitative variables.
Descriptive summaries belong beside the ICC because they reveal scale range, floor or ceiling effects, and systematic shifts. Related guidance is available in descriptive statistics, mean, median, and mode, standard deviation, variance, and outlier detection.
Intra-rater reliability statistics, results and interpretation
The verified coefficient is strong, while the paired-session analysis detects a small fixed mean shift.
The worked intra-rater reliability calculation begins with 649 complete G1-G2 pairs. The two session distributions have nearly identical centers and spreads. G1 has a mean of 11.399 and standard deviation of 2.745; G2 has a mean of 11.570 and standard deviation of 2.914. Their Pearson correlation is 0.865, showing strong linear association, but the ICC provides the model-based reliability estimate.
Verified single-measure result
95% CI: 0.842 to 0.882
The result indicates strong consistency of target ordering across the two fixed sessions. The lower confidence bound remains above 0.84, so the evidence is not limited to a high point estimate.
Mean difference and paired test
The average change G2 − G1 is 0.1710 points. SPSS reports the paired difference in the opposite direction, G1 − G2 = −0.171, with a 95% confidence interval from −0.285 to −0.057 and t(648) = −2.945, p = .003. The large sample makes a small mean shift statistically detectable.
This does not contradict high intra-rater reliability. The consistency ICC removes the fixed session effect from the denominator. Most targets can preserve their ordering while all scores move slightly upward. An intra-rater reliability report should therefore state both the ICC and the mean-difference evidence.
Individual change pattern
The change distribution is centered near zero. About 29.1% of targets have no change, 31.0% increase by one point, 20.8% decrease by one point, 7.4% increase by two, and 6.2% decrease by two. Only a small minority show changes larger than three points.
Extreme changes range from −9 to +11. Those cases may reflect genuine change, recording error, altered conditions, or instability at the target level. The ICC summarizes the full sample and should be accompanied by case-level difference review when individual decisions matter.
| Result | Value | What it answers | Reporting caution |
|---|---|---|---|
| ICC(3,1) | 0.863451 | How reliable is one measurement for preserving target order? | Applies to these fixed sessions and the consistency definition. |
| ICC(3,2) | 0.926723 | How reliable is the mean of both measurements? | Use only if future decisions average two scores. |
| Pearson r | 0.864982 | How strongly are the two sessions linearly associated? | Does not penalize constant or proportional disagreement. |
| Mean change | +0.171032 | Is there a systematic session shift? | Statistically significant but small in score units. |
| Residual MS | 1.094148 | How much target-by-session inconsistency remains? | Depends on the score scale and data quality. |
Intra-rater reliability in Python: complete calculation and charts
Python reproduces the ICC, ANOVA components, fixed session means, target means, and final verification.
A transparent Python workflow for intra-rater reliability should read paired columns, verify complete rows, calculate the two-way mixed ANOVA components, compute ICC(3,1), preserve full numeric precision, and produce diagnostics rather than returning only one coefficient.
import numpy as np
import pandas as pd
from scipy.stats import fdf = pd.read_csv("dataset.csv")
wide = df[["G1", "G2"]].dropna().astype(float)
Y = wide.to_numpy()
n, k = Y.shape
grand = Y.mean()
target_means = Y.mean(axis=1)
session_means = Y.mean(axis=0)
ss_targets = k * np.sum((target_means - grand) ** 2)
ss_sessions = n * np.sum((session_means - grand) ** 2)
ss_error = np.sum((Y - target_means[:, None] - session_means + grand) ** 2)
ms_targets = ss_targets / (n - 1)
ms_sessions = ss_sessions / (k - 1)
ms_error = ss_error / ((n - 1) * (k - 1))
icc_3_1 = (ms_targets - ms_error) / (ms_targets + (k - 1) * ms_error)
f_statistic = ms_targets / ms_error
p_value = f.sf(f_statistic, n - 1, (n - 1) * (k - 1))
print(icc_3_1, f_statistic, p_value)
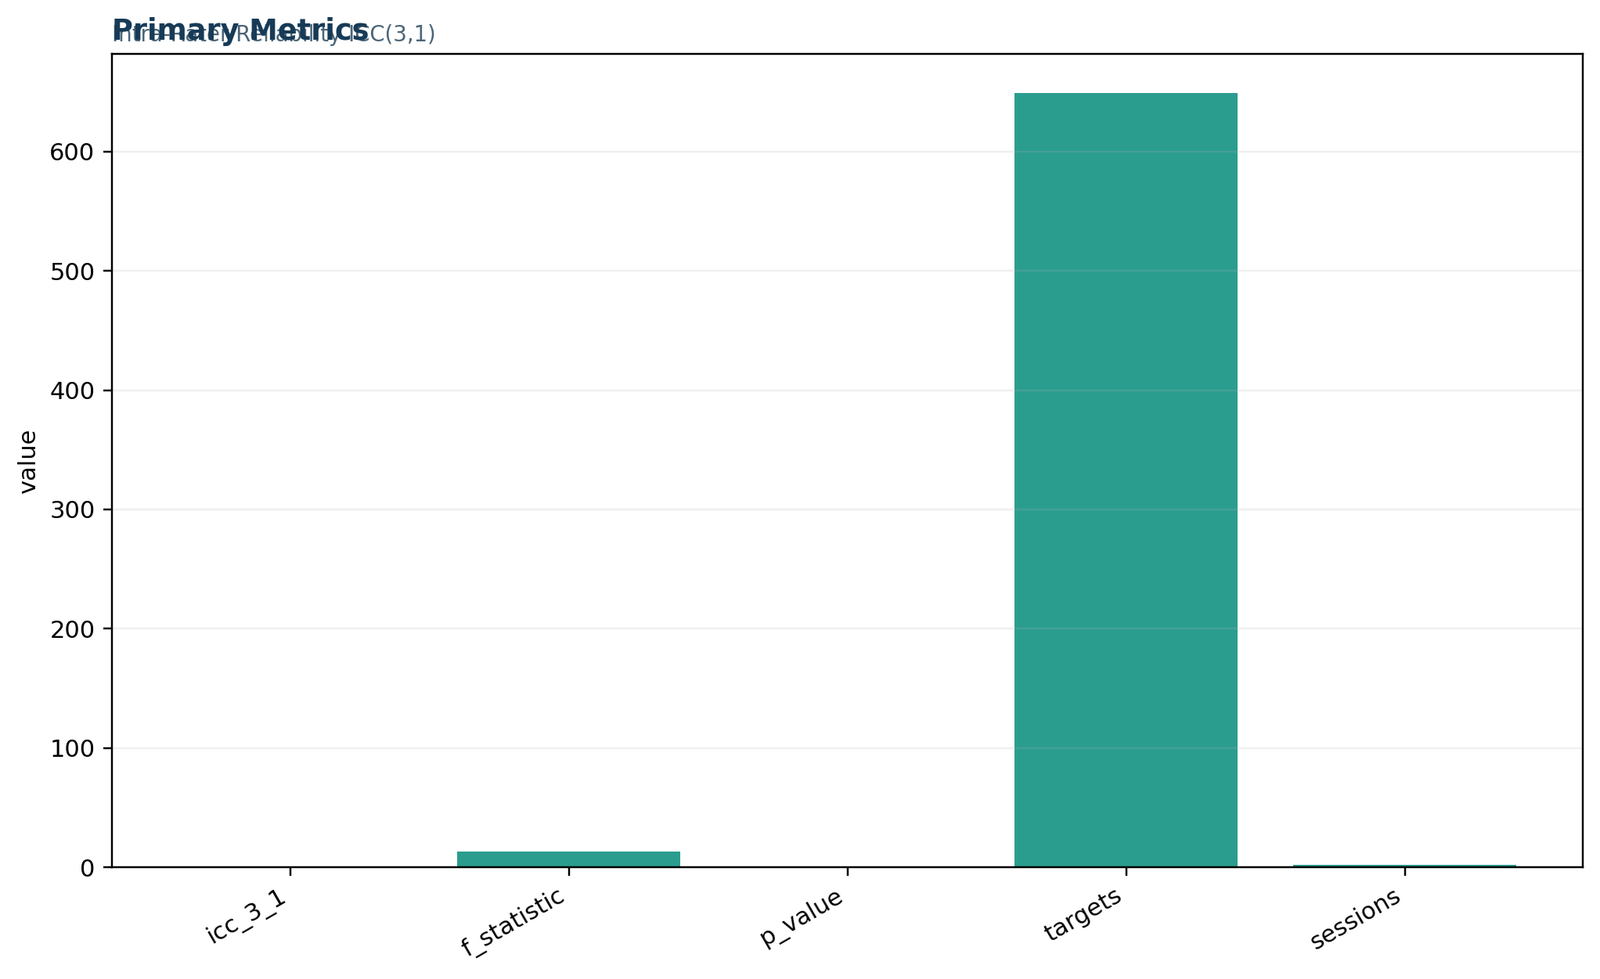
Python chart 1: primary metrics
The first Python chart places ICC(3,1), F, p, target count, and session count on one raw-value axis. The target count of 649 dominates visually, while the ICC of 0.863, two sessions, and the extremely small p-value appear near the baseline. The chart is useful as an inventory check, not for comparing magnitudes that have different units. Read the printed values: ICC = 0.863451, F = 13.646808, p = 4.73 × 10−195, targets = 649, sessions = 2.
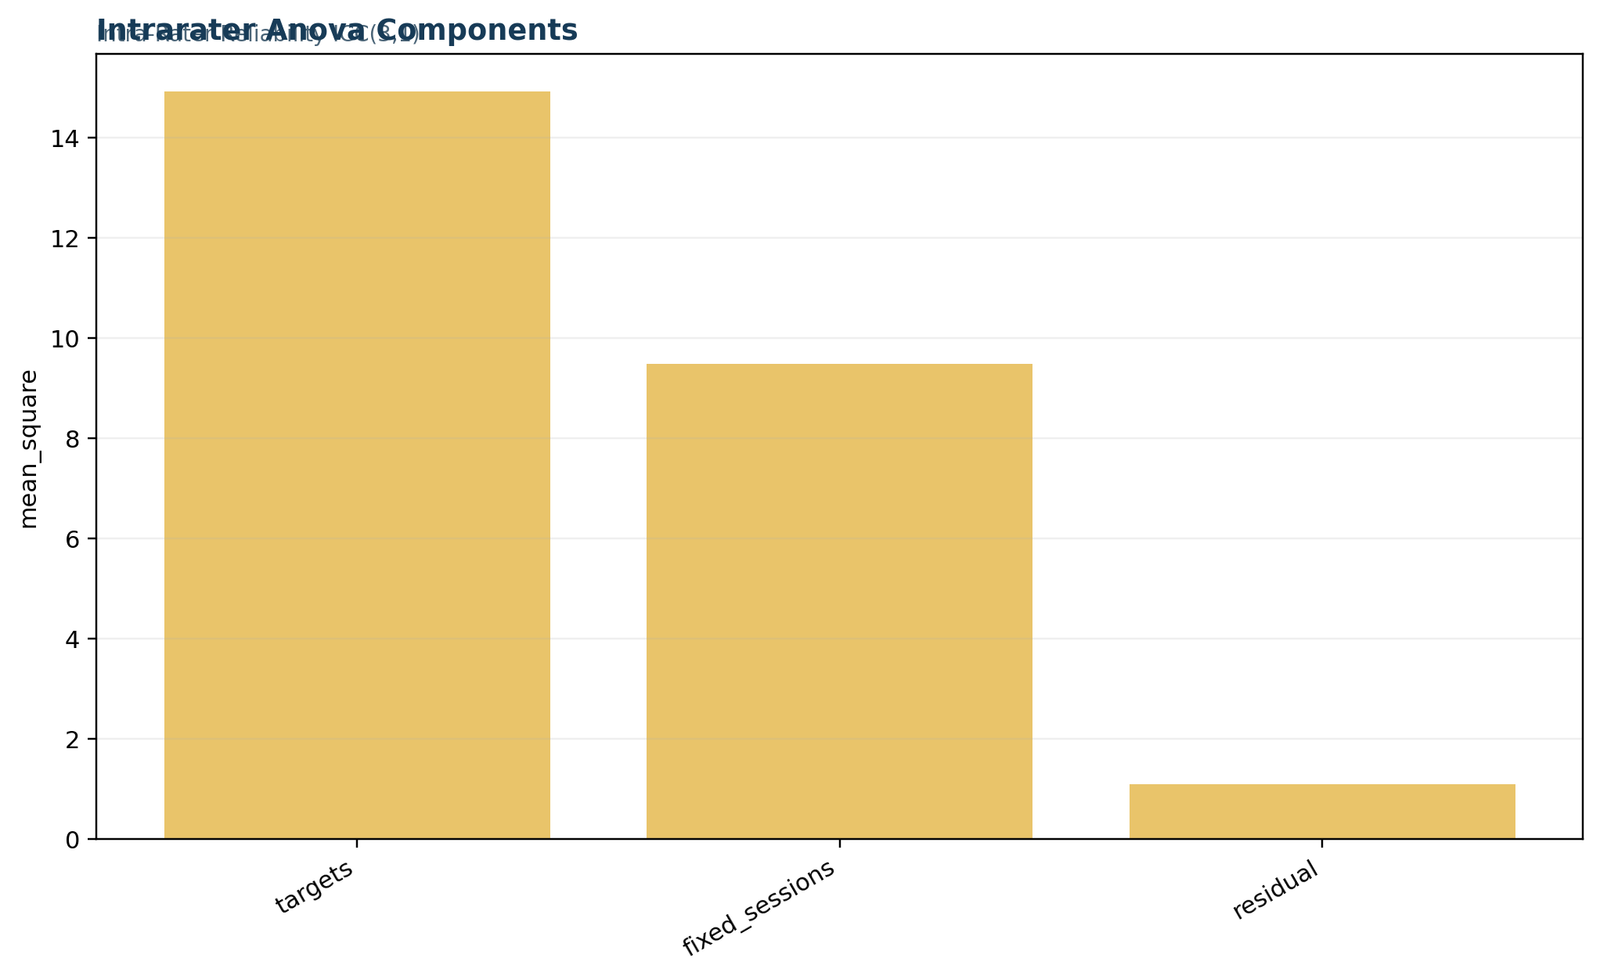
Python chart 2: ANOVA components
The target mean square is 14.9316, the fixed-session mean square is 9.4923, and the residual mean square is 1.09415. The large target-to-residual contrast is the mathematical reason for strong intra-rater reliability. The session component is separated because G1 and G2 are fixed occasions; it does not enter the consistency ICC denominator.
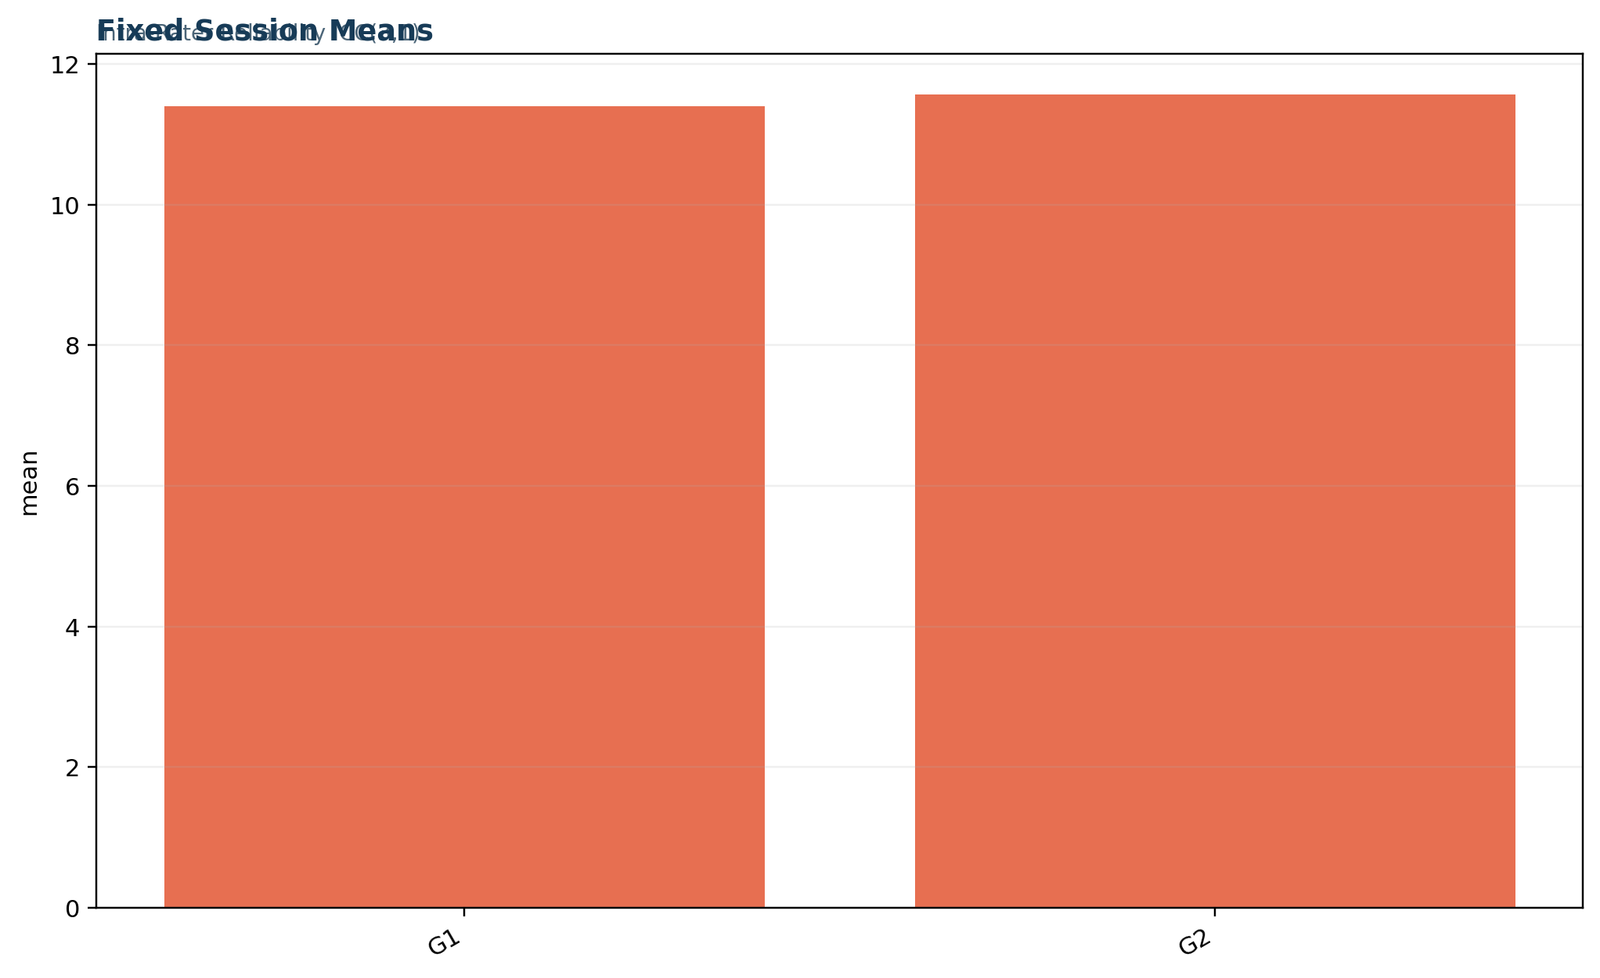
Python chart 3: fixed session means
G1 averages 11.3991 and G2 averages 11.5701. The bars are close, but G2 is 0.1710 points higher. The paired test detects this shift because the sample is large. The chart therefore prevents an overly simple claim that a high ICC means the session means are identical.
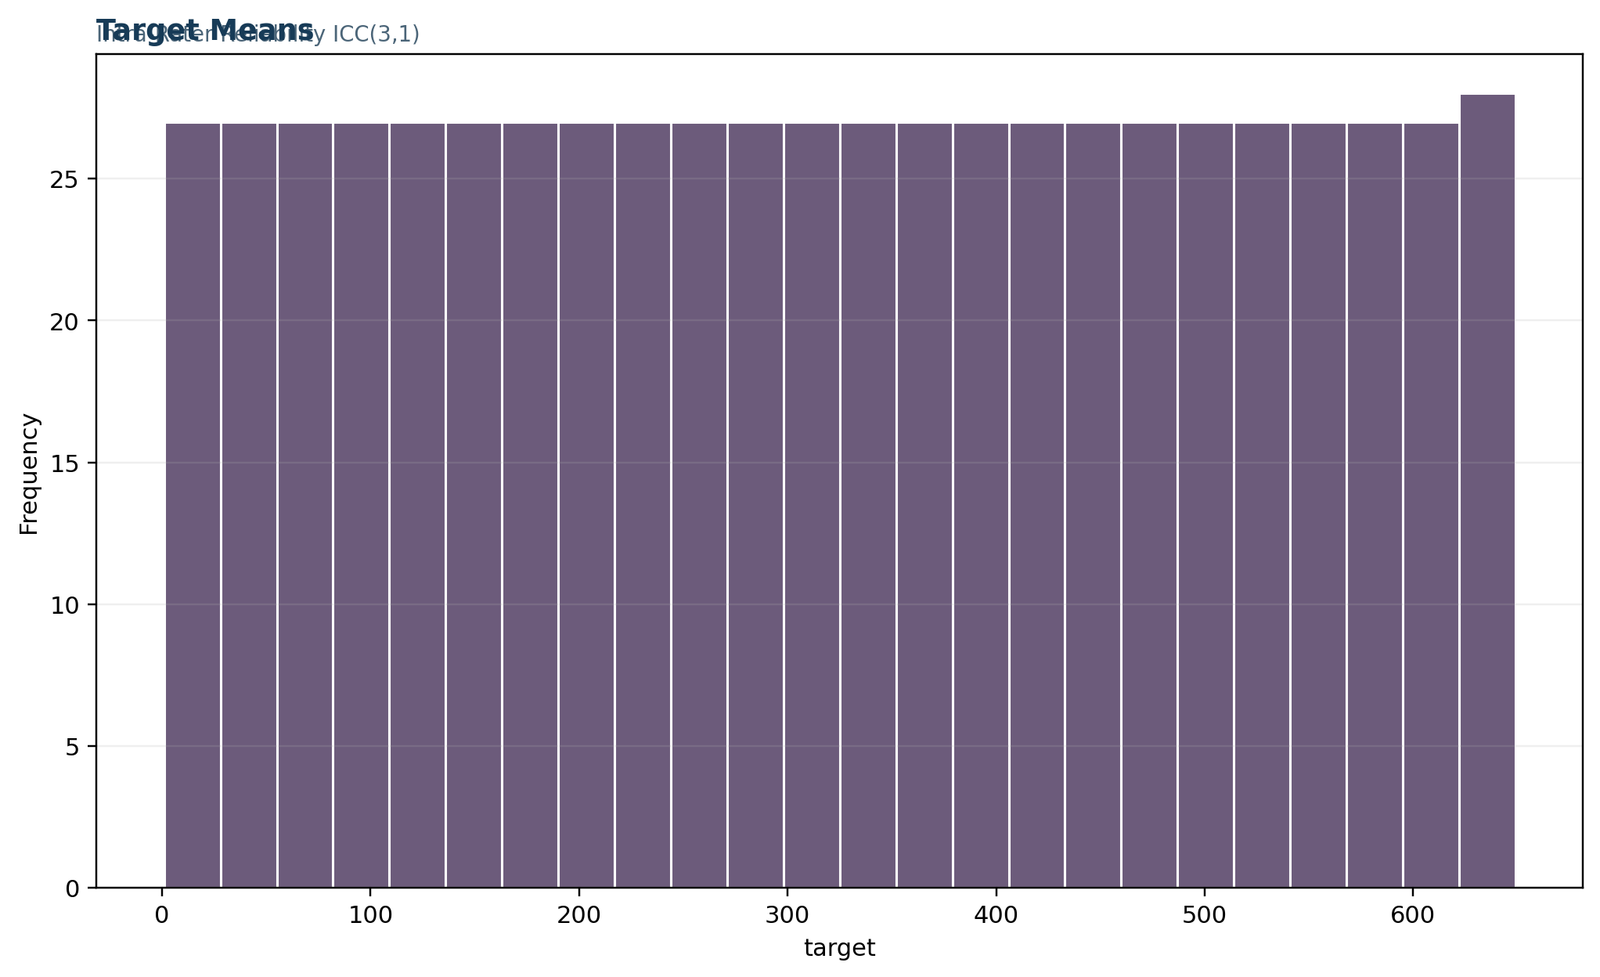
Python chart 4: target coverage panel
The horizontal axis is labeled target and spans the 649 target indices. The nearly uniform bin heights reflect coverage of sequential target IDs rather than the substantive distribution of target mean scores. Interpret this panel as a completeness check confirming representation across the target index. The actual target means range from 2.0 to 18.5, with a median of 11.5 and mean of 11.4846.
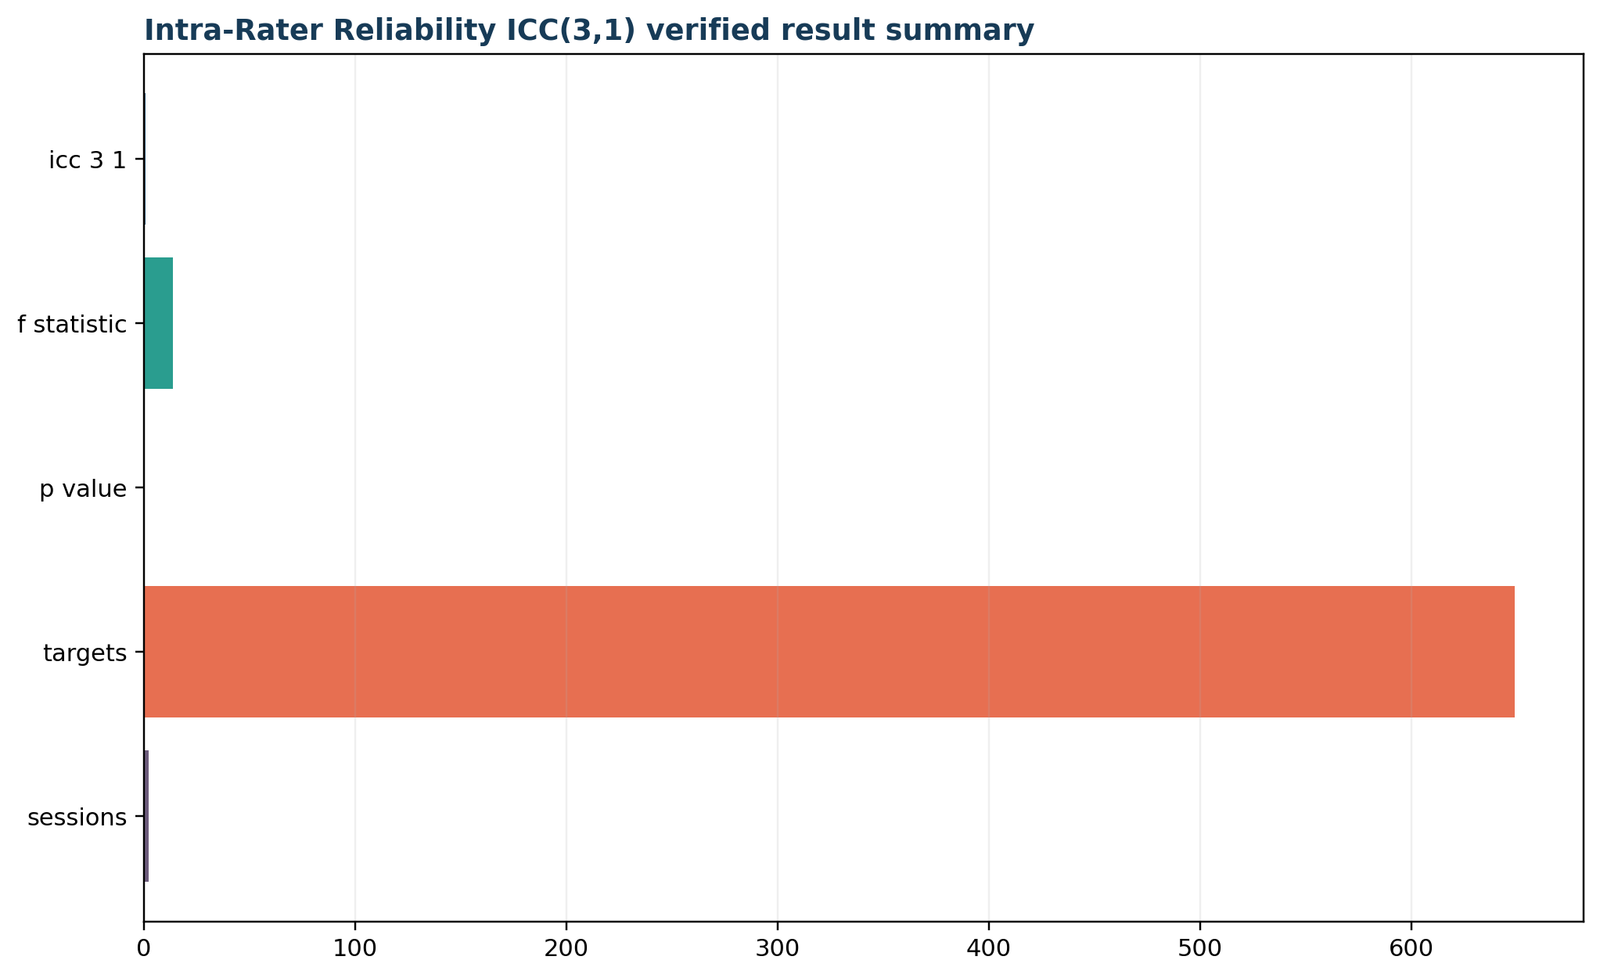
Python chart 5: verified result summary
The final horizontal summary repeats the five verified outputs. Again, the target count dominates the common scale, so the labels and report values carry the interpretation. Agreement between the calculation and independent reference values is exact to displayed precision, supporting reproducibility of the ICC, F statistic, p-value, target count, and session count.
Intra-rater reliability in R: complete calculation and charts
R independently confirms the same two-way mixed consistency result and variance decomposition.
An R analysis of intra-rater reliability can use a validated ICC function or reproduce the ANOVA formula directly. The direct calculation is valuable because package functions differ in model labels, argument names, and output conventions. Always verify that the returned model corresponds to two-way mixed effects, consistency, and a single measurement.
dat <- read.csv("dataset.csv")
Y <- as.matrix(na.omit(dat[c("G1", "G2")]))
n <- nrow(Y)
k <- ncol(Y)grand <- mean(Y)
target_means <- rowMeans(Y)
session_means <- colMeans(Y)
ss_targets <- k * sum((target_means - grand)^2)
ss_sessions <- n * sum((session_means - grand)^2)
ss_error <- sum((Y - target_means - rep(session_means, each=n) + grand)^2)
ms_targets <- ss_targets / (n - 1)
ms_sessions <- ss_sessions / (k - 1)
ms_error <- ss_error / ((n - 1) * (k - 1))
icc_3_1 <- (ms_targets - ms_error) /
(ms_targets + (k - 1) * ms_error)
F_value <- ms_targets / ms_error
p_value <- pf(F_value, n - 1, (n - 1) * (k - 1), lower.tail=FALSE)
R chart 1: primary metrics
The R verification reports ICC(3,1) = 0.863451474627096, F = 13.6468077523221, p = 4.72653099912029 × 10−195, 649 targets, and two sessions. The mixed units share one axis, so the plot should be read as an output checklist. The exact agreement with Python confirms that both implementations use the same rows, model, and formula.
R chart 2: ANOVA components
The R mean-square decomposition matches Python: targets 14.9316, fixed sessions 9.4923, residual 1.09415. The residual component is small relative to stable target variability. That structure produces a high consistency coefficient and an F ratio of 13.6468.
R chart 3: fixed session means
The repeated means of 11.3991 and 11.5701 show that the measurement process is close in level but not exactly equal. The consistency model allows this fixed shift. An absolute-agreement analysis and difference plot would give the shift direct weight when identical score levels are required.
R chart 4: target coverage panel
The displayed histogram uses target indexing on the horizontal axis, producing near-uniform bin counts. It confirms that the full target sequence is represented but should not be described as the distribution of mean scores. The substantive target-mean summary is mean 11.4846, SD 2.7324, median 11.5, and range 2.0 to 18.5.
R chart 5: verified result summary
The verified R summary reconciles every primary value with the independent reference ledger. Exact cross-platform agreement reduces the risk of a transposed matrix, wrong degrees of freedom, incorrect ICC model, or rounded p-value being mistaken for the analytical result.
Package output checks
When using an R package, inspect the printed description rather than assuming that a function’s default is ICC(3,1). Confirm whether “consistency” or “agreement” was selected, whether single or average ratings are reported, and whether confidence intervals use the desired method. Package labels may follow Shrout-Fleiss, McGraw-Wong, or descriptive conventions.
Numerical precision
R returns a p-value near 4.73 × 10−195. Printing it as 0 discards information. Use scientific notation or report p < .001 in narrative text while preserving the exact value in reproducibility files.
Readers working in R may continue with correlation in R, ANOVA in R, regression in R, and nonparametric tests in R.
How to calculate intra-rater reliability in SPSS
SPSS reports the ICC, confidence interval, F test, paired-session statistics, and change distribution.
The keyword “how to calculate intra rater reliability in SPSS” usually refers to the Reliability Analysis procedure. The data should be in wide format with one row per target and one column per repeated session. In this example, the analysis variables are G1 and G2.
SPSS menu workflow
Expected SPSS output
RELIABILITY

/VARIABLES=G1 G2

/SCALE('Fixed sessions') ALL

/MODEL=ALPHA

/STATISTICS=DESCRIPTIVE SCALE CORR

/SUMMARY=TOTAL

/ICC=MODEL(MIXED) TYPE(CONSISTENCY) CIN=95 TESTVAL=0.T-TEST PAIRS=G1 WITH G2 (PAIRED)

/CRITERIA=CI(.95).
| SPSS table | Key result | Interpretation |
|---|---|---|
| Item Statistics | G1 M = 11.40, SD = 2.745; G2 M = 11.57, SD = 2.914 | Session levels and spread are similar. |
| Inter-Item Correlation Matrix | r = 0.865 | Strong association between repeated scores. |
| Intraclass Correlation Coefficient | Single = .863, CI [.842, .882] | Primary intra-rater reliability result. |
| Average Measures | .927, CI [.915, .937] | Reliability of the average of both sessions. |
| Paired Samples Test | G1 − G2 = −.171, t(648) = −2.945, p = .003 | Small fixed session difference. |
With two items, SPSS Cronbach’s alpha and the average-measures consistency ICC are numerically aligned in this design. That does not make Cronbach’s alpha a general substitute for an ICC. Alpha is typically framed as internal consistency, while the ICC explicitly represents the target-session reliability design. The corrected item-total correlation also answers a different scale-analysis question.
Intra-rater reliability in Excel: worked and auditable calculation
The workbook preserves raw paired scores, formulas, ANOVA components, diagnostics, and verification checks.
An intra-rater reliability Excel workbook is valuable when the calculation must be auditable. Rather than placing one hard-coded ICC in a summary cell, the workbook should preserve raw scores, derive target means and changes, calculate ANOVA quantities, document the model, and compare results with independent software.
| Workbook sheet | Purpose | Main content | Quality-control value |
|---|---|---|---|
| Guide | Method documentation | Design, null hypothesis, formula, variables, 649 source rows, and alpha. | Prevents the number from being separated from its model definition. |
| Data_Input | Raw aligned observations | G1 and G2 pairs for all targets. | Preserves unchanged source values. |
| Working | Row-level derivations | Target mean, change, and centered change. | Allows tracing from each raw pair to derived quantities. |
| Calculations | Metric ledger | ICC, F, p, target count, session count, and named formula. | Matches independently verified Python and R values. |
| Diagnostics | Scope checks | Model identity, row count, variables, missing-data rule, interpretation. | Confirms this is ICC(3,1), not an unnamed coefficient. |
| Reporting | Final comparison | Workbook result, reference value, and absolute difference. | All displayed differences equal zero. |
Core Excel calculations
For each target, calculate the row mean with =AVERAGE(G1_cell,G2_cell) and the change with =G2_cell-G1_cell. Calculate session means, the grand mean, target sum of squares, session sum of squares, and residual sum of squares. Divide by the correct degrees of freedom to obtain the three mean squares.
The primary formula is =(MSR-MSE)/(MSR+(k-1)*MSE). The F statistic is =MSR/MSE. The upper-tail p-value uses the F distribution with 648 and 648 degrees of freedom.
Verification targets
Excel can calculate the coefficient, but it does not automatically ensure the model is scientifically appropriate. The analyst still must justify fixed versus random effects, consistency versus agreement, and single versus average measures. Readers may compare the workflow with correlation in Excel, ANOVA effect size, and confidence interval formulas.
Choosing the correct ICC model for intra-rater reliability
Model choice depends on the effects structure, consistency versus agreement, and single versus averaged measurements.
The phrase “intra rater reliability ICC” is incomplete unless the model is named. An ICC label should communicate four decisions: the ANOVA structure, whether raters or sessions are random or fixed, whether consistency or absolute agreement is targeted, and whether reliability refers to a single rating or the average of several ratings.
| Decision | Question | Worked choice | Why it matters |
|---|---|---|---|
| Effects model | Are targets random, and are sessions or raters fixed? | Two-way mixed effects | The 649 targets represent a broader population, while G1 and G2 are the fixed sessions being evaluated. |
| Definition | Must repeated values be identical, or only consistently ordered? | Consistency | A constant session shift is excluded from the error denominator. |
| Unit | Will decisions use one rating or an average? | Single measure | ICC(3,1) describes the reliability of one session score. |
| Additional result | Would the average of both sessions be used? | Average measures | ICC(3,2) is 0.927, reflecting improved reliability after averaging. |
ICC(1,1): one-way random
This model is useful when each target may be rated by a different random set of raters and rater identity cannot be separated from residual error. It is generally not the preferred model for a controlled intra-rater reliability study with the same known evaluator and repeated fixed sessions.
ICC(2,1): two-way random, agreement
This model treats both targets and raters as random and asks whether ratings agree absolutely. It supports generalization to a wider rater population. It is common in inter-rater studies but can be inappropriate when the specific rater is the only evaluator of interest.
ICC(3,1): two-way mixed, consistency
This model treats target effects as random and the selected sessions or rater effect as fixed. It evaluates whether targets preserve their relative ordering. The worked intra-rater reliability analysis uses this model.
Why consistency was chosen
G2 was on average 0.171 points higher than G1. A consistency model does not count that fixed shift as random unreliability, because every target could move upward by the same amount while keeping exactly the same ordering. In practice, this is appropriate when relative discrimination is the primary purpose, such as ranking, screening, or comparing individuals to one another.
However, a clinical device intended to reproduce the same physical value might require absolute agreement. In that setting, a fixed shift can be consequential even when the ordering is stable. Report the selected definition rather than writing only “ICC = .86.”
Single versus average measurement
ICC(3,1) estimates reliability for one score. ICC(3,2) estimates reliability for the mean of two sessions. Averaging reduces unsystematic error, so the average-measures coefficient is higher. In this example, the single-measure estimate is 0.863 and the two-session average estimate is 0.927.
Report the coefficient that matches actual use. A study cannot claim the 0.927 reliability of an average if future decisions will be based on only one measurement.
Intra-rater reliability versus related reliability and agreement methods
ICC, correlation, kappa, alpha, test-retest reliability, and agreement plots answer different questions.
The search terms “inter vs intra rater reliability,” “test retest vs intra rater reliability,” and “intra rater reliability kappa” reflect common confusion. Choosing among these methods requires attention to who rates, what scale is used, whether score equality matters, and whether the goal is reliability, association, or internal consistency.
| Method | Best suited to | Main question | Why it differs from ICC(3,1) |
|---|---|---|---|
| Intra-rater ICC | Continuous repeated scores from the same rater | Does the same evaluator consistently distinguish targets? | Directly models target and session variance. |
| Inter-rater ICC | Continuous scores from multiple raters | Do different evaluators produce reliable scores? | Rater sampling and generalization are different. |
| Pearson correlation | Linear association | Do high values in one session accompany high values in the other? | Can be high despite systematic disagreement. |
| Cohen’s or weighted kappa | Nominal or ordinal categories | Does category agreement exceed chance? | Uses category matches rather than continuous variance. |
| Cronbach’s alpha | Internal consistency of scale items | Do items behave as a coherent scale? | Not designed primarily as a repeated-rater agreement coefficient. |
| Bland-Altman analysis | Continuous method agreement | What are the mean bias and limits of individual differences? | Describes differences in score units rather than a variance ratio. |
| Paired t-test | Mean session shift | Is the average difference nonzero? | Does not quantify target-order repeatability. |
Intra-rater versus inter-rater reliability
Intra-rater reliability repeats measurements by the same evaluator; inter-rater reliability compares different evaluators. A study may need both. A rater can be highly self-consistent yet systematically different from colleagues, or a group can agree on average while individual raters are internally unstable.
When multiple raters classify nominal outcomes, use Fleiss kappa or another multi-rater method. When two raters classify categories, use Cohen’s kappa or weighted kappa for ordered categories.
Intra-rater versus test-retest reliability
The concepts overlap when the same rater repeats the same instrument over time. Test-retest reliability emphasizes stability of the instrument or construct across occasions. Intra-rater reliability emphasizes consistency of the evaluator’s judgments. If targets can truly change between sessions, the observed coefficient combines rater inconsistency with genuine temporal change.
The retest interval should therefore be long enough to reduce memory but short enough to limit real change. The appropriate interval depends on the target, task, and risk of recall.
Why correlation is not enough
Suppose the second session always adds five points. Pearson r can equal 1 because the ordering is unchanged, even though the scores do not agree absolutely. A consistency ICC may also remain high, while an absolute-agreement ICC and difference analysis penalize the shift. State which property matters for the decision.
Why alpha is not enough
With two repeated columns, alpha can numerically match an average-measures consistency ICC, as it does here at approximately 0.927. The interpretation still differs. Alpha treats columns as items in a scale; ICC describes reliability under a target-by-session design. Use the statistic whose model matches the study.
Related reading includes correlation matrices, Spearman rank correlation, Kendall’s tau-b, and contingency coefficients.
Diagnostics, sensitivity checks and ways to improve intra-rater reliability
Inspect pairing, session shifts, target heterogeneity, outliers, protocol drift, and avoidable measurement variation.
The questions “how to improve intra rater reliability” and “how to increase intra rater reliability” should be answered by strengthening the measurement process, not by selecting a more favorable statistic. Improvements should reduce avoidable variation while preserving honest target differences.
Diagnostic checks for this worked analysis
Sensitivity questions
Before data collection
During repeated rating
Use disagreement feedback
After a pilot, identify targets with large repeated differences. Review whether they share ambiguous boundaries, poor image quality, difficult scale regions, or procedural inconsistencies. Update the manual before the definitive reliability study.
Match precision to reality
Excessive decimal places can create apparent disagreement from meaningless noise. Define a defensible measurement resolution and use the same rounding rule in every session.
Re-estimate after changes
Training improvements should be evaluated on new or re-randomized targets. Reusing the same easily remembered cases can exaggerate improvement through recall.
A larger number of targets narrows the confidence interval, but sample size does not repair systematic bias or ambiguous scoring rules. Plan sample size around the desired interval precision and minimum acceptable reliability. Consider a target spectrum that represents the population where the method will actually be used.
How to report intra-rater reliability in APA style
A complete statement names the design, ICC model, coefficient, confidence interval, sample, sessions, and relevant difference diagnostics.
An APA-style intra-rater reliability statement should be reproducible without requiring the reader to guess which ICC was used. Report the effects model, agreement definition, measurement unit, point estimate, confidence interval, and F test. Describe the rater and retest protocol in the methods section.
APA-style result for the worked example
Intra-rater reliability across the two fixed sessions, G1 and G2, was estimated with a two-way mixed-effects, consistency, single-measure intraclass correlation coefficient. Reliability was strong, ICC(3,1) = .863, 95% CI [.842, .882], F(648, 648) = 13.647, p < .001, based on 649 complete targets. The mean score increased slightly from G1 (M = 11.40, SD = 2.75) to G2 (M = 11.57, SD = 2.91), mean change = 0.17 points. A paired comparison of G1 minus G2 was significant, t(648) = -2.95, p = .003, 95% CI [-0.29, -0.06]. The average-measures reliability of the two-session mean was ICC(3,2) = .927, 95% CI [.915, .937].
Methods information to include
Common reporting errors
| Report element | Worked value | Reason |
|---|---|---|
| Model | Two-way mixed effects | Sessions are fixed, targets are random. |
| Definition | Consistency | Relative target ordering is the estimand. |
| Unit | Single measurement | Primary reliability concerns one score. |
| ICC and CI | .863 [.842, .882] | Magnitude and uncertainty. |
| F test | F(648,648) = 13.647, p < .001 | Evidence against zero reliability. |
| Session descriptives | 11.40 versus 11.57 | Reveals level shift. |
| Average measures | .927 [.915, .937] | Useful only when averaging both sessions. |
Use leading zeros consistently according to the journal’s style and avoid reporting p = .000. Confidence intervals should retain enough precision to support interpretation. The report can also include a difference plot and the proportion of exact or near matches when those summaries are meaningful on the score scale.
Intra-rater reliability PDF, Excel and software downloads
Use the verified reports and worked workbook to reproduce every primary result.
The downloadable intra-rater reliability files separate software-specific outputs from the shared statistical interpretation. The Python and R reports retain full precision, the SPSS PDF shows official tables and confidence intervals, and the Excel workbook exposes the formula ledger and row-level calculations.
Verified intra-rater reliability sources and calculation checks
The reported result is supported by the SPSS tables, the worked Excel ledger, and independent Python and R calculations.
The intra-rater reliability result should be traceable from raw paired observations to the final ICC. The verification record below identifies the evidence used for the coefficient, confidence interval, ANOVA quantities, correlation, paired mean difference, and session-change distribution.
SPSS verification
The Reliability procedure reports 649 valid cases, single-measure ICC = 0.863, 95% CI [0.842, 0.882], average-measures ICC = 0.927, and F(648, 648) = 13.647.
Workbook verification
The worked Excel analysis exposes the aligned G1-G2 pairs, row-level target means and changes, ANOVA sums of squares, mean squares, ICC formula, and software comparison ledger.
Cross-software verification
Python and R reproduce ICC(3,1) = 0.863451, the same ANOVA components, the same session summaries, and the same interpretation of strong consistency.
| Verified quantity | Value | Evidence used | Reporting role |
|---|---|---|---|
| Targets and sessions | 649 targets; 2 sessions | SPSS case processing and workbook input | Defines the repeated-measure design. |
| Single-measure ICC | 0.863451 | Python, R, SPSS, and Excel | Primary intra-rater reliability estimate. |
| 95% confidence interval | 0.842 to 0.882 | SPSS ICC table | Shows precision and the plausible population range. |
| Average-measures ICC | 0.9267 | SPSS and formula conversion | Reliability of the mean of both sessions. |
| Session correlation | 0.865 | SPSS correlation table | Association check, not a substitute for ICC. |
| Mean session change | 0.171 points | SPSS paired test and workbook | Documents the small fixed shift separately from consistency. |
Intra-rater reliability FAQs
Answers to common definition, model-selection, interpretation, and software questions.
What is intra-rater reliability?
Intra-rater reliability is the consistency of repeated measurements made by the same rater, examiner, coder, or scoring process on the same targets. It asks whether the evaluator can reproduce target distinctions across occasions. Continuous outcomes are commonly summarized with an ICC; categories require kappa or another agreement statistic.
How do you calculate intra-rater reliability?
Arrange repeated scores in aligned columns, one row per target. For continuous data, select an ICC model. The worked calculation uses ICC(3,1) = (MSR − MSE)/[MSR + (k − 1)MSE], where MSR is the target mean square, MSE is residual mean square, and k is the number of fixed sessions. Here the result is 0.863451.
Which ICC should be used for intra-rater reliability?
The correct ICC depends on design. ICC(3,1), a two-way mixed-effects consistency single-measure model, is appropriate when the same fixed rater or sessions are the only ones of interest and relative consistency is the goal. Use an absolute-agreement form when repeated values must match in level, and use an average-measures form only if future decisions use an average.
What is a good intra-rater reliability value?
There is no universal cutoff. Values from 0.75 to 0.90 are often described as strong, and values above 0.90 as very strong, but adequacy depends on the decision, score scale, population, and consequences of error. Evaluate the lower confidence bound and agreement in original units rather than using the point estimate alone.
How should ICC(3,1) = 0.863 be interpreted?
It indicates strong consistency for one measurement across the two fixed sessions. Targets generally preserve their relative ordering, and stable between-target variance is much larger than residual target-by-session inconsistency. The 95% confidence interval from 0.842 to 0.882 shows that the population value is likely to remain in a strong range.
Why is the average-measures ICC higher?
Averaging repeated measurements reduces unsystematic error. The single-measure coefficient is 0.863, while the reliability of the two-session average is approximately 0.927. Use the higher value only when the operational score will actually be the mean of both sessions.
Can intra-rater reliability be high when session means differ?
Yes. A consistency ICC can remain high when one session is consistently higher or lower, because it focuses on preservation of target order. In this example, G2 is 0.171 points higher on average, yet ICC(3,1) is 0.863. Use absolute agreement and difference analysis when equality of score level matters.
What is the difference between intra-rater and inter-rater reliability?
Intra-rater reliability evaluates repeatability within the same evaluator. Inter-rater reliability evaluates agreement or consistency across different evaluators. A complete measurement study may need both because a rater can be self-consistent but differ systematically from other raters.
What is the difference between intra-rater and test-retest reliability?
Test-retest reliability emphasizes stability of an instrument or construct across time. Intra-rater reliability emphasizes stability of the evaluator’s judgments. They overlap when the same rater repeats the same instrument, but genuine target change between sessions can reduce test-retest reliability even if the evaluator is consistent.
Can kappa be used for intra-rater reliability?
Yes, when repeated outcomes are categorical. Use Cohen’s kappa for nominal categories rated twice by the same evaluator, or weighted kappa for ordered categories when near disagreements should receive partial credit. Continuous numeric measurements are generally better analyzed with an ICC and agreement diagnostics.
How do I calculate intra-rater reliability in SPSS?
Use Analyze → Scale → Reliability Analysis, enter the repeated session variables, request intraclass correlation, select a two-way mixed model, choose consistency, and report single measures with the 95% confidence interval. In this example, SPSS reports ICC = .863, 95% CI [.842, .882], F(648,648) = 13.647, p < .001.
What should be reported besides the ICC?
Report the 95% confidence interval, model, agreement definition, single or average unit, sample size, number of sessions, session means and SDs, mean change, retest protocol, missing-data rule, and an agreement or difference diagnostic. Reliability does not establish validity, and a high ICC does not guarantee small individual differences.
Related statistical guides
Use these internal resources to distinguish reliability, agreement, association, and repeated-measures inference.