
Intraclass Correlation Coefficient: ICC(2,k) Formula, Interpretation, SPSS, Python, R and Excel Guide
The Intraclass Correlation Coefficient summarizes reliability when the same targets receive several quantitative ratings or repeated measurements. This worked guide selects a two-way random-effects, absolute-agreement, average-measure model, calculates ICC(2,k) from ANOVA mean squares, interprets the 95% confidence interval, and verifies the result across Python, R, SPSS, and Excel.
3 measurement occasions
Two-way random effects
Absolute agreement
Average-measure ICC
The average of G1, G2, and G3 has excellent absolute-agreement reliability.
For 649 targets measured on G1, G2, and G3, the verified Intraclass Correlation Coefficient is ICC(2,k) = 0.9481. SPSS reports a 95% confidence interval from 0.939 to 0.956, with F(648, 1296) = 20.246, p < .001. The result means that an average formed from all three measurements distinguishes targets very reliably while requiring close numerical agreement across occasions.
The corresponding single-measure coefficient is ICC(2,1) = 0.8588, 95% CI [0.836, 0.878]. One measurement is therefore good, but the average of all three is more dependable because averaging reduces residual measurement error. The conclusion applies to the reliability of the three-measure average, not automatically to one future rating.
Verified metric ledger
What does the Intraclass Correlation Coefficient measure?
ICC partitions observed variation into target differences and measurement-related error.
This Intraclass Correlation Coefficient section defines reliability as a design-specific ratio of stable target variation to total modeled variation.
The Intraclass Correlation Coefficient is a family of reliability coefficients for quantitative measurements that are grouped within the same target. Each target may be a patient, student, product, image, laboratory specimen, household, school, or any other unit receiving repeated numerical ratings. The coefficient asks whether targets that score high on one rating also tend to score high on the other ratings, while also considering the amount of disagreement in the actual numerical values.
Reliability as variance partitioning
The central idea is variance partitioning. If most observed variance reflects stable differences between targets, reliability is high. If a large share comes from residual noise, inconsistent raters, changing instruments, or occasion-specific disturbances, reliability is lower. The Intraclass Correlation Coefficient expresses the reliable target component relative to the total variation defined by the selected model.
This is why ICC is more than a simple pairwise association. A correlation matrix can show that G1, G2, and G3 move together, but it does not produce one design-specific reliability estimate for all three measurements. The present inter-item correlations are .865, .826, and .919, yet the average-measure absolute-agreement ICC is .948. The two summaries answer related but different questions.
Agreement versus association
Two raters can correlate perfectly even when one always gives scores five points higher than the other. Their rankings match, but their values do not agree. An absolute-agreement Intraclass Correlation Coefficient treats that systematic offset as disagreement. A consistency coefficient is less sensitive to a stable additive difference because it focuses on whether targets retain the same relative standing.
This distinction is also why a Bland-Altman plot can complement ICC. ICC summarizes relative reliability across the observed target range, whereas a Bland-Altman analysis displays mean bias and limits of agreement in the original measurement units. A strong study can report both when interchangeability and practical measurement error matter.
The word intraclass means that the observations compared belong to the same class or cluster. G1, G2, and G3 belong to the same student. Three clinicians’ measurements belong to the same patient. Several judges’ scores belong to the same performance. Because the observations are not independent within a target, a reliability model must preserve that grouped structure.
ICC values are commonly described on a zero-to-one scale, but the estimate can occasionally be negative when within-target error exceeds between-target variation. A negative estimate should not be converted to a positive value or interpreted as meaningful negative reliability. It usually signals that the measurement process does not separate targets reliably, that the selected model does not match the design, or that sampling uncertainty is substantial.
The Intraclass Correlation Coefficient therefore expresses reliability only for the measurement design and unit explicitly selected.
When should you use the Intraclass Correlation Coefficient?
Use ICC for repeated quantitative scores on the same targets when reliability is the research question.
This Intraclass Correlation Coefficient section separates appropriate quantitative reliability applications from correlation, kappa, and change analysis.
The Intraclass Correlation Coefficient is appropriate when every row represents a target and several columns contain ratings, judges, instruments, or repeated quantitative measurements for that same target. Typical applications include inter-rater reliability, test-retest reliability, instrument calibration, repeated laboratory measurements, image scoring, classroom assessment, and reliability of aggregated panel ratings.
Inter-rater design
Several raters score every target on the same continuous or approximately interval scale. Choose absolute agreement when raters must be interchangeable. Choose consistency when stable differences in rater severity are acceptable and only rank ordering matters.
Repeated-measure design
The same instrument measures each target at several occasions. ICC can quantify stability, but the time interval and expected true change must be considered. Reliability is not the right interpretation when the construct is expected to change systematically.
Average panel score
A final decision is based on the mean of several ratings. An average-measure Intraclass Correlation Coefficient estimates the reliability of that composite, while a single-measure ICC estimates one rating.
Four questions to ask before calculating ICC
Do not default to ICC merely because a dataset has repeated columns. A Pearson correlation is suitable for association between two continuous variables when agreement is not the goal. Cohen’s kappa is designed for two categorical raters, Fleiss kappa extends categorical agreement to multiple raters, and weighted kappa incorporates ordered-category distances. A repeated-measures ANOVA tests mean change across occasions; it does not by itself quantify reliability.
The Intraclass Correlation Coefficient is also distinct from the ICC used in multilevel modeling to describe clustering. In a hierarchical linear model or multilevel regression, the cluster ICC is usually the proportion of outcome variance between groups such as schools or hospitals. In reliability analysis, the targets are the objects being rated and the model includes rater or occasion structure. Both are variance ratios, but their design meanings differ.
For the worked example, the research question is deliberately narrow: how reliable is the average of three grade-style measurements when absolute numerical agreement is required and the three occasions are treated as a random sample from a broader measurement universe? That question leads to ICC(2,k), not automatically to every other ICC form.
Use the Intraclass Correlation Coefficient when repeated quantitative measurements, rather than categorical labels, define the reliability question.
Intraclass Correlation Coefficient assumptions: six conditions to check
The method is model-based and design-dependent, not assumption-free.
This Intraclass Correlation Coefficient section prioritizes correct design, target independence, comparable scales, and model justification.
The assumptions of the Intraclass Correlation Coefficient include a correct target-rater structure, independent targets, comparable quantitative scales, and an effects model that matches the intended generalization. ANOVA-based confidence intervals and tests additionally rely on distributional and variance assumptions.
Design assumptions
Statistical diagnostics
Independence applies between targets, while ratings are intentionally dependent within a target. Every rating column must use the same direction and scale, and the reliability claim must concern the same unit represented by the coefficient. The inferential F test and confidence interval additionally rely on the two-way ANOVA framework used for ICC(2,k).
A defensible Intraclass Correlation Coefficient begins with correct target independence, measurement structure, and effects-model specification.
Intraclass Correlation Coefficient hypotheses and inferential question
The F test evaluates whether stable target differences exceed residual error.
This Intraclass Correlation Coefficient section distinguishes the zero-reliability test from the practical interpretation of magnitude and uncertainty.
Null hypothesis
H0: The population average-measure absolute-agreement Intraclass Correlation Coefficient is zero. Under the ANOVA test, target variation does not exceed residual variation enough to support reliability beyond zero.
Alternative hypothesis
H1: The population ICC(2,k) is greater than zero. Stable differences among target averages are present relative to residual measurement error.
The null test is useful, but it is not the main practical interpretation. With 649 targets, even a modest coefficient could be statistically different from zero. Reliability decisions should focus on the point estimate, 95% confidence interval, measurement consequences, and the minimum acceptable reliability for the intended application.
Software may print a p-value of 0.000 or store an underflowed value of zero. That output does not mean the mathematical probability is exactly zero. Report p < .001 rather than p = .000. The site’s guides to p-value, hypothesis testing, and the null and alternative hypothesis provide broader reporting context.
The statistical test does not prove that every target has nearly identical G1, G2, and G3 values. It evaluates the aggregate variance structure. Individual targets can still show meaningful disagreement, especially at low scores or in cases with a zero on one occasion. Case-level review remains important when decisions have practical consequences.
The Intraclass Correlation Coefficient F test addresses reliability beyond zero, while the confidence interval describes plausible population values.
Intraclass Correlation Coefficient formula and ANOVA components
ICC(2,k) combines target, rater, and residual mean squares from a two-way random-effects model.
This Intraclass Correlation Coefficient section shows how the ANOVA mean squares enter the single-measure and average-measure equations.
The Intraclass Correlation Coefficient formula depends on the selected model. For a balanced two-way random-effects design with n targets and k raters or occasions, calculate the mean square for targets (MSR), the mean square for raters or columns (MSC), and the residual mean square (MSE).
This single-measure absolute-agreement coefficient includes target-independent rater differences and residual error in the denominator.
This average-measure formula evaluates the reliability of the mean of all k ratings. Averaging reduces the residual contribution, so ICC(2,k) is normally greater than ICC(2,1).
The associated null test uses the ratio F = MSR/MSE with df1 = n – 1 and df2 = (n – 1)(k – 1). In this dataset, F = 24.083791/1.189560 = 20.245973, with 648 and 1296 degrees of freedom.
Why the rater mean square is divided by n
In ICC(2,k), the absolute-agreement penalty for systematic rater differences appears as (MSC – MSE)/n. The average is based on the same k raters or occasions, and the uncertainty contributed by their mean differences is scaled by the number of targets used to estimate those differences. The term remains important conceptually even when it becomes numerically small in a large sample.
Connection with the Spearman-Brown idea
When one-rating reliability is known, the reliability of an average often increases according to the number of components. For the present values, the average coefficient is consistent with the general principle that combining three reasonably reliable measurements reduces random error. However, the exact ICC(2,k) formula should be used because it preserves the two-way absolute-agreement design.
The formula is a ratio, not a percentage of correctly matched ratings. An Intraclass Correlation Coefficient of .948 does not mean 94.8% of individual scores are identical. It means the model-defined reliable component is very large relative to the error structure for the three-measure average.
The Intraclass Correlation Coefficient formula must be reported with its ICC model label because alternative formulas estimate different quantities.
Worked Intraclass Correlation Coefficient example and variables used
The analysis uses 649 complete targets and three grade-style measurement occasions.
This Intraclass Correlation Coefficient section documents the target, repeated columns, descriptive values, missing-case rule, and composite score.
The worked Intraclass Correlation Coefficient analysis uses the G1, G2, and G3 columns from a 649-row educational dataset. Each row is one target, and each column is treated as a rating or measurement occasion. The analysis is performed in wide format because every target has one value in each of the three repeated columns.
| Variable | Role in ICC(2,k) | Observed mean | SD | Interpretive description |
|---|---|---|---|---|
| Target / row ID | Object being measured | – | – | 649 students or targets; rows are independent from one another. |
| G1 | Rating or occasion 1 | 11.3991 | 2.7453 | First grade-style measurement on the common scale. |
| G2 | Rating or occasion 2 | 11.5701 | 2.9136 | Second measurement for the same target. |
| G3 | Rating or occasion 3 | 11.9060 | 3.2307 | Third or final grade-style measurement. |
| Three-rating average | Reported composite | 11.6251 | 2.8334 | Mean of G1, G2, and G3 for each target; variance = 8.0279. |
Descriptive pattern
G3 has the largest mean and standard deviation, while G1 has the smallest mean. The means increase by about 0.51 points from G1 to G3. Because the selected coefficient requires absolute agreement, these systematic mean differences are part of the model rather than being ignored.
The three-rating average has a mean of 11.6251, median of 11.6667, standard deviation of 2.8334, minimum of 1.33, and maximum of 18.67. These descriptive statistics describe the composite that ICC(2,k) evaluates.
Pairwise relationships
SPSS reports correlations of .865 between G1 and G2, .826 between G1 and G3, and .919 between G2 and G3. These strong relationships help explain the high reliability, but none is a substitute for the selected Intraclass Correlation Coefficient.
A correlation heatmap would emphasize the strong pairwise pattern, while ICC summarizes all three columns and applies the absolute-agreement definition.
The source has complete values for all three analysis columns in the SPSS procedure: 649 valid cases and zero excluded cases. Missing-data handling should still be reported in other datasets. Listwise deletion changes the target sample, and pairwise use is generally unsuitable for a balanced ICC ANOVA because different coefficients could be based on different target sets.
This Intraclass Correlation Coefficient example treats G1, G2, and G3 as three repeated quantitative measurements for every target.
Exact ICC(2,k) results and interpretation
Every reported value is reproduced from the two-way ANOVA mean squares.
This Intraclass Correlation Coefficient section reproduces ICC(2,k), ICC(2,1), and the F statistic from full-precision components.
The exact Intraclass Correlation Coefficient calculation begins with the two-way ANOVA decomposition. The target mean square is 24.083791, the rater or occasion mean square is 43.165383, and the residual mean square is 1.189560.
Numerator = 22.894232. The rater adjustment is approximately 0.064678. The denominator is therefore approximately 24.148469.
The workbook, Python calculation, R calculation, and SPSS average-measures table agree after rounding.
Average-measure result
Excellent reliability
The mean of all three ratings is highly reliable under the two-way random absolute-agreement model.
Single-measure companion
The one-rating coefficient is good but lower because a single observation carries the full residual and rater disagreement.
The relation between single and average reliability illustrates why reports must state whether the coefficient refers to one rating or the average of all k ratings.
The F statistic is calculated independently from the ratio MSR/MSE:
With 648 and 1296 degrees of freedom, the result is highly significant. SPSS displays Sig. = .000, which should be written as p < .001.
The rater mean square is larger than the target mean square, but that does not mean raters dominate the reliability estimate. Mean squares have different roles and degrees of freedom. The rater term enters ICC(2,k) only through (MSC – MSE)/n. In a large target sample, the systematic mean difference is estimated precisely and contributes a modest adjustment to the average-measure denominator.
The calculation also clarifies why a bar chart mixing ICC, F, p, target count, and rater count must not be interpreted by comparing bar heights. Those quantities have different units and scales. The numerical ledger and formula are the authoritative interpretation.
This Intraclass Correlation Coefficient section interprets the point estimate, confidence interval, measurement unit, and limits of generalization together.
A common descriptive convention labels ICC values below .50 as poor, .50 to .75 as moderate, .75 to .90 as good, and above .90 as excellent. Under that convention, ICC(2,k) = .948 indicates excellent reliability. These thresholds are guides, not universal laws. A clinical decision, high-stakes certification, or individual diagnostic score may require a stricter standard than exploratory group research.
| Coefficient | Estimate | 95% CI | Interpretation for this design |
|---|---|---|---|
| ICC(2,1), single measure | 0.8588 | 0.836 to 0.878 | Good reliability for one randomly selected measurement. |
| ICC(2,k), average of three | 0.9481 | 0.939 to 0.956 | Excellent reliability for the average of G1, G2, and G3. |
Interpret the lower confidence bound
The lower bound of .939 remains above .90, so the conclusion of excellent average-measure reliability is not dependent on the point estimate alone. The narrow interval reflects the large sample of 649 targets and the strong separation of target differences from residual error.
Confidence intervals describe sampling uncertainty under the fitted model. They do not incorporate every possible source of future measurement variation, such as new instruments, changed scoring instructions, different populations, or unobserved raters.
Interpret the unit of reliability
The estimate .948 belongs to the average of three ratings. It should not be used to claim that any single rating has .948 reliability. The single-measure value is .859. Conversely, if a future decision averages exactly three comparable ratings, reporting only the single coefficient understates the reliability of the operational score.
This unit distinction is as important as the numerical cutoff and should appear in the abstract, method, results, tables, and figure captions.
High ICC does not guarantee small absolute measurement error. A heterogeneous sample can produce a high coefficient because targets span a wide range, even when repeated values differ enough to matter practically. Pair the coefficient with within-target differences, residual standard deviation, standard error, or a Bland-Altman plot when the size of disagreement in original units is important.
High reliability also does not establish validity. G1, G2, and G3 may measure targets consistently while still failing to measure the intended construct. Reliability is necessary for many forms of valid measurement but is not sufficient evidence of content, criterion, or construct validity.
The Intraclass Correlation Coefficient result is excellent for the three-measurement average, with a narrow confidence interval above .90.
Intraclass Correlation Coefficient in Python: calculation and charts
A transparent NumPy and SciPy workflow reproduces ICC(2,k) and all five verified figures.
The Intraclass Correlation Coefficient in Python workflow includes the exact two-way ANOVA decomposition and the complete chart sequence used in the accepted format: the primary-metrics chart appears alone, followed by two paired rows.
This Intraclass Correlation Coefficient section provides an auditable Python implementation rather than relying on an unlabeled default model.
Python can calculate the Intraclass Correlation Coefficient directly from the wide G1, G2, and G3 matrix. A manual calculation is useful for auditing because it exposes every sum of squares and mean square. A validated reliability package can then be used as a second implementation.
import numpy as np
import pandas as pd
from scipy.stats import fdf = pd.read_csv("dataset.csv")
x = df[["G1", "G2", "G3"]].dropna().to_numpy(dtype=float)
n, k = x.shape
grand = x.mean()
target_means = x.mean(axis=1)
rater_means = x.mean(axis=0)
ss_targets = k * np.sum((target_means - grand) ** 2)
ss_raters = n * np.sum((rater_means - grand) ** 2)
ss_error = np.sum(
(x - target_means[:, None] - rater_means[None, :] + grand) ** 2
)
ms_targets = ss_targets / (n - 1)
ms_raters = ss_raters / (k - 1)
ms_error = ss_error / ((n - 1) * (k - 1))
icc_2_1 = (
(ms_targets - ms_error) /
(ms_targets + (k - 1) * ms_error
+ k * (ms_raters - ms_error) / n)
)
icc_2_k = (
(ms_targets - ms_error) /
(ms_targets + (ms_raters - ms_error) / n)
)
f_value = ms_targets / ms_error
p_value = f.sf(f_value, n - 1, (n - 1) * (k - 1))
print(n, k)
print(ms_targets, ms_raters, ms_error)
print(icc_2_1, icc_2_k, f_value, p_value)
| Python object | Verified value |
|---|---|
| n, k | 649, 3 |
| ms_targets | 24.0837914614 |
| ms_raters | 43.1653826400 |
| ms_error | 1.1895595947 |
| icc_2_1 | 0.8588468392 |
| icc_2_k | 0.9480614162 |
| f_value | 20.2459730213 |
| p_value | Extremely small; report p < .001 |
The calculation uses the complete repeated-measure rows. Before analysis, confirm data types, target duplication, missingness, scale direction, and whether all rating columns use the same units. The site’s correlation in Python guide can support pairwise diagnostics, but model selection must be decided separately.
Do not round the mean squares before calculating ICC. Store full-precision values and round only the displayed result. Early rounding can noticeably alter coefficients in smaller or less reliable datasets, particularly when MSR and MSE are close.
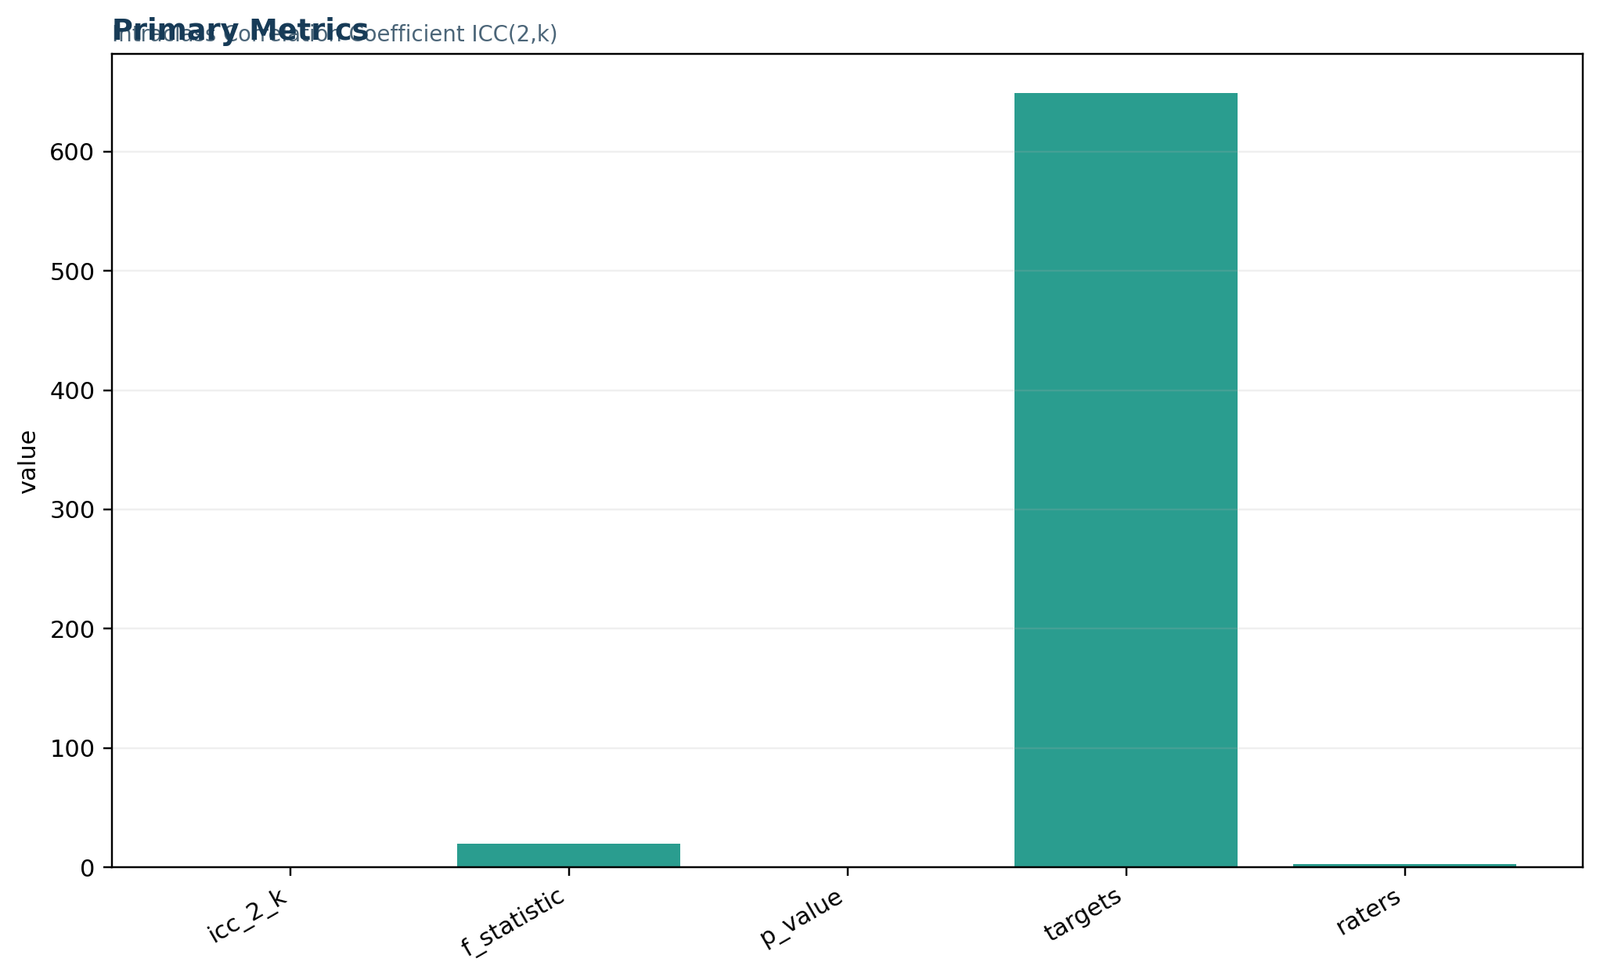
Python Intraclass Correlation Coefficient chart 1. Primary metrics for ICC(2,k)
The primary-metrics chart places ICC(2,k), the F statistic, the stored p-value, 649 targets, and three raters on one axis. The target-count bar dominates because it is measured in hundreds, whereas the coefficient and p-value lie between zero and one. Read the labels and ledger rather than comparing visual bar height across unlike units. The verified values are ICC(2,k) = 0.9481, F = 20.246, p < .001, n = 649, and k = 3.
Python interpretation: Python and R reproduce the same metric ledger. The cross-software agreement verifies the arithmetic, while SPSS supplies the rounded confidence interval and standard reliability table.
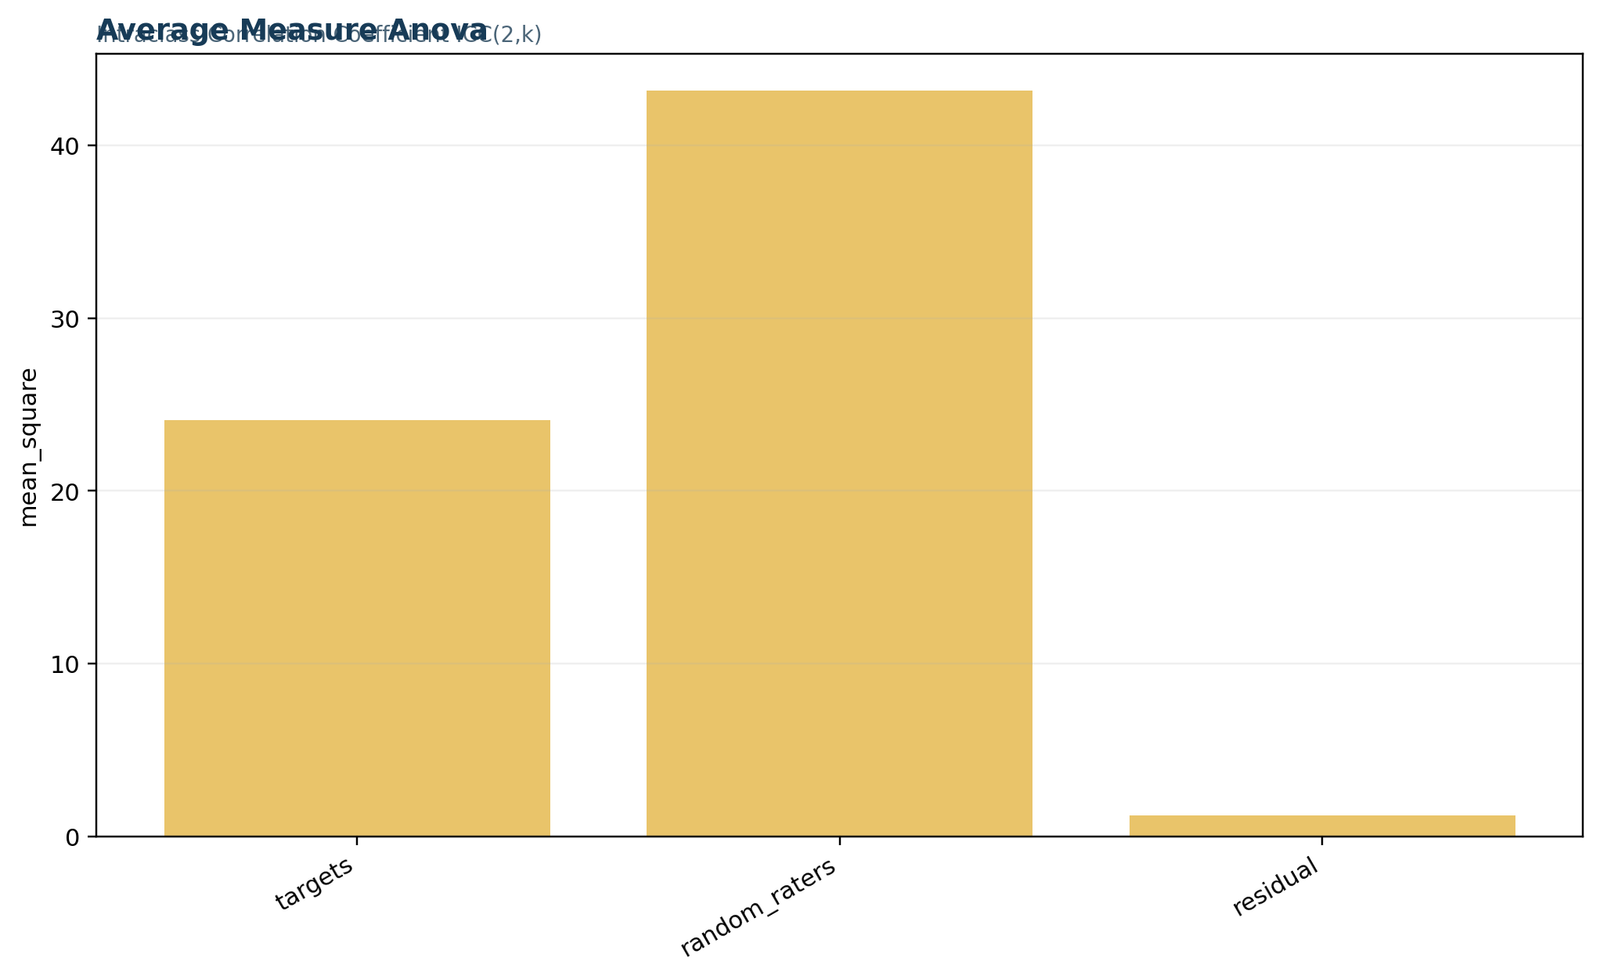
Python Intraclass Correlation Coefficient chart 2. Average-measure ANOVA components
The ANOVA chart compares the target mean square, rater mean square, and residual mean square. MS targets = 24.0838 is much larger than MS residual = 1.1896, creating the F ratio of 20.246. MS raters = 43.1654 reflects mean differences among G1, G2, and G3. In the ICC(2,k) formula, that rater component is adjusted by the 649-target sample size.
Python interpretation: The chart supports the reliability mechanism: stable between-target variation substantially exceeds unexplained target-by-occasion error. It should not be read as an ordinary three-group mean comparison because the bars are ANOVA mean squares, not raw grade means.
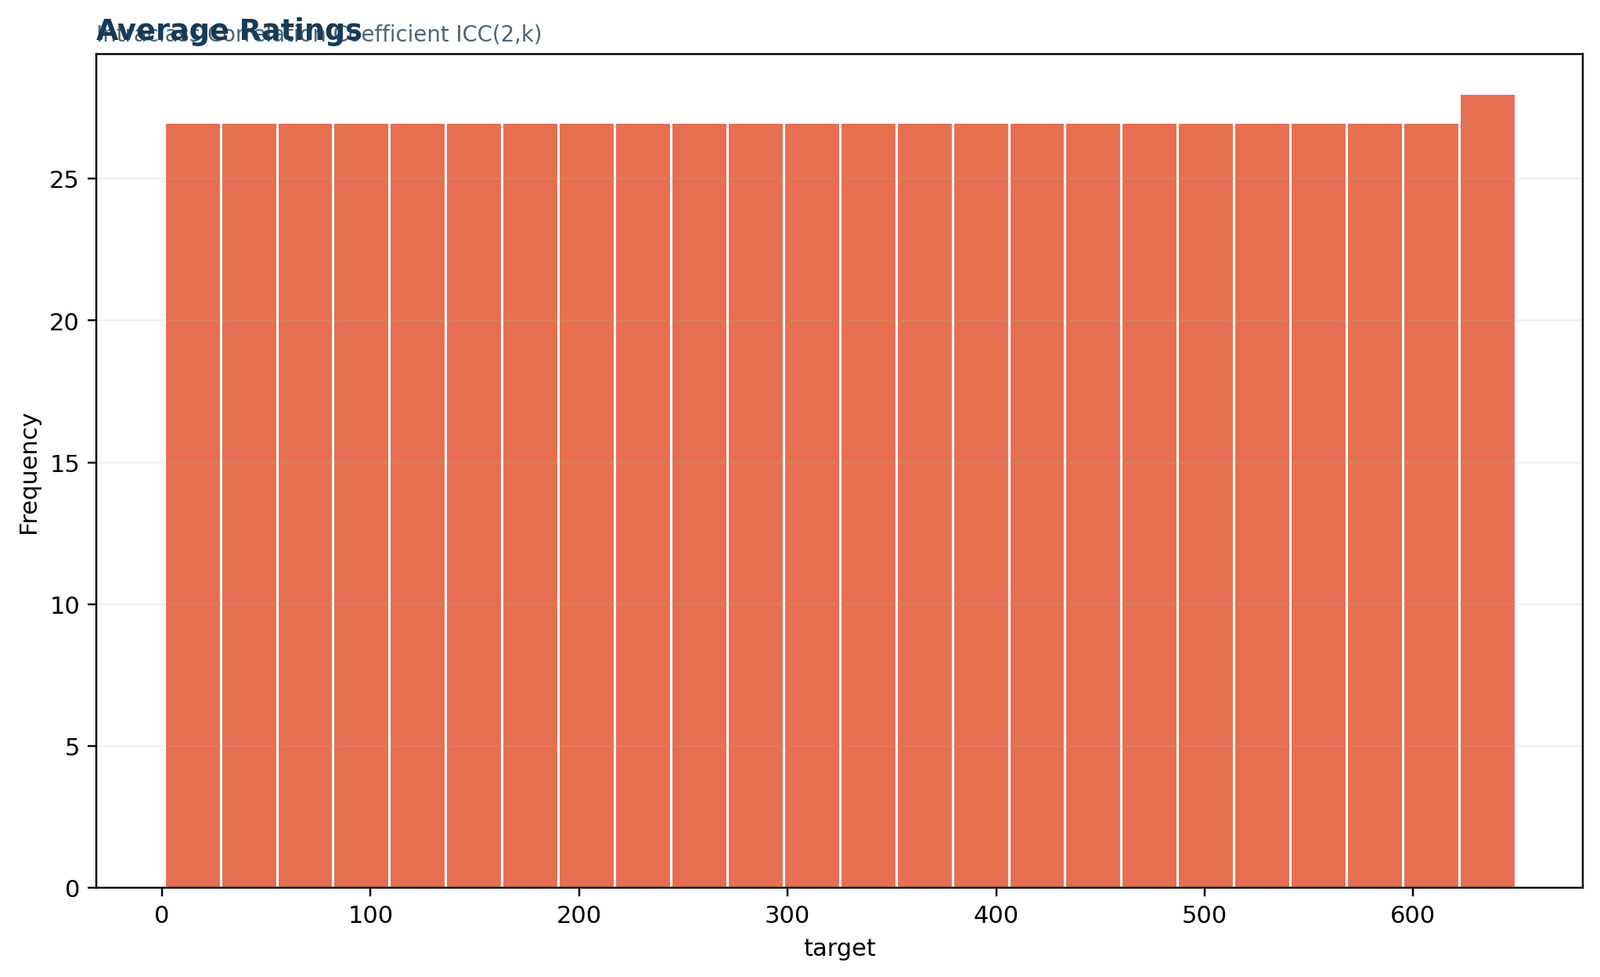
Python Intraclass Correlation Coefficient chart 3. Average ratings coverage across targets
The average-ratings figure bins target indices after calculating one three-rating average for every row. The near-equal bar counts show complete coverage of the sequential target index rather than the distribution of the average scores themselves. Its main value is reproducibility: all 649 targets contributed an average and no target block was dropped.
Python interpretation: Because target number is only record order, the x-axis has no substantive meaning. For distributional interpretation, use the reported composite statistics: mean 11.6251, median 11.6667, SD 2.8334, minimum 1.33, and maximum 18.67.
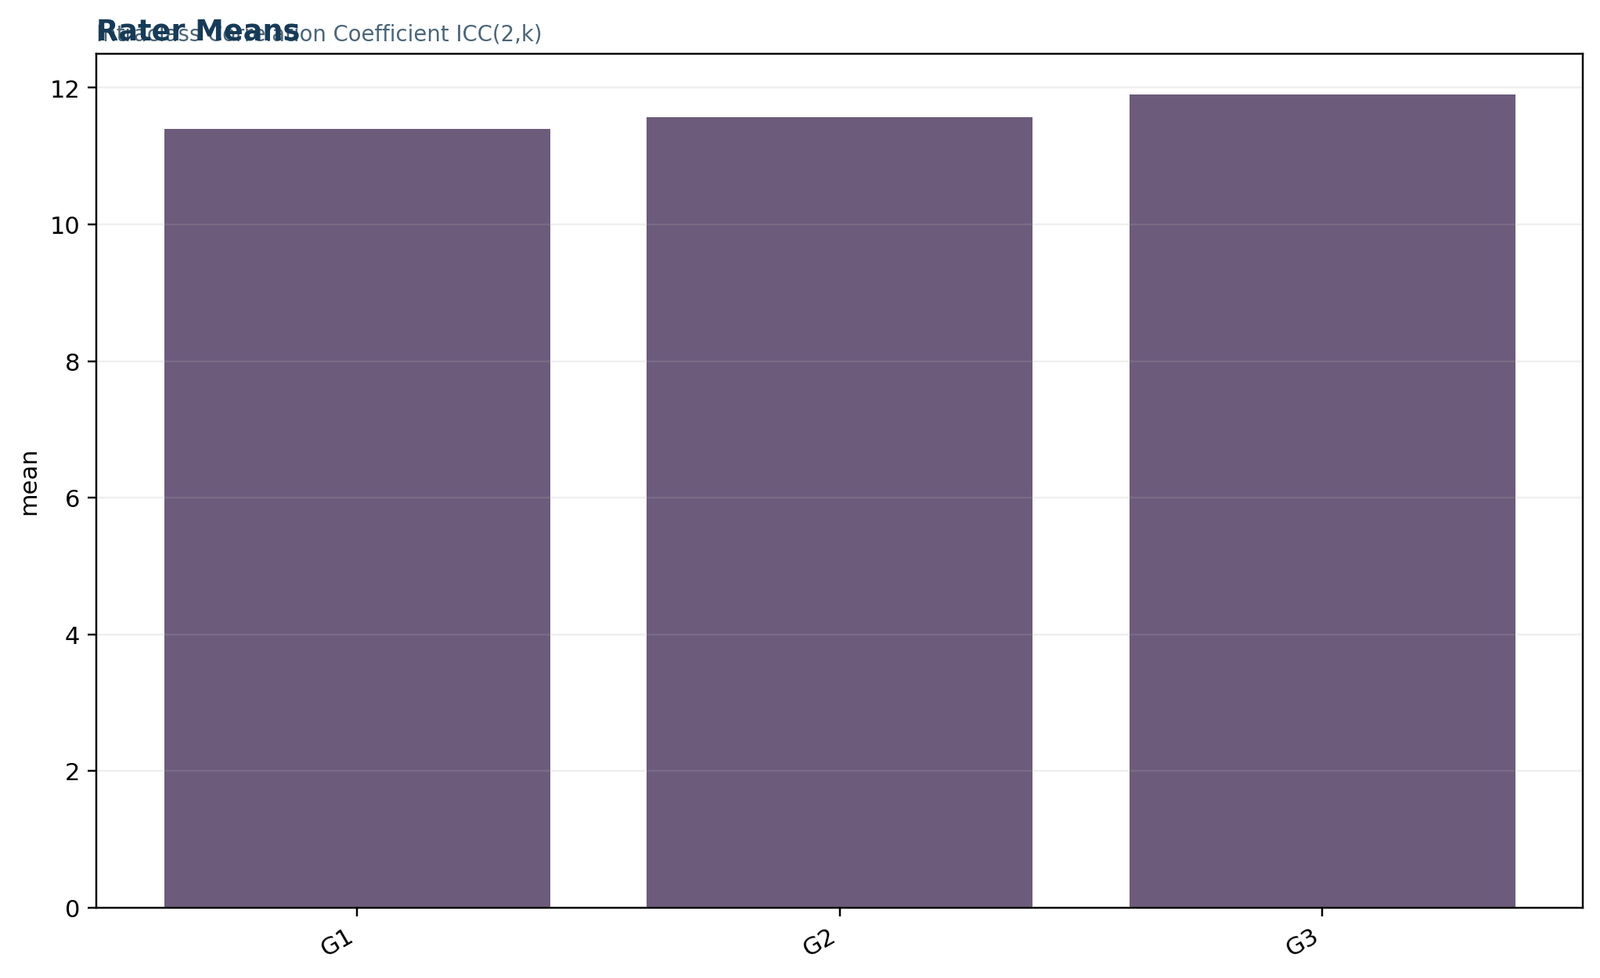
Python Intraclass Correlation Coefficient chart 4. Mean ratings for G1, G2, and G3
The rater-means chart shows a gradual increase from G1 = 11.3991 to G2 = 11.5701 and G3 = 11.9060. The total difference from G1 to G3 is about 0.507 points. An absolute-agreement Intraclass Correlation Coefficient treats systematic occasion differences as part of disagreement, unlike a consistency coefficient that focuses more heavily on relative ordering.
Python interpretation: The means are close relative to the full score range and target variability, so absolute agreement remains excellent for the three-rating average. The chart should still be discussed because a high ICC can coexist with a systematic mean trend.
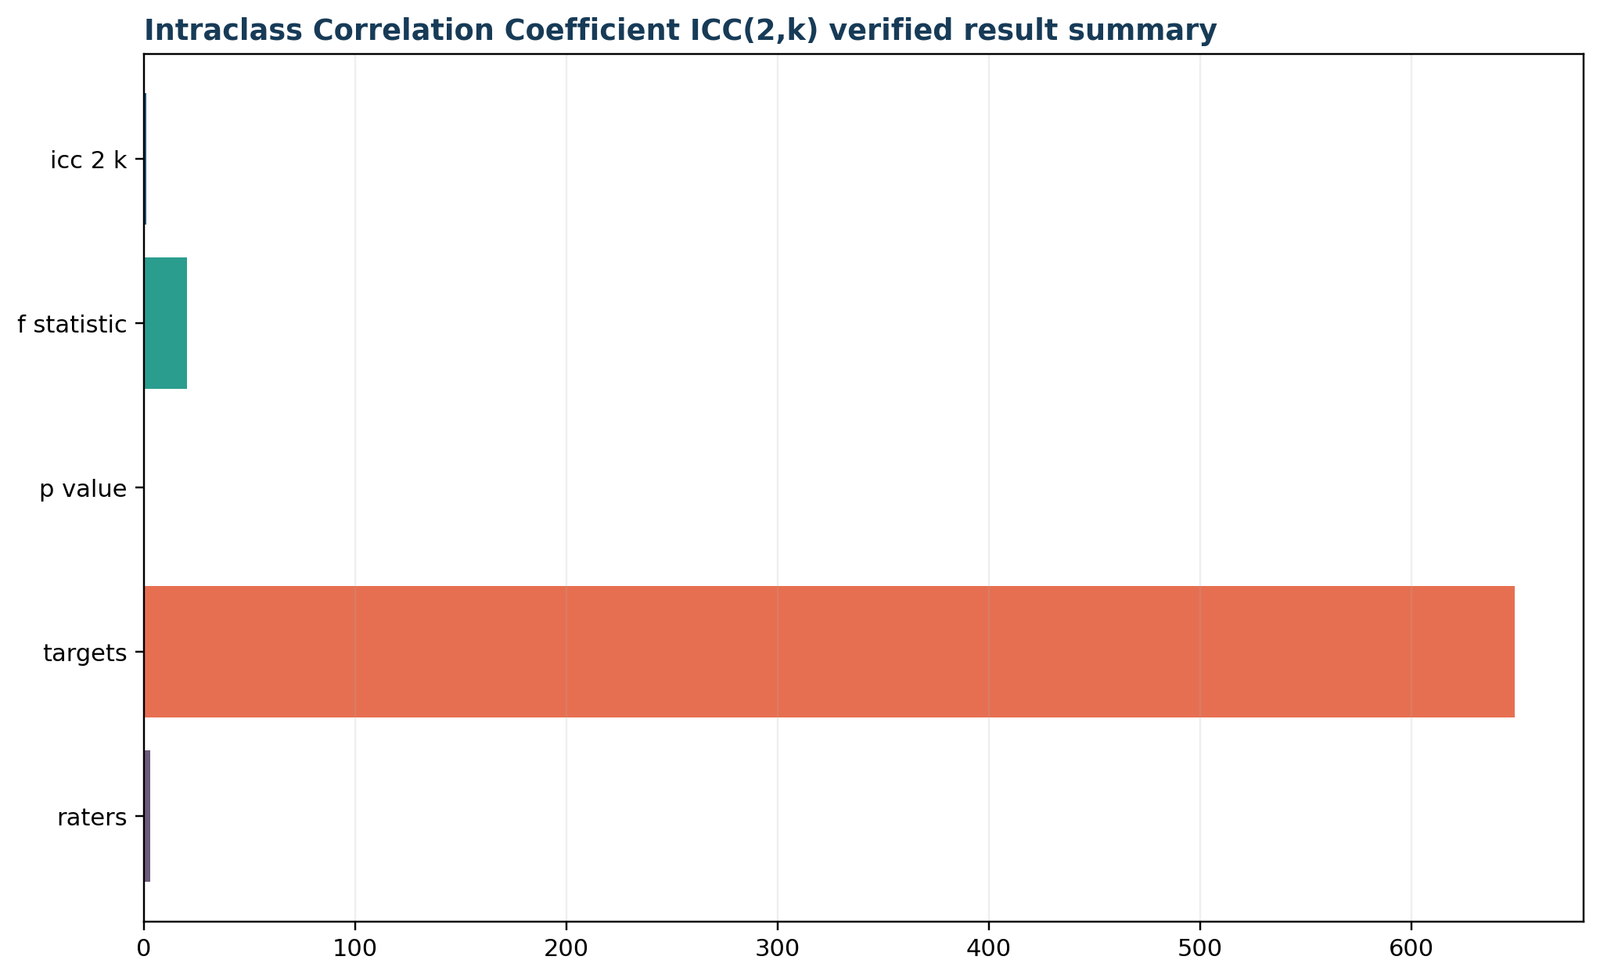
Python Intraclass Correlation Coefficient chart 5. Verified result summary
The verified-summary chart repeats the final ledger in horizontal form. As in the primary-metrics figure, mixed units make bar-length comparison inappropriate: 649 targets naturally exceeds F = 20.246, k = 3, ICC = 0.948, and a very small p-value. Its purpose is to document the exact outputs checked across the calculation files.
Python interpretation: The scientific conclusion comes from the coefficient and interval, not from the longest bar. The cross-verified result is ICC(2,k) = .948, 95% CI [.939, .956], F(648, 1296) = 20.25, p < .001.
The Python Intraclass Correlation Coefficient workflow exposes every ANOVA component and links each chart to the verified result ledger.
Intraclass Correlation Coefficient in R: calculation and charts
The R workflow independently reproduces ICC(2,k) and the same five chart checks.
The Intraclass Correlation Coefficient in R section follows the same accepted image arrangement: one full-width result chart followed by two paired rows, with each figure interpreted separately.
This Intraclass Correlation Coefficient section uses R as an independent implementation and model-label cross-check.
R provides both package-based and manual routes for the Intraclass Correlation Coefficient. The manual route below uses the same wide matrix and formula as the workbook, making the cross-software comparison transparent.
dat <- read.csv("dataset.csv")
x <- as.matrix(na.omit(dat[c("G1", "G2", "G3")]))n <- nrow(x)
k <- ncol(x)
grand <- mean(x)
target_means <- rowMeans(x)
rater_means <- colMeans(x)
ss_targets <- k * sum((target_means - grand)^2)
ss_raters <- n * sum((rater_means - grand)^2)
residuals <- sweep(x, 1, target_means, "-")
residuals <- sweep(residuals, 2, rater_means, "-")
residuals <- residuals + grand
ss_error <- sum(residuals^2)
ms_targets <- ss_targets / (n - 1)
ms_raters <- ss_raters / (k - 1)
ms_error <- ss_error / ((n - 1) * (k - 1))
icc_2_1 <- (ms_targets - ms_error) /
(ms_targets + (k - 1) * ms_error +
k * (ms_raters - ms_error) / n)
icc_2_k <- (ms_targets - ms_error) /
(ms_targets + (ms_raters - ms_error) / n)
f_value <- ms_targets / ms_error
p_value <- pf(
f_value,
df1 = n - 1,
df2 = (n - 1) * (k - 1),
lower.tail = FALSE
)
c(icc_2_1 = icc_2_1, icc_2_k = icc_2_k,
F = f_value, p = p_value)
R returns ICC(2,1) = 0.8588468 and ICC(2,k) = 0.9480614. The result matches Python and Excel because all three implementations use the same two-way random absolute-agreement formulas and the same 649 complete targets.
Package cross-check
A package output may use names such as ICC2, ICC(A,1), average random raters, or absolute agreement. Read the documentation and output labels carefully. Some functions default to consistency, single measure, or a different effects structure. Never assume that the largest printed coefficient is the required model.
R visualization role
The displayed figures summarize the same verified values: primary metrics, ANOVA mean squares, target-average coverage, occasion means, and the final result ledger. Use the numerical results for inference and the charts for communication and quality review.
When package output differs, compare the model name, data orientation, missing-case rule, agreement type, and unit. Long-format functions often require explicit target and rater identifiers. Reversed identifiers can produce a mathematically valid but substantively wrong model.
The site’s correlation in R guide can help verify pairwise relationships, and correlation assumptions provides diagnostic context. ICC assumptions and model-selection requirements remain distinct from ordinary correlation assumptions.
R Intraclass Correlation Coefficient chart 1. Primary metrics for ICC(2,k)
The primary-metrics chart places ICC(2,k), the F statistic, the stored p-value, 649 targets, and three raters on one axis. The target-count bar dominates because it is measured in hundreds, whereas the coefficient and p-value lie between zero and one. Read the labels and ledger rather than comparing visual bar height across unlike units. The verified values are ICC(2,k) = 0.9481, F = 20.246, p < .001, n = 649, and k = 3.
R interpretation: Python and R reproduce the same metric ledger. The cross-software agreement verifies the arithmetic, while SPSS supplies the rounded confidence interval and standard reliability table.
R Intraclass Correlation Coefficient chart 2. Average-measure ANOVA components
The ANOVA chart compares the target mean square, rater mean square, and residual mean square. MS targets = 24.0838 is much larger than MS residual = 1.1896, creating the F ratio of 20.246. MS raters = 43.1654 reflects mean differences among G1, G2, and G3. In the ICC(2,k) formula, that rater component is adjusted by the 649-target sample size.
R interpretation: The chart supports the reliability mechanism: stable between-target variation substantially exceeds unexplained target-by-occasion error. It should not be read as an ordinary three-group mean comparison because the bars are ANOVA mean squares, not raw grade means.
R Intraclass Correlation Coefficient chart 3. Average ratings coverage across targets
The average-ratings figure bins target indices after calculating one three-rating average for every row. The near-equal bar counts show complete coverage of the sequential target index rather than the distribution of the average scores themselves. Its main value is reproducibility: all 649 targets contributed an average and no target block was dropped.
R interpretation: Because target number is only record order, the x-axis has no substantive meaning. For distributional interpretation, use the reported composite statistics: mean 11.6251, median 11.6667, SD 2.8334, minimum 1.33, and maximum 18.67.
R Intraclass Correlation Coefficient chart 4. Mean ratings for G1, G2, and G3
The rater-means chart shows a gradual increase from G1 = 11.3991 to G2 = 11.5701 and G3 = 11.9060. The total difference from G1 to G3 is about 0.507 points. An absolute-agreement Intraclass Correlation Coefficient treats systematic occasion differences as part of disagreement, unlike a consistency coefficient that focuses more heavily on relative ordering.
R interpretation: The means are close relative to the full score range and target variability, so absolute agreement remains excellent for the three-rating average. The chart should still be discussed because a high ICC can coexist with a systematic mean trend.
R Intraclass Correlation Coefficient chart 5. Verified result summary
The verified-summary chart repeats the final ledger in horizontal form. As in the primary-metrics figure, mixed units make bar-length comparison inappropriate: 649 targets naturally exceeds F = 20.246, k = 3, ICC = 0.948, and a very small p-value. Its purpose is to document the exact outputs checked across the calculation files.
R interpretation: The scientific conclusion comes from the coefficient and interval, not from the longest bar. The cross-verified result is ICC(2,k) = .948, 95% CI [.939, .956], F(648, 1296) = 20.25, p < .001.
The R Intraclass Correlation Coefficient workflow provides an independent implementation and confirms the same average-measure reliability conclusion.
Intraclass Correlation Coefficient in SPSS: output and interpretation
The RELIABILITY procedure reports the ICC model, confidence interval, and F test.
This Intraclass Correlation Coefficient section maps the SPSS tables to the exact result that should appear in a research report.
SPSS analyzed 649 valid cases with G1, G2, and G3 and excluded no cases. The RELIABILITY procedure used a random-effects model, an absolute-agreement definition, a 95% confidence interval, and a test value of zero. The scale contained three items or measurement occasions.
| SPSS table | Key output | Interpretation |
|---|---|---|
| Case Processing Summary | 649 valid; 0 excluded | The ICC is based on complete G1, G2, and G3 values for every target. |
| Reliability Statistics | Cronbach’s alpha = .951; standardized alpha = .953 | The columns show high internal consistency, but alpha does not replace the selected ICC agreement model. |
| Item Statistics | Means 11.40, 11.57, 11.91 | G3 is slightly higher on average than G1 and G2. |
| Inter-Item Correlations | .865, .826, .919 | All pairs are strongly positively related. |
| Intraclass Correlation Coefficient | Single .859; average .948 | One measurement is good; the mean of three is excellent. |
| 95% Confidence Interval | Single [.836, .878]; average [.939, .956] | Both intervals are narrow and remain within good-to-excellent ranges. |
| F Test with True Value 0 | F = 20.246; df1 = 648; df2 = 1296; Sig. = .000 | Report p < .001, not p = .000. |
RELIABILITY

/VARIABLES=G1 G2 G3

/SCALE('Average of random raters') ALL

/MODEL=ALPHA

/STATISTICS=DESCRIPTIVE SCALE CORR

/SUMMARY=TOTAL

/ICC=MODEL(RANDOM) TYPE(ABSOLUTE) CIN=95 TESTVAL=0.
The SPSS label “Average Measures” is essential. It tells the reader that .948 applies to the average of the three columns. The “Single Measures” row gives .859. Copying the larger number without the row label is a common reporting error.
SPSS menu path
Use Analyze, Scale, Reliability Analysis. Move G1, G2, and G3 into the Items box. Open Statistics, request intraclass correlation coefficients, select the two-way random model, choose absolute agreement, and retain the 95% confidence interval. Confirm that the unit is average measures when reporting ICC(2,k).
Alpha beside ICC
Cronbach’s alpha = .951 is close to the average-measure ICC because both summarize common variation across three strongly related columns. Their conceptual assumptions are not identical. ICC explicitly models targets and raters or occasions and can distinguish absolute agreement from consistency.
SPSS also reports an average-score histogram with mean 11.63, standard deviation 2.833, and n = 649. That distribution describes the composite and should not be confused with the distribution of ICC estimates. The coefficient is one summary calculated from the full repeated-measure matrix.
The SPSS Intraclass Correlation Coefficient table supplies the rounded estimate, interval, model notes, degrees of freedom, and significance test.
Intraclass Correlation Coefficient in Excel: worked calculation
The workbook exposes the data input, ANOVA components, diagnostics, and final reporting ledger.
This Intraclass Correlation Coefficient section explains the workbook lineage from raw columns to formulas, diagnostics, and final reporting.
The downloadable Excel workbook is organized into Guide, Data_Input, Working, Calculations, Diagnostics, and Reporting sheets. The source columns remain unchanged, while formula-driven sheets calculate the three-rating average and verify the final ledger.
| Workbook sheet | Purpose | Key content |
|---|---|---|
| Guide | Method documentation | ICC(2,k) design, null hypothesis, formula, variables, source rows, and alpha. |
| Data_Input | Raw repeated measurements | G1, G2, and G3 for 649 targets. |
| Working | Row calculations | Three-rating average, deviation from the grand average, and squared deviation. |
| Calculations | Metric ledger | n, k, average-score variance, ICC(2,k), F statistic, and p-value. |
| Diagnostics | Scope checks | Model identity, row count, variables, missing-data scope, and interpretation warning. |
| Reporting | Final comparison | Workbook values, verified references, and zero absolute differences. |
Core Excel formulas
Row average:
=AVERAGE(A5:C5)Grand mean:
=AVERAGE(A5:C653)
Target count:
=COUNT(A5:A653)
Number of ratings:
=COLUMNS(A5:C653)
ICC(2,k):
=(MSR-MSE)/(MSR+(MSC-MSE)/n)
F statistic:
=MSR/MSE
Audit strategy
Keep source data separate from calculations, label each mean square, use absolute cell references for fixed inputs, and compare final values with an independent implementation. The Reporting sheet shows an absolute difference of zero for ICC, F, target count, and rater count.
Excel should display full precision in calculation cells even when the report rounds to three decimals. Formula auditing is easier when each intermediate value has a descriptive label and a single role.
The workbook’s reported value is 0.9480614162291533, exactly matching the verified Python and R reference. The F statistic is 20.245973021325074. The p-value ledger stores zero because of numerical underflow or display conventions; the public report correctly uses p < .001.
For readers learning reliability calculations, Excel is valuable because it makes the relationship between row means, column means, grand mean, sums of squares, and the final coefficient visible. It should still be validated, since an incorrect range or copied reference can silently produce a plausible number.
The site’s correlation in Excel and regression ANOVA table resources provide related spreadsheet techniques, while this workbook remains specifically designed for ICC(2,k).
The Excel Intraclass Correlation Coefficient workbook preserves formula transparency from raw measurement columns through the final reporting sheet.
Choosing ICC(1), ICC(2), ICC(3), single, average, agreement, or consistency
Model selection determines what the coefficient means and where the conclusion can generalize.
This Intraclass Correlation Coefficient section turns the model label into four explicit decisions: effects, agreement, unit, and generalization.
There is no single universal Intraclass Correlation Coefficient. The model must match the sampling design, the meaning of disagreement, and the unit to which the conclusion applies. Reporting only “ICC = .95” is incomplete because ICC(1,1), ICC(2,k), and ICC(3,k) can differ and support different claims.
| Common label | Effects structure | Agreement definition | Unit reported | Typical question |
|---|---|---|---|---|
| ICC(1,1) | One-way random | Within-target reliability | Single rating | How reliable is one rating when targets may be rated by different random raters? |
| ICC(1,k) | One-way random | Within-target reliability | Average of k ratings | How reliable is the mean of k randomly assigned ratings? |
| ICC(2,1) or ICC(A,1) | Two-way random | Absolute agreement | Single rating | Can one randomly selected rater be used interchangeably with others? |
| ICC(2,k) or ICC(A,k) | Two-way random | Absolute agreement | Average of k ratings | How reliable is the mean of all k random raters or occasions? |
| ICC(3,1) or ICC(C,1) | Two-way mixed | Consistency | Single rating | How consistently does one fixed rater rank targets? |
| ICC(3,k) or ICC(C,k) | Two-way mixed | Consistency | Average of k ratings | How reliable is the average of this fixed set of raters? |
Identify the target
State exactly what receives repeated ratings: students, patients, images, products, schools, or specimens.
Classify raters
Decide whether the observed raters or occasions represent a broader random population or are the only fixed set of interest.
Define agreement
Use absolute agreement when identical values matter; use consistency when stable additive rater differences are acceptable.
Select the unit
Choose single measure for one future rating and average measure for a decision based on the mean of k ratings.
Name the model
Report the exact form, effects structure, agreement definition, number of ratings, software, and confidence interval.
Why ICC(2,k) fits the worked specification
The workbook defines three measurement columns as raters or occasions sampled from a wider measurement process, uses a two-way random-effects ANOVA, requires absolute agreement, and reports the reliability of the average of all three. Those decisions uniquely identify ICC(2,k). The computed coefficient is .9481.
The single-measure companion, ICC(2,1), is .8588. It is not an alternative answer to the same question; it answers a different unit-of-measure question. If a reader will use only one score, .8588 is the relevant reliability. If the reader will average G1, G2, and G3, .9481 is relevant.
Why model labels must accompany interpretation
A two-way mixed consistency result may be higher than a two-way random absolute-agreement result because systematic rater mean differences are excluded from the consistency denominator. This does not make one model better. It means each model defines error differently. The best Intraclass Correlation Coefficient is the one aligned with the intended use.
Model selection should be written before examining which option gives the largest value. Choosing a model after seeing the estimates converts a design decision into result shopping and weakens the validity of the conclusion.
Selecting the Intraclass Correlation Coefficient model before analysis prevents an attractive number from answering the wrong reliability question.
Intraclass Correlation Coefficient compared with related reliability statistics
ICC, correlation, alpha, kappa, and agreement plots answer different questions.
This Intraclass Correlation Coefficient section clarifies why alpha, correlation, kappa, ANOVA, and agreement plots are complementary rather than interchangeable.
| Statistic or method | Primary question | How it differs from ICC(2,k) |
|---|---|---|
| Intraclass Correlation Coefficient | How reliable is a specified single rating or average of ratings? | Model-based quantitative reliability with effects, agreement, and unit choices. |
| Pearson correlation | Are two variables linearly associated? | Can be high despite systematic mean disagreement; pairwise only. |
| Spearman rank correlation | Is there a monotonic rank relationship? | Rank association, not numerical agreement or multi-rater reliability. |
| Cronbach’s alpha | How internally consistent are scale items? | Closely related in some balanced designs but not a complete replacement for ICC model selection. |
| corrected item-total correlation | How strongly does each item relate to the remaining scale? | Item diagnostic rather than a repeated-measure agreement coefficient. |
| Cohen’s kappa | How much do two categorical raters agree beyond chance? | Designed for nominal categories, not continuous scores. |
| Fleiss kappa | How much do multiple categorical raters agree? | Multiple-rater categorical agreement rather than quantitative reliability. |
| Bland-Altman plot | What are mean bias and limits of agreement in original units? | Displays absolute pairwise disagreement rather than a relative variance ratio. |
| repeated-measures ANOVA | Do condition or occasion means differ? | Tests systematic mean change; does not summarize reliability. |
| random-effects regression | How is variation partitioned in a regression model? | Can yield a cluster ICC, but the model and interpretation differ from rater reliability. |
ICC versus correlation
A correlation can be high when one measurement is consistently shifted upward. ICC(2,k) penalizes that shift because it uses absolute agreement. Therefore, a report should not describe ICC as merely “the correlation among raters.” The correlation vs regression guide also illustrates how statistical labels correspond to different questions.
ICC versus kappa
Use ICC for quantitative ratings and kappa for categorical ratings. Converting a continuous scale into arbitrary categories to use kappa discards information and can make agreement depend on cut points. Conversely, applying ICC to unordered categories imposes distances that the scale does not support.
The present alpha of .951, standardized alpha of .953, and ICC(2,k) of .948 all suggest strong coherence among G1, G2, and G3. Their similarity is reassuring, but the ICC result remains the appropriate headline because the research question concerns average-measure absolute agreement.
For a comprehensive measurement study, combine relative reliability with absolute error. The Intraclass Correlation Coefficient tells whether targets can be distinguished consistently across the observed range. Standard error of measurement, minimal detectable change, within-target standard deviation, and agreement plots tell how large repeated differences may be in the original units.
The Intraclass Correlation Coefficient complements correlation, alpha, kappa, and agreement plots but does not replace their distinct estimands.
Intraclass Correlation Coefficient diagnostics and sensitivity checks
Inspect disagreement, rater behavior, influential targets, and alternative defensible models before reporting.
The Intraclass Correlation Coefficient should be supported by diagnostic evidence rather than interpreted from a single coefficient. The worked analysis verifies completeness, rating means, target averages, ANOVA components, and cross-software agreement.
Data and design diagnostics
Statistical sensitivity checks
Completeness
All 649 targets contributed G1, G2, and G3 values. SPSS reported 649 valid cases and zero excluded cases, and the target-average chart confirms complete coverage.
Systematic differences
The rating means increase by about 0.51 points from G1 to G3. Absolute agreement appropriately treats this shift as disagreement, while a consistency ICC would handle it differently.
Cross-software audit
Python, R, SPSS, and Excel agree on the central ICC result. Agreement across independent implementations reduces the risk of a formula, group-order, or rounding error.
Normality should be evaluated as part of the ANOVA error structure, not by demanding that each raw rating column be perfectly bell-shaped. With 649 targets, the estimate is precise, but influential target-level disagreements and model mismatch can still affect practical interpretation. Use outlier detection, histogram interpretation, and Bland–Altman analysis as complementary checks.
Intraclass Correlation Coefficient diagnostics should examine both global reliability and the individual disagreements that may affect decisions.
How to report the Intraclass Correlation Coefficient in APA style
State the model, effects structure, agreement definition, unit, estimate, interval, and F test.
This Intraclass Correlation Coefficient section converts the verified numbers into complete APA-style wording and a reporting checklist.
APA-style worked example
A two-way random-effects, absolute-agreement Intraclass Correlation Coefficient was calculated to evaluate the reliability of the average of three grade-style measurements (G1, G2, and G3) across 649 targets. Average-measure reliability was excellent, ICC(2,k) = .948, 95% CI [.939, .956], F(648, 1296) = 20.25, p < .001. Single-measure reliability was good, ICC(2,1) = .859, 95% CI [.836, .878]. Thus, the average of all three measurements was more reliable than one measurement alone.
Reporting checklist
Common mistakes
The coefficient is usually rounded to two or three decimals, while confidence limits may be rounded to the same precision. Preserve enough digits to distinguish the result from a threshold, but do not report the full machine-precision value in prose. The workbook retains 0.9480614162 for verification; the article reports .948.
Describe the rating unit clearly. “Average measures” means the mean of the three measurements, not the average of several separately calculated ICC values. Similarly, “single measure” means one rating from the modeled rater population, not a coefficient based on a dataset containing only one column.
When the result supports a practical decision, add the minimum required reliability and consequences of error. A coefficient that is excellent for group-level research may still be inadequate for high-stakes individual classification. This distinction connects reliability interpretation with statistical power and Type I and Type II error, but reliability thresholds should be justified by measurement use rather than sample size alone.
A complete Intraclass Correlation Coefficient report names the effects model, agreement definition, measurement unit, estimate, interval, and test.
Intraclass Correlation Coefficient PDF, Excel, and software downloads
Open the exact Python, R, SPSS, and worked Excel analysis files.
This Intraclass Correlation Coefficient section provides the four reproducibility files and relevant internal learning paths.
Python reportANOVA components, ICC(2,1), ICC(2,k), F test, descriptive results, and verified charts.Open report
R reportIndependent R calculation and cross-software validation of the average-measure result.Open report
SPSS outputCase summary, alpha, item correlations, single and average ICC confidence intervals, and F test.Open output
Worked Excel analysisRaw data, row calculations, verified metric ledger, diagnostics, and reporting comparison.Open workbook
Each Intraclass Correlation Coefficient download uses the same dataset and supports direct comparison across Python, R, SPSS, and Excel.
Verified Intraclass Correlation Coefficient sources and result agreement
The published reports and workbook provide an internal audit trail for every central number.
The Intraclass Correlation Coefficient result was checked across four deliverables that use the same 649-target, three-measurement dataset. The agreement shown below is more informative than relying on one software table without a reproducibility record.
SPSS output evidence
The SPSS reliability table reports single-measure ICC = .859 with 95% CI [.836, .878] and average-measure ICC = .948 with 95% CI [.939, .956]. The test statistic is F(648, 1296) = 20.246, p < .001.
Python and R verification
The independent Python and R reports reproduce the ANOVA mean squares and the full-precision average-measure estimate, ICC(2,k) = 0.948061. Their chart ledgers also agree on n = 649 and k = 3.
Excel formula audit
The worked workbook retains the input data, row averages, ANOVA components, diagnostic checks, and reporting ledger so the result can be traced from raw values to the final coefficient.
| Verified quantity | Result | Interpretive role |
|---|---|---|
| Targets and measurements | 649 targets; 3 measurements | Defines n and k in ICC(2,k). |
| Single-measure ICC(2,1) | .859, 95% CI [.836, .878] | Reliability of one measurement. |
| Average-measure ICC(2,k) | .948, 95% CI [.939, .956] | Reliability of the average of three measurements. |
| F test | F(648, 1296) = 20.246, p < .001 | Tests reliability against a true value of zero. |
| Model | Two-way random, absolute agreement | Defines the generalization and disagreement criterion. |
The verified Intraclass Correlation Coefficient ledger reconciles the point estimate, confidence interval, F statistic, sample size, and model.
Intraclass Correlation Coefficient FAQs
Answers to the model-selection, calculation, interpretation, and reporting questions readers most often ask.
This Intraclass Correlation Coefficient section answers the search questions most likely to arise after model selection and calculation.
What is the Intraclass Correlation Coefficient?
The Intraclass Correlation Coefficient is a model-based reliability statistic for repeated quantitative measurements on the same targets. It compares stable between-target variation with rater, occasion, and residual disagreement.
What does ICC(2,k) mean?
ICC(2,k) is a two-way random-effects, absolute-agreement coefficient for the average of k ratings. In this example, k = 3 and the reported unit is the mean of G1, G2, and G3.
What is a good Intraclass Correlation Coefficient?
A common descriptive guide treats values below .50 as poor, .50 to .75 as moderate, .75 to .90 as good, and above .90 as excellent. Requirements should be set by the intended use and consequences of measurement error.
How do I interpret ICC(2,k) = 0.948?
It indicates excellent reliability for the average of the three measurements under the selected absolute-agreement random-effects model. The 95% confidence interval [.939, .956] supports the same conclusion.
Why is the average-measure ICC higher than the single-measure ICC?
Averaging three measurements reduces residual error. The single-measure estimate is .859, while the reliability of the three-measure average is .948.
What is the difference between absolute agreement and consistency?
Absolute agreement requires ratings to be numerically similar. Consistency allows stable rater mean differences as long as targets retain their relative ordering.
What is the difference between ICC(2,k) and ICC(3,k)?
ICC(2,k) treats raters as random and uses absolute agreement. ICC(3,k) usually treats the observed raters as fixed and uses consistency. They support different generalizations and error definitions.
Can Pearson correlation replace ICC?
No. Pearson correlation measures pairwise linear association and can remain perfect when one rater is systematically higher. ICC can assess numerical agreement across more than two measurements.
Can Cronbach’s alpha replace the Intraclass Correlation Coefficient?
Not automatically. Alpha measures internal consistency and may be mathematically related to some ICC forms, but it does not by itself communicate random versus fixed effects, agreement versus consistency, or single versus average measures.
How many targets were included in the worked analysis?
The worked analysis includes 649 complete targets and three measurements per target. SPSS excluded zero cases.
What were the G1, G2, and G3 means?
The means were 11.3991 for G1, 11.5701 for G2, and 11.9060 for G3. The three-rating average had a mean of 11.6251.
What are the ANOVA mean squares?
The target mean square is 24.0838, the rater or occasion mean square is 43.1654, and the residual mean square is 1.1896.
These Intraclass Correlation Coefficient answers emphasize model specification because an unlabeled ICC value is not fully interpretable.
Related reliability and agreement guides
Continue with the methods most closely connected to quantitative reliability and agreement.