
Unequal Group Sizes, Factorial ANOVA, Type I vs Type II vs Type III SS
Unbalanced ANOVA: Formula, Interpretation, SPSS, Python, R and Excel Guide
Unbalanced ANOVA is used when the groups or factor cells in an ANOVA design do not have equal sample sizes. In this worked Salar Cafe example, the dependent variable is G3 final grade, the factors are studytime and school, and the smallest school × studytime cell has only 8 cases while the largest cell has 206 cases. The result shows significant studytime and school effects, while the studytime × school interaction is not significant.
Quick Answer: Unbalanced ANOVA Result
This Unbalanced ANOVA example is unbalanced because the studytime groups and school × studytime cells have unequal sample sizes. The studytime group sizes are 212, 305, 97 and 35, giving a group-size imbalance ratio of 8.71. The cell-size heatmap shows the strongest imbalance at the school × studytime level: the largest cell is GP, studytime 2 = 206, while the smallest cell is MS, studytime 4 = 8.
The final Unbalanced ANOVA summary shows that studytime is significant, F = 12.43, p = 6.557e-08, partial η² = 0.05498. School is also significant, F = 46.2, p = 2.445e-11, partial η² = 0.06723. The studytime × school interaction is not significant, F = 0.3636, p = 0.7793, partial η² = 0.001699.
Final interpretation: The dataset is clearly unbalanced, but both studytime and school still show statistically significant effects on G3. The interaction is not significant, so the final reporting should focus on the main effects and mention that unequal group sizes require careful sum-of-squares selection.
Important reporting point: In an unbalanced ANOVA, Type I, Type II and Type III sums of squares can give different effect allocations. The safest report explains which SS type was used, shows the group-size imbalance, and avoids interpreting the interaction unless the formal interaction p-value supports it.
Table of Contents
- What Is Unbalanced ANOVA?
- Unbalanced ANOVA Formula and Imbalance Ratio
- Type I, Type II and Type III Sums of Squares in Unbalanced ANOVA
- Unbalanced ANOVA Hypotheses
- Dataset and Variables Used
- ANOVA Assumptions for Unequal Group Sizes
- SPSS Output Interpretation
- Python Chart-by-Chart Interpretation
- R Chart-by-Chart Validation
- SPSS, R, Python and Excel Workflows
- Code Blocks for Unbalanced ANOVA
- APA Reporting Wording
- Common Mistakes
- When to Use Unbalanced ANOVA
- Downloads and Resources
- Related Guides
- FAQs
What Is Unbalanced ANOVA?
Unbalanced ANOVA means that the groups in the ANOVA design do not contain equal numbers of observations. In a one-way design, this means the group sample sizes are unequal. In a factorial design, this means the cell sizes for combinations of factors are unequal. The example in this guide is a factorial ANOVA with school and studytime, and the cell counts are clearly unequal.
Unequal group sizes are common in real data. Students do not naturally fall into perfectly equal studytime categories, and schools do not always contribute equal numbers of cases. The issue is not that ANOVA becomes impossible. The issue is that interpretation becomes more sensitive to variance assumptions, model design and the sum-of-squares type used by the software.
In this example, the largest studytime group contains 305 students and the smallest contains 35. At the cell level, GP with studytime 2 contains 206 students, while MS with studytime 4 contains only 8. This is why the analysis is treated as unbalanced rather than as a balanced factorial ANOVA.
Simple definition: Unbalanced ANOVA is ANOVA with unequal group sizes. The analysis can still be valid, but the analyst must report the imbalance and choose Type I, Type II or Type III sums of squares carefully.
This guide connects naturally with One Way ANOVA, Factorial ANOVA, Two Way ANOVA, Balanced ANOVA, ANOVA Assumptions, Fixed Effects ANOVA, ANOVA Effect Size, Eta Squared, Omega Squared and F Distribution.
Unbalanced ANOVA Formula and Imbalance Ratio
The ANOVA model used in this example is a factorial model with two factors and their interaction:
The imbalance ratio compares the largest group size with the smallest group size:
For studytime groups in this dataset:
At the school × studytime cell level, the largest cell is 206 and the smallest is 8. This means the cell-level imbalance is even more visible than the simple studytime-group imbalance.
| Level | Largest N | Smallest N | Ratio | Interpretation |
|---|---|---|---|---|
| Studytime groups | 305 | 35 | 8.71 | Strong imbalance across the four studytime groups. |
| School × studytime cells | 206 | 8 | 25.75 | Very strong cell imbalance in the factorial design. |
ANOVA F Statistic Formula
The F statistic compares the mean square for an effect with the residual mean square. In unbalanced ANOVA, the F statistic is still interpreted through the same general logic, but the effect sum of squares depends on the SS type and model design.
Partial Eta Squared Formula
Partial eta squared gives the practical size of each ANOVA effect. In the final summary, studytime has partial η² = 0.05498, school has partial η² = 0.06723, and the interaction has partial η² = 0.001699.
Type I, Type II and Type III Sums of Squares in Unbalanced ANOVA
Unbalanced ANOVA is strongly connected to the choice of Type I, Type II and Type III sums of squares. When the design is balanced, these methods often lead to the same or very similar conclusions. When the design is unbalanced, the SS type can change how variation is allocated to factors.
| SS Type | Core Question | Order Dependent? | Use in Unbalanced ANOVA |
|---|---|---|---|
| Type I SS | How much does each term add in the order it enters? | Yes | Useful only when the order is theoretically planned. |
| Type II SS | How much does each main effect add after the other main effects? | No for main effects | Useful for additive main-effect models when interaction is not central. |
| Type III SS | How much does each effect add after all other effects? | No in the same contrast setup | Common in SPSS GLM and unbalanced factorial designs with interaction terms. |
The SPSS full factorial output for this guide uses Type III Sum of Squares with school, studytime and school × studytime. The Type III table reports that studytime and school are significant, while the interaction is not significant. The comparison chart also shows why unbalanced ANOVA articles should discuss Type I, Type II and Type III SS rather than reporting a single table without explanation.
Practical rule: In an unbalanced factorial ANOVA, report the SS type. Use Type III when you are reporting a full factorial SPSS-style model with an interaction. Use Type II when the model is additive and the interaction is not part of the research question. Use Type I only when the entry order is meaningful.
Unbalanced ANOVA Hypotheses
The hypotheses are the same general ANOVA hypotheses, but they must be understood in the context of unequal group sizes and the chosen sum-of-squares method.
| Effect | Null Hypothesis | Alternative Hypothesis | Decision in This Output |
|---|---|---|---|
| studytime | Mean G3 does not differ across studytime levels after model adjustment. | At least one studytime level differs in mean G3. | Reject H0. |
| school | Mean G3 does not differ between GP and MS after model adjustment. | Mean G3 differs between GP and MS. | Reject H0. |
| studytime × school | The studytime pattern is the same across schools. | The studytime pattern differs by school. | Fail to reject H0. |
Decision for this example: Studytime and school are statistically significant effects. The studytime × school interaction is not significant. The final report should not claim that the effect of studytime changes significantly between GP and MS.
Dataset and Variables Used
The worked example uses student performance data. The dependent variable is G3 final grade. The factors are studytime and school. The SPSS output reports 649 valid cases and no missing cases for the studytime × school table.
| Variable | Role | Levels / Type | Why It Matters |
|---|---|---|---|
| G3 | Dependent variable | Numeric final grade | The outcome tested by the ANOVA model. |
| studytime | Factor A | 1, 2, 3, 4 | Unequal groups: 212, 305, 97, 35. |
| school | Factor B | GP, MS | Unequal groups: GP = 423, MS = 226. |
| studytime × school | Interaction | Eight cells | Cell sizes range from 8 to 206. |
Cell Size and Mean Pattern
| School | Studytime | N | Mean G3 | Interpretation |
|---|---|---|---|---|
| GP | 1 | 119 | 11.5294 | Lower GP studytime group. |
| GP | 2 | 206 | 12.7330 | Largest cell in the design. |
| GP | 3 | 71 | 13.5634 | Highest GP mean. |
| GP | 4 | 27 | 13.4074 | Small GP cell but high mean. |
| MS | 1 | 93 | 9.9677 | Lower MS studytime group. |
| MS | 2 | 99 | 10.7576 | Moderate MS cell size. |
| MS | 3 | 26 | 12.3077 | Small cell with higher mean. |
| MS | 4 | 8 | 11.8750 | Smallest cell in the design. |
The descriptive pattern shows that GP has a higher overall mean than MS, and higher studytime levels generally have higher G3 means. However, because the interaction is not significant, the final interpretation should focus on the main studytime and school effects.
For supporting concepts, review Descriptive Statistics, Mean Median and Mode, Standard Deviation, Variance, Confidence Interval, P Value, Null and Alternative Hypothesis and Effect Size.
ANOVA Assumptions for Unequal Group Sizes
Unbalanced ANOVA still depends on the usual ANOVA assumptions. Unequal group sizes do not automatically invalidate ANOVA, but they make assumption checking more important. The most important concerns are independence, normally distributed residuals, and similar error variances across groups.
| Assumption | What It Means | How This Example Handles It |
|---|---|---|
| Continuous outcome | The dependent variable should be numeric. | G3 is a numeric final grade. |
| Categorical factors | The independent variables should define groups. | studytime and school define the factor cells. |
| Independence | Each observation should contribute one independent score. | Each student contributes one G3 score. |
| Unequal group sizes | Cells can have different N values. | Cell sizes range from 8 to 206. |
| Homogeneity of variance | Error variances should be reasonably similar. | Levene’s test is significant, so report caution. |
| Residual pattern | Residuals should not show severe model pattern. | Residuals are centered around zero but include several large negative values. |
For assumption support, use ANOVA Assumptions, Levene Test, Bartlett’s Test, Brown-Forsythe Test, Brown Forsythe ANOVA, Q-Q Plot Normality Check, P-P Plot Normality Check, Shapiro-Wilk Test and Outlier Detection.
SPSS Output Interpretation for Unbalanced ANOVA
The SPSS output uses UNIANOVA G3 BY school_id studytime with /METHOD=SSTYPE(3) and the full factorial design school_id studytime school_id × studytime. This is a suitable SPSS-style setup for an unbalanced factorial design because Type III sums of squares test each effect after the other model terms.
SPSS Reading Order
| SPSS Output Area | What to Read | Why It Matters |
|---|---|---|
| Crosstab | studytime × school_id cell counts | Confirms the design is unbalanced. |
| Means table | G3 means by studytime and school | Shows the practical mean pattern. |
| Levene test | Based on mean p = .001 | Shows variance assumption pressure. |
| Syntax | /METHOD=SSTYPE(3) | Confirms Type III sums of squares. |
| Design line | school_id studytime school_id*studytime | Confirms full factorial model. |
| Tests of Between-Subjects Effects | F, p and partial eta squared | Main statistical decision table. |
SPSS Type III ANOVA Table
| Source | Type III SS | df | Mean Square | F | Sig. | Partial η² | Interpretation |
|---|---|---|---|---|---|---|---|
| Corrected Model | 897.822 | 7 | 128.260 | 14.017 | < .001 | .133 | The full factorial model is significant. |
| school_id | 160.873 | 1 | 160.873 | 17.581 | < .001 | .027 | School is significant in the Type III table. |
| studytime | 319.327 | 3 | 106.442 | 11.632 | < .001 | .052 | Studytime is significant in the Type III table. |
| school_id × studytime | 9.982 | 3 | 3.327 | .364 | .779 | .002 | The interaction is not significant. |
| Error | 5865.444 | 641 | 9.150 | Residual variation. | |||
| Corrected Total | 6763.267 | 648 | Total corrected G3 variation. |
SPSS Type I Comparison Table
The SPSS output also includes a Type I comparison table. In that sequential table, school entered first has SS = 546.629, studytime has SS = 341.212, and the interaction has SS = 9.982. This comparison is included because unbalanced designs can shift sums of squares across effects depending on the SS type and model order.
SPSS interpretation summary: The design is unbalanced, the full factorial model is significant, and both school and studytime are significant. The interaction is not significant. Levene’s test is significant, so the final report should include a variance-assumption caution and avoid overclaiming precision.
Python Chart-by-Chart Interpretation
The Python chart sequence explains Unbalanced ANOVA through unequal group sizes, mean differences, distribution shape, cell-size imbalance, sum-of-squares sensitivity, p-value decisions, residual diagnostics and the final summary table.
Python Chart 1: Unbalanced Group Sizes
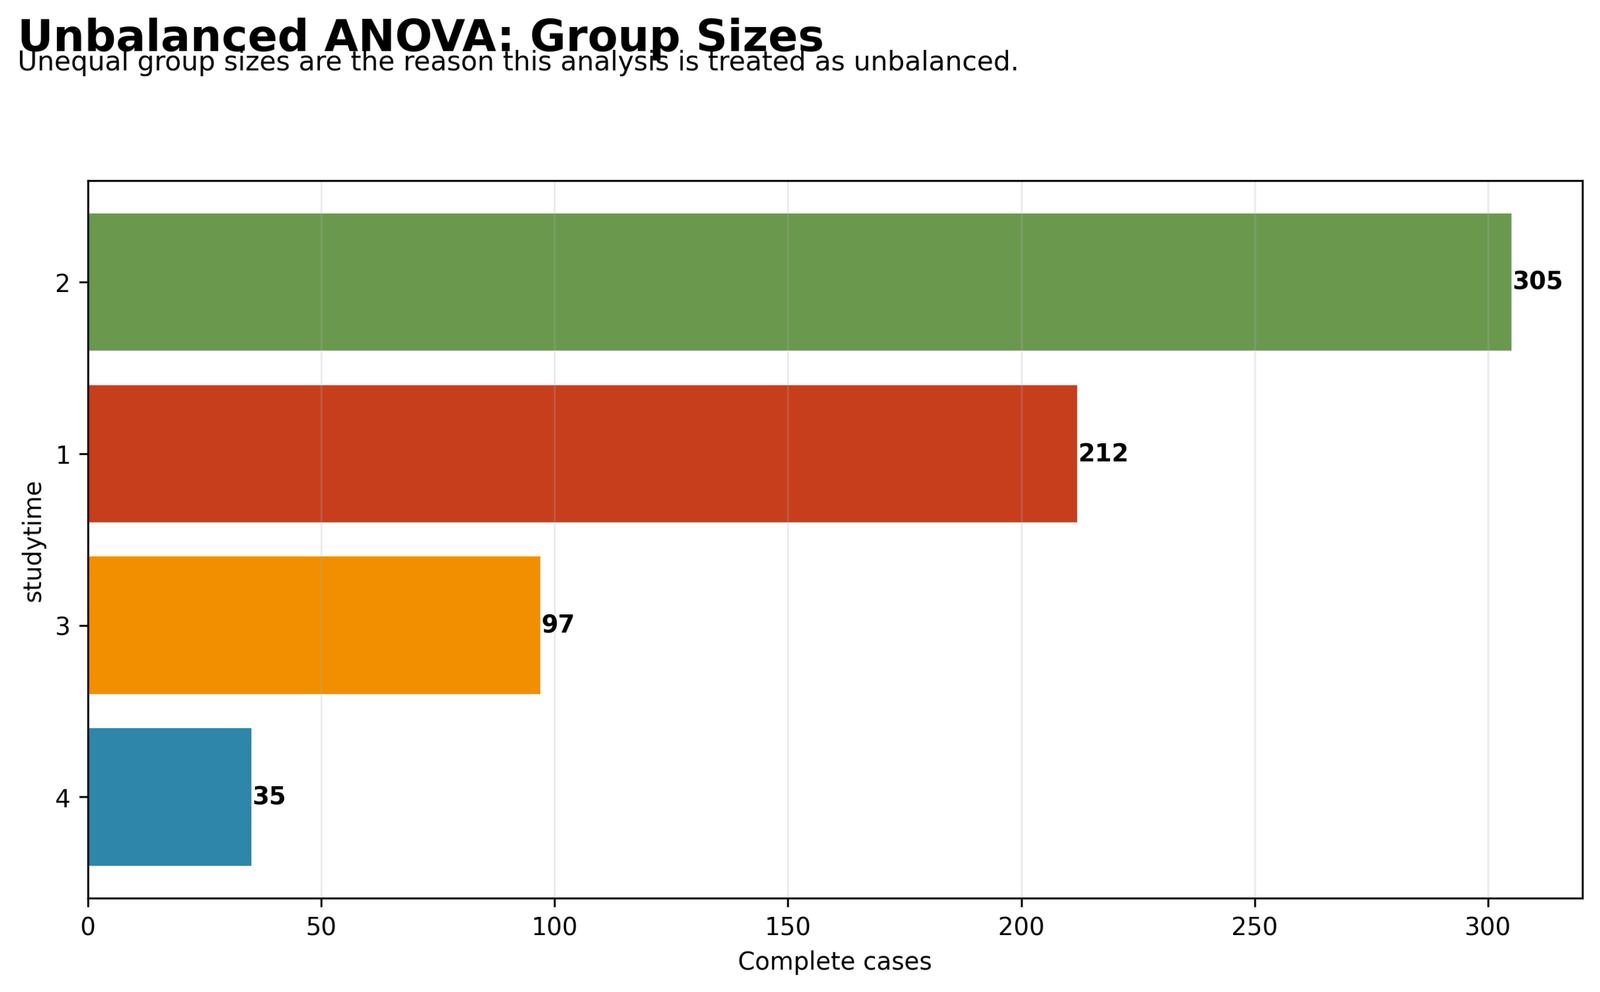
The first chart proves why this example is an unbalanced ANOVA. Studytime level 2 has 305 cases, studytime level 1 has 212 cases, studytime level 3 has 97 cases, and studytime level 4 has only 35 cases.
The imbalance ratio is 8.71 because the largest studytime group is more than eight times larger than the smallest group. This matters because unequal group sizes can make the ANOVA result more sensitive to the chosen sum-of-squares method.
Python Chart 2: Mean G3 by Studytime
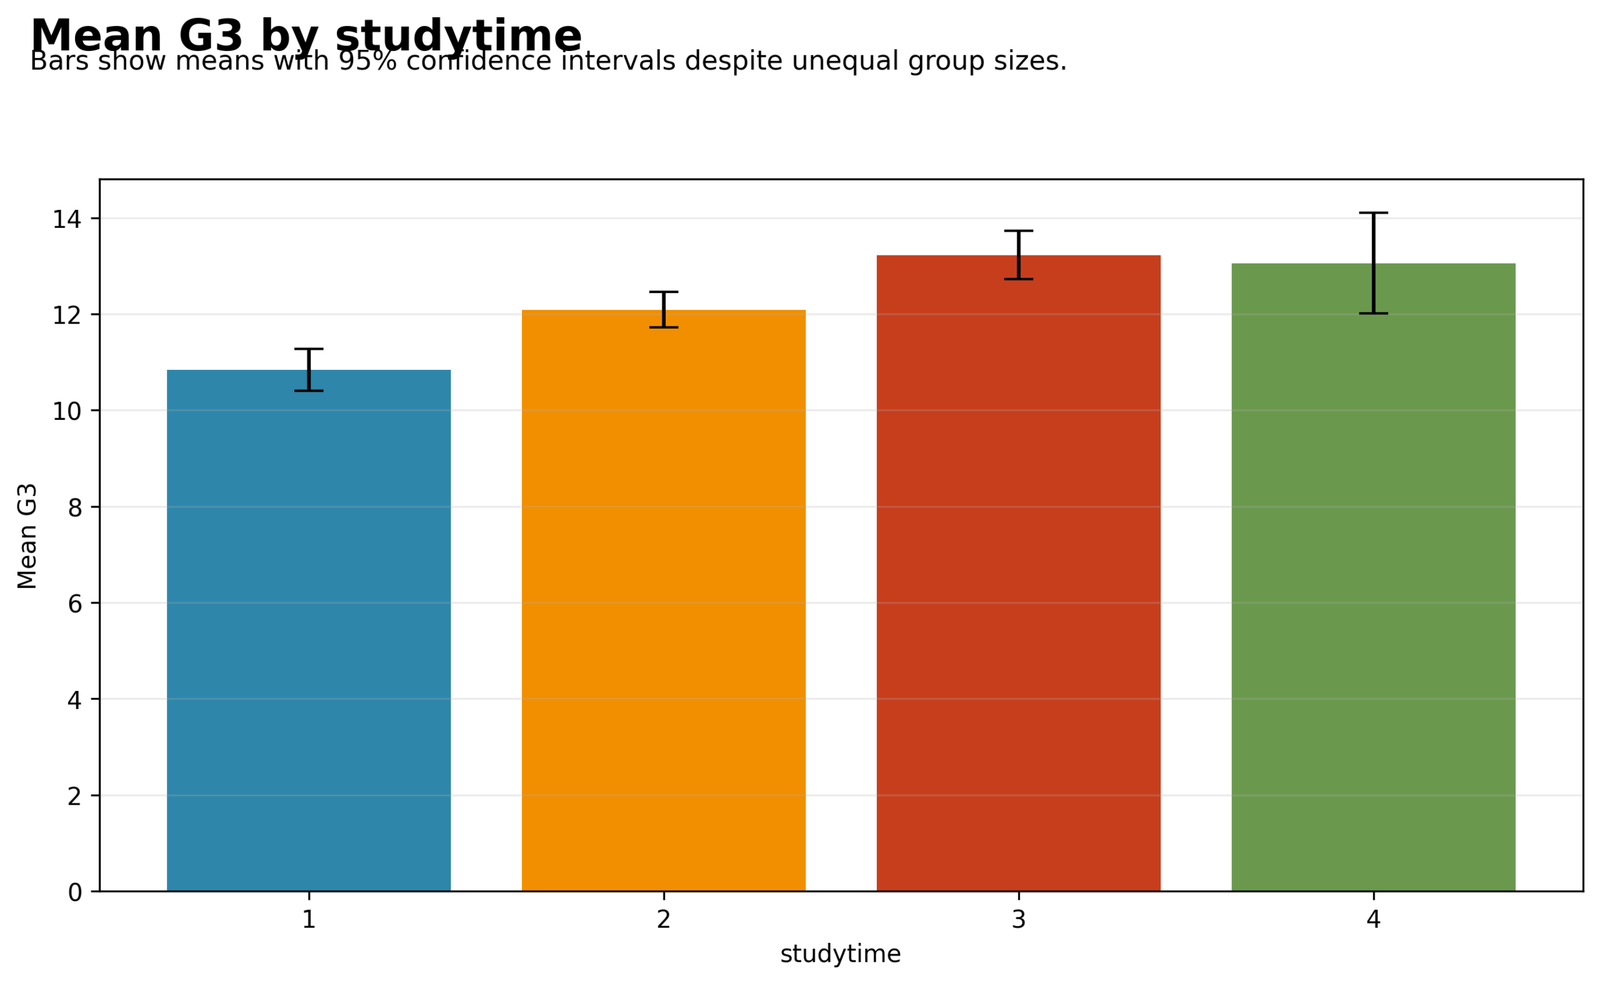
The mean chart shows a clear increase from studytime 1 to studytime 3, with studytime 4 remaining high. The mean G3 values are about 10.84, 12.09, 13.23 and 13.06 across studytime levels 1 to 4.
Because studytime group 4 is much smaller, its confidence interval is wider. This is a key feature of unbalanced ANOVA: smaller groups carry more uncertainty even when their mean is high.
Python Chart 3: Distribution by Studytime
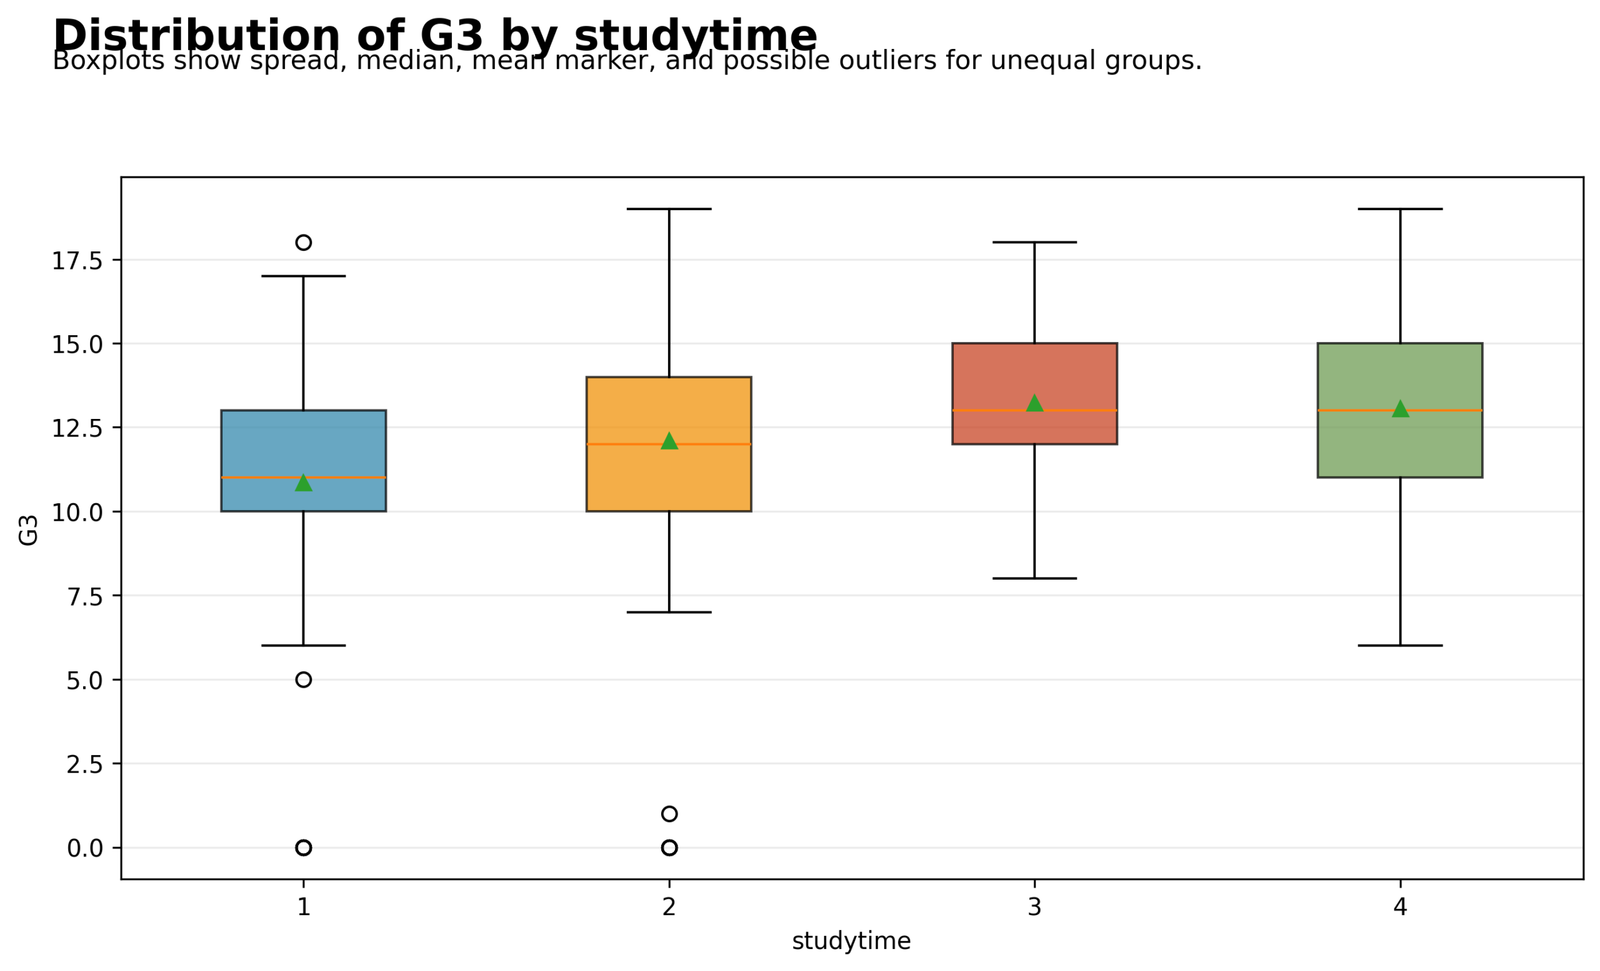
The boxplots show that higher studytime levels tend to have higher central G3 values. Studytime 1 has the lowest central pattern, while studytime 3 and studytime 4 have higher distributions.
Low outlying scores are visible in some groups. This supports the need for assumption checking because unequal group sizes and unequal variance patterns can make standard ANOVA more sensitive.
Python Chart 4: Cell Size Heatmap
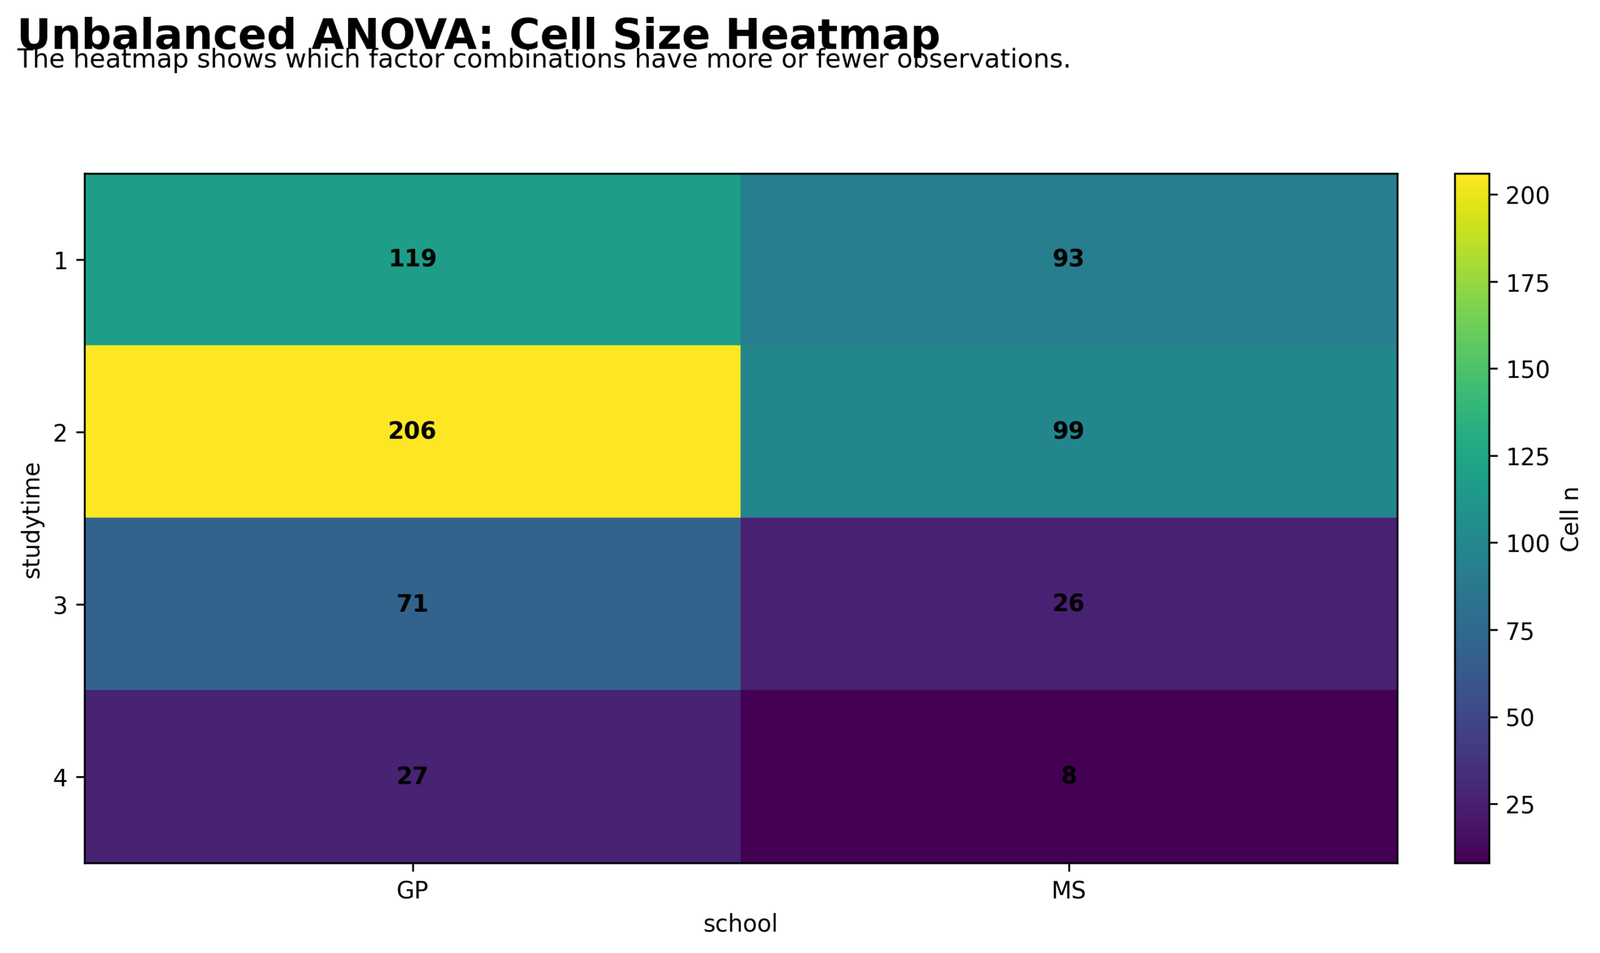
The heatmap gives the clearest view of factorial imbalance. GP studytime 2 has 206 cases, while MS studytime 4 has only 8 cases. Other cells also differ substantially, including GP studytime 1 with 119 cases and MS studytime 3 with 26 cases.
This cell imbalance is why unbalanced factorial ANOVA should not be treated like a perfectly balanced design. The analyst must report how the design is unbalanced and explain which sum-of-squares method was used.
Python Chart 5: Type I, II and III Sum-of-Squares Comparison
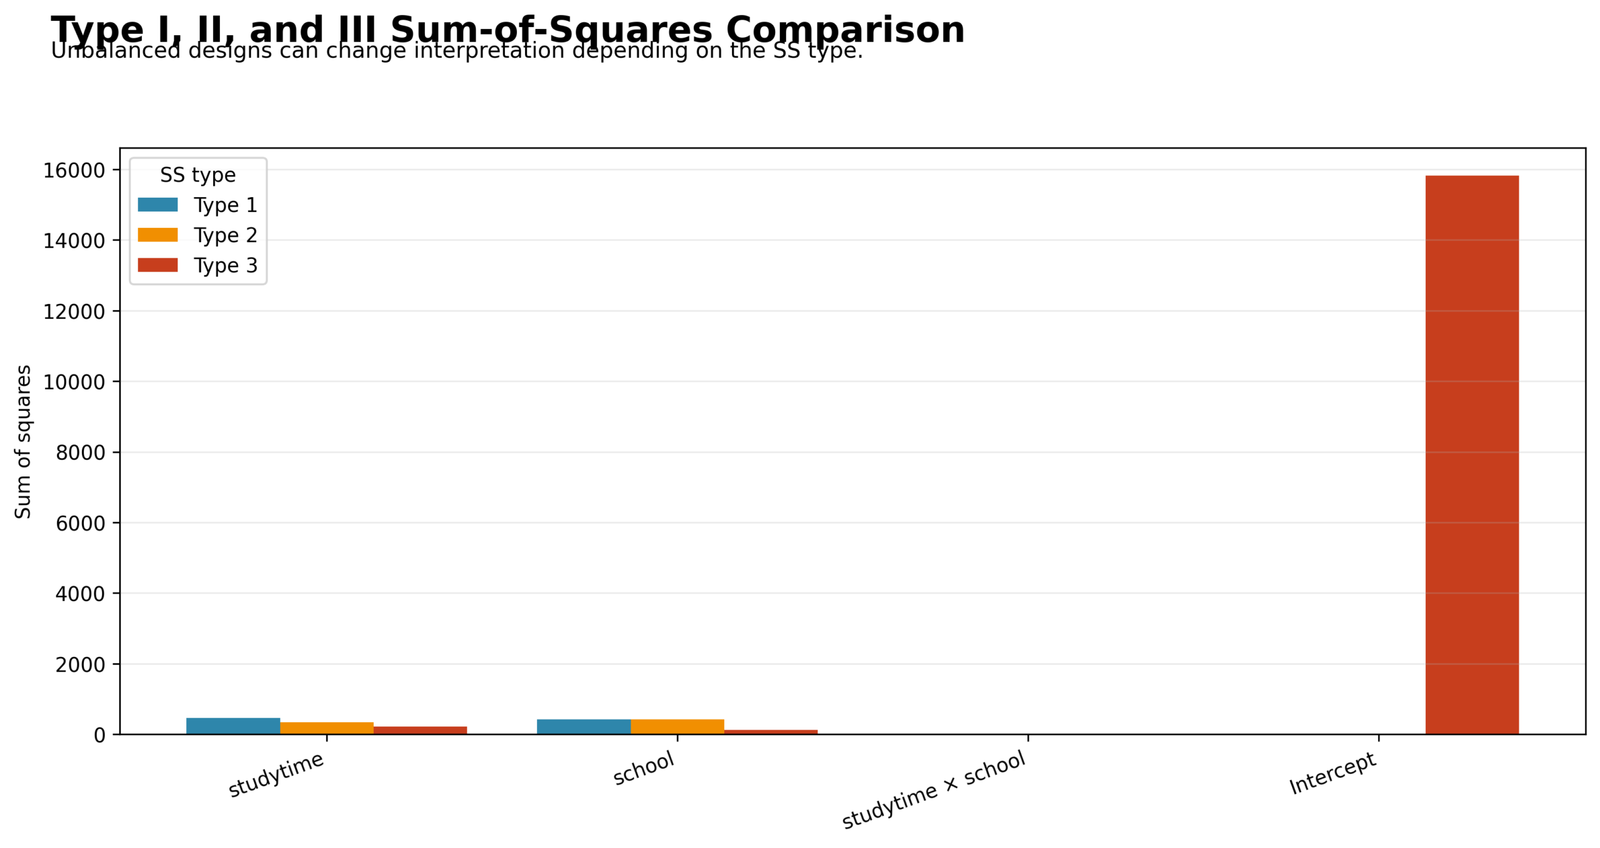
The sum-of-squares comparison chart shows why unbalanced ANOVA needs special explanation. Type I, Type II and Type III methods can allocate different sums of squares to studytime and school because the design is not balanced.
The chart also shows that the intercept can dominate the vertical scale in Type III output. The substantive interpretation should focus on studytime, school and the interaction, not on the intercept.
Python Chart 6: Effect p-value Decision
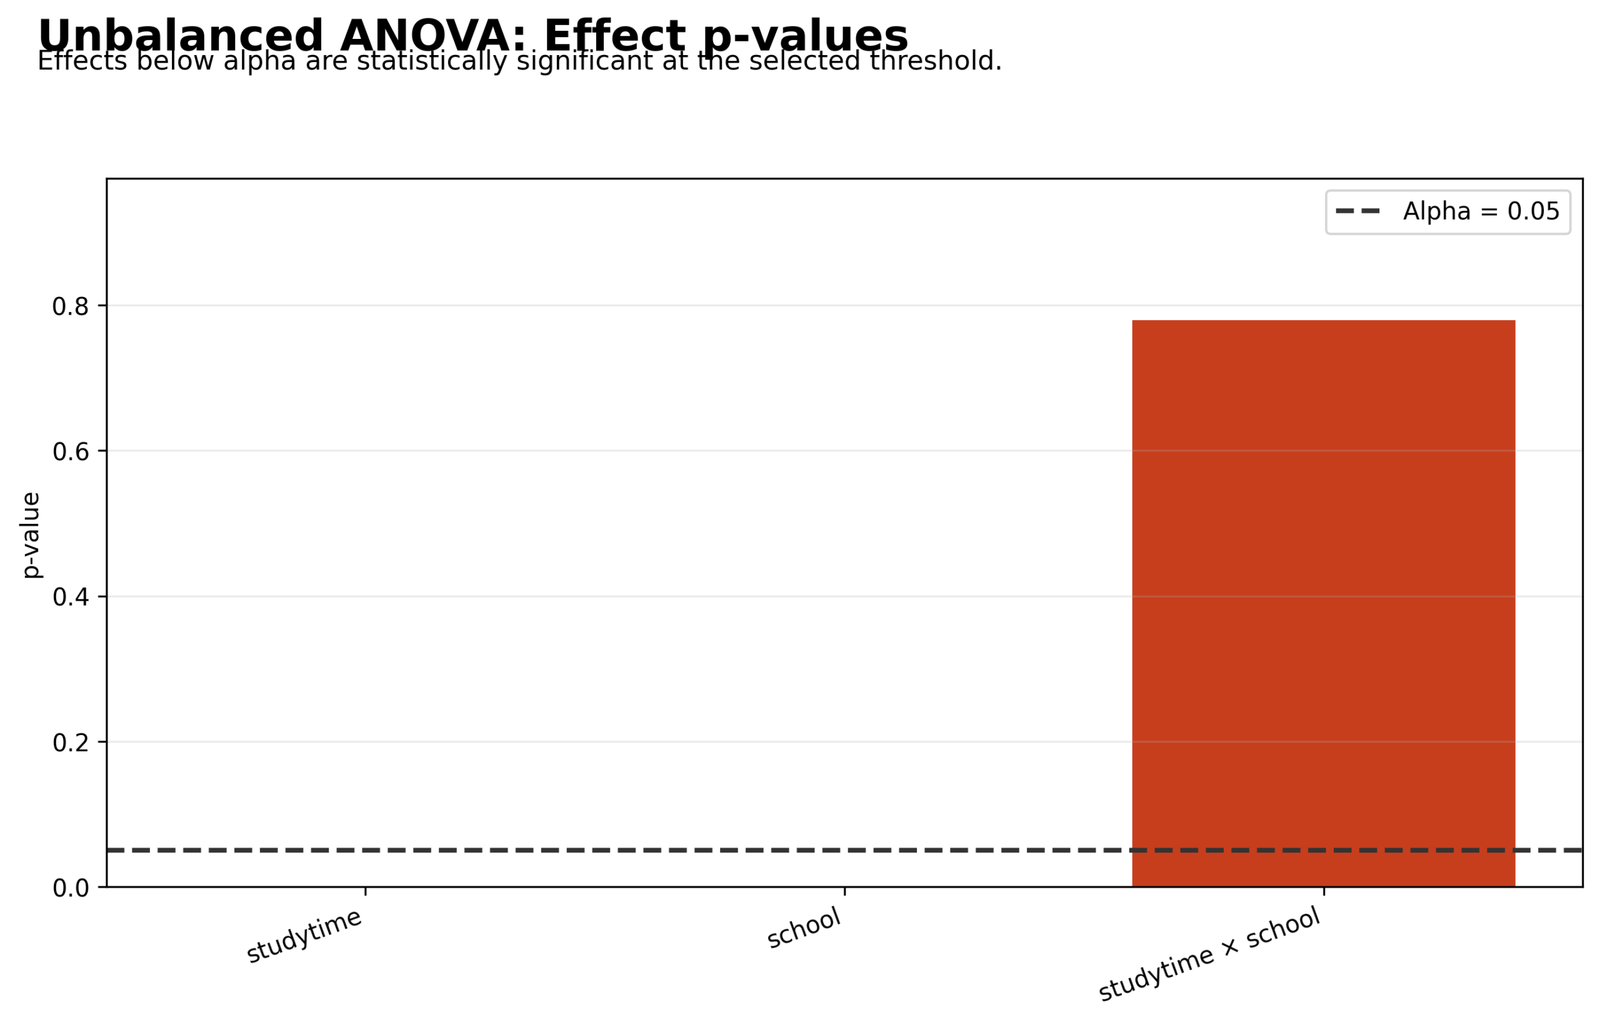
The p-value chart shows that studytime and school are below the alpha = .05 line. The interaction is far above the threshold with p = 0.7793.
This chart gives the clearest decision message. The main effects are significant, but the interaction is not significant and should not be interpreted as a real difference in studytime pattern by school.
Python Chart 7: Residuals vs Fitted Values
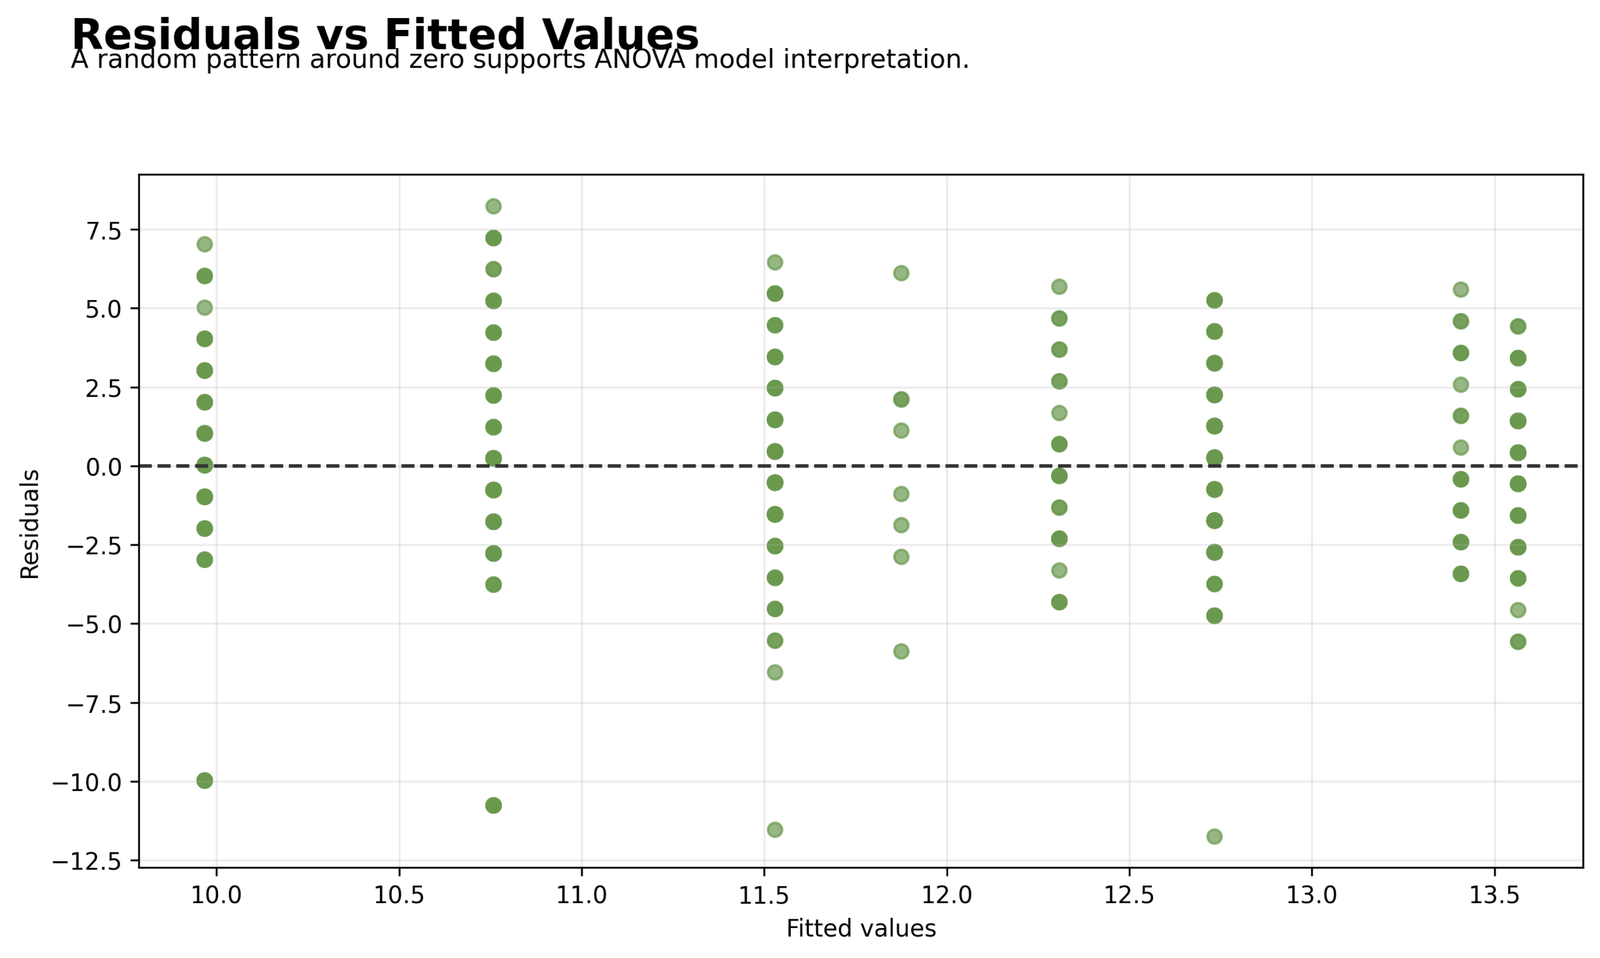
The residual plot shows vertical bands because the model predicts group-cell means from categorical factors. Most residuals are distributed around zero, but several large negative residuals are visible.
This diagnostic supports using the ANOVA result with caution. The model captures average group patterns, but individual observations can still be far from the fitted cell mean.
Python Chart 8: Unbalanced ANOVA Summary Table
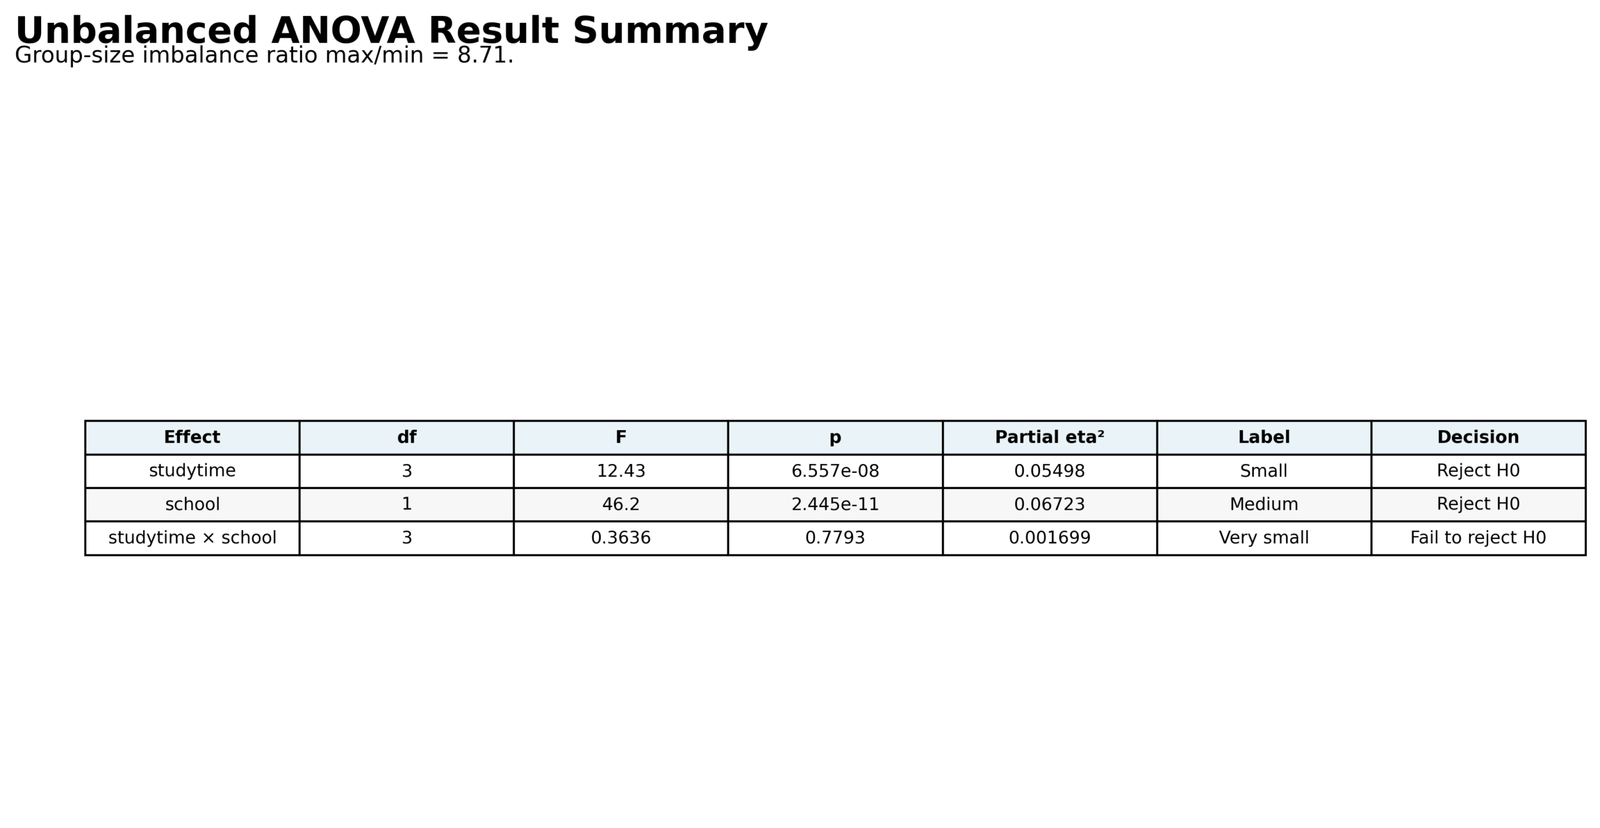
The summary table reports the final decisions: studytime is significant, school is significant, and the studytime × school interaction is not significant. The table also reports the imbalance ratio of 8.71.
This is the best table for final reporting because it places the inferential result beside the unbalanced-design warning. It makes clear that the results should be interpreted with both statistical significance and group-size imbalance in mind.
R Chart-by-Chart Validation
The R charts validate the same Unbalanced ANOVA workflow using a second software environment. The R output confirms the unequal group sizes, the same mean pattern, the same cell-size imbalance, the same sum-of-squares concern, and the same final decision pattern.
R Chart 1: Unbalanced Group Sizes
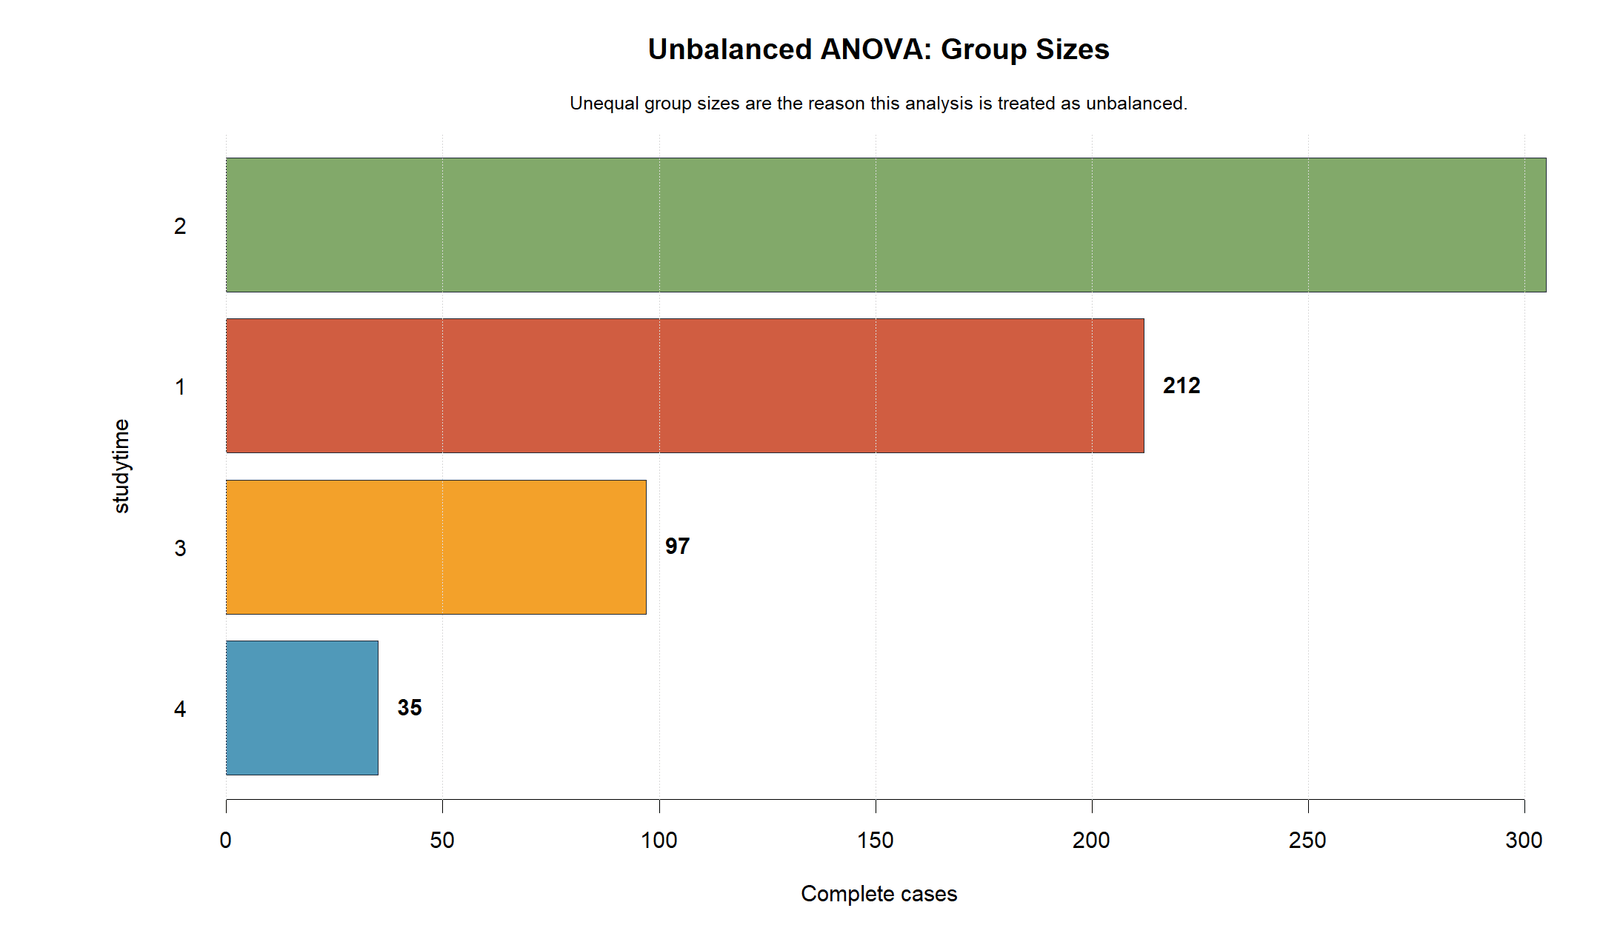
The R group-size chart confirms that the design is not balanced. Studytime level 2 is the largest group, and studytime level 4 is the smallest group.
This confirms that the unbalanced-design issue is not a plotting artifact. It is a real property of the dataset.
R Chart 2: Mean G3 by Studytime
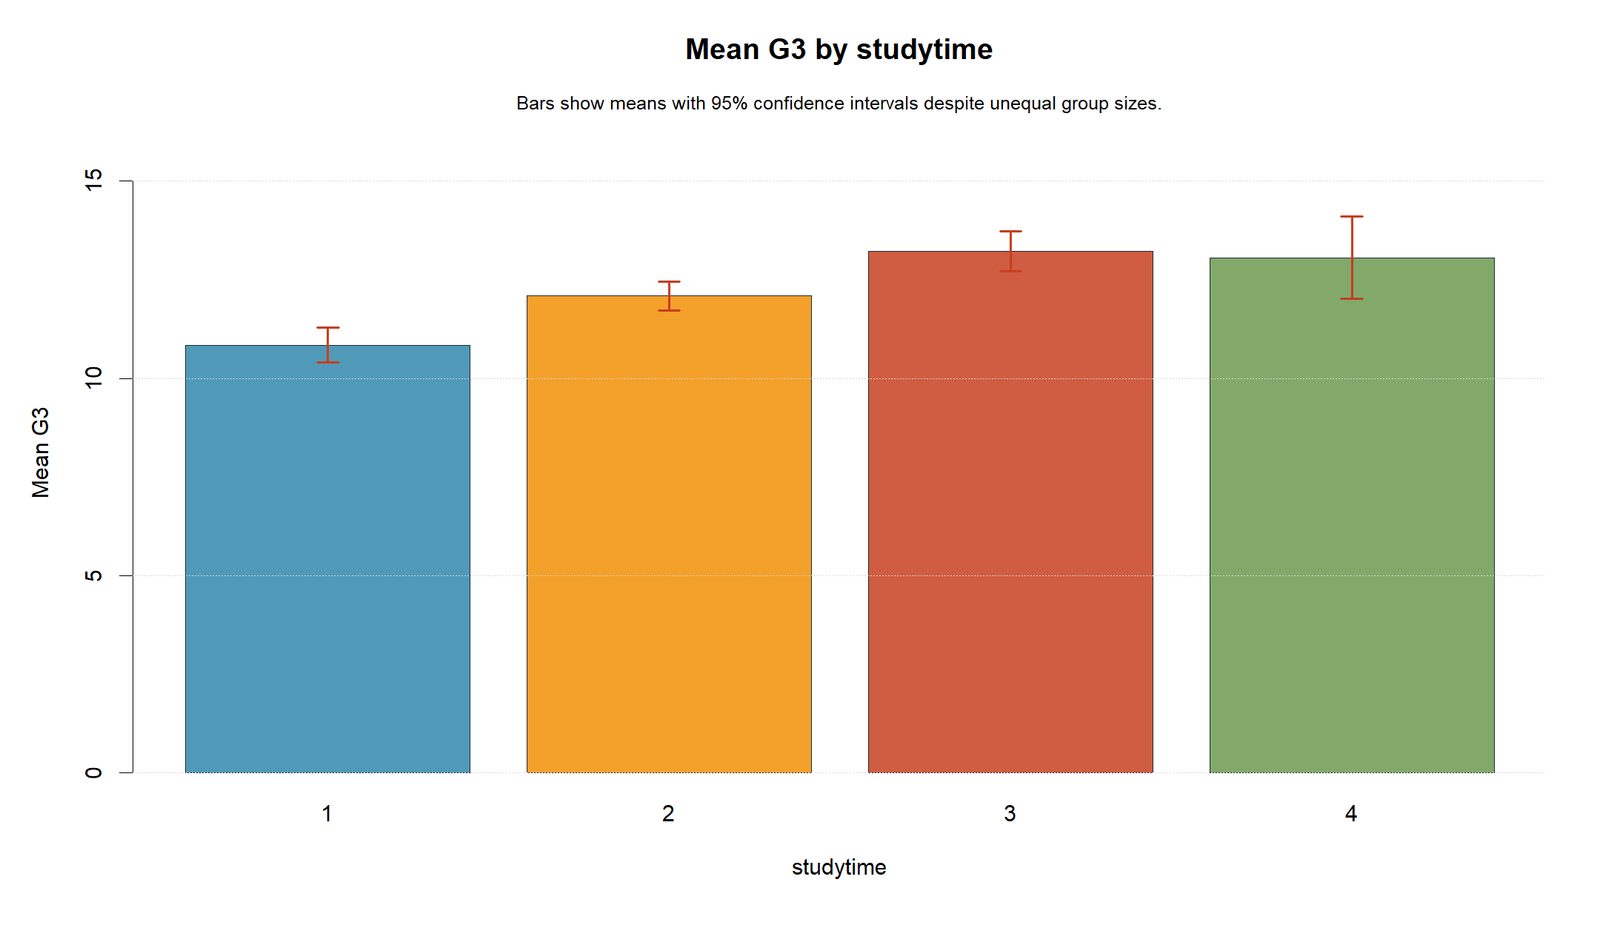
The R mean chart confirms the upward studytime pattern. Studytime 1 has the lowest mean, while studytime 3 and studytime 4 have higher means.
The wider uncertainty for smaller groups reinforces the main lesson of unbalanced ANOVA: means must be interpreted together with sample sizes.
R Chart 3: Distribution by Studytime
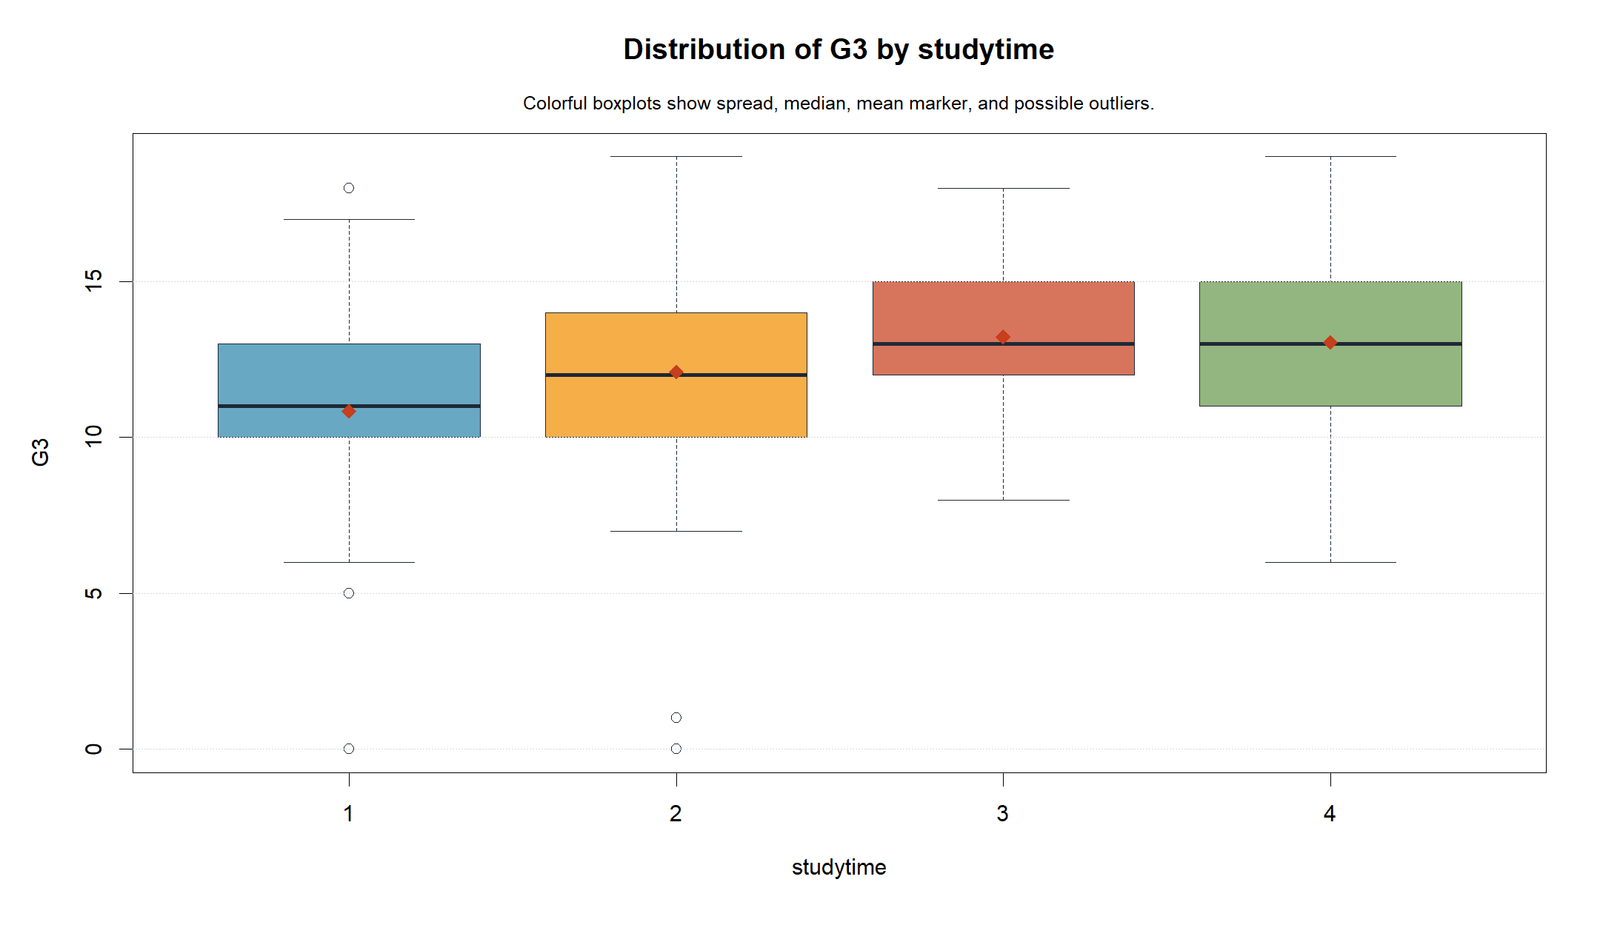
The R boxplots confirm the same distribution pattern as Python. Higher studytime groups have higher central values, but group spread and outliers still need attention.
This supports the final interpretation that studytime is significant while still requiring assumption-aware reporting.
R Chart 4: Cell Size Heatmap
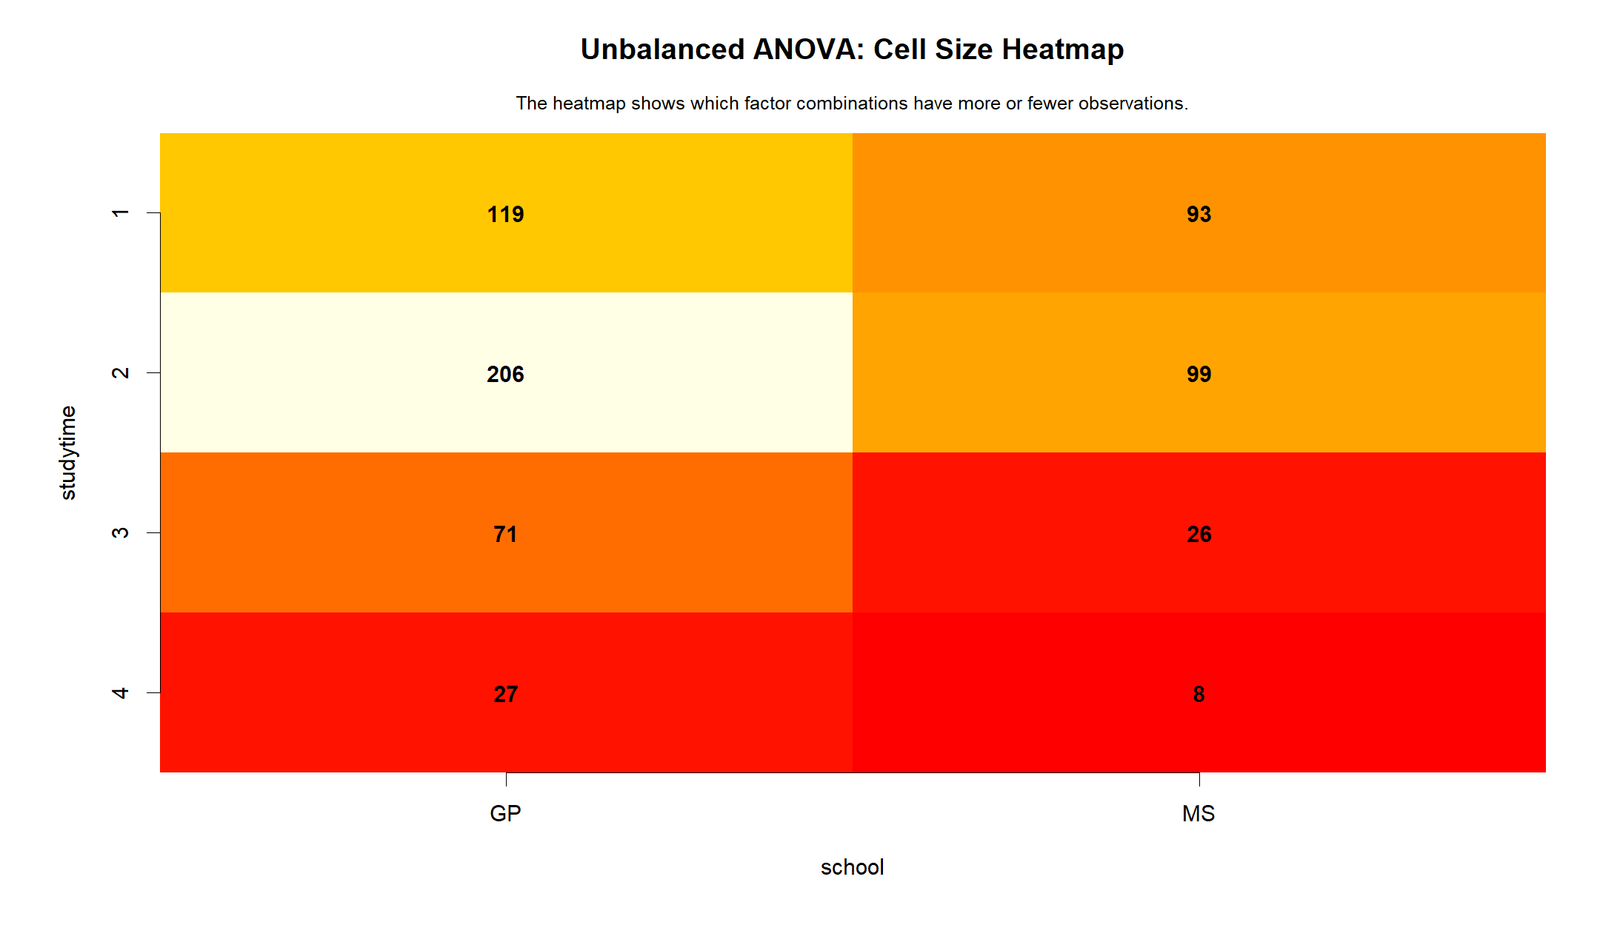
The R heatmap confirms the strongest cell imbalance. GP studytime 2 is much larger than the MS studytime 4 cell.
This validates the design warning and supports reporting the exact cell counts in the article.
R Chart 5: Type I Order Sensitivity
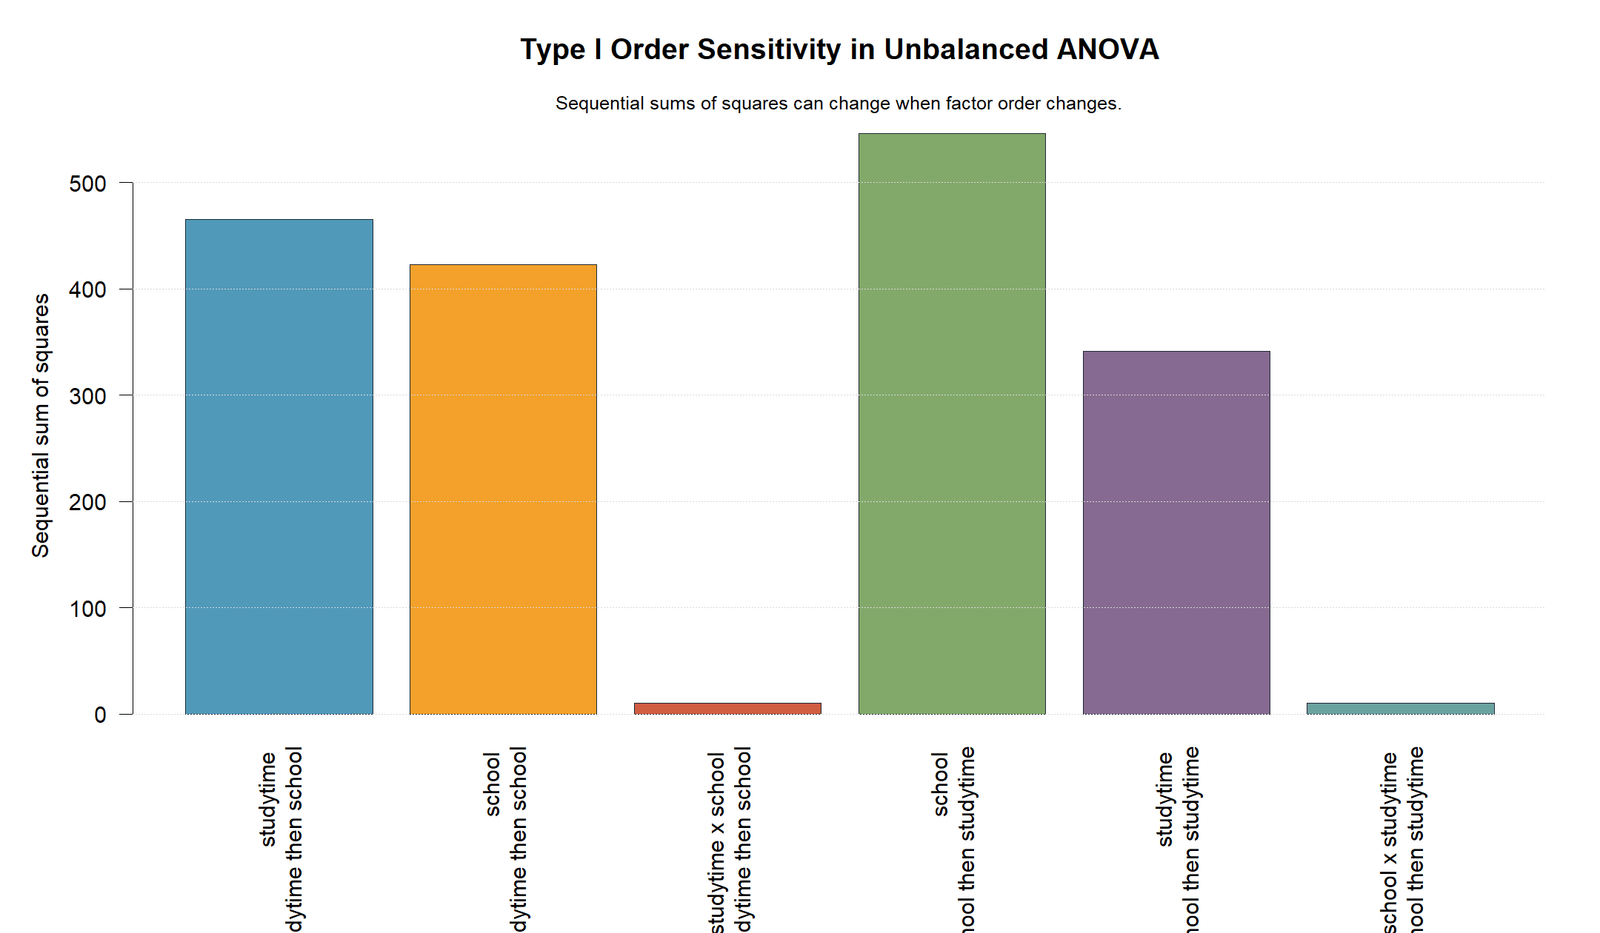
The R chart emphasizes that Type I sums of squares can change when factor order changes. This is one of the most important teaching points in unbalanced ANOVA.
The chart helps explain why researchers should not report a Type I result without stating the order of entry, especially in unbalanced data.
R Chart 6: Effect p-value Decision
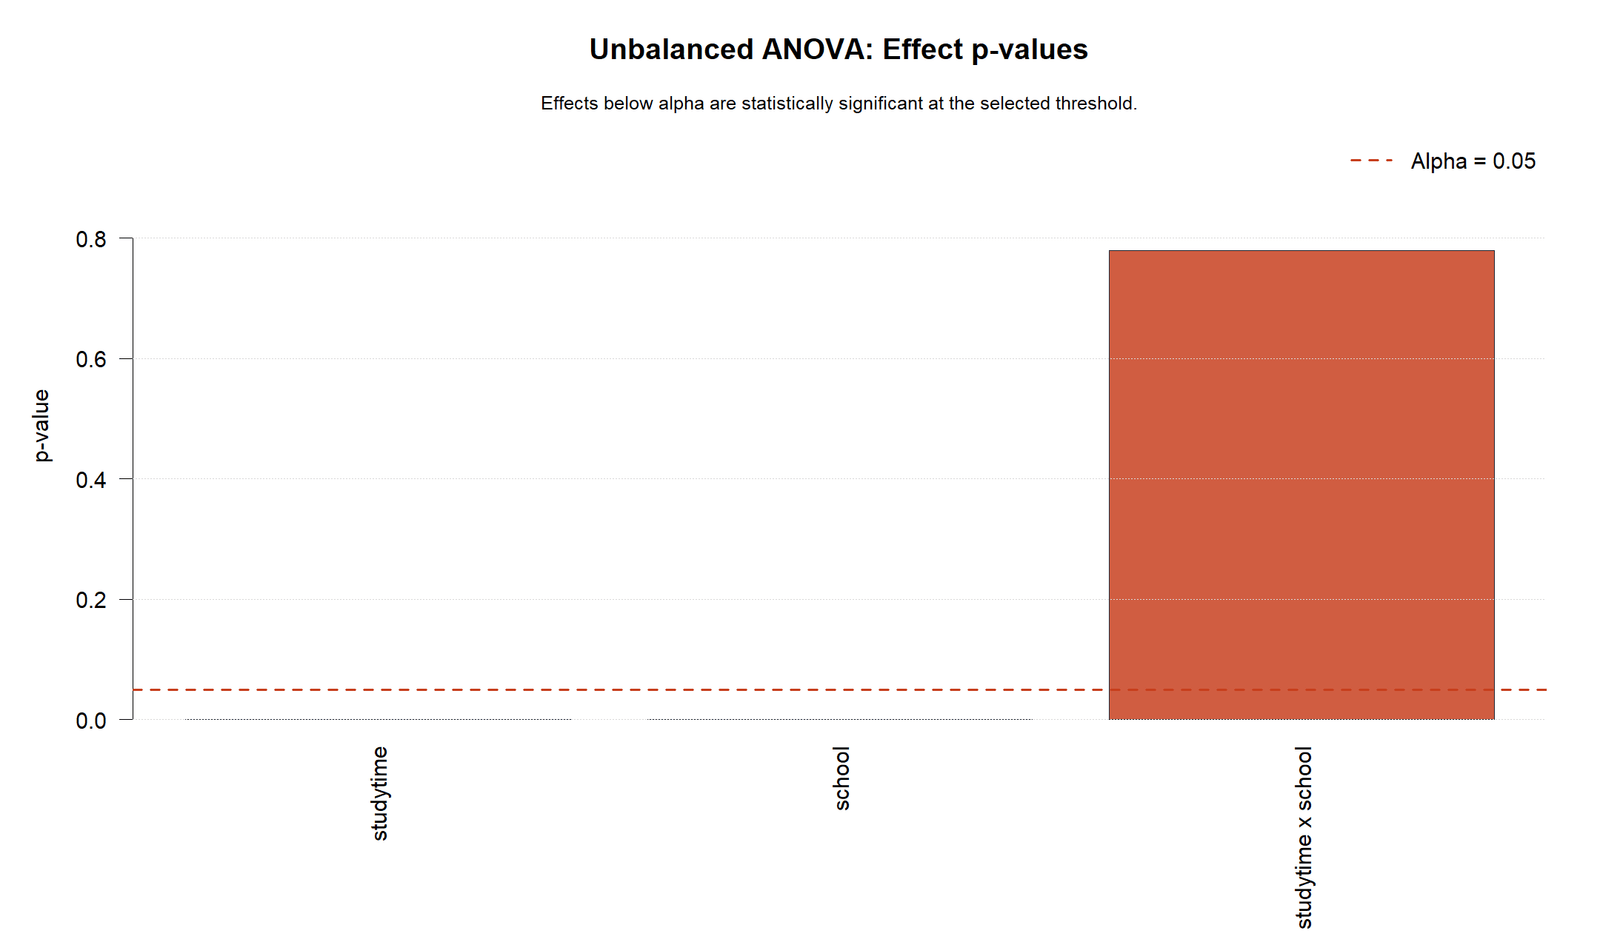
The R p-value chart confirms that studytime and school are significant, while the studytime × school interaction is not.
This agreement across R, Python and SPSS makes the conclusion stable even though the group sizes are unequal.
R Chart 7: Residuals vs Fitted Values
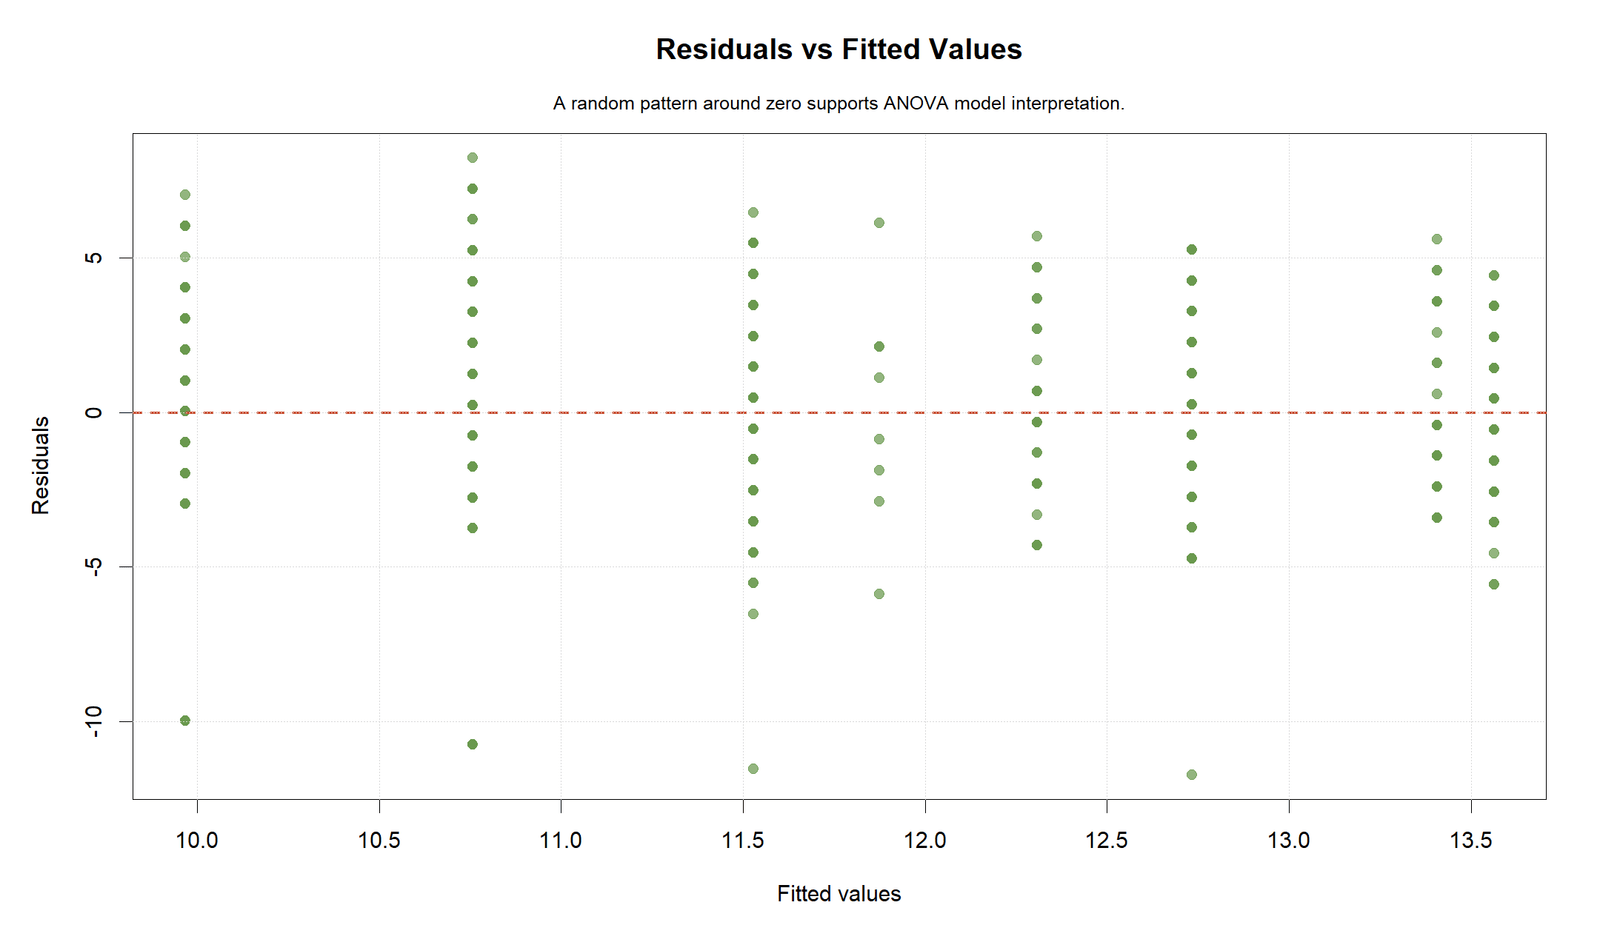
The R residual plot confirms the same diagnostic message as Python. Residuals are centered around zero, but several large residuals remain visible.
This supports reporting both the main ANOVA result and the assumption context rather than presenting the p-values alone.
R Chart 8: Unbalanced ANOVA Summary Table
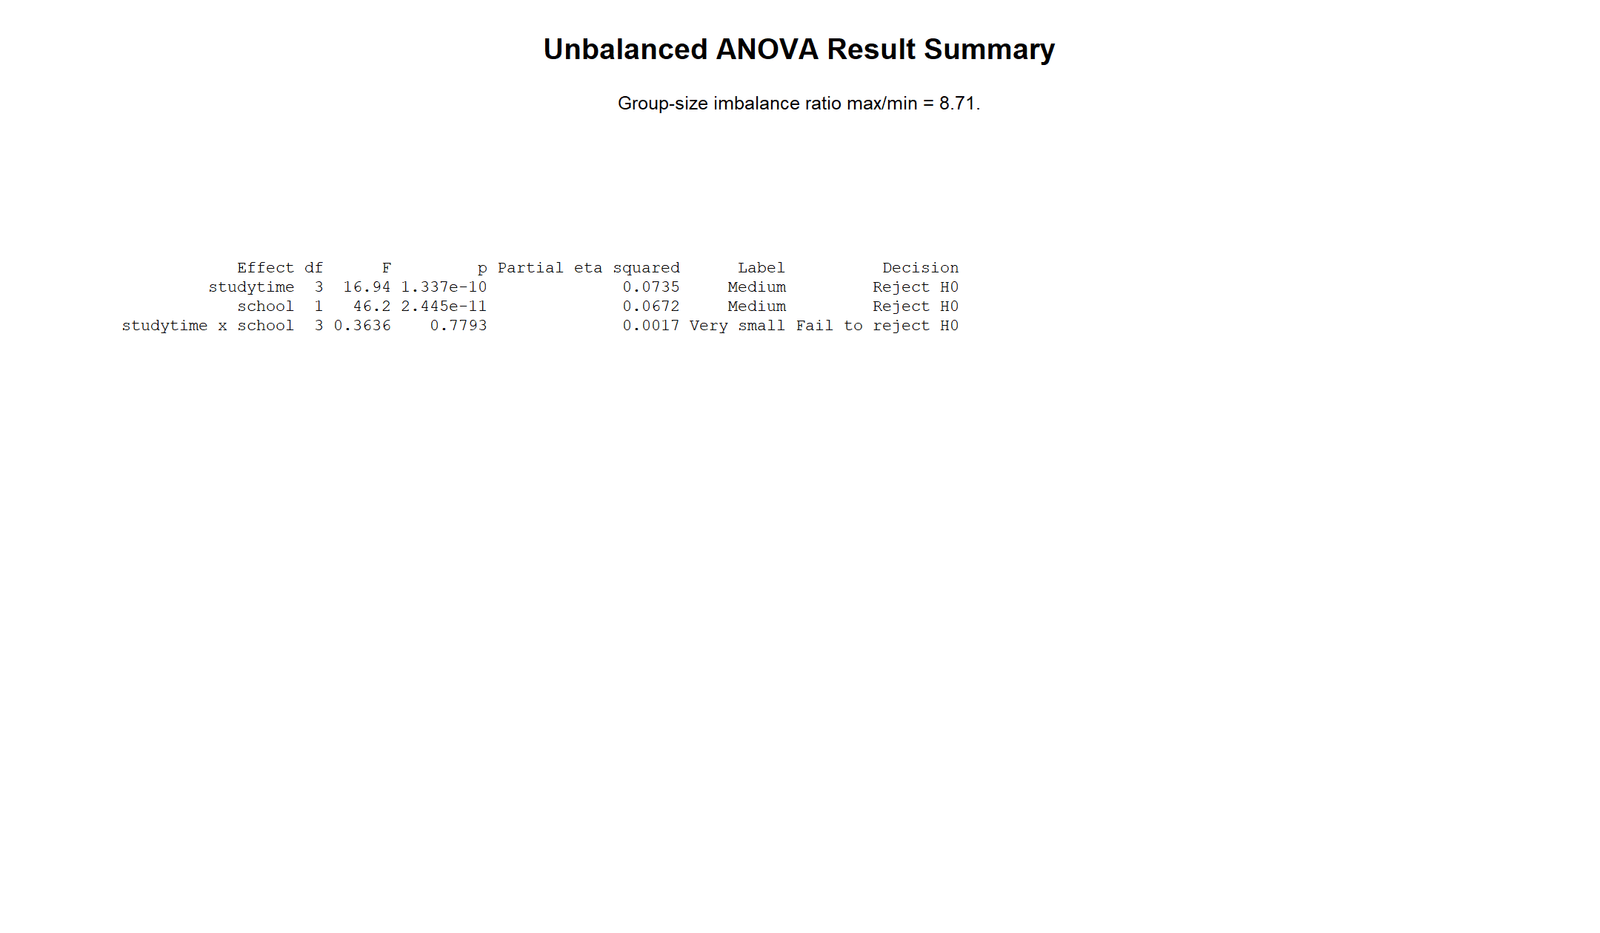
The R summary table confirms the same final decision as Python. Studytime and school are significant, while the interaction is not significant.
This software-to-software validation is useful for publication because it confirms that the interpretation does not depend on only one tool.
SPSS, R, Python and Excel Workflows for Unbalanced ANOVA
The same Unbalanced ANOVA workflow can be reproduced in SPSS, R, Python and Excel. SPSS commonly uses Type III SS for full factorial GLM output. R can use car::Anova() with Type II or Type III depending on the research question. Python can use statsmodels with anova_lm(). Excel can summarize unequal group sizes and means, but SPSS, R or Python is better for a formal unbalanced factorial ANOVA table.
SPSS Workflow
| Step | SPSS Menu or Syntax | Purpose |
|---|---|---|
| Open dataset | File > Open > Data | Load G3, school and studytime. |
| Check group sizes | Crosstabs studytime by school | Confirm the design is unbalanced. |
| Use GLM Univariate | Analyze > General Linear Model > Univariate | Run the factorial ANOVA. |
| Set dependent variable | G3 | Define the outcome. |
| Set fixed factors | school and studytime | Define categorical factors. |
| Set Type III SS | /METHOD=SSTYPE(3) | Use a common SPSS approach for unbalanced factorial models. |
| Read output | Tests of Between-Subjects Effects | Interpret F, p and partial eta squared. |
R Workflow
| Step | R Action | Purpose |
|---|---|---|
| Read data | read.csv("dataset.csv") | Load the dataset. |
| Convert factors | factor(school), factor(studytime) | Define categorical variables. |
| Check counts | table(studytime, school) | Show cell imbalance. |
| Fit full model | lm(G3 ~ school * studytime) | Run factorial ANOVA model. |
| Type III table | car::Anova(model, type = 3) | Report adjusted effects. |
| Diagnostics | Residual plot, Levene test and mean plots | Support assumption-aware interpretation. |
Python Workflow
| Step | Python Action | Purpose |
|---|---|---|
| Read data | pandas.read_csv() | Load G3, school and studytime. |
| Check group sizes | pd.crosstab() | Confirm unbalanced cells. |
| Fit model | ols("G3 ~ C(school) * C(studytime)") | Fit full factorial model. |
| Compare SS types | anova_lm(model, typ=1/2/3) | Show why imbalance matters. |
| Effect sizes | Partial eta squared | Report practical size. |
| Charts | Group sizes, means, heatmap, p-values and residuals | Explain results visually. |
Excel Workflow
| Excel Task | Formula or Tool | Purpose |
|---|---|---|
| Prepare data | Columns for G3, school and studytime | Organize the dataset. |
| Check group sizes | PivotTable counts | Identify unequal groups and cells. |
| Compute means | PivotTable averages | Summarize G3 by factor levels. |
| Create heatmap | Conditional formatting on cell counts | Show imbalance visually. |
| Create mean chart | Column chart or line chart | Explain group mean differences. |
| Formal ANOVA | Use SPSS, R or Python | Excel is not ideal for Type III unbalanced factorial ANOVA. |
Code Blocks for Unbalanced ANOVA
SPSS Syntax for Unbalanced ANOVA
* Unbalanced ANOVA in SPSS.
* Dependent variable: G3.
* Factors: school_id and studytime.
* Full factorial model with Type III sums of squares.

TITLE "Unbalanced ANOVA: G3 by School and Studytime".

CROSSTABS
  /TABLES=studytime BY school_id
  /CELLS=COUNT ROW COLUMN.

MEANS TABLES=G3 BY studytime BY school_id
  /CELLS=COUNT MEAN STDDEV MIN MAX.

UNIANOVA G3 BY school_id studytime
  /METHOD=SSTYPE(3)
  /INTERCEPT=INCLUDE
  /PRINT=DESCRIPTIVE ETASQ HOMOGENEITY PARAMETER OPOWER
  /CRITERIA=ALPHA(.05)
  /DESIGN=school_id studytime school_id*studytime.

OUTPUT EXPORT
  /CONTENTS EXPORT=VISIBLE
  /PDF DOCUMENTFILE="unbalanced_anova_spss_output.pdf".
Python Code for Unbalanced ANOVA
import pandas as pd
from statsmodels.formula.api import ols
from statsmodels.stats.anova import anova_lm

df = pd.read_csv("dataset.csv")

df["G3"] = pd.to_numeric(df["G3"], errors="coerce")
df["school"] = df["school"].astype("category")
df["studytime"] = df["studytime"].astype("category")

data = df[["G3", "school", "studytime"]].dropna().copy()

# Check imbalance
studytime_counts = data["studytime"].value_counts().sort_index()
cell_counts = pd.crosstab(data["studytime"], data["school"])

imbalance_ratio = studytime_counts.max() / studytime_counts.min()
cell_imbalance_ratio = cell_counts.to_numpy().max() / cell_counts.to_numpy().min()

print("Studytime counts")
print(studytime_counts)
print("Cell counts")
print(cell_counts)
print("Group imbalance ratio:", round(imbalance_ratio, 2))
print("Cell imbalance ratio:", round(cell_imbalance_ratio, 2))

# Full factorial ANOVA model
model = ols("G3 ~ C(school) * C(studytime)", data=data).fit()

# Compare SS types
anova_type1 = anova_lm(model, typ=1)
anova_type2 = anova_lm(model, typ=2)
anova_type3 = anova_lm(model, typ=3)

print("Type I ANOVA")
print(anova_type1)

print("Type II ANOVA")
print(anova_type2)

print("Type III ANOVA")
print(anova_type3)

# Partial eta squared for Type III table
error_ss = anova_type3.loc["Residual", "sum_sq"]
anova_type3["partial_eta_sq"] = anova_type3["sum_sq"] / (
    anova_type3["sum_sq"] + error_ss
)

print(anova_type3)

# Group means
print(data.groupby("studytime")["G3"].agg(["count", "mean", "std"]))
print(data.groupby(["school", "studytime"])["G3"].agg(["count", "mean", "std"]))

# Residual diagnostics
data["fitted"] = model.fittedvalues
data["residual"] = model.resid
print(data[["G3", "school", "studytime", "fitted", "residual"]].head())
R Code for Unbalanced ANOVA
# Unbalanced ANOVA in R

library(tidyverse)
library(car)

df <- read.csv("dataset.csv")

df$G3 <- as.numeric(df$G3)
df$school <- as.factor(df$school)
df$studytime <- as.factor(df$studytime)

data <- df %>%
  select(G3, school, studytime) %>%
  drop_na()

# Check imbalance
table(data$studytime)
table(data$studytime, data$school)

study_counts <- table(data$studytime)
imbalance_ratio <- max(study_counts) / min(study_counts)
imbalance_ratio

# Use sum contrasts for Type III interpretation
options(contrasts = c("contr.sum", "contr.poly"))

# Full factorial model
model_unbalanced <- lm(G3 ~ school * studytime, data = data)

# Compare SS types
anova(model_unbalanced)             # Type I sequential SS
Anova(model_unbalanced, type = 2)   # Type II SS
Anova(model_unbalanced, type = 3)   # Type III SS

# Cell means
data %>%
  group_by(school, studytime) %>%
  summarise(
    n = n(),
    mean_G3 = mean(G3),
    sd_G3 = sd(G3),
    .groups = "drop"
  )

# Diagnostics
par(mfrow = c(1, 2))
plot(fitted(model_unbalanced), residuals(model_unbalanced),
     xlab = "Fitted values", ylab = "Residuals",
     main = "Residuals vs Fitted")
abline(h = 0, lty = 2)
qqnorm(residuals(model_unbalanced))
qqline(residuals(model_unbalanced))
Excel Notes for Unbalanced ANOVA
Excel support workflow:

1. Arrange the data:
   G3 | school | studytime

2. Create PivotTable counts:
   Rows = studytime
   Columns = school
   Values = count of G3

3. Calculate imbalance ratio:
   =MAX(cell_count_range)/MIN(cell_count_range)

4. Create PivotTable means:
   Rows = studytime
   Columns = school
   Values = average of G3

5. Create charts:
   - group-size bar chart
   - mean G3 by studytime chart
   - cell-size heatmap with conditional formatting

6. Formal unbalanced ANOVA:
   Use SPSS, R or Python for Type I, Type II or Type III
   sums of squares, p-values and partial eta squared.
APA Reporting Wording
When reporting Unbalanced ANOVA, mention that the design had unequal group sizes. Report the group-size imbalance, the SS type, the main effects, the interaction, effect sizes and assumption context.
APA-style report: An unbalanced two-factor ANOVA was conducted to examine G3 final grade by school and studytime. The design was unbalanced, with studytime group sizes of 212, 305, 97 and 35, and school × studytime cell sizes ranging from 8 to 206. Using the full factorial model, the corrected model was significant, F(7, 641) = 14.017, p < .001, R² = .133. Studytime was significant, F = 12.43, p < .001, partial η² = .055, and school was significant, F = 46.2, p < .001, partial η² = .067. The studytime × school interaction was not significant, F(3, 641) = .364, p = .779, partial η² = .002. Levene’s test was significant, so the homogeneity of variance assumption should be interpreted cautiously.
Short reporting version: The ANOVA design was unbalanced, with unequal studytime and school × studytime cell sizes. Studytime and school were significant predictors of G3, but the studytime × school interaction was not significant.
Common Mistakes
| Mistake | Why It Is Wrong | Correct Practice |
|---|---|---|
| Ignoring unequal group sizes | Unbalanced cells can affect sums of squares and interpretation. | Report group counts and cell counts. |
| Using Type I SS without explaining order | Type I SS is order-dependent. | Use Type I only when the order is planned and reported. |
| Mixing Type II and Type III conclusions | They answer different questions. | State exactly which SS type is used for the final report. |
| Claiming a significant interaction from a profile plot | The interaction p-value is .779. | Use the formal interaction p-value before making interaction claims. |
| Ignoring Levene’s test | Unequal variances are more concerning when group sizes are unequal. | Report assumption caution and compare robust methods if needed. |
| Using Excel as the only formal tool | Excel is not ideal for unbalanced factorial ANOVA with SS type selection. | Use SPSS, R or Python for final statistical output. |
When to Use Unbalanced ANOVA
Use Unbalanced ANOVA when your dependent variable is numeric, your predictors are categorical factors, and the group sizes are not equal. This situation is common in student data, survey research, business experiments, observational datasets and real-world factorial designs.
| Situation | Use Unbalanced ANOVA? | Reporting Note |
|---|---|---|
| Unequal one-way group sizes | Yes | Check variance assumptions and group sizes. |
| Unequal factorial cells | Yes | Report cell counts and SS type. |
| Planned balanced experiment | No, if all cells are equal | Use balanced ANOVA interpretation. |
| Severe variance differences | Use caution | Compare robust ANOVA methods. |
| Missing cells | High caution | Some interactions may not be estimable. |
Compare this guide with Balanced ANOVA, Factorial ANOVA, Two Way ANOVA, One Way ANOVA, Fixed Effects ANOVA, Brown Forsythe ANOVA, ANOVA Effect Size, ANOVA in SPSS, ANOVA in R and ANOVA in Python.
Downloads and Resources for Unbalanced ANOVA
Use these resources to reproduce the Unbalanced ANOVA workflow. The Python report, R report and SPSS output PDF are included as verification files. Script and workbook placeholders can be replaced after the final downloadable files are uploaded to the WordPress Media Library.
Download Dataset
Practice dataset with G3, school and studytime variables.
Download Unbalanced ANOVA Python Report PDF
Python report PDF for group sizes, cell heatmap, SS comparison and summary table.
Download Unbalanced ANOVA R Report PDF
R validation PDF for unequal group-size interpretation.
Download Unbalanced ANOVA SPSS Output PDF
SPSS output PDF using Type III sums of squares for the unbalanced factorial model.
Download Python Script
Python code for unbalanced ANOVA tables, effect sizes, cell counts and charts.
Download R Script and Excel Workbook
R workflow and Excel support workbook for unbalanced ANOVA interpretation.
FAQs About Unbalanced ANOVA
What is Unbalanced ANOVA?
Unbalanced ANOVA is ANOVA where groups or factor cells have unequal sample sizes.
What made this example unbalanced?
The studytime groups had unequal sizes of 212, 305, 97 and 35, and school × studytime cells ranged from 8 to 206 cases.
Was studytime significant?
Yes. Studytime was statistically significant in the final unbalanced ANOVA summary.
Was school significant?
Yes. School was statistically significant in the final unbalanced ANOVA summary.
Was the studytime by school interaction significant?
No. The interaction was not significant, with p = 0.7793.
Why do Type I, Type II and Type III sums of squares matter in unbalanced ANOVA?
They matter because unequal group sizes can cause sums of squares to be allocated differently across effects depending on the SS type.
Which SS type is common in SPSS for unbalanced factorial ANOVA?
SPSS GLM commonly uses Type III sums of squares for factorial models, especially when the design is unbalanced.
Can Unbalanced ANOVA be done in Excel?
Excel can summarize counts, means and charts, but SPSS, R or Python is better for formal unbalanced ANOVA with Type I, Type II or Type III sums of squares.
Is unbalanced ANOVA always bad?
No. Unequal group sizes are common in real data. The result can still be useful, but the analyst must check assumptions and report the SS type clearly.
How do I report this Unbalanced ANOVA result?
A concise report is: The design was unbalanced, with unequal studytime and school × studytime cell sizes. Studytime and school were significant predictors of G3, while the studytime × school interaction was not significant.

