
Nonparametric Tests in Python: 12 Essential Methods, Code and Interpretation
Nonparametric tests in Python provide practical inference when the research question concerns ranks, medians, ordered outcomes, distributional differences, monotonic association, exact probabilities or resampling rather than a narrowly defined normal-theory mean model. This complete Python-only guide shows how to select the correct method, clean data, run SciPy procedures, calculate effect sizes, validate p-values and report a reproducible school-absence example.
The correct Python test depends on the design and the exact null hypothesis.
Nonparametric tests in Python are not one interchangeable family of “tests for non-normal data.” Mann–Whitney U compares two independent distributions; Wilcoxon signed-rank analyzes paired differences under a symmetry condition; Kruskal–Wallis handles several independent groups; Friedman handles repeated conditions; Spearman and Kendall address monotonic association; exact and permutation procedures let the statistic define the question directly.
In the verified Python example, school absences were compared between Gabriel Pereira (GP, n = 423) and Mousinho da Silveira (MS, n = 226) with a two-sided independent-label permutation test of the median difference. Both medians were 2 absences, so the observed MS-minus-GP median difference was 0. All 3,000 resampled statistics were at least as extreme as zero, producing p = 1.000. The analysis therefore found no evidence of a difference in population medians.
What are nonparametric tests in Python?
Methods whose inferential target is expressed through ranks, signs, order, exact counts or resampled statistics rather than a single normal-theory template.
Nonparametric tests in Python are best understood by the information they use and the hypothesis they test. Some replace raw measurements with ranks, some count positive and negative differences, some compare empirical distribution functions, and some repeatedly reassign labels to construct a null distribution for a custom statistic.
What “nonparametric” does mean
A nonparametric procedure usually avoids specifying a complete finite-dimensional probability model such as “both populations are normal with unknown means and a common variance.” It may still assume independence, exchangeability, symmetry, continuity, comparable shape, random sampling or a particular ordering structure. The method is therefore less restrictive in one dimension, not assumption-free.
Nonparametric tests in Python often remain useful for ordinal responses, severe skew, heavy tails, outliers, ceiling effects, zero inflation and small samples. Their strength is alignment with an estimand: stochastic ordering, median difference, monotonic association, equality of distribution, equal scale or a user-defined resampling statistic.
What “nonparametric” does not mean
It does not mean every rank test tests medians. The Mann–Whitney U null is naturally expressed through distributions and pairwise ordering; the Wilcoxon signed-rank procedure concerns the distribution of paired differences and relies on symmetry for a location interpretation; the Kolmogorov–Smirnov statistic measures the largest gap between empirical cumulative distributions.
It also does not mean nonparametric methods are automatically more robust, more powerful or more honest. A poorly matched rank test can be less informative than a well-specified model. Selection must begin with design, dependence, outcome scale and the scientific question.
For foundational context, review parametric vs nonparametric tests, null and alternative hypotheses and p-value interpretation.
How to choose nonparametric tests in Python
A design-first decision table prevents the common error of treating all rank procedures as substitutes.
Choosing nonparametric tests in Python begins with four questions: Are observations independent or paired? How many groups or conditions are present? Is the target location, distribution, scale, association or trend? Does the outcome support ordering?
| Research design and target | Primary Python method | SciPy function | What the result addresses | Critical caution |
|---|---|---|---|---|
| Two independent groups; ordering/distribution | Mann–Whitney U | stats.mannwhitneyu | Whether one distribution tends to produce larger observations than the other. | A median-shift interpretation needs comparable shapes. |
| Two paired measurements | Wilcoxon signed-rank | stats.wilcoxon | Whether paired differences are centered symmetrically around zero. | Zeros, ties and asymmetry affect the null distribution. |
| Two paired measurements; signs only | Sign/binomial test | stats.binomtest | Whether positive and negative nonzero changes are equally likely. | Uses less magnitude information than signed ranks. |
| Three or more independent groups | Kruskal–Wallis | stats.kruskal | Whether pooled rank distributions differ across groups. | A significant omnibus test does not identify the groups that differ. |
| Three or more related conditions | Friedman | stats.friedmanchisquare | Whether repeated-condition ranks differ. | Rows must represent matched blocks or participants. |
| Ordered repeated alternatives | Page trend test | stats.page_trend_test | Whether responses follow a prespecified ordered trend. | The order must be specified before inspecting outcomes. |
| Two independent continuous distributions | Two-sample KS | stats.ks_2samp | The largest empirical-CDF difference. | Classical interpretation assumes continuous distributions. |
| Independent group scale/dispersion | Fligner–Killeen | stats.fligner | Whether group dispersions differ robustly. | Not a location test. |
| Monotonic association | Spearman / Kendall | stats.spearmanr, stats.kendalltau | Strength and direction of monotonic ordering. | Nonlinearity is allowed, but the relation should be monotonic. |
| Custom statistic under label exchangeability | Permutation test | stats.permutation_test | A null distribution for the exact statistic chosen. | The permutation scheme must match the design. |
Define the unit
Identify the participant, school, device, household or experimental unit that supplies independent information.
Map dependence
Decide whether rows are independent, paired, clustered or repeated. Dependence determines valid permutations and ranks.
Name the estimand
State whether the target is median, stochastic ordering, distribution, spread, correlation, trend or a custom contrast.
Inspect support
Check ties, zeros, discrete outcomes, missingness, sample sizes and whether exact inference is feasible.
Predefine inference
Choose one- or two-sided alternatives, alpha, resample count, random seed and multiplicity correction before results.
Assumptions for nonparametric tests in Python
Fewer distributional assumptions do not remove design, exchangeability and measurement requirements.
The assumptions of nonparametric tests in Python are method-specific. Independence is often the most important requirement, while ties, zeros, shape differences and the validity of a permutation scheme determine whether a familiar location interpretation is defensible.
Independent information
For an independent-samples procedure, one observation must not determine another. Repeated records from the same student, patient or machine cannot be treated as separate independent cases. Clustering by classroom, site or family also changes uncertainty.
Ordered measurement
Rank procedures need a meaningful order. Nominal categories without ordering require contingency-table or exact-count methods. Ordinal data can be ranked, but extensive ties reduce resolution and should be reported.
Exchangeability
A permutation test assumes the reassignment performed by the algorithm would be valid under the null. Independent-group labels may be permuted across pooled observations only when the units are exchangeable under that null.
Symmetry when needed
The Wilcoxon signed-rank test uses ranks of absolute paired differences. A clean median-shift interpretation requires a reasonably symmetric difference distribution. The sign test is safer when that assumption is doubtful.
Comparable shape
Mann–Whitney and Kruskal–Wallis can detect distributional differences caused by location, spread or shape. Calling them median tests requires additional shape assumptions. Always compare ECDFs, quantiles and group spreads.
Transparent ties and zeros
Discrete outcomes produce repeated values. Exact algorithms may be unavailable or may ignore tie adjustments. State the method selected by Python, and consider a permutation implementation when small samples contain ties.
Python setup, data cleaning and reproducibility
A reliable analysis records versions, validates variables and makes random procedures repeatable.
A production workflow for nonparametric tests in Python should fail loudly when data types, group labels or sample sizes are wrong. It should also store the random seed and software versions so that permutation and bootstrap results can be regenerated.
import numpy as np
import pandas as pd
import scipy
from scipy import statsSEED = 20_250_711
ALPHA = 0.05
print({
"numpy": np.__version__,
"pandas": pd.__version__,
"scipy": scipy.__version__,
"seed": SEED,
"alpha": ALPHA,
})
df = pd.read_csv("student-por.csv", sep=";")
required = {"school", "absences"}
missing = required.difference(df.columns)
if missing:
raise ValueError(f"Missing required columns: {sorted(missing)}")
analysis = df.loc[:, ["school", "absences"]].dropna().copy()
analysis["school"] = analysis["school"].astype("category")
analysis["absences"] = pd.to_numeric(analysis["absences"], errors="raise")
if set(analysis["school"].astype(str)) != {"GP", "MS"}:
raise ValueError("Expected exactly the school codes GP and MS.")
if len(analysis) != 649:
raise ValueError(f"Expected 649 complete records, found {len(analysis)}.")
Why explicit validation matters
Silent coercion is a common source of incorrect nonparametric tests in Python. A numeric column imported as text can sort lexicographically, a misspelled group can create a third level, and accidental duplicate rows can make a p-value look more precise than the design permits. Assertions convert those failures into visible errors.
Keep the analysis dataset narrow. Select only the outcome, grouping variables and identifiers required for the planned procedure. Record every exclusion rule. For paired data, verify identifiers before pivoting and confirm that each unit supplies one observation per condition.
Random number control
A seed makes a Monte Carlo approximation repeatable; it does not make the result exact. The worked analysis uses seed 20,250,711 and 3,000 independent-label permutations. A different seed can change the last digits when the p-value is estimated from a finite set of random partitions.
For borderline findings, increase the resample count and report Monte Carlo uncertainty. When all distinct rearrangements are computationally feasible, an exact permutation distribution removes simulation error.
Worked example: a Python permutation test of median school absences
The example deliberately targets the median difference rather than treating a rank test as a generic substitute.
The worked nonparametric tests in Python example compares the median number of absences at two Portuguese secondary schools. The statistic is defined before resampling as median(MS) minus median(GP).
Research question and hypotheses
Question: Is the population median number of absences different between MS and GP students?
The statistic is directional by definition. A negative value would mean the MS sample median is lower; a positive value would mean it is higher.
The test uses a two-sided independent-label permutation distribution under exchangeability.
Variables and coding
| Role | Variable | Definition |
|---|---|---|
| Outcome | absences | Number of school absences; integer count from 0 to 32 in the analyzed records. |
| Group | school | GP = Gabriel Pereira; MS = Mousinho da Silveira. |
| Statistic | Median difference | Median(MS) − Median(GP). |
| Permutation unit | Student record | School labels are reassigned across independent records while group sizes remain 226 and 423. |
gp = analysis.loc[analysis["school"].eq("GP"), "absences"].to_numpy()
ms = analysis.loc[analysis["school"].eq("MS"), "absences"].to_numpy()def summarize(x):
q1, q3 = np.quantile(x, [0.25, 0.75])
return {
"n": x.size,
"mean": float(np.mean(x)),
"sd": float(np.std(x, ddof=1)),
"median": float(np.median(x)),
"q1": float(q1),
"q3": float(q3),
"iqr": float(q3 - q1),
"minimum": float(np.min(x)),
"maximum": float(np.max(x)),
}
summary = {"GP": summarize(gp), "MS": summarize(ms)}
observed = float(np.median(ms) - np.median(gp))
print(summary)
print("observed MS - GP median difference:", observed)
| School | n | Mean | SD | Median | Q1 | Q3 | IQR | Range |
|---|---|---|---|---|---|---|---|---|
| GP | 423 | 4.2151 | 5.1919 | 2 | 0 | 6 | 6 | 0–32 |
| MS | 226 | 2.6195 | 3.1307 | 2 | 0 | 4 | 4 | 0–12 |
Permutation formula, exact algorithm and verified result
Each shuffled partition keeps the observed sample sizes and recomputes the same median contrast.
Permutation-based nonparametric tests in Python are transparent when the statistic and the exchangeability operation are written explicitly. The p-value counts shuffled statistics at least as extreme as the observed statistic.
The plus-one correction prevents a Monte Carlo p-value of zero and treats the observed arrangement consistently with the random rearrangements. Here B = 3,000 and Tobs = 0.
def median_difference(ms_values, gp_values):
return float(np.median(ms_values) - np.median(gp_values))B = 3_000
rng = np.random.default_rng(SEED)
pooled = np.concatenate([gp, ms])
n_gp = gp.size
null = np.empty(B, dtype=float)
for b in range(B):
shuffled = rng.permutation(pooled)
gp_b = shuffled[:n_gp]
ms_b = shuffled[n_gp:]
null[b] = median_difference(ms_b, gp_b)
extreme = int(np.count_nonzero(np.abs(null) >= abs(observed)))
p_value = (extreme + 1) / (B + 1)
print("observed:", observed)
print("extreme draws:", extreme)
print("two-sided p:", p_value)
print("unique null values:", dict(zip(*np.unique(null, return_counts=True))))
Primary inference
Fail to reject H0
The observed median difference is exactly zero. Every resampled absolute difference is at least zero, so all 3,000 draws meet the two-sided extremeness rule.
Null-distribution audit
A supplementary result that answers a different question
Using the same observations, Python’s asymptotic Mann–Whitney U test for MS versus GP gives U = 40,535 and p = 0.000983. The corresponding probability-of-superiority quantity is approximately 0.4240, or rank-biserial correlation −0.1520 with MS coded first. This is not a contradiction: the permutation analysis asks whether medians differ, whereas Mann–Whitney is sensitive to broader ordering differences caused here by the upper tail and spread.
This contrast is one of the most important lessons in nonparametric tests in Python: select a statistic because it represents the research question, not because two methods share the label “nonparametric.”
Python charts for the verified permutation workflow
The first chart spans the full width; the remaining four charts are presented as two balanced pairs.
Charts for nonparametric tests in Python should explain the statistic, group structure, null distribution and tail rule. Decorative plots that omit the estimand or resampling logic do not make the analysis auditable.
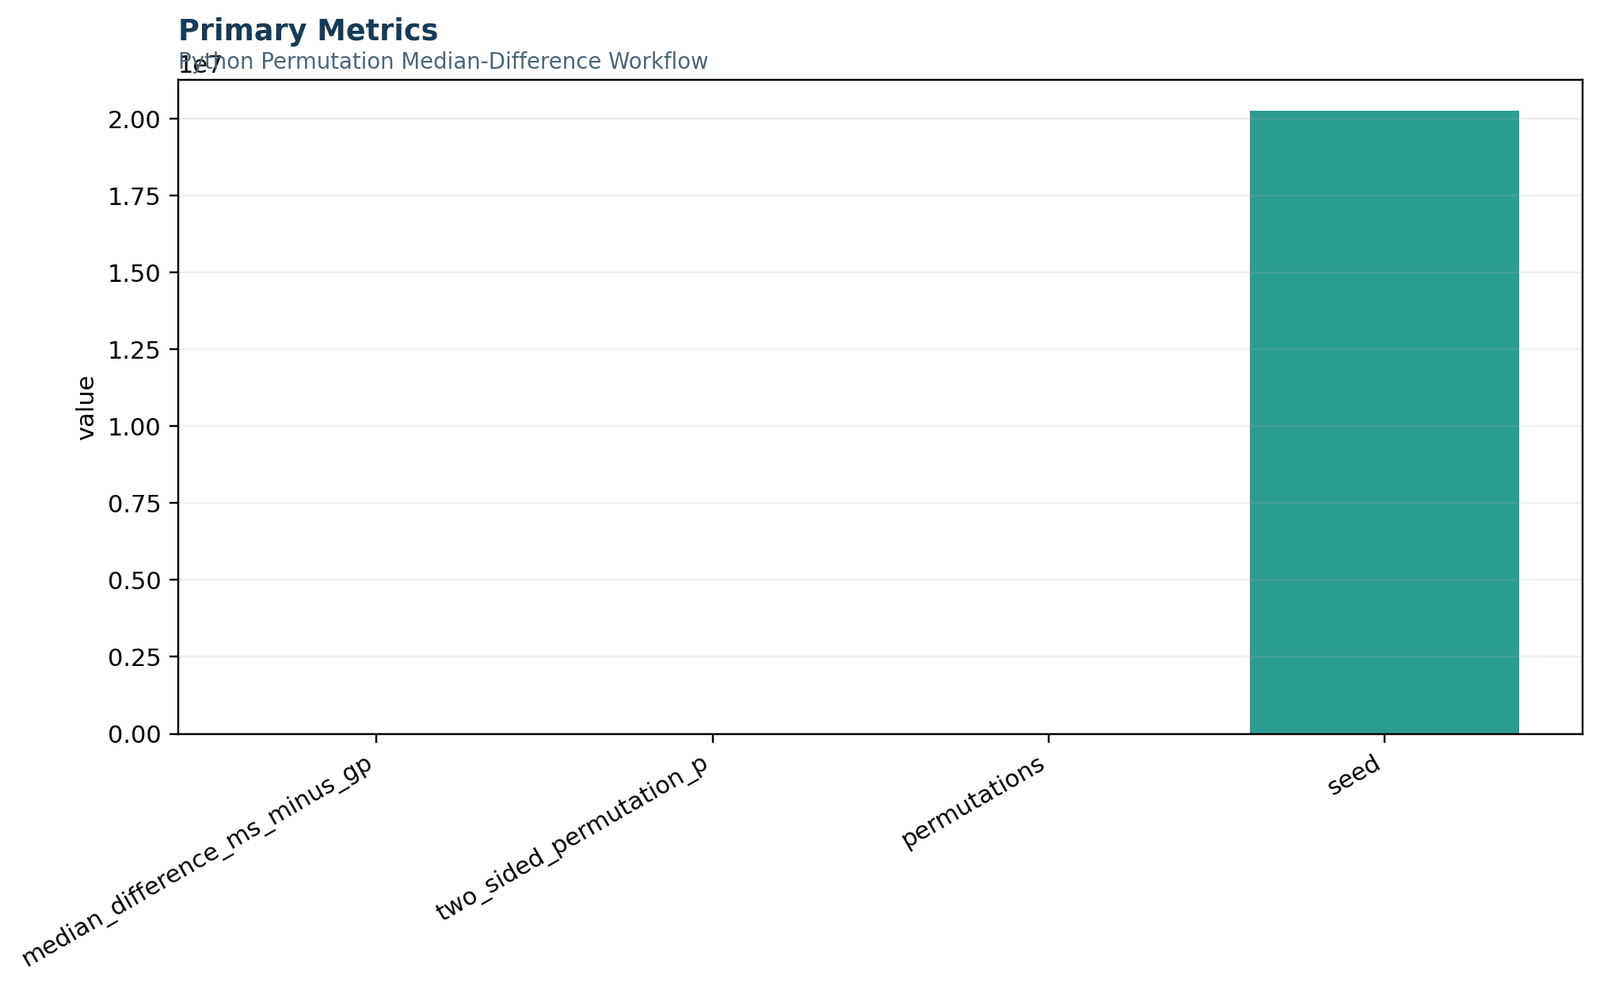
Python primary metrics
The chart stores the complete reproducibility record: observed MS-minus-GP median difference = 0, two-sided permutation p = 1.000, 3,000 random partitions and seed 20,250,711. The seed is numerically much larger than the statistical metrics, so the chart is best read as a verification panel rather than a magnitude comparison.
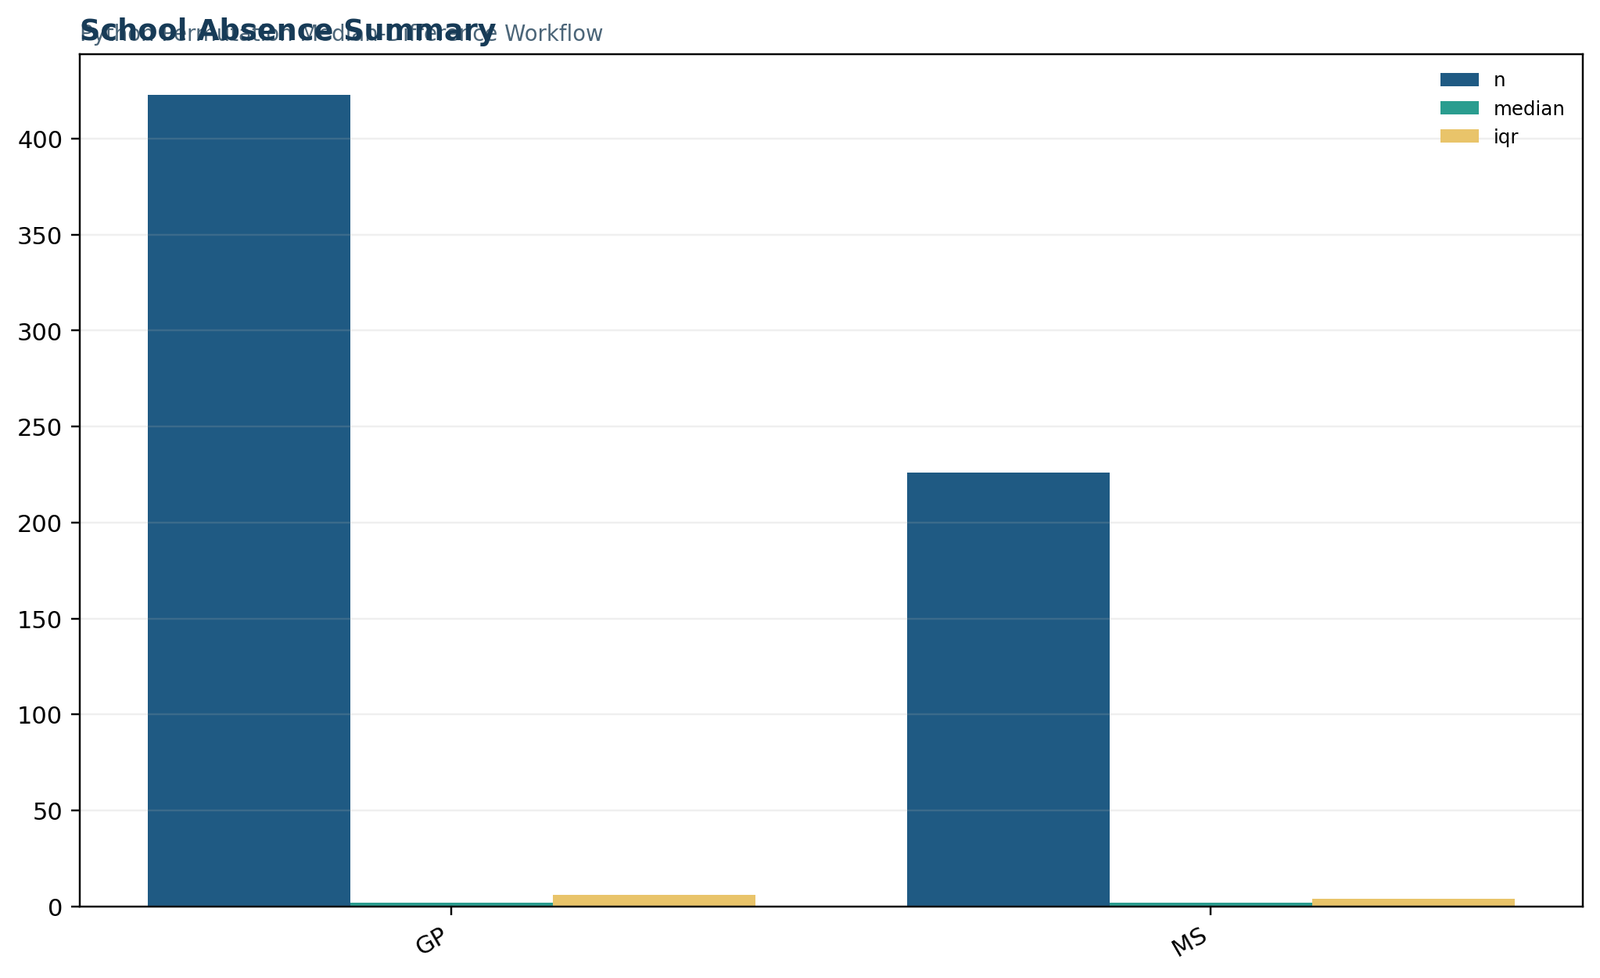
School absence summary
GP contributes 423 records and MS contributes 226. Both medians equal 2, while GP’s IQR is 6 compared with 4 for MS. The equal centers explain the observed median contrast; the unequal spreads warn against generalizing that result to complete distributional equality.
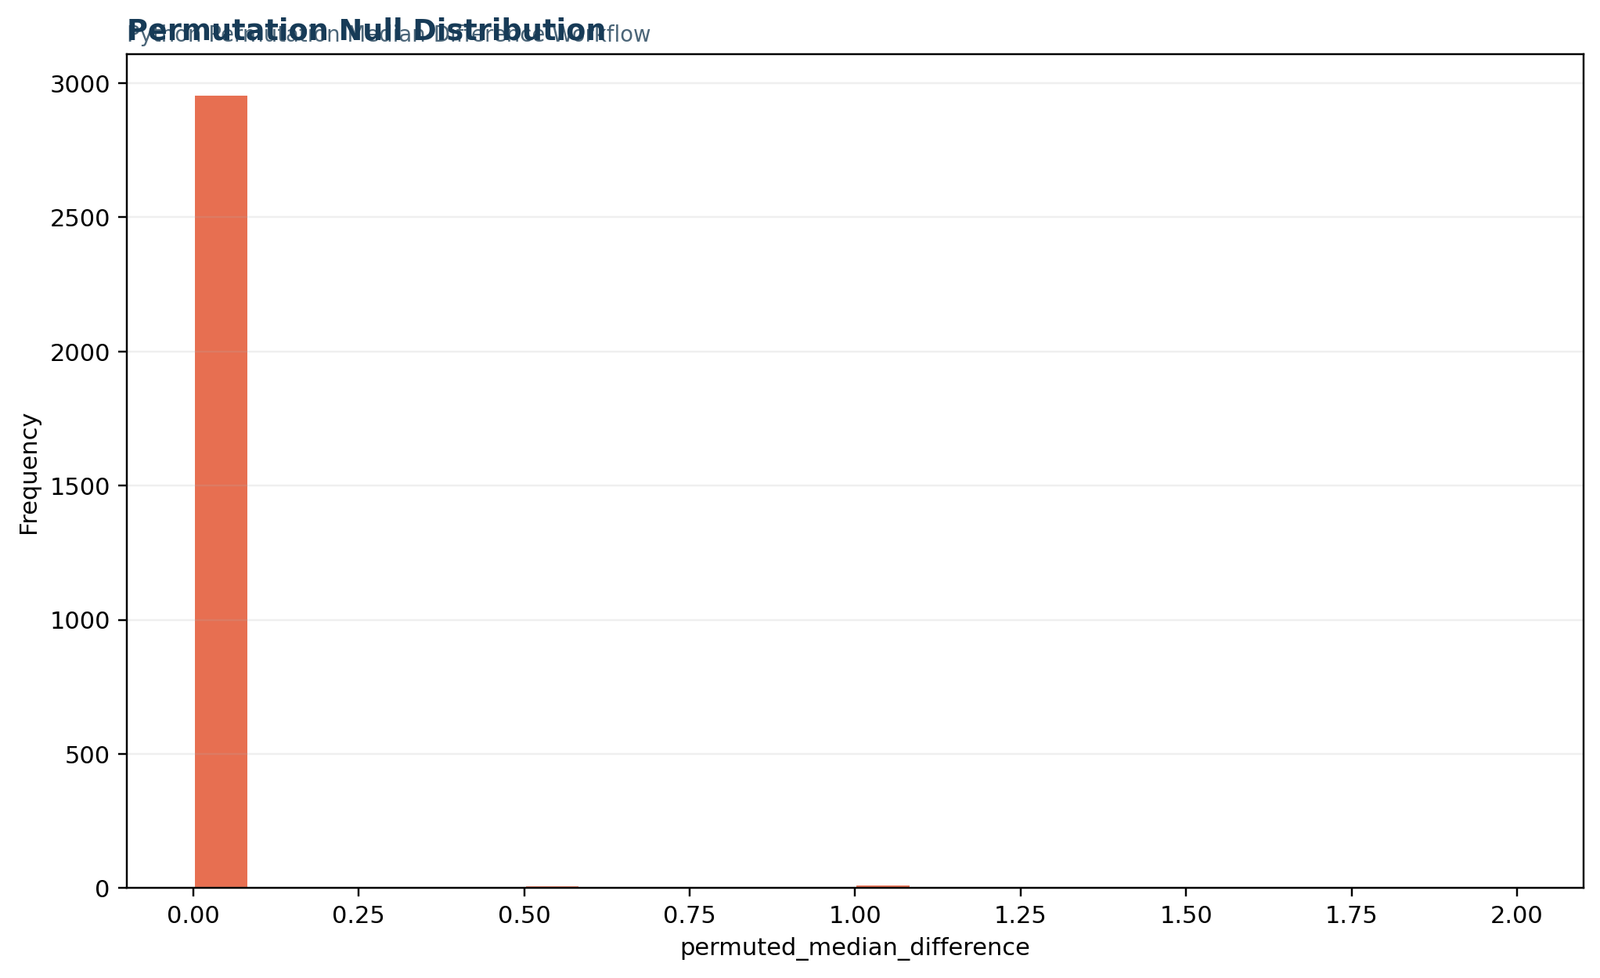
Permutation null distribution
Of the 3,000 shuffled partitions, 2,975 produce a median difference of zero. Only 25 partitions produce positive half-step or whole-step differences from 0.5 through 2.0. The discreteness reflects integer absences and repeated values, not a smooth normal reference curve.
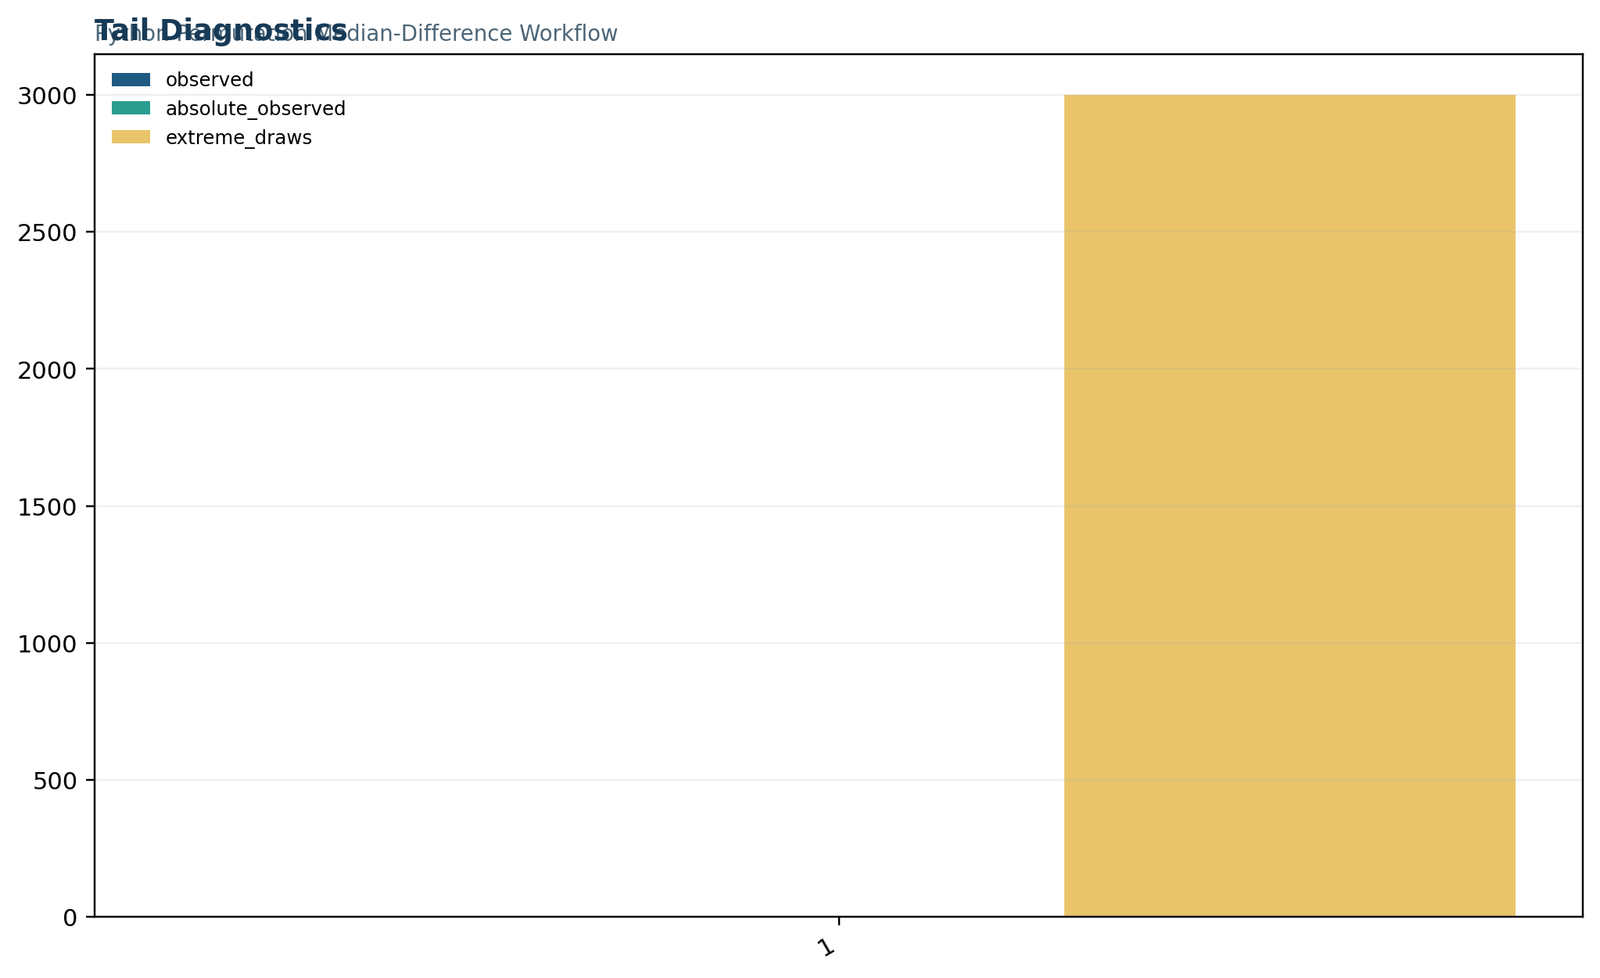
Two-sided tail diagnostics
The observed statistic and its absolute value are both zero. Because every absolute permuted statistic is greater than or equal to zero, the extreme-draw count is exactly 3,000. The plot connects the p-value to the programmed extremeness rule.
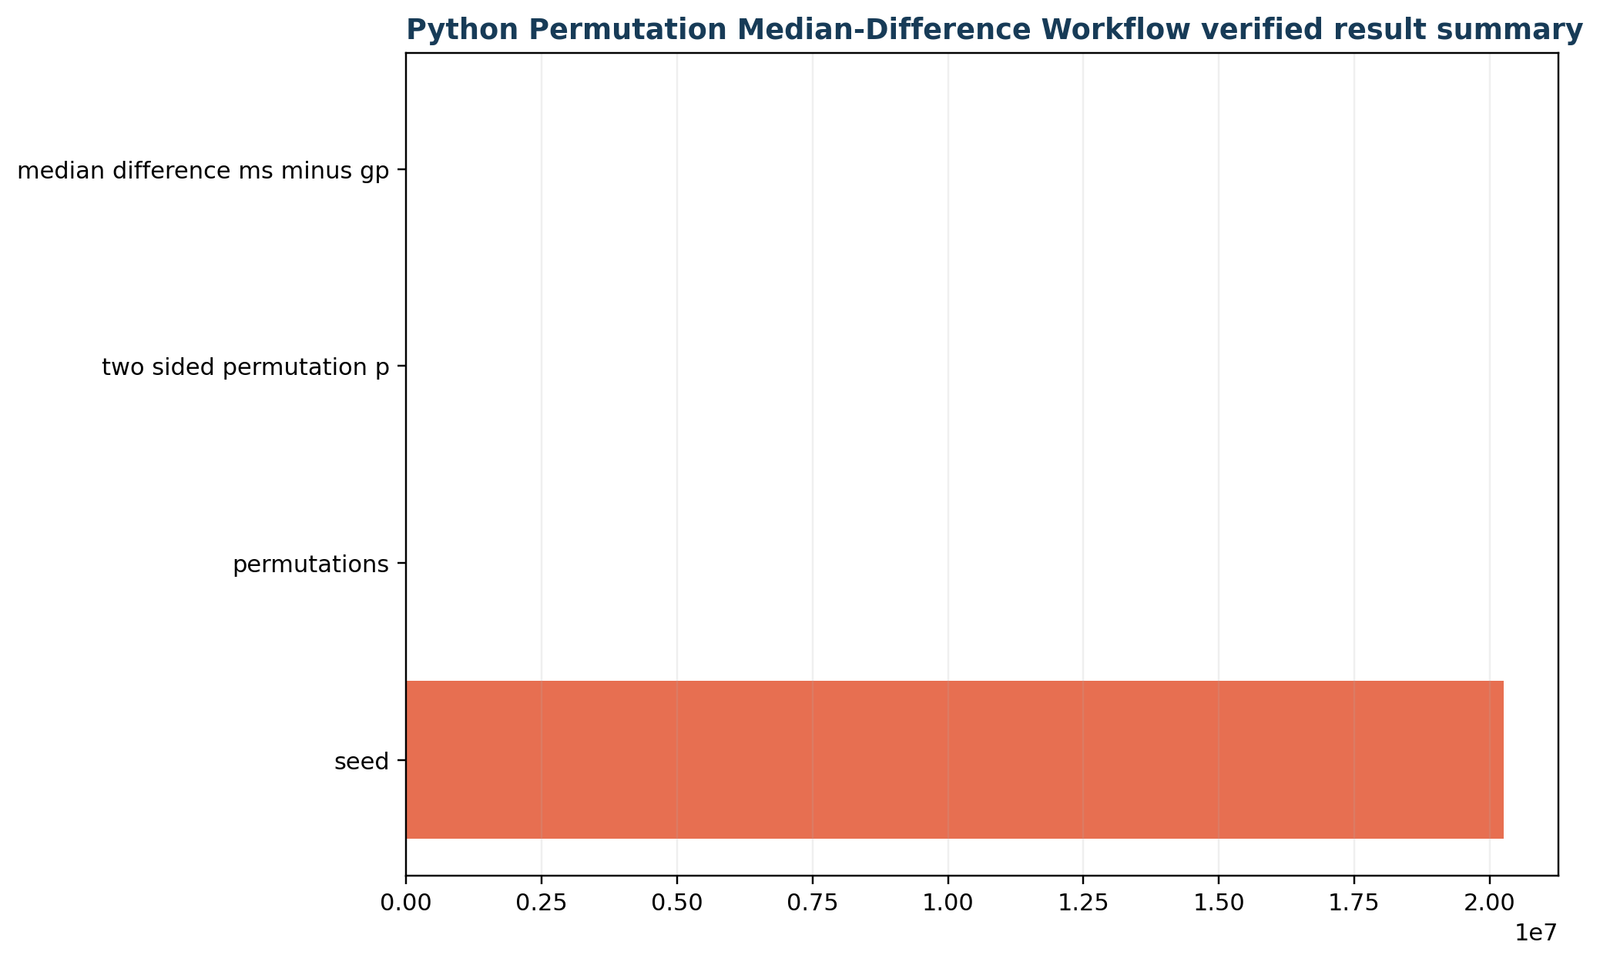
Verified Python result summary
The final audit panel repeats the median difference, p-value, resample count and seed. Agreement between the calculation table, saved report and chart confirms that the published result comes from one reproducible Python workflow.
Independent-sample nonparametric tests in Python
Mann–Whitney, Brunner–Munzel and custom permutation tests address related but nonidentical questions.
For two independent groups, nonparametric tests in Python should be selected according to whether the target is stochastic ordering, a probability-of-superiority effect, a median contrast or a broader distributional difference.
from scipy import statsresult = stats.mannwhitneyu(
ms,
gp,
alternative="two-sided",
method="asymptotic",
use_continuity=True,
)
u_ms = float(result.statistic)
u_gp = ms.size * gp.size - u_ms
probability_superiority = u_ms / (ms.size * gp.size)
rank_biserial = 2 * probability_superiority - 1
print({
"U_MS": u_ms,
"U_GP": u_gp,
"p": float(result.pvalue),
"P_MS_greater_plus_half_ties": probability_superiority,
"rank_biserial_MS_vs_GP": rank_biserial,
})
Mann–Whitney U
Use mannwhitneyu for two independent samples when the substantive question concerns their ordering or distributions. Python returns the U statistic associated with the first sample. Compute the complementary U to reconcile software conventions.
When distributions have similar shape, the result is often described as a location comparison. When shapes differ, interpretation should remain distributional. Ties favor the asymptotic or permutation method over an unadjusted exact calculation.
Brunner–Munzel
stats.brunnermunzel estimates whether a randomly selected observation from one population tends to be larger than one from the other without requiring equal distributional shapes. It is useful when heteroscedasticity makes a simple shift interpretation doubtful.
Report the statistic, degrees-of-freedom reference choice, p-value and a probability-based effect estimate. As with all nonparametric tests in Python, inspect small-sample behavior and ties.
Custom permutation contrast
Use stats.permutation_test when the scientific estimand is a trimmed mean, quantile difference, robust slope or another statistic not represented by a standard rank procedure. The validity comes from the permutation scheme and exchangeability, not from the function name.
Always make the statistic’s sign, alternative and grouping order explicit in the report.
See the full guides to the Mann–Whitney U test, Brunner–Munzel test and Wilcoxon rank-sum test.
Paired nonparametric tests in Python
Pairing must be represented in the data and preserved by the inference procedure.
Paired nonparametric tests in Python analyze within-unit changes. The correct input is a vector of aligned differences, not two unrelated columns that happen to have the same length.
# x and y must be aligned measurements from the same units.
d = np.round(x - y, decimals=10)wilcoxon_result = stats.wilcoxon(
d,
zero_method="wilcox",
correction=False,
alternative="two-sided",
method="auto",
)
nonzero = d[d != 0]
positive = int(np.count_nonzero(nonzero > 0))
sign_result = stats.binomtest(
positive,
n=nonzero.size,
p=0.5,
alternative="two-sided",
)
print(wilcoxon_result)
print(sign_result)
Wilcoxon signed-rank
The signed-rank procedure orders absolute nonzero differences and then restores signs. It uses both direction and magnitude ranks. The null is commonly described as symmetry of the paired-difference distribution around zero. A median interpretation is strongest when that distribution is reasonably symmetric.
Python offers three zero conventions: discard zero differences, include their ranks but remove their contribution, or split zero ranks between positive and negative sums. State the chosen convention. Compute and round differences before calling the function when floating-point subtraction would create false non-ties.
Sign test through binomial inference
The sign test ignores magnitudes and asks whether positive and negative nonzero differences are equally probable. It needs fewer shape assumptions than signed ranks but often has lower power. It is a good sensitivity analysis when difference symmetry is implausible.
Exclude exact zeros from the ordinary sign count unless a different convention was prespecified. Report positive, negative and zero counts so readers can understand how much information the test used.
Continue with the Wilcoxon signed-rank test and sign test guides.
Several independent groups: Kruskal–Wallis and follow-ups
An omnibus rank test must be followed by multiplicity-controlled comparisons when the global null is rejected.
For three or more independent groups, nonparametric tests in Python often begin with Kruskal–Wallis. It pools observations, assigns average ranks to ties and compares group rank sums.
groups = {
name: values.dropna().to_numpy()
for name, values in df.groupby("Mjob", observed=True)["absences"]
}kw = stats.kruskal(*groups.values(), nan_policy="omit")
print("Kruskal-Wallis:", kw)
from itertools import combinations
raw = []
for a, b in combinations(groups, 2):
res = stats.mannwhitneyu(
groups[a], groups[b],
alternative="two-sided",
method="asymptotic",
)
raw.append({"comparison": f"{a} vs {b}", "p_raw": res.pvalue})
# Holm adjustment without another dependency.
order = np.argsort([row["p_raw"] for row in raw])
adjusted = np.empty(len(raw))
running = 0.0
for rank, idx in enumerate(order):
candidate = (len(raw) - rank) * raw[idx]["p_raw"]
running = max(running, candidate)
adjusted[idx] = min(running, 1.0)
for row, p_adj in zip(raw, adjusted):
row["p_holm"] = float(p_adj)
print(raw)
Interpreting the omnibus test
A significant H statistic indicates that at least one group’s rank distribution differs. It does not prove that every pair differs, and it does not identify which group is responsible. Report group sample sizes, medians, IQRs and mean ranks alongside H, degrees of freedom and p.
If group shapes are comparable, a location interpretation may be reasonable. If spreads or shapes differ, use the broader language of rank-distribution differences.
Post-hoc control
Pairwise tests inflate the chance of at least one false positive. Holm adjustment is a strong default because it controls familywise error and is uniformly no worse than the simple Bonferroni rule. Benjamini–Hochberg controls the false discovery rate and may be suitable for exploratory families.
Define the comparison family before looking at results. Report raw and adjusted p-values rather than hiding the correction.
See Kruskal–Wallis, Dunn’s test, Conover test and the Holm–Bonferroni method.
Repeated-condition nonparametric tests in Python
Friedman tests unordered condition differences; Page’s test uses a prespecified directional order.
Repeated-measures nonparametric tests in Python rank conditions within each participant or block, thereby preserving the dependence that independent-group methods would ignore.
# Each array contains the same participants in the same order.

friedman = stats.friedmanchisquare(condition_1, condition_2, condition_3)

print(friedman)# Rows are blocks/participants; columns are ordered treatments.

matrix = np.column_stack([condition_1, condition_2, condition_3])

page = stats.page_trend_test(

matrix,

ranked=False,

predicted_ranks=[1, 2, 3],

method="auto",

)

print(page)
Friedman test
Use Friedman when every block is observed under three or more conditions and the alternative is any systematic condition difference. The test ranks conditions within blocks, so between-person level differences do not dominate the statistic.
Page trend test
Use Page’s L when the alternative specifies an ordered trend, such as dose 1 ≤ dose 2 ≤ dose 3. It can be more focused than Friedman when the order is scientifically justified before analysis.
Post-hoc paired tests
After a significant omnibus result, use prespecified paired contrasts with Wilcoxon or sign tests and adjust the resulting p-values. Preserve row alignment and report missing-block rules.
Read the Friedman test and Page’s trend test guides.
Rank correlation and monotonic association in Python
Spearman and Kendall quantify ordering, not arbitrary nonlinear dependence.
Correlation-focused nonparametric tests in Python are appropriate when the research question concerns monotonic association between ordered variables. They do not require a straight-line relationship, but a strongly curved nonmonotonic pattern can yield a small coefficient despite clear dependence.
spearman = stats.spearmanr(
df["studytime"],
df["G3"],
alternative="two-sided",
nan_policy="omit",
)kendall = stats.kendalltau(
df["studytime"],
df["G3"],
alternative="two-sided",
method="auto",
variant="b",
nan_policy="omit",
)
print("Spearman:", spearman)
print("Kendall tau-b:", kendall)
Spearman rank correlation
Spearman’s rho is Pearson correlation applied to ranks. It measures the strength and direction of a monotonic relation and is sensitive to how consistently higher values of one variable accompany higher values of the other. Ties receive average ranks.
Report rho, sample size, p-value and a scatterplot or jittered ordinal plot. A small p-value does not make a weak association practically important.
Kendall tau-b
Kendall’s tau compares concordant and discordant pairs. Tau-b adjusts for ties and has a direct pair-order interpretation. It can be preferable for small samples, ordinal scales and heavy ties.
Exact inference may be available without ties; asymptotic or permutation inference is needed when ties complicate the null distribution. State the method selected.
Continue with Spearman rank correlation, Kendall’s tau-b and correlation vs regression.
Distribution, median and scale tests in Python
Choose among KS, Mood’s median, Fligner–Killeen, Ansari–Bradley and Mood scale tests according to the target.
Distribution and scale nonparametric tests in Python are frequently confused. A complete-distribution test, a median test and a dispersion test do not share the same null hypothesis.
| Python procedure | Target | Useful when | Interpretation warning |
|---|---|---|---|
stats.ks_2samp | Difference between two continuous distributions | Location, spread or shape may differ | Discrete ties affect classical calibration and meaning. |
stats.median_test | Equality of group medians through a contingency table | A direct but coarse median-focused omnibus question | Handling observations equal to the grand median matters. |
stats.fligner | Equality of dispersion | Robust multi-group scale comparison | Does not test location. |
stats.ansari | Two-sample scale under common location | Symmetric center-outward rank scores | Location differences contaminate a pure scale interpretation. |
stats.mood | Two-sample scale difference | Independent samples and scale-focused inference | Not the same procedure as Mood’s median test. |
ks = stats.ks_2samp(x, y, alternative="two-sided", method="auto")

median = stats.median_test(x, y, ties="below", correction=True)

fligner = stats.fligner(x, y, center="median")

ansari = stats.ansari(x, y, alternative="two-sided")

mood_scale = stats.mood(x, y, axis=None)print(ks)

print(median)

print(fligner)

print(ansari)

print(mood_scale)
Related guides include the two-sample Kolmogorov–Smirnov test, median test, Fligner–Killeen test and Ansari–Bradley test.
Exact and categorical nonparametric tests in Python
Counts and binary outcomes require probability models for frequencies, not rank ordering of category labels.
Categorical nonparametric tests in Python include exact binomial inference, Fisher’s exact test and contingency-table procedures. These methods should not be replaced with numeric ranks assigned to unordered categories.
# One binary proportion.
binomial = stats.binomtest(k=successes, n=trials, p=0.5, alternative="two-sided")
print(binomial.pvalue, binomial.proportion_ci(confidence_level=0.95))# A 2 x 2 table.
table_2x2 = np.array([[a, b], [c, d]])
fisher = stats.fisher_exact(table_2x2, alternative="two-sided")
print(fisher)
# A general contingency table.
observed = np.array([[12, 8, 5], [7, 14, 9]])
chi = stats.chi2_contingency(observed, correction=False)
print(chi.statistic, chi.pvalue, chi.dof, chi.expected_freq)
Exact binomial test
Use when each trial is success/failure and the null specifies a success probability. Report successes, trials, null probability, alternative, exact p-value and a confidence interval for the observed proportion.
Fisher exact test
Use a 2×2 table when expected counts are small or exact conditional inference is desired. Report the table, odds ratio convention, alternative and p-value. Direction depends on row and column ordering.
Chi-square contingency test
Use for larger tables when expected-frequency conditions are acceptable. Inspect expected counts and report an association effect such as Cramér’s V. Exact or resampling methods may be preferable for sparse tables.
See binomial test, Fisher’s exact test and chi-square test of independence.
Permutation tests, Monte Carlo error and bootstrap intervals
Resampling is a framework for matching inference to a statistic, not a license to shuffle data arbitrarily.
Resampling-based nonparametric tests in Python can test medians, trimmed means, robust correlations and model diagnostics, but the resampling operation must reproduce the null hypothesis and dependence structure.
def statistic(x, y, axis=0):
return np.median(x, axis=axis) - np.median(y, axis=axis)perm = stats.permutation_test(
(ms, gp),
statistic,
permutation_type="independent",
vectorized=True,
n_resamples=3_000,
alternative="two-sided",
rng=np.random.default_rng(SEED),
)
boot = stats.bootstrap(
(ms, gp),
statistic,
paired=False,
vectorized=True,
n_resamples=20_000,
confidence_level=0.95,
method="BCa",
rng=np.random.default_rng(SEED),
)
print(perm.statistic, perm.pvalue)
print(boot.confidence_interval)
Three permutation structures
Independent labels: pool and repartition independent observations. Samples within pairs: swap condition labels while keeping pairs intact. Pairings: permute association pairings to test independence. Choosing the wrong structure breaks the null model.
With multiple groups, preserve every observed group size. With stratification or blocks, permute only within valid exchangeability sets.
Monte Carlo precision
A finite randomization sample estimates the tail probability. Near a decision threshold, rerun with many more resamples and report the resample count. The minimum attainable plus-one p-value is 1/(B+1); with B = 3,000 it is approximately 0.000333.
A bootstrap confidence interval describes sampling uncertainty for an effect estimate; it is not automatically equivalent to a permutation test of a sharp null.
Effect sizes, multiple testing and reporting nonparametric results
A p-value is incomplete without the estimand, direction, magnitude, uncertainty and method details.
Reporting nonparametric tests in Python requires more than copying a result object. Readers need the exact null hypothesis, group order, statistic convention, p-value method, ties, effect size and descriptive context.
| Method | Useful effect size | Interpretation | Report with |
|---|---|---|---|
| Mann–Whitney U | Probability superiority; rank-biserial correlation | Cross-sample ordering advantage | U for named first sample, complementary U, ties and method |
| Wilcoxon signed-rank | Matched-pairs rank-biserial; standardized z/√n | Direction and magnitude-rank imbalance | Positive, negative and zero differences; zero convention |
| Kruskal–Wallis | Epsilon-squared | Omnibus rank separation | Formula, H, df, p and adjusted follow-ups |
| Friedman | Kendall’s W | Agreement/separation of within-block ranks | Blocks, conditions, χ², df and post-hoc family |
| Spearman / Kendall | ρ or τ with confidence interval | Monotonic association strength | n, ties, alternative and visual pattern |
| Permutation contrast | Observed statistic in original units | Direct scientific magnitude | Permutation type, B, seed, tail rule and interval |
APA-style worked example
A two-sided independent-label permutation test with 3,000 resamples was used to compare the median number of absences between MS (n = 226, Mdn = 2, IQR = 4) and GP (n = 423, Mdn = 2, IQR = 6). The observed median difference, MS minus GP, was 0 days. Using seed 20,250,711 and the plus-one two-sided tail rule, all 3,000 resampled statistics were at least as extreme as the observed value, p = 1.000. The analysis did not detect a difference in population medians.
What not to write
Do not write “there is no difference between the schools.” The test addressed only the median contrast. Do not write “the null hypothesis is true.” Failure to reject is not proof. Do not label p = 1 as evidence of equivalence. Do not omit the fact that IQRs and upper tails differ.
For interpretation support, see effect size, interquartile range, box plot interpretation and multiple-comparison correction.
Python verification checklist before publishing a result
Nonparametric tests in Python should be treated as complete analytical workflows rather than isolated function calls. A polished report begins by confirming that the data structure matches the design and ends by reproducing every displayed number from saved code. The checks below prevent many of the errors that survive ordinary syntax testing.
1. Confirm the observational unit
Before running nonparametric tests in Python, identify the unit that contributes independent information. A dataset may contain several rows per student, patient, customer or machine. Treating repeated rows as independent increases the apparent sample size and produces standard errors and p-values that are too optimistic. When repeated observations are intentional, select a paired, blocked or clustered design rather than an independent-samples rank test.
2. Check group labels and order
The direction of many nonparametric tests in Python depends on which array is passed first. Mann–Whitney U, median differences, probability superiority and rank-biserial correlation all change interpretation when sample order changes. Print the group names, sample sizes and first few values immediately before the test. In a public report, name the first sample instead of writing only “U = 40,535.”
3. Separate estimand from procedure
Good nonparametric tests in Python start with the quantity of interest. “Difference in medians,” “probability that an MS observation exceeds a GP observation,” “largest ECDF gap” and “difference in dispersion” are different estimands. A function should be chosen after that statement is written. This order prevents a convenient function from silently redefining the research question.
4. Audit missing data
Missing values can change the sample and the population represented by nonparametric tests in Python. Record how many rows are excluded from each variable and group. For paired data, report complete pairs rather than separate nonmissing counts. If missingness depends on the outcome or condition, complete-case rank analysis may be biased even though the test itself is distribution-free under its stated null.
5. Count ties and zeros
Discrete outcomes often contain many repeated values. Tie frequency changes rank variance, exact-test availability and the resolution of nonparametric tests in Python. In paired analysis, zero differences can be discarded, ranked conservatively or split, depending on the selected convention. Report the convention and the number of observations affected instead of relying on an undocumented default.
6. Verify exact versus asymptotic inference
The word “exact” has a precise computational meaning in nonparametric tests in Python. An exact distribution may assume no ties, or it may condition on margins or enumerate distinct partitions. An asymptotic result uses a limiting reference distribution and may apply tie or continuity corrections. Read the returned method when available and state it in the final report.
7. Validate a permutation scheme
Permutation-based nonparametric tests in Python are valid only when the shuffle represents the null hypothesis. Independent observations can be repartitioned across groups; paired conditions can be swapped within pairs; association tests can permute pairings. Shuffling every cell independently destroys structure and generates an irrelevant null distribution. Describe the exact reassignment in plain language.
8. Inspect the null distribution
Saving the resampled statistics makes nonparametric tests in Python auditable. Plot the null distribution, mark the observed statistic and count extreme values directly. In the school example, the null is highly discrete: 2,975 of 3,000 draws equal zero. A smooth bell curve would hide that feature and could encourage unjustified precision.
9. Recalculate the tail count
For Monte Carlo nonparametric tests in Python, independently recompute the p-value from the saved null array. Confirm whether the rule uses greater-than, greater-than-or-equal, absolute values or a doubled one-sided tail. The choice matters when the null distribution is discrete and many statistics equal the observed value. State the plus-one correction when it is used.
10. Report original-unit effects
Readers understand nonparametric tests in Python better when the effect remains connected to the measurement scale. A median difference of zero days, a Hodges–Lehmann shift of two grade points or a probability superiority of 0.68 communicates more than a standardized z value alone. Pair effect estimates with confidence intervals or resampling intervals whenever the method supports them.
11. Control the comparison family
Running many nonparametric tests in Python without adjustment creates a high chance of at least one small p-value. Define which comparisons form one family, then apply Holm, Bonferroni or false-discovery-rate control according to the inferential goal. The omnibus p-value does not protect an unlimited collection of exploratory pairwise tests performed afterward.
12. Reproduce the published table
The final quality check for nonparametric tests in Python is a clean rerun from raw data to report. Delete temporary objects, restart the environment and execute the saved script. Compare sample sizes, statistics, p-values, effect sizes, chart labels and download content. A publication should not depend on values manually copied from an earlier exploratory session.
Python report download
Open the Python-only analysis report containing the verified statistics and five charts.
The downloadable report reproduces the worked nonparametric tests in Python workflow, including group summaries, permutation statistics, null-distribution counts, tail diagnostics, seed and final interpretation.
Nonparametric tests in Python FAQs
Answers to practical questions about SciPy methods, assumptions, p-values and interpretation.
These FAQs clarify the most frequent errors in nonparametric tests in Python, including “nonparametric t test” terminology, ties, exact methods, permutation counts, effect sizes and the meaning of a p-value equal to one.
What are nonparametric tests in Python?
Which Python library contains the main nonparametric tests?
scipy.stats module contains the principal hypothesis-test functions used in this guide. NumPy supports array operations, and pandas supports structured data preparation. Record package versions because function defaults and available methods can change.Is Mann–Whitney U the nonparametric independent t test?
What is the nonparametric paired t test in Python?
binomtest may be more defensible.How do I run a nonparametric permutation test in Python?
scipy.stats.permutation_test, choose the alternative and resample count, and supply a reproducible random generator. The exchangeability operation must match the sampling design.Why is the worked permutation p-value exactly 1?
Does p = 1 prove that the two school distributions are equal?
How many permutations should I use?
How should ties be handled in nonparametric tests in Python?
Should I perform a normality test before choosing a nonparametric method?
What effect size should accompany Mann–Whitney U?
What effect size should accompany Kruskal–Wallis?
Can nonparametric tests use ordinal data?
When should I use Spearman instead of Kendall?
How do I correct pairwise nonparametric p-values?
Can I use a bootstrap instead of a permutation test?
What should a reproducible Python report contain?
Are nonparametric tests always less powerful?
Related Python and nonparametric guides
Continue with test-specific formulas, assumptions and interpretation.