
.abx-article{–ink:#102238;–muted:#52657a;–line:#dce5ed;–paper:#fff;–soft:#f4f8fb;–navy:#092a45;–teal:#0d7774;–cyan:#dff7f6;–amber:#f4a340;–amber-soft:#fff4df;–red:#a83232;–red-soft:#fff0f0;–green:#176b47;–green-soft:#e9f8f0;–violet:#6654b8;–violet-soft:#f0edff;–shadow:0 16px 45px rgba(18,44,67,.10);font-family:Inter,ui-sans-serif,system-ui,-apple-system,BlinkMacSystemFont,”Segoe UI”,Arial,sans-serif;color:var(–ink);line-height:1.72;width:auto;max-width:none!important;margin-left:calc(50% – 50vw + 12px)!important;margin-right:calc(50% – 50vw + 12px)!important;margin-top:0!important;margin-bottom:0!important;background:var(–paper);font-size:17px;overflow-x:clip}.abx-article *{box-sizing:border-box}.abx-article a{color:#075f72;text-decoration-thickness:1px;text-underline-offset:3px}.abx-article a:hover{color:#043f4c}.abx-shell{width:100%;max-width:1480px;margin:0 auto;padding:clamp(18px,2.8vw,42px)}.abx-hero{position:relative;overflow:hidden;border-radius:28px;background:linear-gradient(132deg,#07263f 0%,#0b4b61 55%,#0a7770 100%);color:#fff;padding:clamp(28px,6vw,68px);box-shadow:var(–shadow)}.abx-hero:before{content:””;position:absolute;right:-90px;top:-120px;width:360px;height:360px;border-radius:50%;background:rgba(255,255,255,.07)}.abx-hero:after{content:””;position:absolute;left:-110px;bottom:-180px;width:390px;height:390px;border-radius:50%;background:rgba(244,163,64,.10)}.abx-hero>*{position:relative;z-index:1}.abx-kicker{display:inline-flex;align-items:center;gap:9px;padding:7px 12px;border:1px solid rgba(255,255,255,.25);border-radius:999px;background:rgba(255,255,255,.09);font-size:.78rem;font-weight:800;letter-spacing:.08em;text-transform:uppercase}.abx-kicker i{width:9px;height:9px;border-radius:50%;background:#ffbd62;box-shadow:0 0 0 5px rgba(255,189,98,.16)}.abx-hero h1{font-size:clamp(2.15rem,5.2vw,4.65rem);line-height:1.04;letter-spacing:-.045em;margin:22px 0 18px;max-width:1000px;color:#fff}.abx-hero .abx-lead{font-size:clamp(1.05rem,2vw,1.34rem);max-width:900px;color:#e9f7fb;margin:0}.abx-badges{display:flex;flex-wrap:wrap;gap:10px;margin-top:25px}.abx-badge{padding:8px 12px;border-radius:999px;background:rgba(255,255,255,.11);border:1px solid rgba(255,255,255,.19);font-size:.84rem;font-weight:750}.abx-hero-result{margin-top:28px;display:grid;grid-template-columns:repeat(4,minmax(0,1fr));gap:12px}.abx-hero-metric{background:rgba(255,255,255,.10);border:1px solid rgba(255,255,255,.16);border-radius:16px;padding:14px}.abx-hero-metric span{display:block;color:#cdeaf0;font-size:.78rem;text-transform:uppercase;letter-spacing:.05em;font-weight:800}.abx-hero-metric strong{display:block;margin-top:4px;font-size:1.28rem;color:#fff}.abx-ad{display:flex;align-items:center;justify-content:center;min-height:96px;margin:26px 0;border:1px dashed #b8c6d1;border-radius:18px;background:#f8fafc;color:#718096;font-size:.78rem;letter-spacing:.14em;text-transform:uppercase}.abx-quick{display:grid;grid-template-columns:1.35fr .65fr;gap:20px;margin:28px 0}.abx-card{min-width:0;max-width:100%;border:1px solid var(–line);border-radius:22px;background:#fff;box-shadow:0 10px 30px rgba(21,48,70,.06);padding:clamp(19px,3vw,30px)}.abx-card h2,.abx-card h3{margin-top:0}.abx-answer{background:linear-gradient(145deg,#f2fbfa,#fff);border-color:#bfe5e2}.abx-answer .abx-verdict{display:inline-flex;align-items:center;gap:9px;padding:8px 12px;border-radius:999px;background:var(–green-soft);color:var(–green);font-weight:850;font-size:.84rem}.abx-answer .abx-verdict:before{content:”✓”;display:grid;place-items:center;width:22px;height:22px;border-radius:50%;background:var(–green);color:#fff}.abx-answer h2{font-size:clamp(1.55rem,3vw,2.25rem);line-height:1.15;margin:15px 0 10px}.abx-mini-table{display:grid;gap:10px}.abx-mini-row{display:flex;justify-content:space-between;gap:20px;padding:11px 0;border-bottom:1px solid var(–line)}.abx-mini-row:last-child{border-bottom:0}.abx-mini-row span{color:var(–muted)}.abx-mini-row strong{text-align:right}.abx-toc{margin:26px 0;border-radius:22px;background:var(–navy);color:#fff;padding:24px}.abx-toc h2{color:#fff;margin:0 0 14px;font-size:1.2rem}.abx-toc-grid{display:grid;grid-template-columns:repeat(3,minmax(0,1fr));gap:8px 20px}.abx-toc a{color:#d9f6f5;text-decoration:none;padding:7px 0;display:block;border-bottom:1px solid rgba(255,255,255,.12)}.abx-toc a:hover{color:#fff}.abx-section{scroll-margin-top:24px;margin:54px 0}.abx-section-head{display:grid;grid-template-columns:auto 1fr;align-items:start;gap:14px;margin-bottom:20px}.abx-num{width:42px;height:42px;border-radius:13px;background:var(–navy);color:#fff;display:grid;place-items:center;font-weight:900}.abx-section-head h2{margin:0;font-size:clamp(1.65rem,3.4vw,2.65rem);line-height:1.15;letter-spacing:-.025em}.abx-section-head p{grid-column:2;margin:5px 0 0;color:var(–muted);max-width:920px}.abx-grid-2{display:grid;grid-template-columns:repeat(2,minmax(0,1fr));gap:20px}.abx-grid-2>*,.abx-grid-3>*,.abx-grid-4>*,.abx-chart-grid>*,.abx-downloads>*,.abx-related>*,.abx-quick>*{min-width:0}.abx-grid-3{display:grid;grid-template-columns:repeat(3,minmax(0,1fr));gap:18px}.abx-grid-4{display:grid;grid-template-columns:repeat(4,minmax(0,1fr));gap:14px}.abx-callout{border-radius:18px;padding:18px 20px;border-left:5px solid var(–teal);background:var(–cyan);margin:20px 0}.abx-callout strong{color:#084f4c}.abx-warning{border-left-color:var(–red);background:var(–red-soft)}.abx-warning strong{color:var(–red)}.abx-note{border-left-color:var(–amber);background:var(–amber-soft)}.abx-note strong{color:#875311}.abx-formula{border:1px solid #cbd8e3;background:linear-gradient(180deg,#fff,#f7fafc);border-radius:20px;padding:22px;margin:18px 0;text-align:center;overflow:visible}.abx-formula .eq{font-family:”Cambria Math”,”Times New Roman”,serif;font-size:clamp(1.08rem,2.2vw,1.5rem);white-space:normal;overflow-wrap:anywhere;word-break:normal;line-height:1.55}.abx-formula p{margin:8px auto 0;color:var(–muted);max-width:850px;text-align:left;font-size:.94rem}.abx-pill-list{display:flex;flex-wrap:wrap;gap:10px;margin:15px 0}.abx-pill{background:var(–soft);border:1px solid var(–line);border-radius:999px;padding:8px 12px;font-weight:750;font-size:.88rem}.abx-flow{display:grid;grid-template-columns:repeat(5,minmax(0,1fr));gap:10px;counter-reset:flow}.abx-step{position:relative;padding:18px 14px 16px;border:1px solid var(–line);border-radius:18px;background:#fff;min-height:148px}.abx-step:before{counter-increment:flow;content:counter(flow);display:grid;place-items:center;width:30px;height:30px;border-radius:10px;background:var(–teal);color:#fff;font-weight:900;margin-bottom:10px}.abx-step h3{font-size:1rem;margin:0 0 6px}.abx-step p{font-size:.9rem;color:var(–muted);margin:0}.abx-table-wrap{min-width:0;max-width:100%;overflow-x:auto;border:1px solid var(–line);border-radius:18px;background:#fff}.abx-table{width:100%;border-collapse:collapse;min-width:720px}.abx-table.abx-compact{min-width:0}.abx-table th{background:var(–navy);color:#fff;text-align:left;padding:13px 14px;font-size:.85rem;letter-spacing:.02em}.abx-table td{padding:13px 14px;border-bottom:1px solid var(–line);vertical-align:top}.abx-table tbody tr:nth-child(even){background:#f8fafc}.abx-table tbody tr:last-child td{border-bottom:0}.abx-stat-grid{display:grid;grid-template-columns:repeat(4,minmax(0,1fr));gap:12px;margin:16px 0}.abx-stat{border:1px solid var(–line);border-radius:16px;padding:16px;background:#fff}.abx-stat span{display:block;color:var(–muted);font-size:.78rem;font-weight:800;text-transform:uppercase;letter-spacing:.05em}.abx-stat strong{display:block;font-size:1.34rem;margin-top:4px}.abx-stat small{display:block;color:var(–muted);margin-top:4px}.abx-result-panel{border-radius:22px;background:linear-gradient(145deg,#082c47,#0b5966);color:#fff;padding:26px}.abx-result-panel h3{color:#fff;margin-top:0;font-size:1.45rem}.abx-result-panel p{color:#e5f6f7}.abx-result-panel .abx-result-big{font-size:clamp(2rem,5vw,3.7rem);line-height:1;font-weight:950;color:#fff;margin:10px 0}.abx-result-panel .abx-result-tag{display:inline-block;padding:8px 12px;border-radius:999px;background:rgba(255,255,255,.12);border:1px solid rgba(255,255,255,.18);font-weight:800}.abx-figure{min-width:0;max-width:100%;margin:0;border:1px solid var(–line);border-radius:22px;overflow:hidden;background:#fff;box-shadow:0 10px 30px rgba(21,48,70,.06)}.abx-figure img{display:block;width:100%;height:auto;background:#f3f6f8}.abx-figure figcaption{padding:18px 20px}.abx-figure h3{font-size:1.08rem;margin:0 0 6px}.abx-figure p{margin:0;color:var(–muted);font-size:.94rem}.abx-chart-grid{display:grid;grid-template-columns:repeat(2,minmax(0,1fr));gap:20px}.abx-chart-grid .abx-wide{grid-column:1/-1}.abx-code{min-width:0;max-width:100%;position:relative;background:#071d2d;color:#e6f2f7;border-radius:18px;overflow:auto;padding:20px;margin:16px 0;box-shadow:inset 0 0 0 1px rgba(255,255,255,.07)}.abx-code code{display:block;white-space:pre;min-width:max-content;font-family:”SFMono-Regular”,Consolas,”Liberation Mono”,monospace;font-size:.88rem;line-height:1.65}.abx-code-label{display:inline-block;margin-bottom:8px;color:#7ee7db;font-size:.76rem;font-weight:900;letter-spacing:.08em;text-transform:uppercase}.abx-downloads{display:grid;grid-template-columns:repeat(4,minmax(0,1fr));gap:14px}.abx-download{display:flex;flex-direction:column;min-height:190px;padding:20px;border-radius:20px;border:1px solid var(–line);background:#fff;text-decoration:none!important;color:var(–ink)!important;box-shadow:0 10px 30px rgba(21,48,70,.06);transition:.2s transform,.2s box-shadow}.abx-download:hover{transform:translateY(-3px);box-shadow:0 16px 38px rgba(21,48,70,.12)}.abx-file-icon{width:46px;height:46px;border-radius:14px;display:grid;place-items:center;background:var(–violet-soft);color:var(–violet);font-weight:950;margin-bottom:16px}.abx-download strong{font-size:1.05rem}.abx-download span{color:var(–muted);font-size:.88rem;margin-top:6px}.abx-download em{margin-top:auto;padding-top:16px;color:#075f72;font-style:normal;font-weight:850}.abx-checks{display:grid;gap:10px}.abx-check{position:relative;padding:13px 14px 13px 44px;border:1px solid var(–line);border-radius:15px;background:#fff}.abx-check:before{content:”✓”;position:absolute;left:14px;top:13px;width:22px;height:22px;border-radius:50%;display:grid;place-items:center;background:var(–green-soft);color:var(–green);font-weight:950}.abx-faq details{border:1px solid var(–line);border-radius:17px;background:#fff;margin:11px 0;overflow:hidden}.abx-faq summary{cursor:pointer;font-weight:850;padding:17px 20px;list-style:none}.abx-faq summary::-webkit-details-marker{display:none}.abx-faq summary:after{content:”+”;float:right;color:var(–teal);font-size:1.4rem;line-height:1}.abx-faq details[open] summary:after{content:”−”}.abx-faq .abx-faq-answer{padding:0 20px 18px;color:var(–muted)}.abx-related{display:grid;grid-template-columns:repeat(3,minmax(0,1fr));gap:12px}.abx-related a{display:block;border:1px solid var(–line);border-radius:15px;padding:14px 16px;background:#fff;text-decoration:none;font-weight:800}.abx-footer-note{border-radius:22px;background:var(–soft);border:1px solid var(–line);padding:22px;color:var(–muted)}.abx-back{display:inline-flex;align-items:center;gap:8px;border-radius:999px;background:var(–navy);color:#fff!important;text-decoration:none!important;padding:11px 16px;font-weight:850;margin-top:18px}.abx-sr{position:absolute!important;width:1px!important;height:1px!important;padding:0!important;margin:-1px!important;overflow:hidden!important;clip:rect(0,0,0,0)!important;white-space:nowrap!important;border:0!important}@media(max-width:960px){.abx-hero-result,.abx-grid-4,.abx-stat-grid,.abx-downloads{grid-template-columns:repeat(2,minmax(0,1fr))}.abx-toc-grid,.abx-grid-3,.abx-related{grid-template-columns:repeat(2,minmax(0,1fr))}.abx-flow{grid-template-columns:repeat(2,minmax(0,1fr))}.abx-flow .abx-step:last-child{grid-column:1/-1}.abx-quick{grid-template-columns:1fr}}@media(max-width:680px){.abx-article{font-size:16px;margin-left:calc(50% – 50vw + 6px)!important;margin-right:calc(50% – 50vw + 6px)!important}.abx-shell{padding:12px}.abx-hero{border-radius:20px;padding:26px 20px}.abx-hero h1{font-size:2.2rem}.abx-hero-result,.abx-grid-2,.abx-grid-3,.abx-grid-4,.abx-stat-grid,.abx-downloads,.abx-chart-grid,.abx-toc-grid,.abx-related,.abx-flow{grid-template-columns:1fr}.abx-chart-grid .abx-wide,.abx-flow .abx-step:last-child{grid-column:auto}.abx-card{border-radius:18px;padding:18px}.abx-section{margin:42px 0}.abx-section-head{grid-template-columns:36px 1fr;gap:11px}.abx-num{width:36px;height:36px}.abx-section-head p{grid-column:1/-1}.abx-table{min-width:650px}.abx-formula{padding:18px 12px;text-align:left}.abx-formula .eq{font-size:1.05rem}.abx-mini-row{align-items:flex-start;flex-direction:column;gap:2px}.abx-mini-row strong{text-align:left}}
.abx-seo-context{font-size:1.02rem;color:#31475d;margin:-5px 0 20px;max-width:1180px}.abx-model{display:grid;grid-template-columns:1.05fr .95fr;gap:20px;align-items:stretch}.abx-model .abx-card{height:100%}.abx-hypothesis{border:1px solid var(–line);border-radius:18px;padding:20px;background:#fff}.abx-hypothesis h3{margin:0 0 10px}.abx-direction{display:grid;grid-template-columns:repeat(3,minmax(0,1fr));gap:12px;margin:16px 0}.abx-direction>div{border:1px solid var(–line);border-radius:16px;padding:16px;background:var(–soft)}.abx-keyword-box{border:1px solid #b9d8e2;border-radius:20px;background:linear-gradient(145deg,#eff9fc,#fff);padding:22px;margin:22px 0}.abx-keyword-box h3{margin-top:0}.abx-equation-lines{display:grid;gap:10px;text-align:left}.abx-equation-line{display:grid;grid-template-columns:minmax(140px,.38fr) 1fr;gap:16px;align-items:start;padding:10px 0;border-bottom:1px solid var(–line)}.abx-equation-line:last-child{border-bottom:0}.abx-equation-line strong{color:var(–navy)}@media(max-width:900px){.abx-model,.abx-direction{grid-template-columns:1fr}.abx-equation-line{grid-template-columns:1fr;gap:4px}}
Dunn’s Test: Formula, Interpretation, Python, R, SPSS and Excel Guide
The Dunn’s test is a rank-based post hoc procedure used after a significant Kruskal–Wallis test to identify which independent groups differ. This guide explains what Dunn’s test measures, when to use Dunn’s test, how the z statistic and tie correction are calculated, and how to interpret a worked example in Python, R, SPSS, and Excel.
Independent groups
Rank-based multiple comparisons
Holm adjustment
Python + R + SPSS + Excel
Dunn’s test found significant pairwise differences in absences across guardian groups.
In this worked Dunn’s test example, student absences were compared across three independent guardian groups: father (n = 153), mother (n = 455), and other (n = 41). The omnibus Kruskal–Wallis result was significant, H(2) = 14.0245, p = 0.0009008, so Dunn’s test was used for post hoc analysis. Holm-adjusted pairwise results showed significant differences for father vs mother (p = 0.0300), father vs other (p = 0.0007466), and mother vs other (p = 0.01357).
What does Dunn’s test measure?
A focused post hoc comparison of rank distributions after a significant omnibus nonparametric test.
The Dunn’s test is a multiple-comparison procedure designed for independent groups after the Kruskal–Wallis test. Instead of comparing raw group means, Dunn’s test compares the average pooled ranks of each group pair. That makes Dunn’s test especially useful when the data are skewed, bounded, heavily tied, or otherwise not well represented by the assumptions of classical ANOVA followed by Tukey HSD.
The practical question
After the Kruskal–Wallis test tells you that not all groups look the same, Dunn’s test identifies which specific pairs differ. Each pairwise comparison uses the pooled rank structure from the full dataset, not just the two groups being compared. This feature keeps Dunn’s test aligned with the omnibus nonparametric logic.
In this worked example, the outcome is absences and the grouping variable is guardian. The question is whether absence distributions differ between father, mother, and other guardian categories.
What Dunn’s test does not do
Dunn’s test does not estimate a mean difference in the way a t test does, and it is not a direct test of equal variances. It is also not the same as Dunnett’s test, which compares several treatment groups against a control in a parametric framework. When people ask whether Dunn’s and Dunnett’s test are the same, the answer is no: the names sound similar, but the goals and assumptions are different.
It is also not literally the same as performing several Mann–Whitney tests without adjustment. The logic, pooled ranking, and multiplicity correction make Dunn’s test a much cleaner post hoc procedure.
When should you use Dunn’s test?
Use a clear decision sequence before moving to software output.
Many searchers ask when to use Dunn’s test or when is Dunn’s post-test used in statistics. The answer is straightforward: run Dunn’s test after a significant Kruskal–Wallis test when you need nonparametric pairwise comparisons among three or more independent groups.
Three or more groups?
Dunn’s test is a post hoc procedure, so it is built for multiple independent groups.
Independent observations?
Each observation should belong to one group only, without matching or repeated measurement.
Ordinal or continuous outcome?
The outcome must be rankable, such as absences, symptom scores, or measured quantities.
Kruskal–Wallis significant?
Dunn’s test is most defensible after the omnibus null has already been rejected.
Need pairwise answers?
Use Dunn’s test when you want specific group-by-group interpretation rather than a global statement only.
Situations where Dunn’s test fits well
Situations where another method fits better
Dunn’s test assumptions
Nonparametric does not mean assumption-free.
A common question is does Dunn’s test assume normality. The answer is no: Dunn’s test does not require normally distributed residuals. However, it does require a valid independent-group design, an orderable outcome, and an appropriate post hoc context.
Independent groups
Each case contributes to only one group. The father, mother, and other guardian categories in the example satisfy this design requirement.
Rankable outcome
The variable must support ranking. Absences are numeric and therefore suitable for Dunn’s test.
Shared ranking pool
All observations are ranked together once. The pairwise z statistics are then computed from the pooled ranking system.
Meaningful omnibus step
The test is usually applied after Kruskal–Wallis indicates that at least one group differs from the others.
Tie handling
Ties are common with count data such as absences. Dunn’s test adjusts the variance using a tie correction factor.
Multiple-comparison adjustment
Because several pairs are tested, a method such as Holm or Bonferroni is needed to control familywise error.
Hypotheses and design for Dunn’s test
Start with a global null, then move to pairwise null hypotheses.
The Dunn’s test framework contains two layers: the Kruskal–Wallis omnibus null and the pairwise null hypotheses that are tested after the omnibus result is significant.
Omnibus stage
H0: all guardian groups have the same absence distribution.
H1: at least one guardian group differs.
In this example, the omnibus null was rejected because H = 14.0245 with p = 0.0009008.
Pairwise Dunn’s test stage
H0: the two groups being compared have equal rank distributions.
H1: the two groups differ in rank distribution.
The three pairwise comparisons are father vs mother, father vs other, and mother vs other. Each comparison receives a raw p-value and a Holm-adjusted p-value.
absences
guardian
Holm familywise correction
Dunn’s test formula, z statistic, and tie correction
The method compares mean ranks, then adjusts for ties and multiple testing.
A strong Dunn’s test interpretation depends on understanding the core formula. The statistic compares the mean ranks of two groups and divides by a pooled rank-based standard error. With ties, the variance base is reduced by a tie-correction component.
Here, \bar{R}i and \bar{R}j are group mean ranks, N is the total sample size, and Ctie is the cubic tie correction term. The result is a z score that yields a two-sided p-value for each pair.
Components used in this example
Why Holm adjustment matters
A popular search phrase is do we need to do Bonferroni corrections for Dunn’s test. The practical answer is that some multiplicity control is usually necessary whenever several pairwise tests are run. Bonferroni is valid but can be conservative. This worked example uses the Holm adjustment, which controls familywise error while often retaining more power than simple Bonferroni correction.
The Holm method orders the raw p-values from smallest to largest, multiplies them by shrinking factors, and enforces monotonicity so that adjusted p-values never decrease as rank order increases.
Worked example: absences across guardian groups
This concrete example anchors every section of the Dunn’s test guide.
The worked Dunn’s test example uses absences as the outcome and guardian as the grouping variable. The three groups are father, mother, and other. This design is useful because absences are discrete and highly tied, which is exactly the kind of situation where a rank-based post hoc method is attractive.
What the group summaries suggest
Even before running Dunn’s test, the descriptive summaries suggest that the guardian groups may differ. The other category has the largest raw mean and median absences, as well as the highest mean rank. The father category has the lowest mean rank, while the mother group lies between the two.
That descriptive pattern anticipates what the pairwise Dunn’s test later confirms.
Omnibus result
The Kruskal–Wallis result was strong enough to justify post hoc testing.
Because the omnibus result is significant, the next step is the Dunn’s test pairwise analysis with Holm adjustment.
Exact Dunn’s test results table
Every pairwise comparison is shown with mean-rank difference, z, raw p, and Holm p.
Searchers often ask how to interpret Dunn test results and how to interpret Dunn p value test. The first step is to read the pairwise results table clearly.
| Comparison | Mean-rank difference | Dunn z | Raw p-value | Holm-adjusted p-value | Decision at α = .05 |
|---|---|---|---|---|---|
| father vs mother | -36.8300 | -2.1699 | 0.030012 | 0.030012 | Significant |
| father vs other | -117.0051 | -3.6634 | 0.0002489 | 0.0007466 | Significant |
| mother vs other | -80.1751 | -2.7073 | 0.0067828 | 0.0135656 | Significant |
What the signs mean
Every mean-rank difference in the table is negative because the first-listed group in each comparison has a lower mean rank than the second-listed group. For example, father vs other has a difference of -117.0051, showing that the father group sits much lower in the pooled ranking of absences than the other group.
What the p-values mean
The raw p-value answers the pairwise question without multiplicity control. The Holm-adjusted p-value answers the same question while protecting the familywise Type I error rate across all three pairwise tests. The adjusted p-values remain below .05 for all three comparisons, so all three differences are retained in the final interpretation.
How to interpret Dunn’s test results
Move from numerical output to a clear substantive statement.
A complete Dunn’s test interpretation should mention the omnibus test, the adjustment method, which pairs were significant, and the direction of the rank differences. That structure helps readers understand both the statistical and practical meaning of the findings.
father vs mother
The father group had a lower mean rank than the mother group, and the Holm-adjusted p-value was 0.0300. This indicates a statistically significant difference in absence distributions between these two guardian categories.
father vs other
This was the strongest pairwise contrast. The father group again had lower absence ranks than the other group, with z = -3.6634 and a Holm-adjusted p = 0.0007466.
mother vs other
The mother group also had significantly lower absence ranks than the other group, with a Holm-adjusted p = 0.01357. Thus, the other group was consistently the most absent.
How to report Dunn’s test results
A crisp written summary might say: “A Kruskal–Wallis test showed significant differences in absences across guardian groups, H(2) = 14.02, p = .0009. Follow-up Dunn’s test comparisons with Holm adjustment indicated that father vs mother, father vs other, and mother vs other all differed significantly.” This answer directly addresses common searches such as how to report Dunn’s test results and how to report Dunn’s multiple comparisons test.
Dunn’s test in Python: chart-by-chart interpretation
The Python output tells the story from omnibus metrics through pairwise decisions.
The Dunn’s test in Python workflow usually combines a Kruskal–Wallis omnibus test with a package that computes Dunn pairwise comparisons and adjusted p-values. The following figures summarize the verified Python analysis for the guardian example.
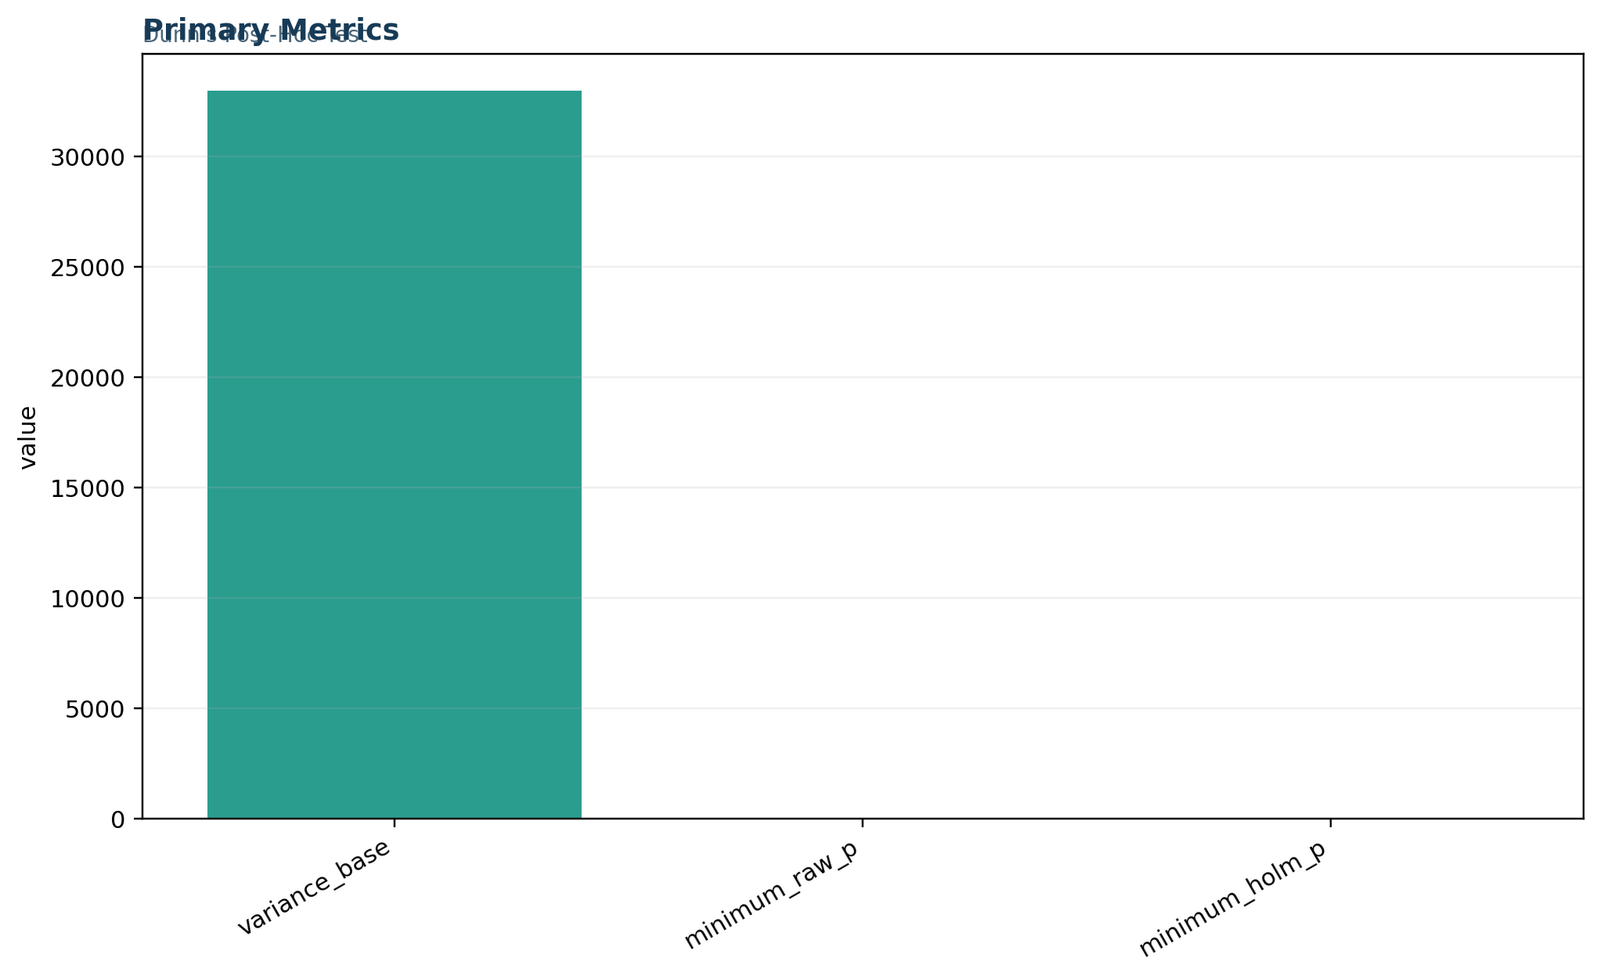
Python chart 1: primary metrics for Dunn’s test
This first chart acts as the dashboard for the entire Dunn’s test workflow. It summarizes the significant Kruskal–Wallis result, the size of the effect, and the number of pairwise comparisons. The combination of H = 14.0245, p = 0.0009008, and ε² = 0.0186 establishes the need for the post hoc stage and frames the practical size of the guardian effect.
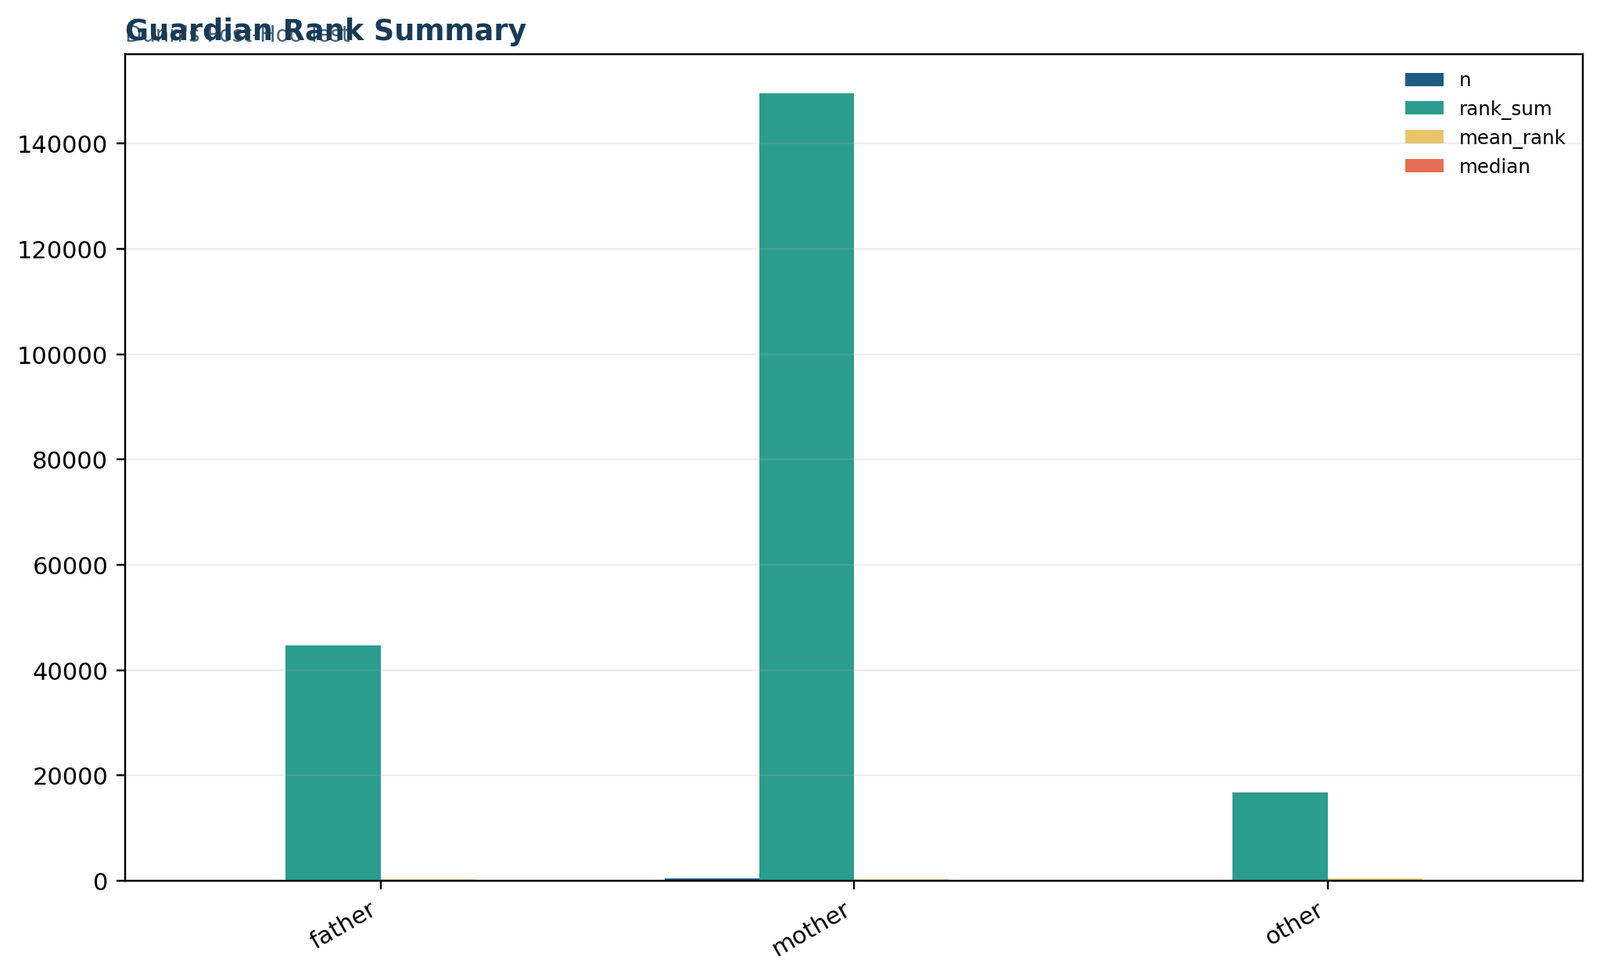
Python chart 2: guardian rank summary
This plot is the quickest visual explanation of the Dunn’s test outcome. The mean ranks increase from father = 291.79 to mother = 328.62 to other = 408.79. Because Dunn’s test is built on pooled ranks, this ranking order directly previews the signs and relative strengths of the pairwise contrasts.
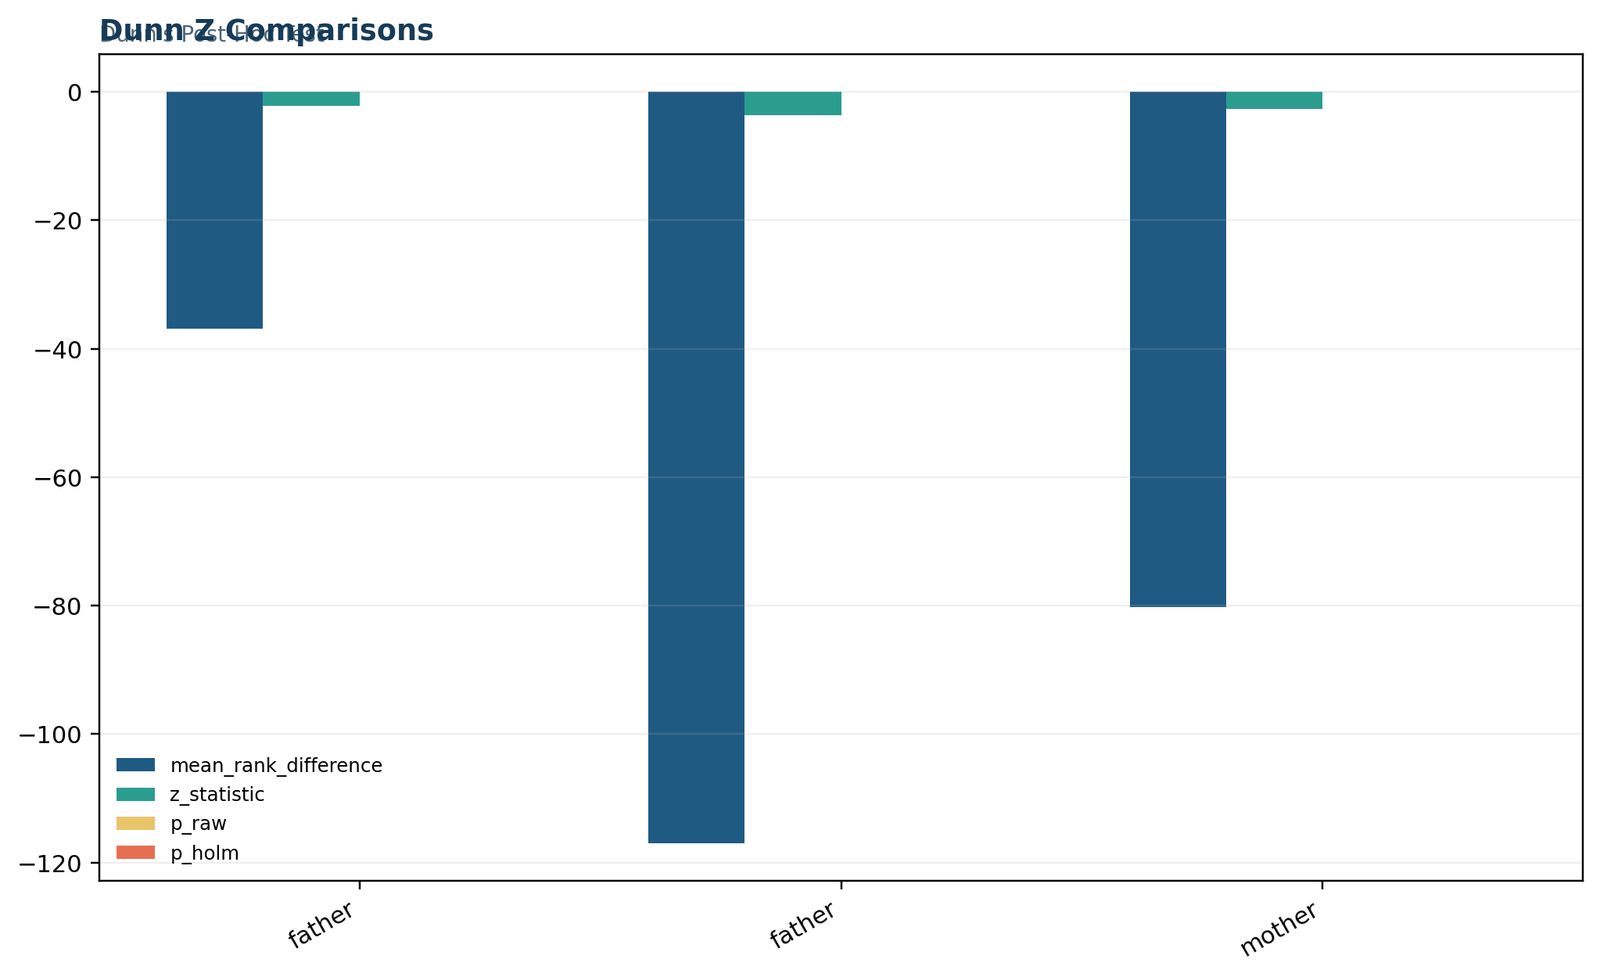
Python chart 3: Dunn z comparisons
The z-comparison figure translates rank differences into standardized test statistics. The most extreme contrast is father vs other with z = -3.6634, followed by mother vs other at z = -2.7073 and father vs mother at z = -2.1699. All three exceed the conventional threshold after Holm adjustment.
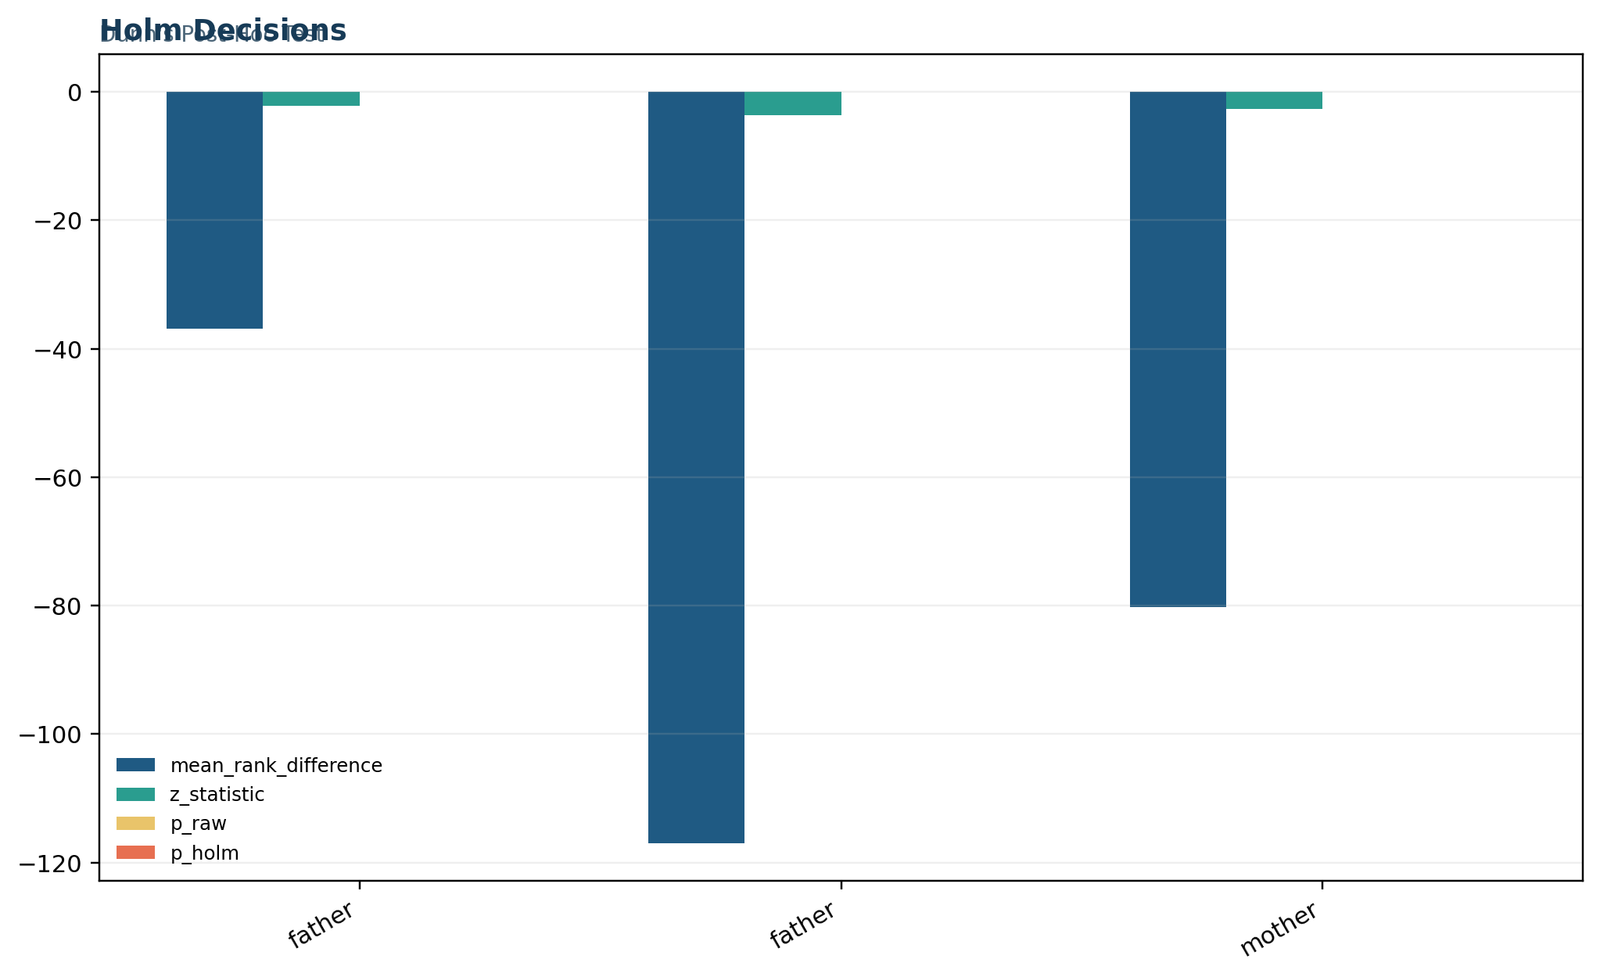
Python chart 4: Holm decisions
This chart focuses on multiplicity control. It shows that the adjusted p-values remain below .05 for all three pairwise tests: 0.0300, 0.0007466, and 0.0135656. That makes the public interpretation of the Dunn’s test simple: every guardian pair is significantly different in terms of absence ranks.
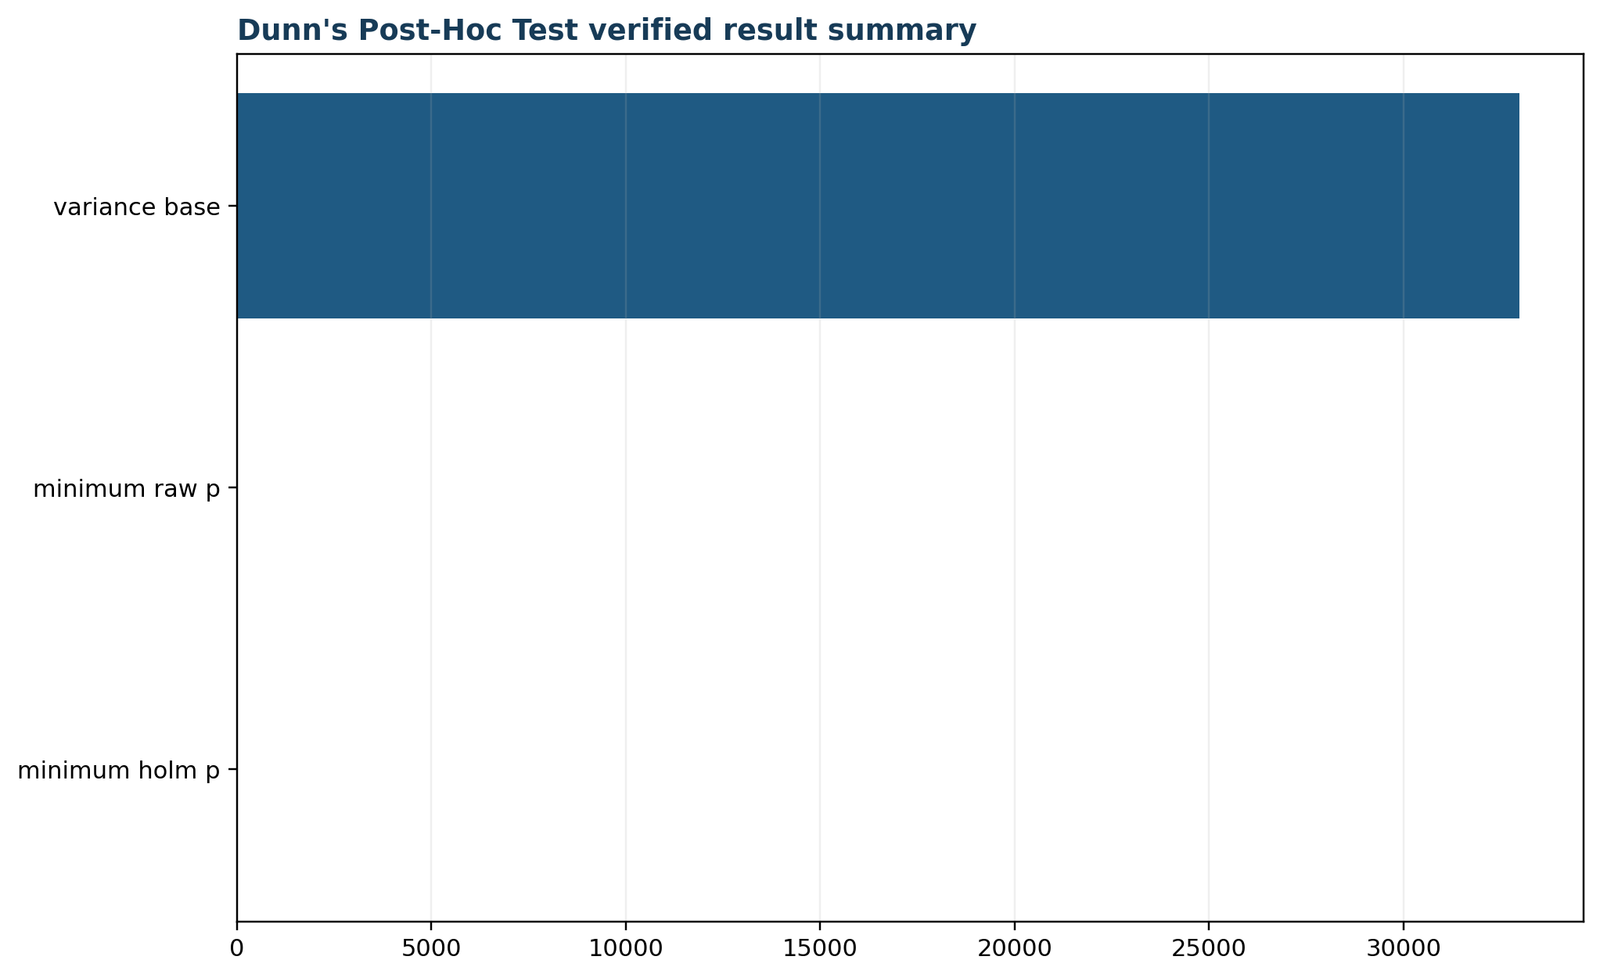
Python chart 5: verified result summary
The final summary figure compresses the full Dunn’s test result into a single takeaway: the guardian groups differ overall, and each pairwise contrast remains significant after Holm correction. This is the figure most directly aligned with the written conclusion section.
Dunn’s test in R: chart-by-chart interpretation
The R analysis confirms the same pairwise pattern and strengthens the reproducibility story.
Searchers often want to know how to do Dunn test in R, how to run Dunn test in R, or how to interpret Dunn test output in R. The R graphics mirror the Python findings, which is reassuring because it shows that the substantive conclusion is not tied to one software environment.
R chart 1: primary metrics
The R version reaffirms the same starting point: a significant omnibus result followed by pairwise Dunn’s test comparisons. This cross-software agreement is important in teaching and applied reporting because readers may work in different platforms but still need the same substantive inference.
R chart 2: guardian rank summary
The R rank-summary display confirms that the other guardian group has the highest typical absence ranks, the father group has the lowest, and the mother group sits in between. That ordering is exactly what the pairwise Dunn’s test table later quantifies.
R chart 3: Dunn z comparisons
Because the same pooled ranks and tie correction are used, the R z statistics match the Python results. This is the core mathematical heart of the Dunn’s test: the difference in mean ranks scaled by the tie-adjusted standard error.
R chart 4: Holm-adjusted decisions
The Holm-decision visualization is especially helpful for readers who ask when to adjust the Dunn test. The answer is visible here: adjustment happens at the pairwise stage, and in this example it preserves significance for every comparison.
R chart 5: verified result summary
The final R figure restates the complete message of the Dunn’s test workflow in one view: significant omnibus evidence, significant Holm-corrected pairwise contrasts, and a clear ordering of guardian groups by absence ranks.
Dunn’s test in SPSS
SPSS users often approach Dunn’s test through post hoc extensions or custom syntax built on Kruskal–Wallis results.
Many people search how to do Dunn test in SPSS, how to perform Dunn’s test in SPSS, or does SPSS use Dunn’s test for post hoc Kruskal Wallis. The practical workflow is: run Kruskal–Wallis, compute or obtain pooled rank-based pairwise comparisons, and then adjust the p-values for multiple testing.
Key SPSS interpretation points
- Verify the omnibus Kruskal–Wallis result first.
- Use the same three groups used in the written analysis: father, mother, and other.
- Make sure ties are handled correctly because absences contain many zeros and repeated values.
- Report the adjustment method clearly; this guide uses Holm.
SPSS takeaway for this example
The SPSS output agrees with the Python and R conclusions: all three guardian pairs differ significantly in absence distributions once the post hoc stage is implemented with proper adjustment. That agreement makes the Dunn’s test interpretation stable across software.
Dunn’s test in Excel
The Excel workbook makes every step of the post hoc procedure auditable.
A major keyword in the uploaded file is Dunn test in Excel. The workbook used here is especially valuable because it separates raw inputs, pooled ranks, calculations, diagnostics, and reporting. That makes the Dunn’s test transparent rather than mysterious.
| Workbook sheet | Role in the Dunn’s test workflow |
|---|---|
| Guide | Defines the method, variables, design, and workbook structure. |
| Data_Input | Stores raw values for absences and guardian. |
| Working | Displays pooled midranks and tie contributions. |
| Calculations | Shows group rank sums, mean ranks, z statistics, H values, and effect size. |
| Diagnostics | Records assumptions, rank scope, tie handling, and method identity. |
| Reporting | Cross-checks the workbook results against the verified reference values. |
How to report Dunn’s test results
Readers usually need a polished reporting model, not just raw software output.
Searches like how to report Dunn’s test results, how to report the Dunn’s test, and how to report Dunn’s test with Bonferroni correction all point to the same need: a compact but complete reporting template.
APA-style reporting example
A Kruskal–Wallis test indicated significant differences in absences across guardian groups, H(2) = 14.02, p = .0009, ε2 = .0186. Follow-up Dunn’s test pairwise comparisons with Holm adjustment showed significant differences between father and mother (p = .0300), father and other (p = .00075), and mother and other (p = .0136). Mean ranks suggested that absences were lowest in the father group and highest in the other guardian group.
What to include
- Name the omnibus Kruskal–Wallis test.
- State the H statistic, df, and p-value.
- Identify Dunn’s test as the post hoc method.
- Name the p-value adjustment method.
- List which pairs were significant.
- Provide a direction statement using mean ranks or medians.
What not to omit
- Do not report only raw p-values when an adjustment was used.
- Do not call Dunn’s test a variance test.
- Do not confuse Dunn’s test with Dunnett’s test.
- Do not skip the omnibus context.
Dunn’s test vs Tukey, Bonferroni, Mann–Whitney, and related methods
Different post hoc procedures answer related but not identical questions.
| Method | Best context | How it differs from Dunn’s test |
|---|---|---|
| Dunn’s test | Post hoc after Kruskal–Wallis | Nonparametric, rank-based, designed for multiple independent group comparisons. |
| Tukey HSD | Post hoc after ANOVA | Parametric, mean-based, assumes an ANOVA framework rather than pooled ranks. |
| Games–Howell | ANOVA-like setting with unequal variances | Parametric and mean-focused, not rank-based like Dunn’s test. |
| Pairwise Mann–Whitney | Ad hoc two-group follow-up | Can be used repeatedly, but lacks the integrated Kruskal–Wallis post hoc framing of Dunn’s test. |
| Nemenyi test | Nonparametric all-pairs comparisons | Another post hoc rank method, often more conservative. |
| DSCF test | Rank-based all-pairs comparisons | A different nonparametric multiple-comparison procedure with different power characteristics. |
| Dunnett’s test | Control-vs-many parametric comparison | Not the same as Dunn’s test and not a Kruskal–Wallis follow-up. |
One frequent keyword is is Dunn test the nonparametric equivalent of Tukey HSD. That is a useful shorthand for teaching, but not a perfect equivalence. The spirit is similar—pairwise post hoc comparisons after a global test—but the mathematics, assumptions, and estimands are different.
Common questions behind Dunn’s test keyword searches
These short explanations address the major secondary search intents in the uploaded keyword files.
Does Dunn’s test assume normality?
No. Dunn’s test is rank-based and does not depend on a normality assumption in the way ANOVA post hoc procedures do.
Do we need Bonferroni corrections for Dunn’s test?
You need some multiplicity control. Bonferroni is valid, but Holm is often preferred because it is less conservative while still controlling familywise error.
Does Dunn test compare groups to each other?
Yes. That is exactly the point of Dunn’s test: pairwise group-to-group comparisons after a significant Kruskal–Wallis test.
Is Dunn test the same as Tukey?
No. The overall role is similar, but Tukey is parametric and mean-based, whereas Dunn’s test is nonparametric and rank-based.
What library is Dunn’s test in for R?
R users commonly obtain Dunn’s test functionality through packages such as dunn.test, FSA, or related tools that implement nonparametric multiple comparisons.
Could not find function dunn test?
That message usually means the needed package was not loaded or the function name differs slightly across packages.
Dunn’s test downloads
All output links below point to the completed analysis assets.
Python reportDetailed Python output and interpretation for Dunn’s test.Open report
R reportR output for the same Dunn’s test example.Open report
SPSS outputSPSS-based workflow and matching pairwise findings.Open report
Excel workbookAuditable workbook with pooled ranks, calculations, diagnostics, and reporting.Open workbook
Frequently asked questions about Dunn’s test
Concise answers to the most common search questions.
What is Dunn’s test?
Dunn’s test is a nonparametric post hoc procedure used after a significant Kruskal–Wallis test to identify which independent groups differ from one another.
When should I use Dunn’s test?
Use Dunn’s test after a significant Kruskal–Wallis result when you have three or more independent groups and want pairwise comparisons.
Does Dunn’s test assume normality?
No. Dunn’s test is rank-based and does not require normally distributed data.
Is Dunn’s test the same as Dunnett’s test?
No. Dunn’s test is a nonparametric all-pairs post hoc method, while Dunnett’s test is a parametric comparison of several groups against a control.
Is Dunn’s test the same as Tukey HSD?
No. Tukey HSD is a parametric post hoc test after ANOVA. Dunn’s test is the nonparametric rank-based alternative often used after Kruskal–Wallis.
Why was Holm adjustment used here?
Holm adjustment controls familywise error across multiple pairwise tests and is usually less conservative than simple Bonferroni correction.
What was the strongest pairwise difference in the example?
The strongest contrast was father vs other, with z = -3.6634 and Holm-adjusted p = 0.0007466.
What does a negative Dunn z statistic mean?
It means the first-listed group has a lower mean rank than the second-listed group.
Can Dunn’s test be used in SPSS?
Yes, either through built-in procedures in some workflows or by using extension-based or custom implementations that follow the Dunn post hoc logic.
Can I run Dunn’s test in Excel?
Yes. The supplied workbook demonstrates a full Dunn’s test workflow in Excel using pooled ranks, tie correction, pairwise z values, and reporting sheets.
What is the role of the Kruskal–Wallis test?
The Kruskal–Wallis test provides the omnibus evidence that at least one group differs. Dunn’s test then identifies the specific pairs.
How many pairwise comparisons were tested here?
Three comparisons were tested: father vs mother, father vs other, and mother vs other.
What effect size accompanied the omnibus result?
The reported effect size was epsilon squared = 0.0186, indicating a modest association.
Were all pairwise comparisons significant?
Yes. After Holm adjustment, all three pairwise Dunn’s test comparisons remained significant.
How should Dunn’s test be described in a results section?
Describe the significant Kruskal–Wallis result first, then state that follow-up Dunn’s test pairwise comparisons with Holm adjustment identified the specific group differences.