
Fisher's Exact Test: Formula, Calculator, Interpretation, Python, R, SPSS, SAS and Excel Guide
Fisher's Exact Test evaluates association in a 2 × 2 contingency table by conditioning on the observed row and column margins and calculating hypergeometric probabilities. This complete guide explains what Fisher's Exact Test tells you, when to use it instead of chi-square, how the two-sided p-value is constructed, how to interpret the odds ratio, how to calculate the result by hand and in software, and how to report the finding through a verified analysis of sex and internet access for 649 students.
649 observations
Odds ratio = 1.3819
Two-sided p = .1082
Fisher's Exact Test Model Overview
Fisher's Exact Test, also called Fisher's exact probability test, is a conditional exact test of association for categorical data. In its standard form, it analyses a 2 × 2 table and asks whether two binary variables are independent after the row totals and column totals are treated as fixed. Unlike an asymptotic chi-square test of independence, Fisher's Exact Test calculates probabilities from the exact finite-sample hypergeometric distribution rather than relying on a large-sample approximation.
What Question Does Fisher's Exact Test Answer?
The method asks whether the observed arrangement of counts is compatible with the null hypothesis of no association, conditional on the margins. In the worked example, it tests whether sex and internet access are independent. Female students contribute 98 “no” and 285 “yes” responses, while male students contribute 53 “no” and 213 “yes” responses.
Here θ is the population odds ratio under the fixed-margin model. The null odds ratio of one means that the odds of the row outcome do not differ across the column groups. For help distinguishing the statistical hypotheses from the research wording, see Null and Alternative Hypothesis and P-Value.
How the Exact Distribution Is Built
Once the margins are fixed, only one cell count is free to vary. If the upper-left count is denoted by a, every possible 2 × 2 table with the same margins corresponds to one allowable value of a. Under the null hypothesis, the probability of each table follows a hypergeometric probability. Fisher's Exact Test sums the probabilities of tables selected by the stated one-sided or two-sided rule.
How Fisher's Exact Test Differs from Chi-Square
The chi-square test uses a reference approximation based on observed and expected counts. Fisher's Exact Test instead uses the conditional distribution of all fixed-margin tables. Exactness can be valuable when expected counts are small, samples are unbalanced, or the analyst wants finite-sample conditional inference. In the present table all expected counts exceed 61, so the exact test is not required by a sparse-cell rule; it is used to demonstrate and verify the conditional analysis.
Worked Example at a Glance
The sample contains 383 female and 266 male students. Internet access was reported by 285 females (74.41%) and 213 males (80.08%). The sample odds ratio for female-versus-male odds of having no internet rather than internet access is 1.3819. Fisher's Exact Test returns a two-sided p-value of 0.1082363, so the null hypothesis is not rejected at α = .05.
Quick Answer: Fisher's Exact Test Result
The primary Fisher's Exact Test compares sex with internet access in a 2 × 2 table. Both margins are conditioned upon, and the two-sided p-value uses probability ordering: every fixed-margin table with probability no greater than the observed table probability is included in the two-sided region.
Test Summary
- Procedure: two-sided Fisher's Exact Test
- Table: sex × internet access
- Observed table probability: 0.0184866
- Two-sided exact p-value: 0.1082363
- Decision at α = .05: fail to reject H0
- One-sided greater p-value: 0.0558950
Substantive Meaning
- Female: 285 of 383 reported internet access.
- Male: 213 of 266 reported internet access.
- Female-minus-male difference: −5.66 percentage points.
- Internet-access risk ratio, F/M: 0.9293.
- Conditional odds ratio: approximately 1.3812.
- Conditional 95% CI: [0.9324, 2.0614].
Table of Contents
- Research question, hypotheses and fixed-margin design
- When to use Fisher's Exact Test
- Fisher's Exact Test formula and calculation
- Variables and data dictionary
- Worked 2 × 2 table and complete results
- Fisher versus chi-square, Barnard, Boschloo and related tests
- Fisher's Exact Test calculator workflow
- Python and R chart interpretations
- Python, R, SPSS, SAS, Stata and Excel workflows
- Expandable software code
- Assumptions, limitations and interpretation safeguards
- APA reporting for Fisher's Exact Test
- Common mistakes and corrections
- Reports and worked Excel download
- Related Salar Cafe guides
- Frequently asked questions
- Conclusion
Research Question, Hypotheses and Fixed-Margin Design
Research Question
Is internet-access status associated with sex in the analysed student sample when inference is conditioned on the observed row and column margins?
Null and Alternative Hypotheses
| Hypothesis | Statistical statement | Meaning |
|---|---|---|
| Null hypothesis | H0: θ = 1 | The conditional population odds ratio is one; sex and internet access are independent under the fixed-margin model. |
| Two-sided alternative | H1: θ ≠ 1 | The conditional odds ratio differs from one in either direction. |
| Greater alternative | H1: θ > 1 | Female students have higher odds of “no” versus “yes” internet access than male students, under the table ordering used here. |
| Less alternative | H1: θ < 1 | The odds-ratio direction is reversed. |
Why the Margins Matter
The row totals are 383 and 266, while the column totals are 151 and 498. Fisher's Exact Test conditions on these margins. Once they are fixed, the entire table is determined by one free cell, a = 98. This conditional design is the core distinction between Fisher's Exact Test and unconditional exact alternatives such as Barnard's Exact Test and Boschloo Test.
Why the Alternative Must Be Declared in Advance
A two-sided Fisher's Exact Test is appropriate when either direction of association would be meaningful. A one-sided test is appropriate only when a directional claim was prespecified. Selecting “greater” after seeing that the sample odds ratio exceeds one would inflate the risk described in Type I and Type II Error.
When to Use Fisher's Exact Test
Use Fisher's Exact Test When
- The table is 2 × 2 and the observations are independent.
- Both variables are categorical and dichotomous.
- Expected counts are small, zero cells occur, or an exact conditional result is preferred.
- The sampling design supports conditioning on the margins.
- You need a p-value based on the exact hypergeometric distribution.
- You want a conditional odds-ratio analysis rather than a large-sample approximation.
- The analysis is a small clinical, laboratory, epidemiological or survey comparison.
Choose Another Method When
- The observations are paired or matched; use a paired binary method instead.
- The table is larger than 2 × 2 and the software does not implement the Fisher–Freeman–Halton extension.
- Covariate adjustment is required; use logistic regression.
- Several 2 × 2 strata must be combined; consider the Cochran–Mantel–Haenszel Test.
- The outcome is quantitative or ordinal and should not be dichotomized.
- The design is naturally two independent binomial experiments and an unconditional exact test is preferred.
Simple Test-Selection Logic
If no, use a larger-table exact or asymptotic method.
If no, choose a matched, clustered or repeated-response method.
If yes, Fisher's Exact Test is a defensible primary method.
Does Fisher's Exact Test Assume Normality?
No. Fisher's Exact Test does not assume a normally distributed outcome because it analyses cell counts. It does, however, require a correctly classified 2 × 2 table, independent observational units and a meaningful conditional sampling framework. It is often described as nonparametric, but “exact conditional categorical test” is more informative than simply calling it nonparametric.
Can Fisher's Exact Test Be Used for Larger Tables?
The standard named procedure is most familiar for 2 × 2 tables. Larger r × c tables can be analysed with generalizations such as the Fisher–Freeman–Halton Test, often using exact enumeration or Monte Carlo sampling. A 2 × 3 or 3 × 3 table should not be squeezed into an ordinary 2 × 2 Fisher calculation.
Fisher's Exact Test Formula and Calculation
For the 2 × 2 table below, Fisher's Exact Test conditions on the row totals, column totals and grand total:
| Internet: No | Internet: Yes | Row total | |
|---|---|---|---|
| Female | a = 98 | b = 285 | a + b = 383 |
| Male | c = 53 | d = 213 | c + d = 266 |
| Column total | a + c = 151 | b + d = 498 | N = 649 |
Hypergeometric Probability Formula
For the observed upper-left count a = 98:
Allowable Tables Under the Fixed Margins
The upper-left count can range from 0 to 151. For every allowable value of a, the remaining cells follow from the margins:
This creates 152 possible fixed-margin tables. Fisher's Exact Test evaluates their probabilities under the null distribution.
How the Two-Sided P-Value Is Constructed
The probability-ordering definition includes every table whose hypergeometric probability is no greater than the probability of the observed table. For this example, the included upper-left counts are:
This two-sided calculation is not always equal to twice the smaller one-sided p-value. Different software can also implement two-sided exact definitions differently, so the procedure and software should be named when a result is near the decision threshold.
Sample and Conditional Odds Ratios
The sample cross-product ratio is 1.3819. The conditional maximum-likelihood odds ratio is approximately 1.38125, with an exact conditional 95% confidence interval of [0.93242, 2.06136]. Because the interval includes one, it agrees with the non-significant two-sided Fisher's Exact Test.
Variables and Data Dictionary
| Variable | Role | Coding | N | Counts | Meaning |
|---|---|---|---|---|---|
| sex | Binary row variable | F = female; M = male | 649 | F = 383; M = 266 | Defines the two independent student groups. |
| internet | Binary column variable | no; yes | 649 | no = 151; yes = 498 | Indicates whether the student reported internet access. |
| Female, no | Upper-left table cell | a | — | 98 | Female students without internet access. |
| Female, yes | Upper-right table cell | b | — | 285 | Female students with internet access. |
| Male, no | Lower-left table cell | c | — | 53 | Male students without internet access. |
| Male, yes | Lower-right table cell | d | — | 213 | Male students with internet access. |
Observed Row Percentages
| Sex | No internet | Internet access | Total |
|---|---|---|---|
| Female | 98 (25.59%) | 285 (74.41%) | 383 |
| Male | 53 (19.92%) | 213 (80.08%) | 266 |
Expected Counts for Chi-Square Context
| Cell | Observed | Expected | Pearson residual | Chi-square contribution |
|---|---|---|---|---|
| Female, no | 98 | 89.1109 | +0.9417 | 0.8867 |
| Female, yes | 285 | 293.8891 | −0.5185 | 0.2689 |
| Male, no | 53 | 61.8891 | −1.1299 | 1.2767 |
| Male, yes | 213 | 204.1109 | +0.6222 | 0.3871 |
Worked 2 × 2 Table and Complete Results
285 of 383
213 of 266
−5.66 percentage points
Female vs male odds of no/yes
Probability ordered
Very small association
Primary Fisher's Exact Test Result
| Test | Odds ratio | Alternative | P-value | Decision at α = .05 |
|---|---|---|---|---|
| Fisher's Exact Test | 1.3819265 | Two-sided | 0.1082363 | Fail to reject H0 |
| Fisher's Exact Test | 1.3819265 | Greater | 0.0558950 | Fail to reject H0 |
| Fisher's Exact Test | 1.3819265 | Less | 0.9625916 | Fail to reject H0 |
Effect Estimates and Confidence Intervals
| Measure | Estimate | 95% lower | 95% upper | Interpretation |
|---|---|---|---|---|
| Female internet proportion | 0.7441253 | — | — | About 74.4% of female students reported internet access. |
| Male internet proportion | 0.8007519 | — | — | About 80.1% of male students reported internet access. |
| Risk difference, F − M | −0.0566266 | −0.1215408 | 0.0082876 | The female internet-access proportion was 5.66 points lower; the approximate interval includes zero. |
| Risk ratio, F/M | 0.9292833 | 0.8544817 | 1.0106330 | The female internet-access probability was about 92.9% of the male probability; the interval includes one. |
| Conditional odds ratio, no/yes | 1.3812484 | 0.9324161 | 2.0613595 | The conditional odds of no internet versus yes were estimated as higher for females, but uncertainty includes no association. |
| Phi coefficient | 0.0659109 | — | — | The unadjusted association magnitude is very small. |
Statistical Interpretation
The two-sided p-value is 0.1082, which is greater than .05. Fisher's Exact Test therefore does not reject the conditional independence null. The result is also not significant at .10 under the probability-ordered two-sided definition. The one-sided greater p-value of .0559 is closer to .05, but a one-sided analysis must be justified before the data are examined.
Practical Interpretation
The observed internet-access difference is modest: 74.41% among females and 80.08% among males. The effect size is small, with φ = 0.066. The conditional confidence interval ranges from odds ratios slightly below one to values above two, showing that the data are compatible with a broad range of population effects.
Fisher's Exact Test Versus Related Tests
Conditional exact test for a 2 × 2 table using the hypergeometric distribution.
Asymptotic association test based on observed and expected counts.
Unconditional exact comparison for two independent binomial samples.
Unconditional test that orders tables through Fisher exact p-values.
Numerical Comparison for the Worked Table
| Method | Statistic or estimate | P-value | Decision at .05 | Role |
|---|---|---|---|---|
| Fisher's Exact Test, two-sided | OR = 1.3819 | 0.1082363 | Fail to reject | Primary conditional exact result. |
| Pearson chi-square | χ²(1) = 2.8194 | 0.0931303 | Fail to reject | Uncorrected asymptotic comparison. |
| Yates-corrected chi-square | χ²(1) = 2.5112 | 0.1130429 | Fail to reject | Continuity-corrected comparison. |
| One-sided Fisher, greater | OR = 1.3819 | 0.0558950 | Fail to reject | Directional result only if prespecified. |
Fisher's Exact Test Versus Chi-Square
Both procedures test association, but they use different reference logic. Chi-square calculates a statistic from observed and expected counts and compares it with an asymptotic chi-square distribution. Fisher's Exact Test conditions on the margins and sums exact hypergeometric table probabilities. For this dataset the conclusions agree, although the p-values differ: .1082 for Fisher, .0931 for Pearson and .1130 with Yates correction.
Fisher's Exact Test Versus Barnard and Boschloo
Fisher's Exact Test is conditional. Barnard and Boschloo are unconditional exact tests designed for two independent binomial samples when only group sample sizes are fixed. Unconditional methods can have greater power in suitable designs because they do not condition on the combined outcome total. The primary method should be selected from the sampling design, not from whichever method gives the smallest p-value.
Fisher's Exact Test Versus Exact Test for One Proportion
An Exact Test for Proportions tests one binomial proportion against a specified null value. Fisher's Exact Test compares two binary variables in a contingency table. The distributions, hypotheses and inputs are different even though both methods are exact.
Fisher's Exact Test Versus Fisher–Freeman–Halton
Fisher's Exact Test is ordinarily used for 2 × 2 tables. The Fisher–Freeman–Halton extension generalizes fixed-margin exact testing to larger contingency tables. Larger-table computation can require enumeration algorithms or Monte Carlo approximation because the number of possible tables grows rapidly.
Fisher's Exact Test Calculator: Step-by-Step Workflow
A reliable Fisher's Exact Test calculator should accept the four cell counts, preserve the chosen table orientation, identify the alternative, calculate the exact p-value and report an odds ratio with a clearly named confidence-interval method.
Calculator Inputs
| Input | Value | Meaning |
|---|---|---|
| Upper-left cell, a | 98 | Female students without internet access. |
| Upper-right cell, b | 285 | Female students with internet access. |
| Lower-left cell, c | 53 | Male students without internet access. |
| Lower-right cell, d | 213 | Male students with internet access. |
| Alternative | Two-sided | Association in either direction is relevant. |
| Alpha | 0.05 | Decision threshold specified before analysis. |
Calculator Step 1: Check the Table Orientation
Confirm which row and column define the numerator of the odds ratio. If the calculator returns 0.7236 rather than 1.3819, it has reversed one axis. This is not necessarily an error, but the output label must match the chosen direction.
Calculator Step 2: Verify the Margins
The calculator should report row totals 383 and 266, column totals 151 and 498, and N = 649. Incorrect margins mean the four cells were entered in the wrong order.
Calculator Step 3: Check the Observed Probability
The probability of the observed fixed-margin table should be approximately 0.01848665. This is a component of the exact calculation, not the final two-sided p-value.
Calculator Step 4: Verify the Two-Sided Definition
Under probability ordering, the target two-sided p-value is 0.10823626. A calculator that simply doubles the smaller one-sided p-value would return approximately 0.11179010, which is close but not identical. The calculator's documentation should explain its two-sided rule.
Calculator Step 5: Interpret Counts, Proportions and Odds Ratio
Read the p-value beside the 74.41% and 80.08% internet-access proportions, the 5.66-point difference, the odds ratio and its confidence interval. A calculator result is incomplete if it reports only “significant” or “not significant.”
Python and R Fisher's Exact Test Chart Interpretations
The Python and R reports describe the same 2 × 2 table from complementary angles. The Python charts emphasize the exact null distribution and two-sided region, while the R charts reinforce expected agreement under the margins, row profiles, odds components and the final result.
Chart 1: Fisher's Exact Test Observed 2 × 2 TablePython
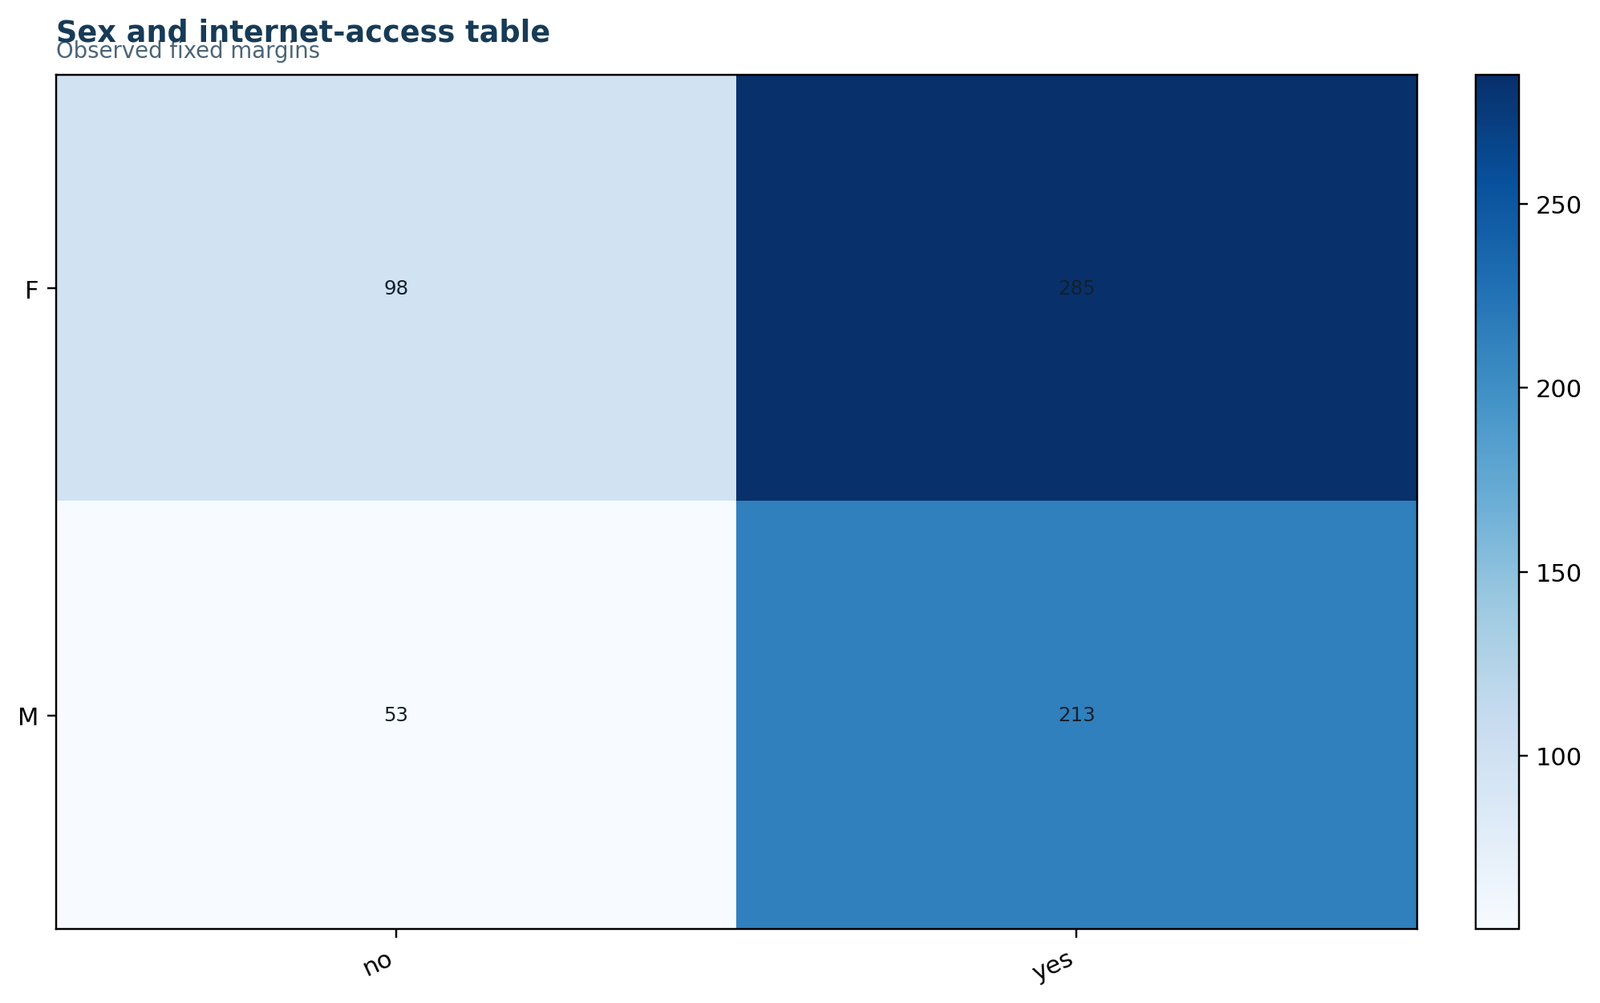
The largest cell is female students with internet access, followed by male students with internet access.
Female: 98 no and 285 yes; male: 53 no and 213 yes; N = 649.
The heatmap anchors the exact analysis in the four observed counts and makes the unequal group totals visible.
Every margin, probability, odds ratio and row percentage comes from these four cells.
Chart 2: Fisher's Exact Test Hypergeometric Null DistributionPython
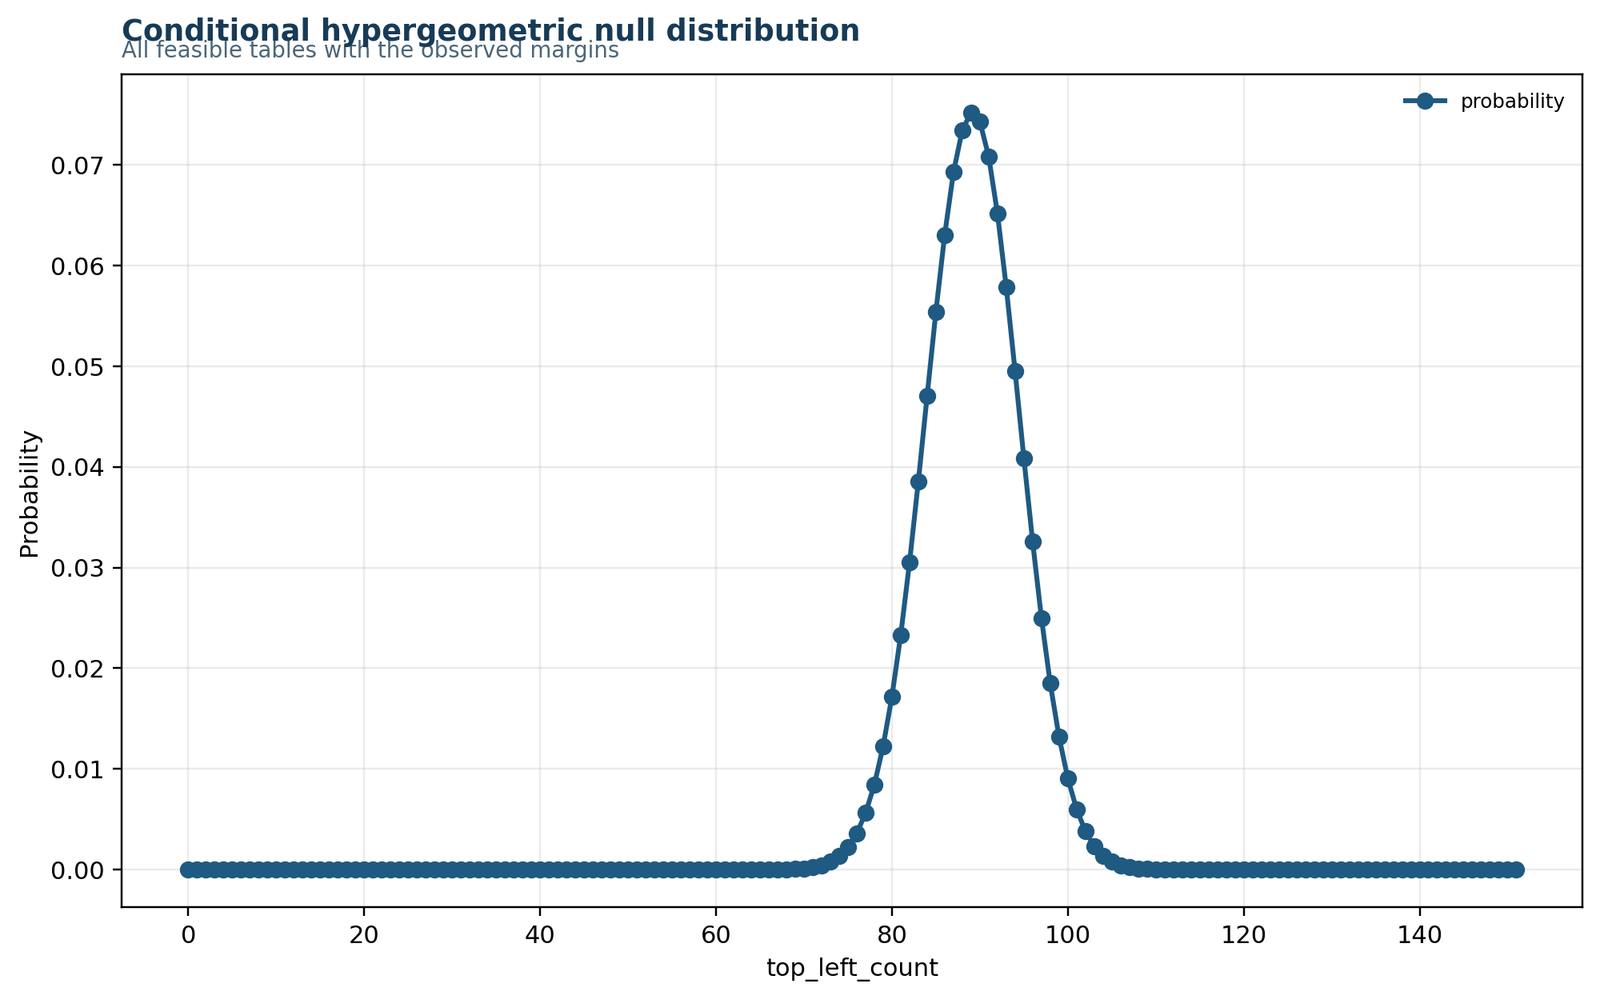
The distribution is concentrated near the null-expected upper-left count of about 89, while the observed count is 98.
Allowable a values run from 0 to 151; observed a = 98; observed table probability = 0.0184866.
The observed table lies to the right of the distribution center but is not isolated far enough to yield a two-sided p-value below .05.
The chart demonstrates that Fisher's Exact Test compares the observed table with all tables sharing the same margins.
Chart 3: Fisher's Exact Test Two-Sided Probability RegionPython
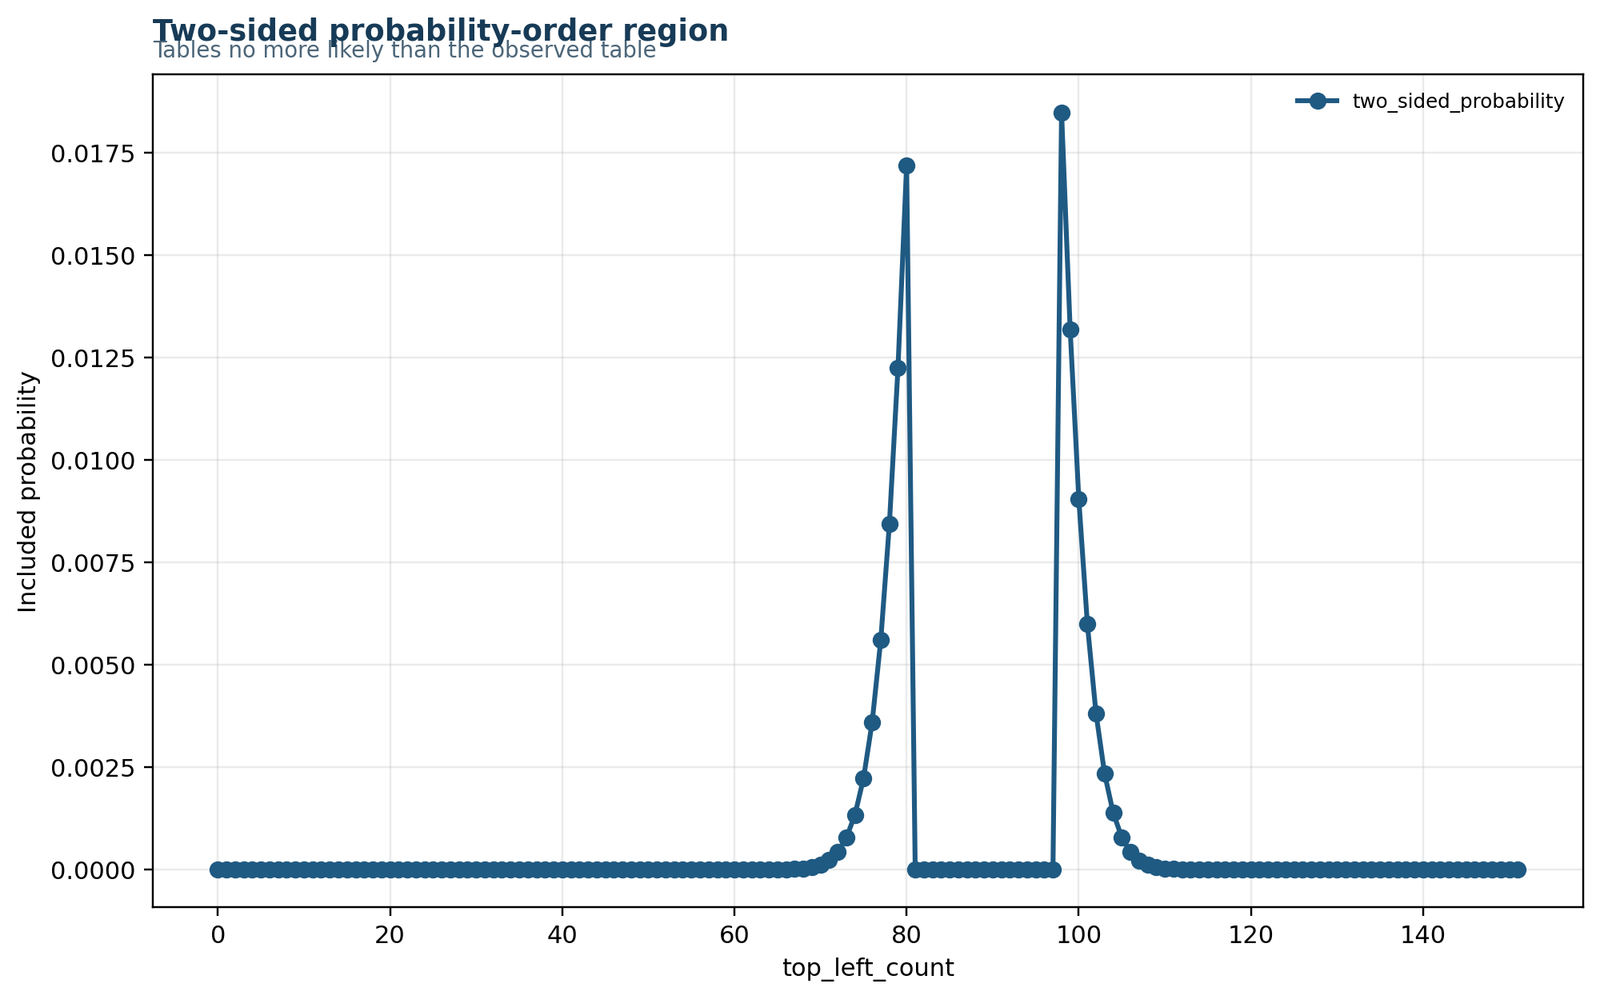
The two-sided region appears in both tails, but the boundaries are selected by table probability rather than equal distance from the null center.
Included a values are 0–80 and 98–151; lower-region probability = 0.0523412; upper-region probability = 0.0558950.
Adding the included probabilities gives p = 0.1082363. The region is not obtained by mechanically doubling one tail.
Two-sided definitions can produce small software differences, especially near alpha.
Chart 4: Fisher's Exact Test Result ComponentsPython
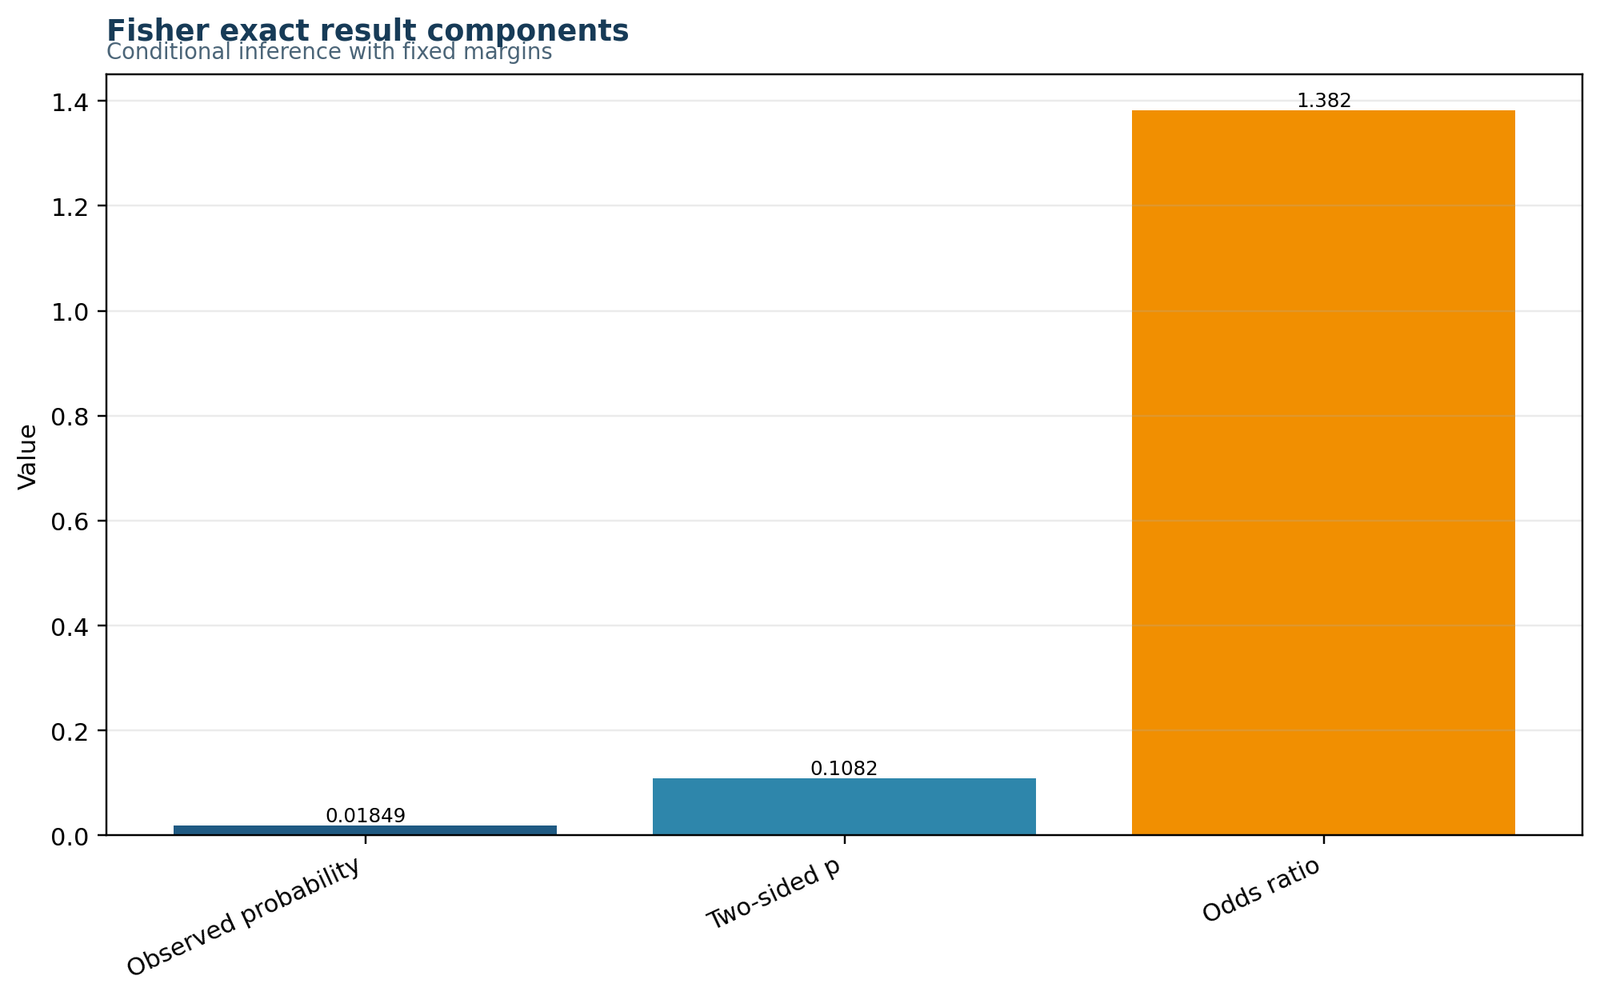
The observed-table probability is much smaller than the final p-value because the p-value sums many fixed-margin tables.
Observed probability = 0.0184866; greater p = 0.0558950; two-sided p = 0.1082363.
The table probability answers “how likely is this exact table?” while the p-value answers “how much probability is assigned to tables at least as incompatible with the null under the selected rule?”
Confusing these quantities is one of the most common exact-test errors.
Chart 5: Fisher's Exact Test Row PercentagesPython
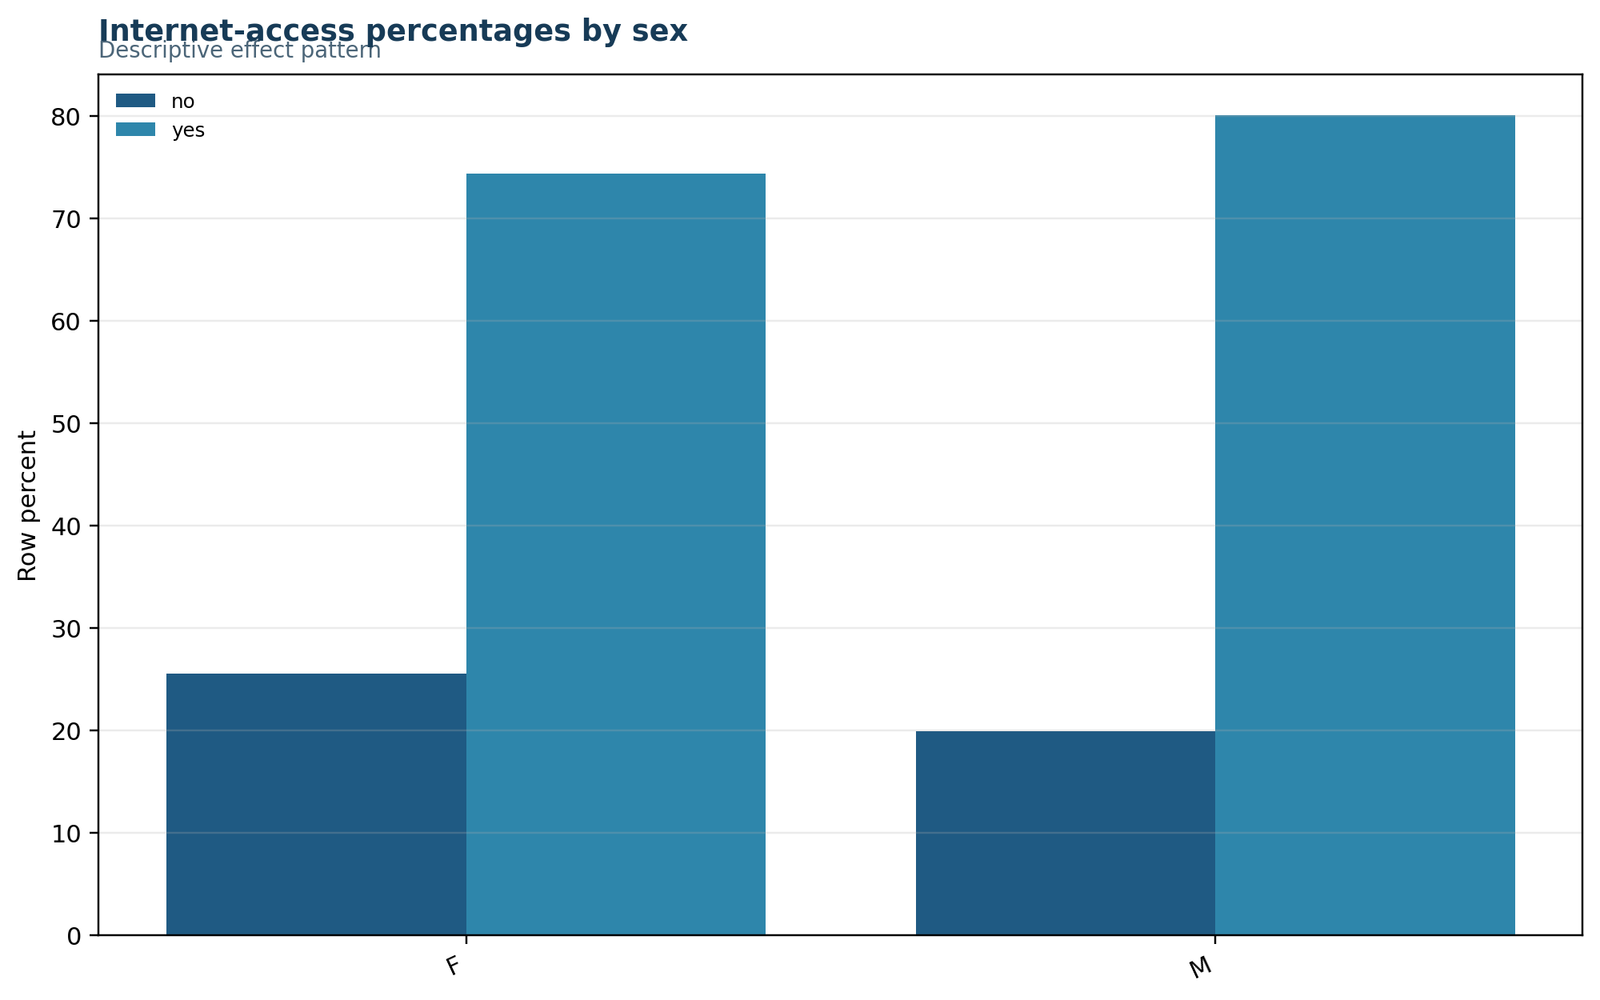
Male students show the higher internet-access percentage, while female students show the higher no-internet percentage.
Female yes = 74.41%, no = 25.59%; male yes = 80.08%, no = 19.92%.
The absolute difference in internet access is 5.66 percentage points, which is modest relative to sampling uncertainty.
Row percentages communicate practical magnitude more clearly than a p-value alone.
Chart 6: Fisher's Exact Test Result SummaryPython
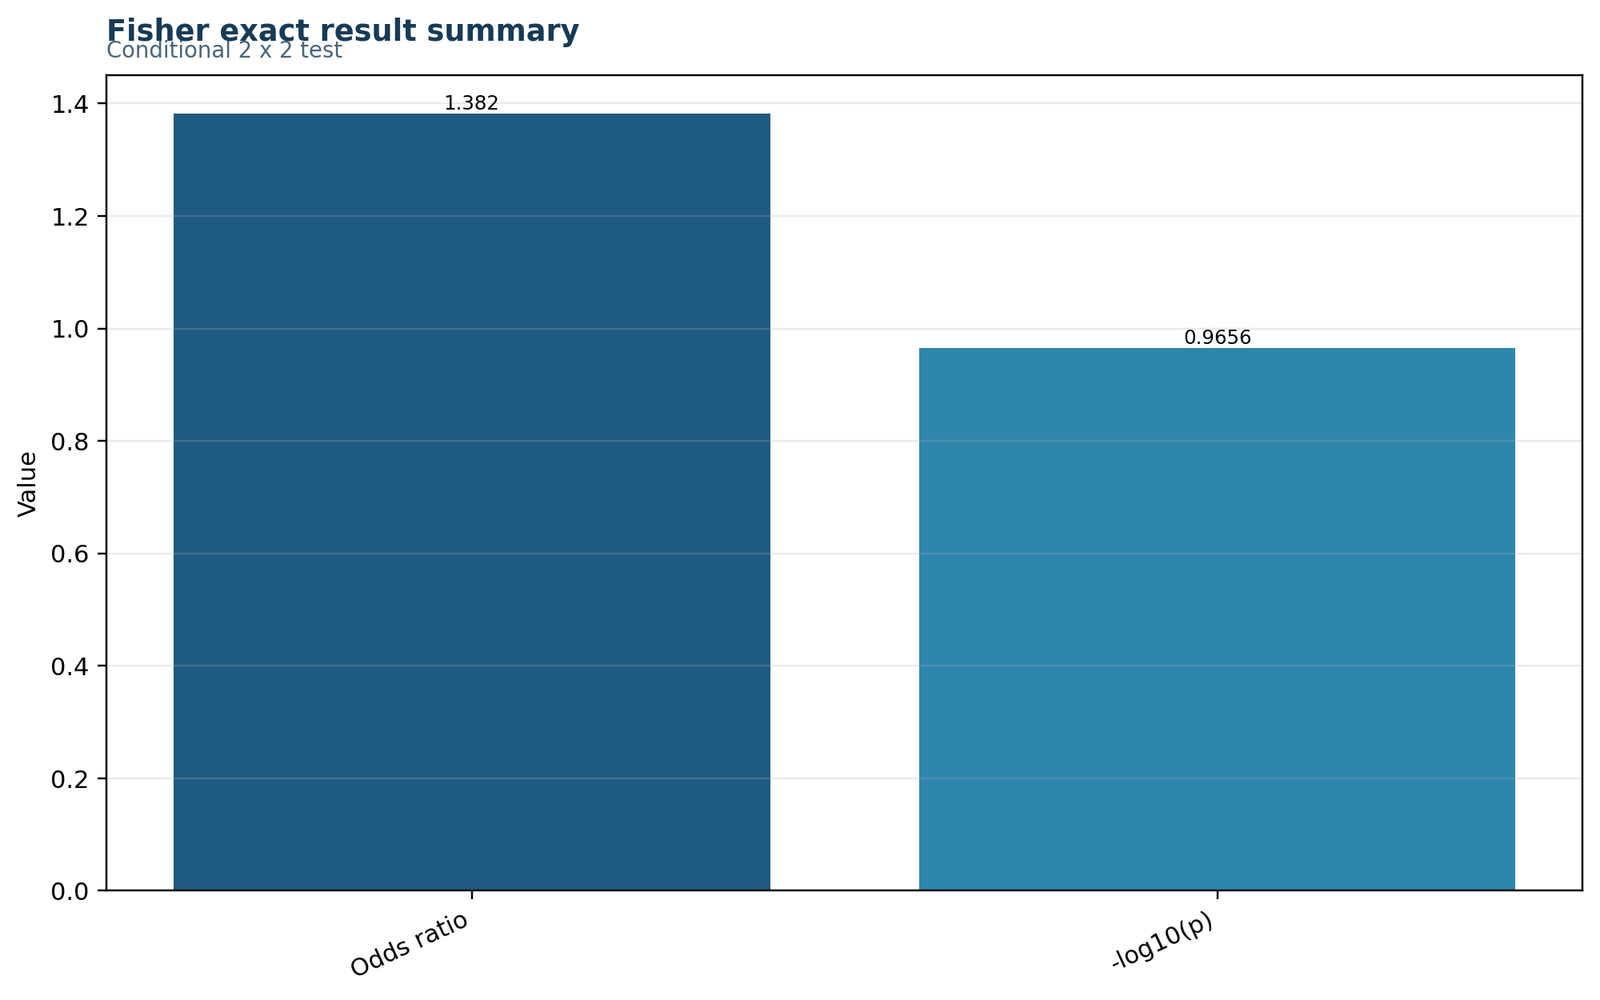
The point estimate is above one, but the confidence interval spans one and the two-sided p-value exceeds .05.
Sample OR = 1.3819; conditional 95% CI ≈ [0.9324, 2.0614]; p = 0.1082.
The evidence is compatible with both little association and a potentially meaningful positive odds ratio; the sample is not precise enough to reject the null.
The final decision should reflect both the exact p-value and interval rather than the point estimate alone.
R Fisher's Exact Test Charts in Paired Rows
The six R charts are displayed in three responsive pairs. Each pair has a dedicated interpretation box so the observed table, hypergeometric distribution, row profiles, odds components, probability summary and result summary remain aligned.
Four counts define the analysis
The observed table contains 98 female/no, 285 female/yes, 53 male/no and 213 male/yes observations. The row and column totals are not decoration: they define the conditional sample space.
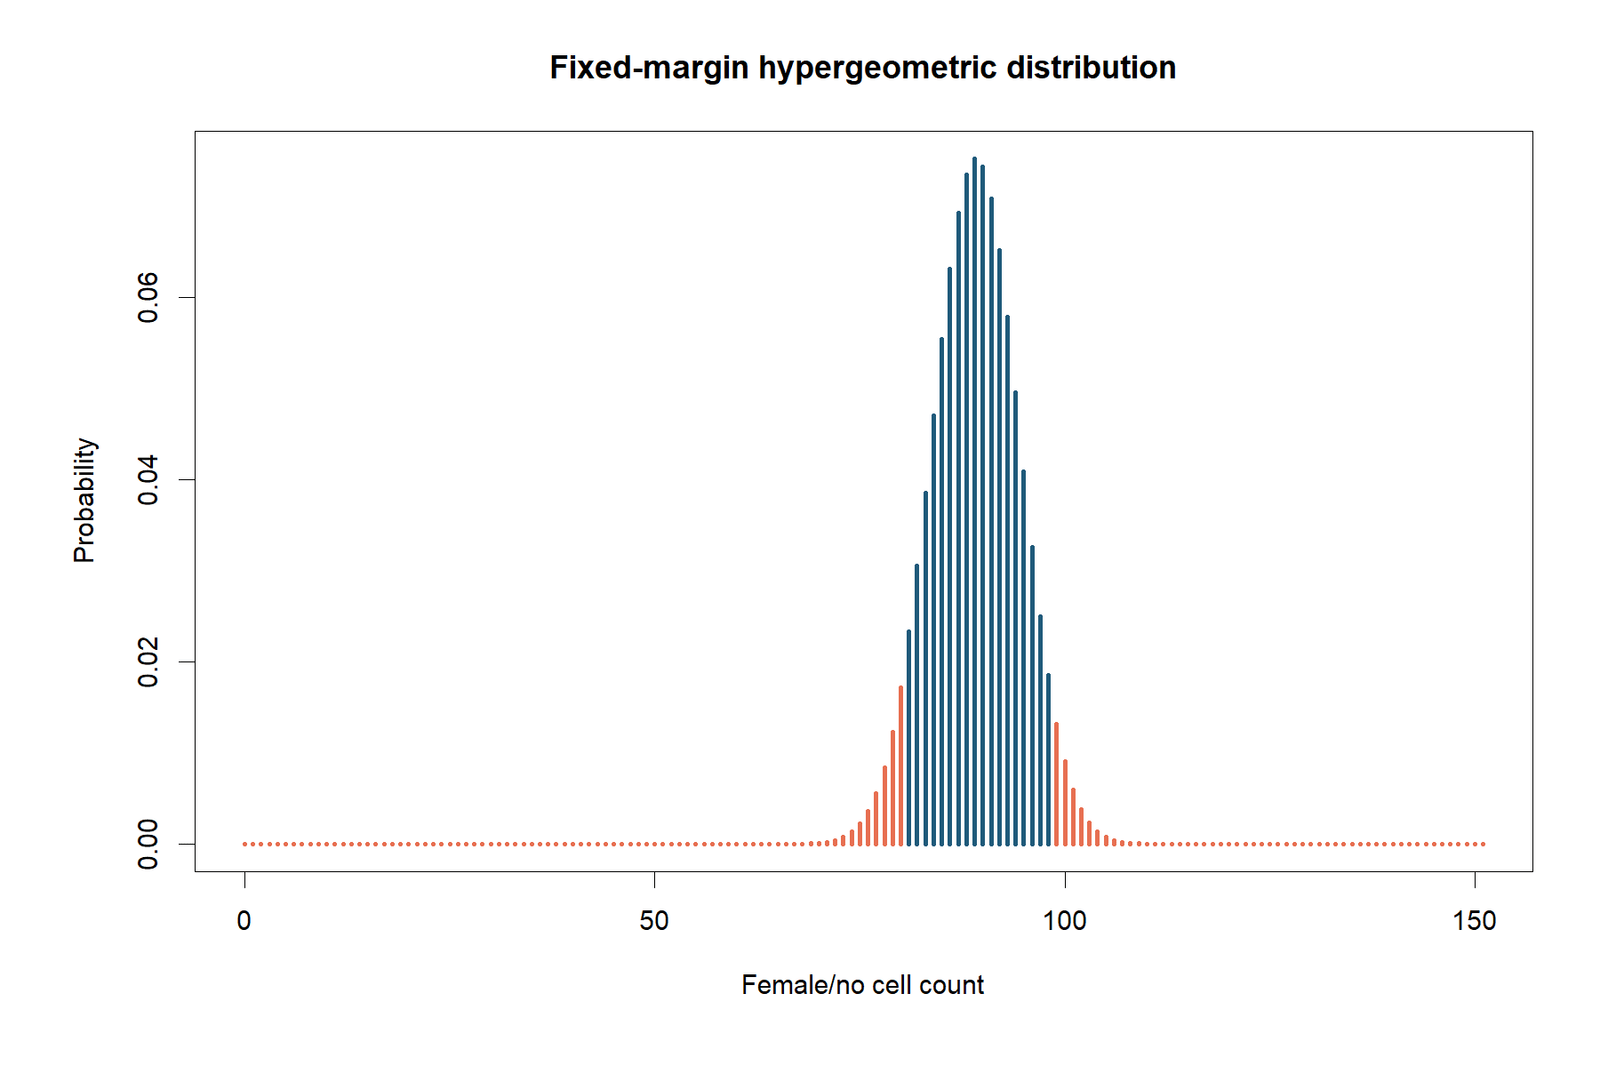
The null is a table distribution
The R null-distribution chart shows the probability of each allowable upper-left count when both margins are fixed. The observed a = 98 is to the right of the null center, but its full probability-ordered tail set totals .1082.
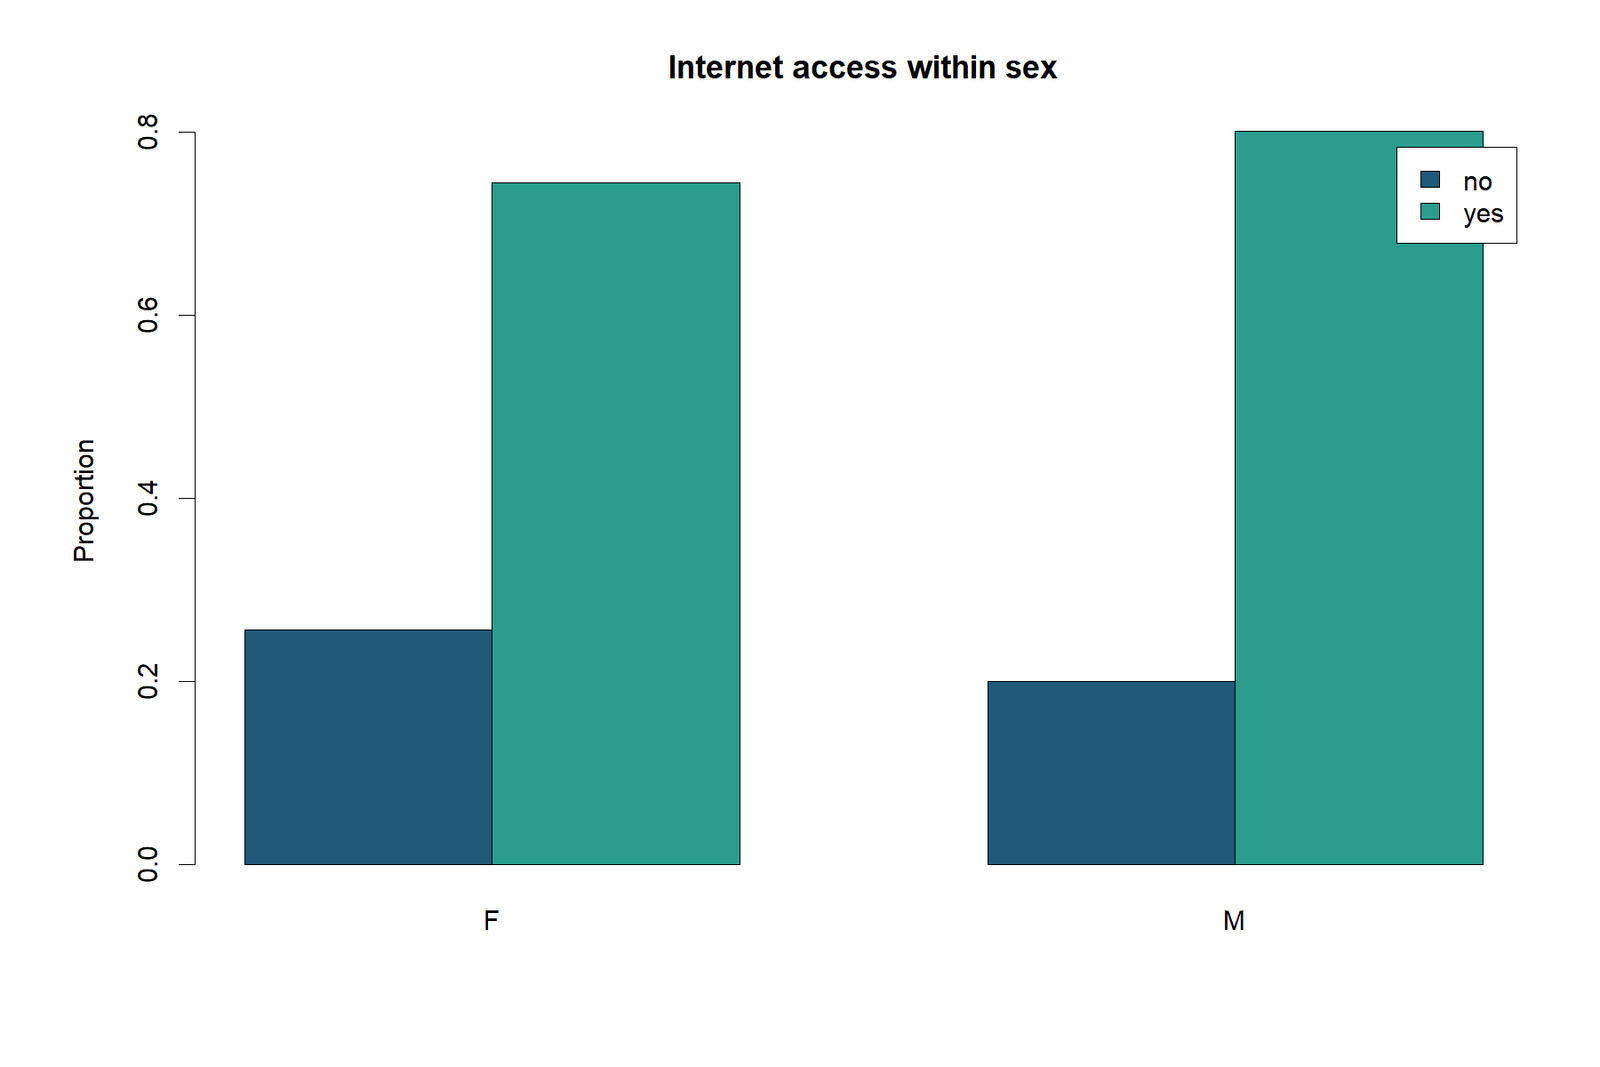
Male internet access is higher
Internet access is 74.41% for female students and 80.08% for male students. The difference is visible, but its uncertainty prevents a two-sided exact rejection at .05.
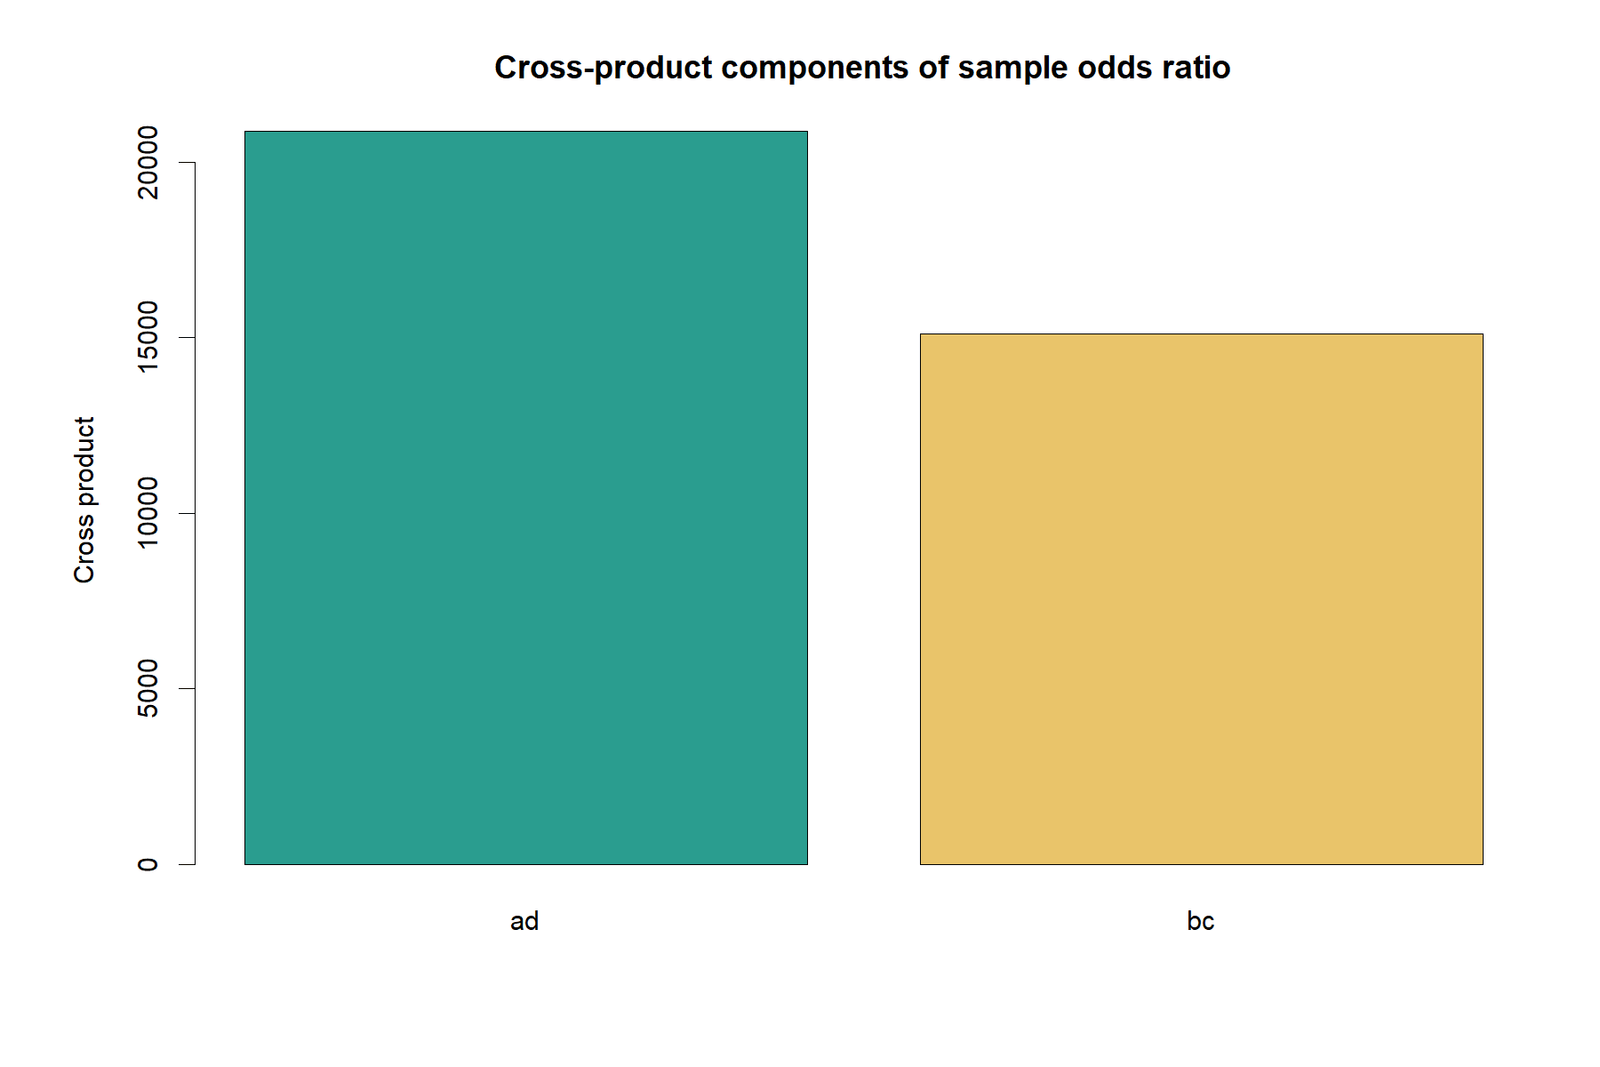
The odds ratio depends on coding
The cross products ad and bc produce an odds ratio of 1.3819 for female-versus-male odds of no internet relative to yes. Reversing a row or column returns the reciprocal.
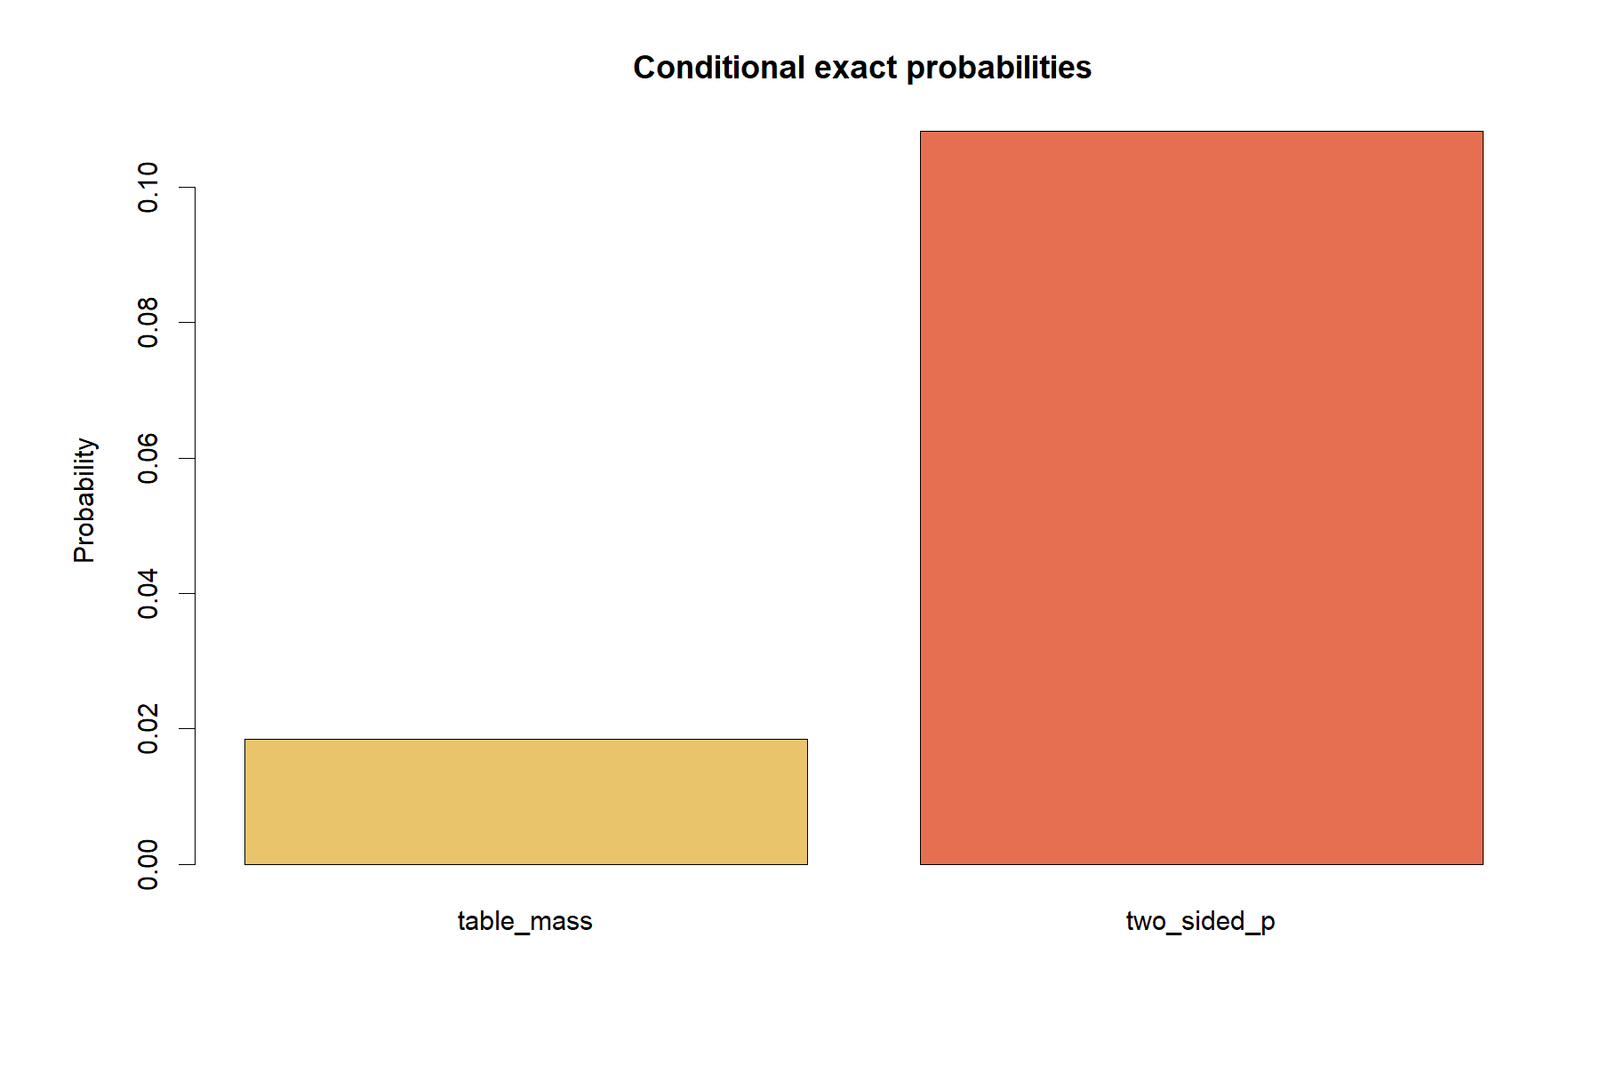
One table probability is not the p-value
The probability summary separates the observed table probability from the selected tail probabilities. Fisher's Exact Test adds probabilities across the rejection region, so .01849 must not be reported as the two-sided result.
The two-sided result is non-significant
The result summary combines OR = 1.38 with p = .108 and an interval that includes one. The sample pattern is directionally suggestive but does not meet the conventional two-sided .05 threshold.
Fisher's Exact Test in Python, R, SPSS, SAS, Stata and Excel
Fisher's Exact Test in Python
Python implementations accept a 2 × 2 integer table and an alternative such as two-sided, less or greater. Always verify whether the printed odds ratio is the sample cross-product ratio and how the two-sided p-value is defined.
- Create the table
[[98,285],[53,213]]. - Run the two-sided exact test.
- Calculate one-sided values only for prespecified hypotheses.
- Obtain conditional or sample odds-ratio intervals separately.
- Reproduce the hypergeometric support for auditability.
Fisher's Exact Test in R
R's fisher.test() returns an exact p-value and, for a 2 × 2 table, a conditional maximum-likelihood odds-ratio estimate with confidence interval. This estimate can differ slightly from the sample cross-product ratio.
- Build the table with explicit row and column names.
- Use
alternative="two.sided"for the primary analysis. - Check the confidence level and interval.
- Do not compare odds ratios across software without checking definitions.
Fisher's Exact Test in SPSS
SPSS CROSSTABS can display observed counts, row percentages, expected counts, chi-square statistics, Fisher's Exact Test and risk estimates. Exact Tests licensing or configuration may affect available output.
- Place sex in rows and internet in columns.
- Request cells, chi-square, exact and risk statistics.
- Read the two-sided exact significance for the primary result.
- Confirm whether the odds ratio is oriented as expected.
Fisher's Exact Test in SAS
SAS PROC FREQ can calculate Fisher's Exact Test for a 2 × 2 table. Weighted data can reproduce the four observed cell counts, and ODS can capture exact-test and risk-estimate tables.
- Enter row-level or frequency-weighted data.
- Use the EXACT FISHER request.
- Request measures of association.
- Preserve the row and column ordering in the report.
Fisher's Exact Test in Stata
Stata can produce Fisher's exact p-value from a two-way table and can display row percentages and association measures. The table orientation should be made explicit before interpreting odds.
- Tabulate the two binary variables.
- Request exact inference.
- Use separate commands for odds-ratio intervals if needed.
- Compare the four counts with the workbook before reporting.
Fisher's Exact Test in Excel
Excel can reproduce the complete fixed-margin distribution with HYPGEOM.DIST, but formulas must be restricted to the feasible support. For this table, the upper-left count runs from 0 through 151; values outside that range are impossible under the fixed margins.
- Calculate feasible a from 0 through 151.
- Compute each hypergeometric PMF.
- Flag probabilities no greater than the observed probability.
- Sum flagged probabilities for the two-sided p-value.
- Use logarithmic combinations for very large tables when needed.
Expandable Code for Fisher's Exact Test
Python code
import numpy as np
from scipy.stats import fisher_exact, hypergeom
from scipy.stats.contingency import odds_ratio

table = np.array([[98, 285],
                  [53, 213]])

result = fisher_exact(table, alternative="two-sided")
conditional_or = odds_ratio(table, kind="conditional")
ci = conditional_or.confidence_interval(confidence_level=0.95)

print(result.statistic)   # 1.3819265144
print(result.pvalue)     # 0.1082362632
print(conditional_or.statistic)
print(ci)

# Reproduce probability-ordered two-sided region
N = table.sum()
row1 = table[0].sum()
col1 = table[:, 0].sum()
a_obs = table[0, 0]
support = np.arange(max(0, row1-(N-col1)), min(row1, col1)+1)
pmf = hypergeom.pmf(support, N, col1, row1)
p_obs = hypergeom.pmf(a_obs, N, col1, row1)
p_two = pmf[pmf <= p_obs + 1e-15].sum()
R code
tab <- matrix(c(98, 285,
                53, 213),
              nrow = 2, byrow = TRUE,
              dimnames = list(
                Sex = c("Female", "Male"),
                Internet = c("No", "Yes")
              ))

fisher.test(tab, alternative = "two.sided", conf.level = 0.95)
fisher.test(tab, alternative = "greater")
prop.table(tab, margin = 1)
SPSS syntax
CROSSTABS
  /TABLES=sex BY internet
  /FORMAT=AVALUE TABLES
  /STATISTICS=CHISQ RISK PHI
  /CELLS=COUNT ROW EXPECTED
  /COUNT ROUND CELL.
SAS code
proc freq data=fishers_table;
  tables sex*internet / chisq measures;
  exact fisher;
  weight count;
run;
Excel formula logic
Observed probability:
=HYPGEOM.DIST(98,383,151,649,FALSE)

For each feasible a in 0:151:
=HYPGEOM.DIST(a,383,151,649,FALSE)

Include in two-sided sum when:
=--(PMF_cell <= observed_probability + 1E-15)

Two-sided p-value:
=SUMPRODUCT(PMF_range,include_flag_range)
Assumptions, Limitations and Advanced Interpretation
Core Assumptions
- Observational units are independent.
- Each observation belongs to exactly one cell.
- Both variables are correctly coded as binary categories.
- The 2 × 2 table represents the intended comparison.
- The fixed-margin conditional model is scientifically defensible.
- The alternative and alpha level are specified before inspecting results.
Important Limitations
- The test does not adjust for confounders or clustering.
- The p-value does not measure effect size.
- Two-sided definitions can differ across implementations.
- Conditioning can be conservative in some two-binomial designs.
- A large sample can still produce a wide conditional odds-ratio interval when the effect is weak.
- Dichotomizing richer variables can discard information.
Independence Is More Important Than Normality
Fisher's Exact Test does not require normality or a minimum expected count. It does require independent observational units. Repeated observations from the same student, students clustered within schools, or matched case-control pairs need methods that recognise dependence. Ignoring dependence can make an exact cell-probability calculation scientifically invalid even when the arithmetic is correct.
Zero Cells and Odds Ratios
Fisher's Exact Test can calculate a p-value when a cell is zero, but the sample cross-product odds ratio may be zero or infinite. Continuity corrections can stabilize descriptive estimates, while conditional methods can still provide exact inference. The chosen correction and interval method must be reported.
Two-Sided Exact P-Values Are Not Unique
“Two-sided” can refer to probability ordering, doubled one-sided probability, central intervals or other definitions. The worked analysis uses probability ordering. This is why the exact rejection region contains a = 0–80 and a = 98–151 rather than a simple mirror around one center.
Power and Sample Size
A non-significant Fisher's Exact Test can reflect a small effect, limited power or both. In the present sample, φ is small and the two-sided p-value is .108. A planning analysis should use expected cell probabilities and the scientific effect size, not the observed p-value alone. See Statistical Power and Confidence Interval.
Association Is Not Causation
Even a significant exact result would establish association, not a causal effect of sex on internet access. Causal interpretation requires a study design and adjustment strategy that address confounding, selection, measurement and temporal order.
APA Reporting for Fisher's Exact Test
Non-Significant Two-Sided Result
Fail to reject
A two-sided Fisher's Exact Test examined the association between sex and internet access.
Internet access was reported by 285 of 383 female students (74.41%) and 213 of 266 male students (80.08%).
The association was not statistically significant, OR = 1.38, 95% CI [0.93, 2.06], p = .108.
The sample did not provide sufficient two-sided evidence that sex and internet access were associated under the fixed-margin conditional model.
Define the odds-ratio orientation in a table note or methods sentence.
Reusable Significant-Result Template
Significant template
A two-sided Fisher's Exact Test evaluated the association between [row variable] and [column variable].
The outcome occurred in [a of n1; %] in group 1 and [c of n2; %] in group 2.
The association was statistically significant, OR = [estimate], 95% CI [lower, upper], p = [exact p].
Interpret the direction in plain language without describing association as causation.
One-Sided Result Template
Directional
A one-sided Fisher's Exact Test was prespecified because the research hypothesis predicted [direction].
The one-sided exact result was p = [value], with an odds ratio of [estimate].
The direction was selected before inspecting the observed table.
Methods-Section Example
Because the analysis involved two independent binary variables in a 2 × 2 table and exact conditional inference was desired, a two-sided Fisher's Exact Test was performed. The test conditioned on the observed row and column margins. The odds ratio was oriented as female versus male odds of no internet relative to internet access.
Common Fisher's Exact Test Mistakes and How to Correct Them
| Mistake | Why It Is Wrong | Correction |
|---|---|---|
| Reporting the observed table probability as the p-value | The p-value sums probabilities across a rejection region. | Report 0.0184866 as the observed-table probability and 0.1082363 as the two-sided exact p-value. |
| Assuming two-sided always means twice one tail | Probability ordering can include a non-symmetric set of tables. | Name the two-sided definition used by the software. |
| Ignoring row and column order | The odds ratio changes to its reciprocal. | State the group and outcome contrasts explicitly. |
| Using Fisher's Exact Test for paired data | The method assumes independent observational units. | Use a matched-pair binary procedure. |
| Calling a non-significant result proof of no relationship | Failure to reject is not acceptance of an exact null. | Report insufficient evidence and the confidence interval. |
| Choosing one-sided after viewing the data | This inflates false-positive risk. | Prespecify direction or retain the two-sided test. |
| Using ordinary Fisher for a larger table | The 2 × 2 formula does not directly cover r × c tables. | Use Fisher–Freeman–Halton or another appropriate larger-table method. |
| Using malformed Excel support | HYPGEOM.DIST returns errors for impossible combinations. | Enumerate only feasible upper-left counts from 0 through 151 for this table. |
Fisher's Exact Test Reports and Worked Excel Download
R PDF ReportR exact-test output, hypergeometric visuals, row profiles and reporting values.
SPSS PDF OutputCrosstabs, exact significance, chi-square comparison and risk estimates.
Worked Excel AnalysisObserved table, conditional distribution logic, diagnostics and verified reference values.
Frequently Asked Questions About Fisher's Exact Test
What is Fisher's Exact Test?
Fisher's Exact Test is a conditional exact test of association for a 2 × 2 contingency table. It calculates probabilities from the hypergeometric distribution after conditioning on the observed row and column margins.
When should Fisher's Exact Test be used?
Use it for two independent binary variables when exact conditional inference is appropriate, especially with small or sparse tables. It can also be used with larger samples, although chi-square may be an adequate approximation when expected counts are comfortably large.
What does Fisher's Exact Test tell you?
It tells you how compatible the observed fixed-margin table is with the null hypothesis of conditional independence. It does not measure practical importance, so counts, percentages and an odds ratio should accompany the p-value.
Is Fisher's Exact Test a chi-square test?
No. Both test association in contingency tables, but Fisher's Exact Test uses exact hypergeometric probabilities, while Pearson chi-square uses an asymptotic chi-square reference distribution.
Does Fisher's Exact Test assume normality?
No. It analyses categorical counts. The important assumptions concern independence of observational units, correct classification and an appropriate fixed-margin design.
What is the p-value in the worked example?
The probability-ordered two-sided exact p-value is 0.1082363. The greater one-sided p-value is 0.0558950, and the less one-sided p-value is 0.9625916.
Why is the table probability not the p-value?
The observed table probability is the probability of one specific table. The p-value sums probabilities across all tables selected as at least as incompatible with the null under the chosen exact rule.
How do I interpret the odds ratio?
With female/male rows and no/yes columns, an odds ratio of 1.3819 means the sample odds of no internet relative to yes are about 38% higher for females. The conditional 95% interval includes one, so this direction is uncertain.
Can Fisher's Exact Test be used for a 2 × 3 table?
Not with the ordinary 2 × 2 formula. Use an r × c exact extension such as Fisher–Freeman–Halton or a suitable asymptotic or Monte Carlo method.
How is Fisher's Exact Test reported in APA style?
Name the two-sided or one-sided procedure, report the compared counts or percentages, state the odds-ratio direction, and give the odds ratio, confidence interval and exact p-value. For this example: OR = 1.38, 95% CI [0.93, 2.06], p = .108.
Fisher's Exact Test Conclusion
Fisher's Exact Test provides an exact conditional way to evaluate association in a 2 × 2 contingency table. It is particularly valuable when sparse counts make asymptotic methods questionable, but it can also serve as a design-matched exact analysis in larger samples. The method fixes both margins, models the free cell through a hypergeometric distribution and constructs a one-sided or two-sided p-value from allowable tables.
In the worked sex-by-internet table, internet access was reported by 74.41% of female students and 80.08% of male students. The sample odds ratio was 1.3819 for female-versus-male odds of no internet relative to yes. Fisher's Exact Test produced p = .1082, and the conditional confidence interval included one. The appropriate conclusion is that the sample does not provide sufficient two-sided evidence of association at α = .05, while the estimated direction and uncertainty should still be reported.
The broader lesson is to choose the test from the data structure and sampling design. Use chi-square independence for a suitable asymptotic table, Barnard's Exact Test or Boschloo Test for suitable unconditional 2 × 2 inference, and the Fisher–Freeman–Halton Test for larger fixed-margin tables.

