
Multivariate Factorial Design, Pillai’s Trace, Follow-up ANOVA and Dependent Variable Correlation
Two Way MANOVA: Formula, Interpretation, SPSS, Python, R and Excel Guide
Two Way MANOVA tests whether two categorical factors affect a combined set of related dependent variables. In this worked Salar Cafe example, the dependent variables are G1, G2 and G3, while the grouping factors are school and studytime. The multivariate result shows significant main effects for both factors, but the school × studytime interaction is not statistically significant.
Quick Answer: Two Way MANOVA Result
The worked Two Way MANOVA tests three multivariate effects. First, it tests whether the combined grade profile G1, G2 and G3 differs by the first factor. Second, it tests whether the same combined grade profile differs by the second factor. Third, it tests whether the two factors interact on the combined outcome profile.
The Python MANOVA summary uses the labels Factor A, Factor B and Factor A × Factor B. Pillai’s Trace p-values show that Factor A is significant, p = 0.0002264, and Factor B is significant, p = 0.0004081. The interaction is not significant, p = 0.9336. The SPSS output labels the design as school_id + studytime + school_id × studytime, and its Pillai’s Trace line also supports significant main effects and a non-significant interaction.
Final interpretation: The combined grade profile of G1, G2 and G3 differs significantly across the two main grouping factors. However, the two-way multivariate interaction is not significant, so the evidence does not show that the factor effects combine to create a different multivariate grade pattern. Follow-up ANOVA results should be used only after reading the main multivariate result.
Important reporting point: Box’s M and Levene tests show assumption pressure in this output, so Pillai’s Trace is the safest primary multivariate decision line. Do not rely only on Wilks’ Lambda or only on separate ANOVAs when the dependent variables are strongly correlated.
Table of Contents
- What Is Two Way MANOVA?
- Two Way MANOVA Formula
- Two Way MANOVA Hypotheses
- Dataset and Variables Used
- Two Way MANOVA Assumptions
- SPSS Output Interpretation
- Python Chart-by-Chart Interpretation
- R Chart-by-Chart Validation
- SPSS, R, Python and Excel Workflows
- Code Blocks for Two Way MANOVA
- APA Reporting Wording
- Common Mistakes
- When to Use Two Way MANOVA
- Downloads and Resources
- Related Guides
- FAQs
What Is Two Way MANOVA?
Two Way MANOVA is a multivariate extension of Factorial ANOVA. It is used when a researcher has more than one related dependent variable and two categorical independent variables. Instead of testing each outcome separately at the start, MANOVA tests whether the combined outcome vector differs across the factors.
In this example, the three dependent variables are G1, G2 and G3. These grade variables are strongly correlated, which makes MANOVA useful. The two grouping factors are school and studytime. The model tests whether the multivariate grade profile differs by school, differs by studytime, and whether school and studytime interact.
The output supports significant multivariate main effects. The cell mean profile and heatmap show that GP school combinations generally have higher grade profiles than MS school combinations, and higher studytime groups generally have higher grade means. The interaction is not significant, so the main message should not be written as a complex school-by-studytime interaction.
Simple definition: Two Way MANOVA checks whether two grouping factors affect several related outcomes at the same time. Here, it checks whether school and studytime affect the combined G1, G2 and G3 grade profile.
This guide connects naturally with One Way MANOVA, Mixed MANOVA, One Way ANOVA, Factorial ANOVA, Fixed Effects ANOVA, ANOVA Effect Size, Eta Squared, Omega Squared and F Distribution.
Two Way MANOVA Formula
A two-factor MANOVA model can be written as a vector model. Instead of one outcome score, the dependent variable is a vector of several related outcomes.
In this formula, Y is the dependent-variable vector. In this guide, Y contains G1, G2 and G3. The term A is the first grouping factor, B is the second grouping factor, AB is the two-way interaction and e is the multivariate residual vector.
Pillai’s Trace Decision
In MANOVA, H represents the hypothesis sums-of-squares-and-cross-products matrix, and E represents the error matrix. Pillai’s Trace measures how much multivariate variation is explained by the effect. It is often preferred when covariance and variance assumptions are under pressure.
Follow-up Partial Eta Squared Formula
After a significant MANOVA effect, follow-up ANOVA can show which dependent variables contribute to the multivariate result. In this example, follow-up plots show meaningful main-effect patterns for G1, G2 and G3, while the interaction effect sizes are very small.
| Multivariate Effect | Pillai’s Trace | F | p | Decision | Plain Meaning |
|---|---|---|---|---|---|
| Factor A | 0.02987 | 6.559 | 0.0002264 | Reject H0 | The combined G1-G2-G3 profile differs by the first grouping factor. |
| Factor B | 0.04664 | 3.374 | 0.0004081 | Reject H0 | The combined grade profile differs by the second grouping factor. |
| Factor A × Factor B | 0.005659 | 0.4038 | 0.9336 | Fail to reject H0 | The combined factor interaction is not supported. |
Two Way MANOVA Hypotheses
Two Way MANOVA has separate multivariate hypotheses for each main effect and for the interaction. Each hypothesis is about the combined dependent-variable vector, not just one outcome.
| Effect | Null Hypothesis | Alternative Hypothesis | Decision in This Output |
|---|---|---|---|
| Factor A / school-side grouping effect | The combined G1, G2 and G3 mean vector is equal across groups. | At least one group has a different combined grade profile. | Reject H0. |
| Factor B / studytime-side grouping effect | The combined G1, G2 and G3 mean vector is equal across groups. | At least one group has a different combined grade profile. | Reject H0. |
| Two-way interaction | The effect of one factor on the combined grade profile does not depend on the other factor. | The effect of one factor depends on the other factor. | Fail to reject H0. |
Decision for this example: Both multivariate main effects are statistically significant. The two-way interaction is not significant. Therefore, the final interpretation should focus on overall school and studytime differences in the combined grade profile, not on a complex interaction.
Dataset and Variables Used
The worked example uses student performance data. The dependent variables are G1, G2 and G3. The grouping factors are school and studytime. The SPSS output reports 649 included cases for the MANOVA tables.
| Variable | Role | Levels / Type | Why It Matters |
|---|---|---|---|
| G1 | Dependent variable 1 | Numeric grade | First grade outcome in the multivariate profile. |
| G2 | Dependent variable 2 | Numeric grade | Second grade outcome and strongly correlated with G3. |
| G3 | Dependent variable 3 | Numeric final grade | Final grade outcome in the multivariate profile. |
| school | Factor | GP, MS | Tests whether the multivariate grade profile differs by school. |
| studytime | Factor | 1, 2, 3, 4 | Tests whether the multivariate grade profile differs by studytime group. |
Important Cell Mean Pattern
| Cell | G1 Mean | G2 Mean | G3 Mean | Interpretation |
|---|---|---|---|---|
| GP | studytime 1 | 11.17 | 11.27 | 11.53 | Lower GP profile. |
| GP | studytime 2 | 12.06 | 12.20 | 12.73 | Moderate GP profile. |
| GP | studytime 3 | 12.70 | 13.11 | 13.56 | Highest visible G3 cell. |
| GP | studytime 4 | 13.11 | 13.04 | 13.41 | High GP profile. |
| MS | studytime 1 | 9.66 | 9.98 | 9.97 | Lowest visible profile. |
| MS | studytime 2 | 10.44 | 10.55 | 10.76 | Low-to-middle MS profile. |
| MS | studytime 3 | 11.65 | 11.92 | 12.31 | Highest MS profile. |
| MS | studytime 4 | 11.62 | 11.25 | 11.88 | Small cell with lower G2 than studytime 3. |
The cell mean pattern explains the MANOVA result. GP cells generally sit above MS cells, and higher studytime groups generally sit above lower studytime groups. The profiles are not identical, but the formal multivariate interaction is not statistically significant.
For supporting concepts, review Descriptive Statistics, Mean Median and Mode, Standard Deviation, Variance, Confidence Interval, P Value, Null and Alternative Hypothesis and Effect Size.
Two Way MANOVA Assumptions
Two Way MANOVA has stronger assumptions than a simple One Way ANOVA. The dependent variables should be numeric and conceptually related. The grouping factors should be categorical. Observations should be independent. The dependent variables should have reasonable multivariate normality, and covariance matrices should be reasonably comparable across groups.
| Assumption | What It Means | How This Example Handles It |
|---|---|---|
| Related dependent variables | Outcomes should measure connected concepts. | G1, G2 and G3 are all grade outcomes and are strongly correlated. |
| Categorical factors | Independent variables should define groups. | school and studytime define the MANOVA cells. |
| Independence | Each student should contribute one independent row. | Each case contributes one G1, G2 and G3 profile. |
| Covariance equality | Group covariance matrices should be reasonably similar. | Box’s M is significant, so Pillai’s Trace is preferred. |
| Homogeneity of variance | Each dependent variable should have comparable cell variances. | Levene tests show assumption pressure, so follow-up ANOVA should be interpreted cautiously. |
| No extreme multivariate outliers | Outlying profiles should not dominate the result. | Use scatterplots, residual checks and Mahalanobis Distance if needed. |
Assumption note: This example is a good teaching case because the dependent variables are strongly correlated, which supports MANOVA, but the covariance and variance diagnostics are not perfect. Therefore, the best reporting approach is to use Pillai’s Trace for the primary decision and discuss follow-up ANOVA results as supporting detail.
For deeper assumption checks, use Levene Test, Box Plot Interpretation, Q-Q Plot Normality Check, P-P Plot Normality Check, Shapiro-Wilk Test, Anderson-Darling Test, Outlier Detection and Studentized Residuals.
SPSS Output Interpretation for Two Way MANOVA
The SPSS output uses GLM Multivariate with G1, G2 and G3 as dependent variables. The factors are school and studytime, and the model includes school, studytime and school × studytime.
SPSS Reading Order
| SPSS Output Area | What to Read | Why It Matters |
|---|---|---|
| Case processing summary | 649 included cases. | Confirms complete cases for G1, G2 and G3. |
| Descriptive statistics | Means by school × studytime cell. | Shows the grade-profile pattern. |
| Box’s M test | Significant result. | Supports using Pillai’s Trace cautiously as the primary line. |
| Multivariate tests | Pillai’s Trace, Wilks’ Lambda, Hotelling’s Trace and Roy’s Root. | Gives the primary MANOVA decisions. |
| Levene tests | G1, G2 and G3 variance checks. | Assumption context for follow-up ANOVA. |
| Tests of between-subject effects | Follow-up ANOVA for G1, G2 and G3. | Shows which outcomes contribute to the multivariate result. |
SPSS Multivariate Test Summary
| Effect | Pillai’s Trace | Approx. F | Hypothesis df | Error df | p | Partial η² | Interpretation |
|---|---|---|---|---|---|---|---|
| school_id | .032 | 6.975 | 3 | 639 | < .001 | .032 | Combined grade profile differs by school. |
| studytime | .064 | 4.693 | 9 | 1923 | < .001 | .021 | Combined grade profile differs by studytime. |
| school_id × studytime | .006 | .404 | 9 | 1923 | .934 | .002 | No significant multivariate interaction. |
SPSS Follow-up ANOVA Summary
| Effect | G1 Decision | G2 Decision | G3 Decision | Interpretation |
|---|---|---|---|---|
| school_id | Significant | Significant | Significant | School differences appear across all three grade outcomes. |
| studytime | Significant | Significant | Significant | Studytime differences appear across all three grade outcomes. |
| school_id × studytime | Not significant | Not significant | Not significant | The interaction is not supported in any follow-up outcome. |
SPSS interpretation summary: Pillai’s Trace shows significant multivariate main effects for school and studytime, but the school × studytime interaction is not significant. Follow-up ANOVA results show the same structure: school and studytime are significant for G1, G2 and G3, while the interaction remains non-significant.
Python Chart-by-Chart Interpretation
The Python chart sequence explains Two Way MANOVA through Pillai p-values, multivariate cell mean profiles, heatmaps, follow-up effect sizes, follow-up p-values, score scatter, dependent-variable correlations and a summary table.
Python Chart 1: Pillai p-values
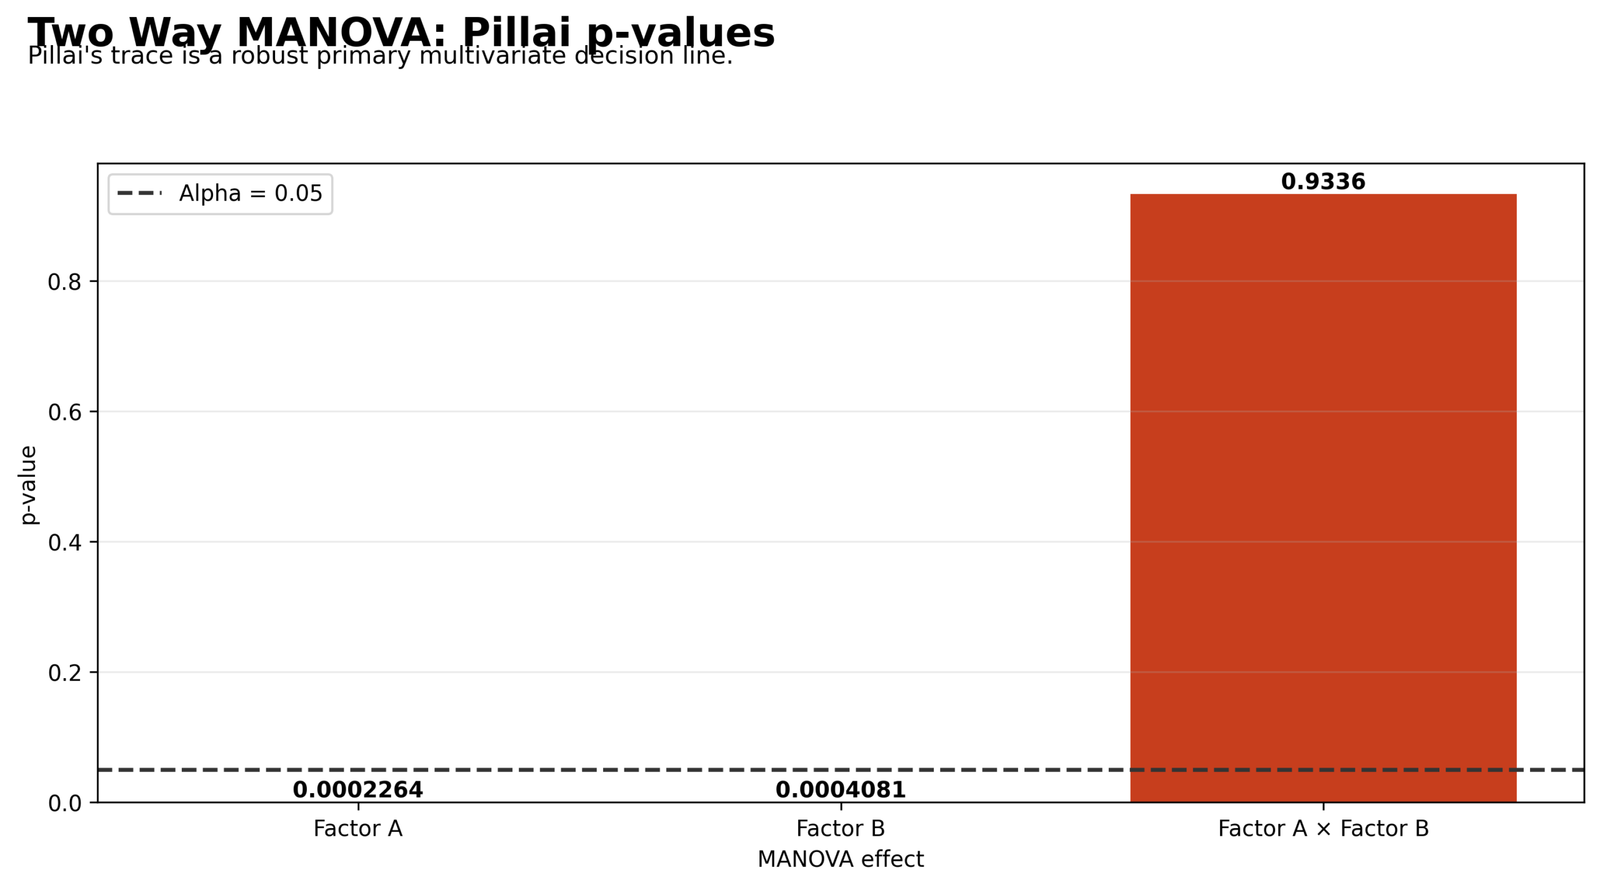
The Pillai p-value chart is the primary decision chart. Factor A and Factor B are both below the alpha = .05 decision line, while the interaction is far above alpha.
This means the model supports significant multivariate main effects, but it does not support a significant two-factor multivariate interaction. The article should therefore explain the main effects first and keep the interaction interpretation conservative.
Python Chart 2: Multivariate Cell Mean Profile
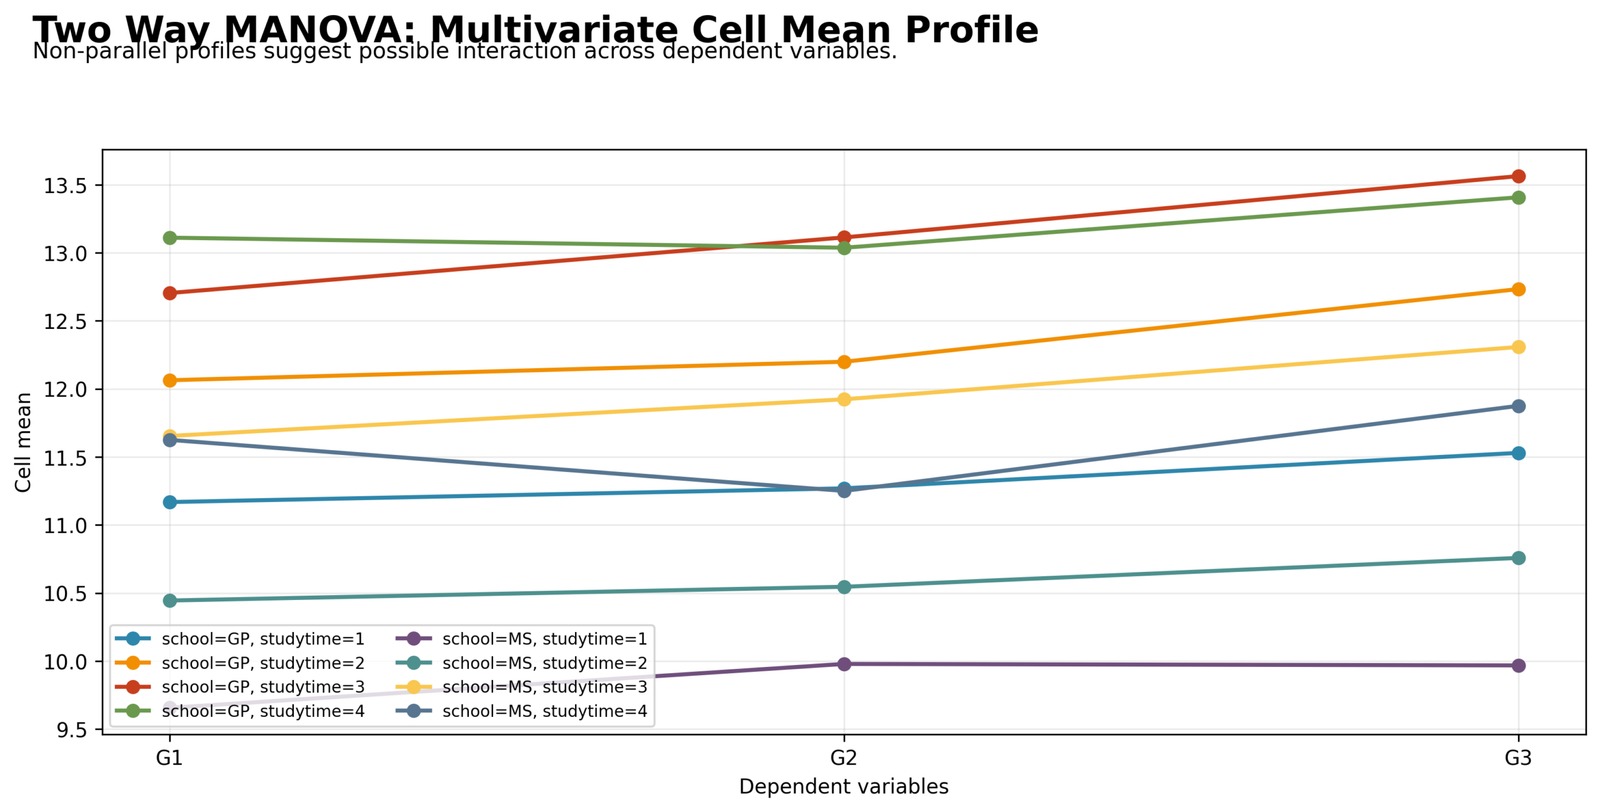
The profile plot shows that GP cells generally sit above MS cells, and higher studytime groups generally have higher grade profiles. G3 is usually higher than G1 and G2 within many cells, showing an upward grade profile.
The profiles are not perfectly parallel, but the formal multivariate interaction is not significant. This is why the profile plot should be treated as descriptive evidence of main-effect patterns rather than proof of an interaction.
Python Chart 3: Cell Mean Heatmap
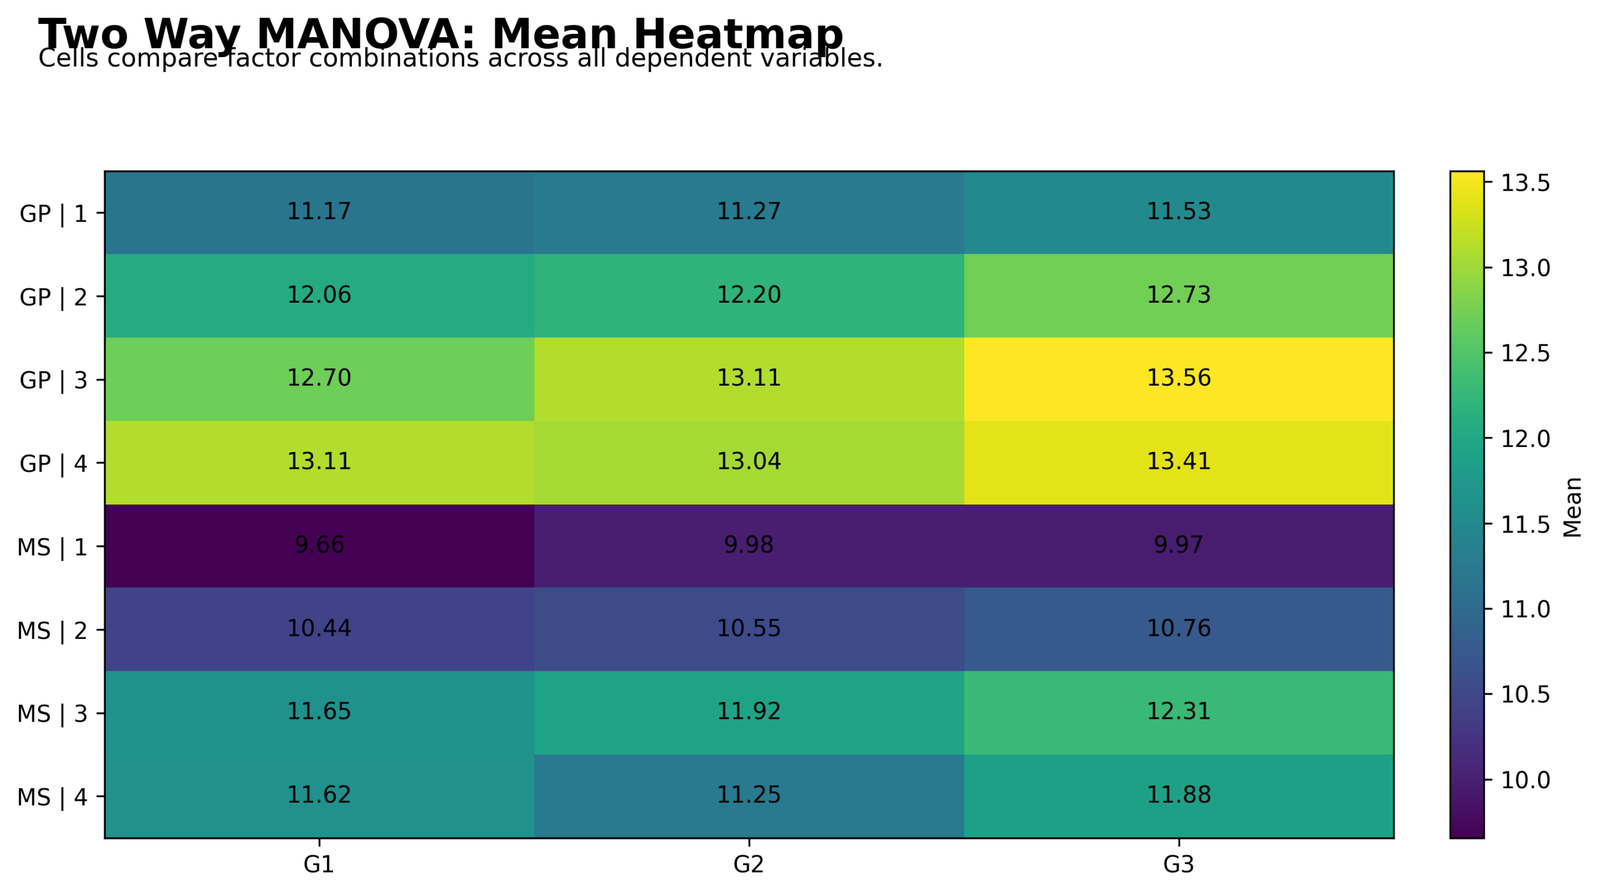
The heatmap makes the cell mean pattern easy to see. GP studytime 3 has the highest visible G3 mean, while MS studytime 1 has the lowest visible grade profile.
This supports the significant main effects. The heatmap also shows that G1, G2 and G3 move together, which supports using MANOVA instead of treating the outcomes as unrelated.
Python Chart 4: Follow-up ANOVA Partial Eta Squared
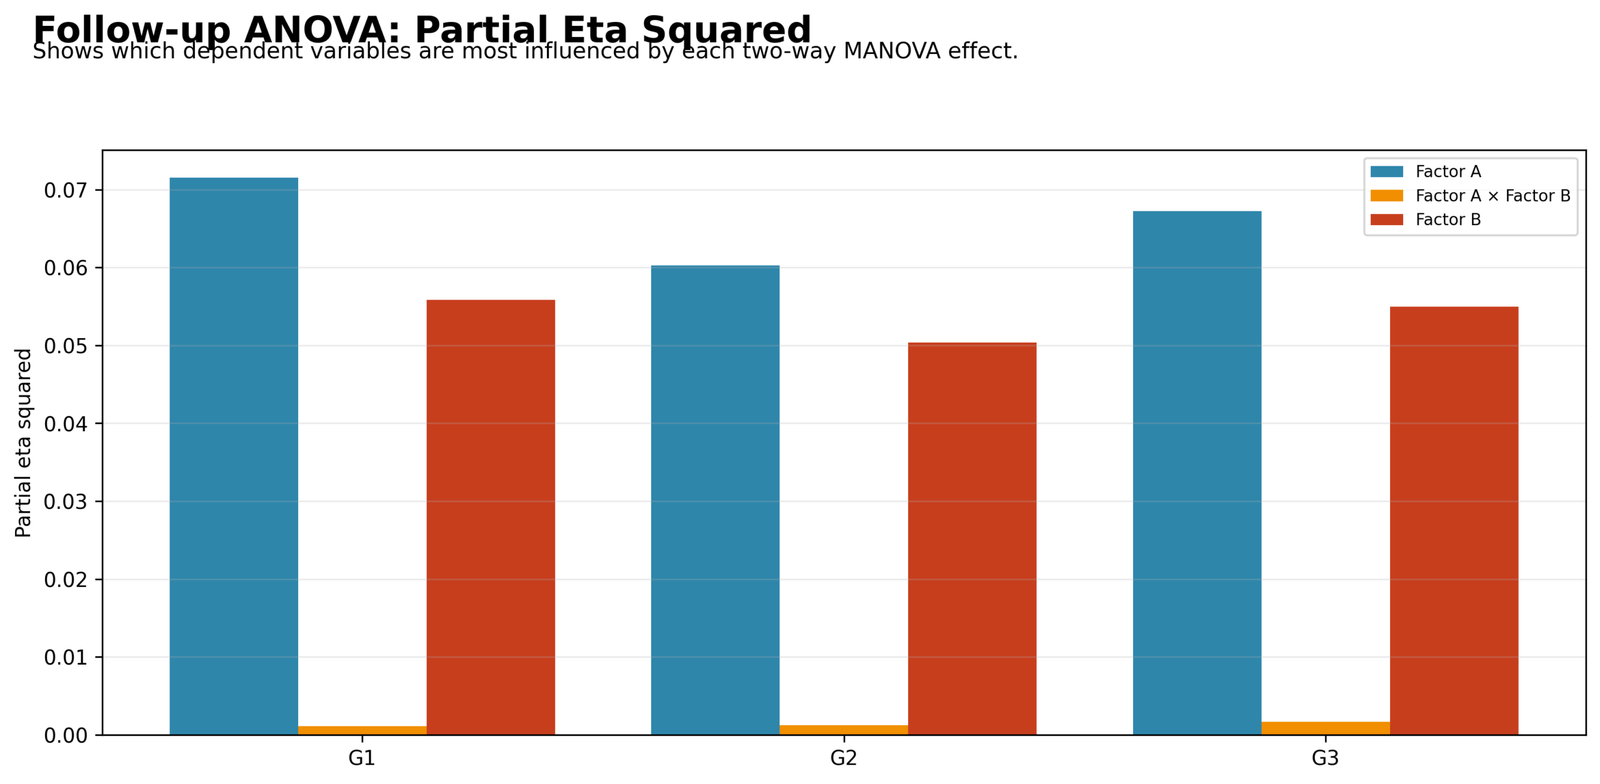
The follow-up effect-size chart shows that the two main effects have visible partial eta squared values across G1, G2 and G3. The interaction bars are very small for every outcome.
This supports the same final interpretation as the MANOVA table. The main effects explain meaningful variation in the grade outcomes, while the interaction has little practical importance.
Python Chart 5: Follow-up ANOVA p-values
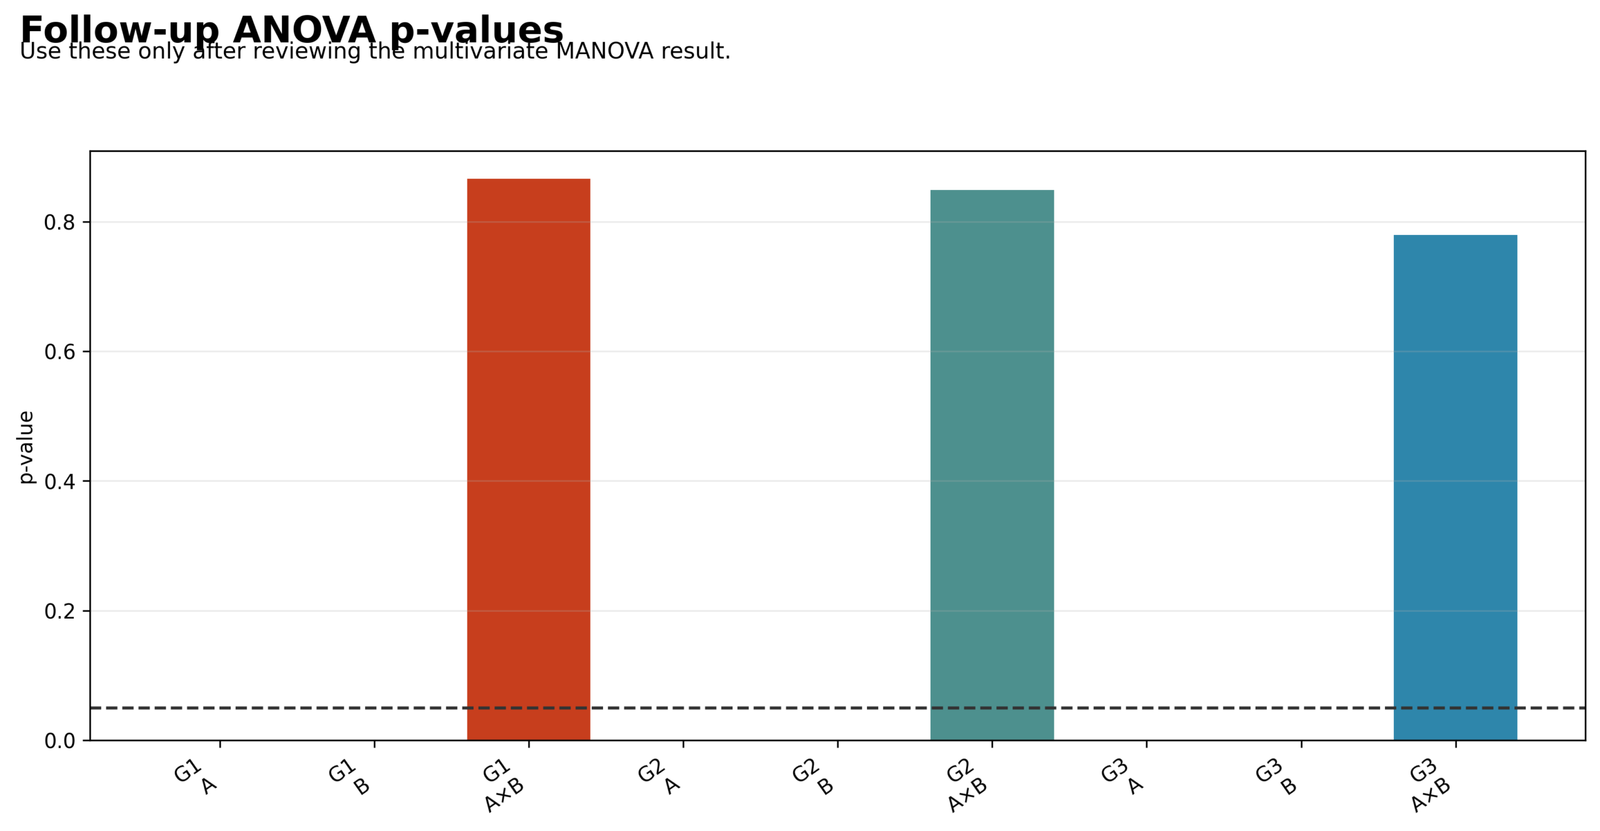
The follow-up p-value chart shows that the main effects are statistically significant across the grade outcomes, while the interaction terms are not significant.
Follow-up ANOVA should not replace MANOVA. It should be used after the multivariate decision to explain which dependent variables carry the significant multivariate pattern.
Python Chart 6: Multivariate Score Scatter
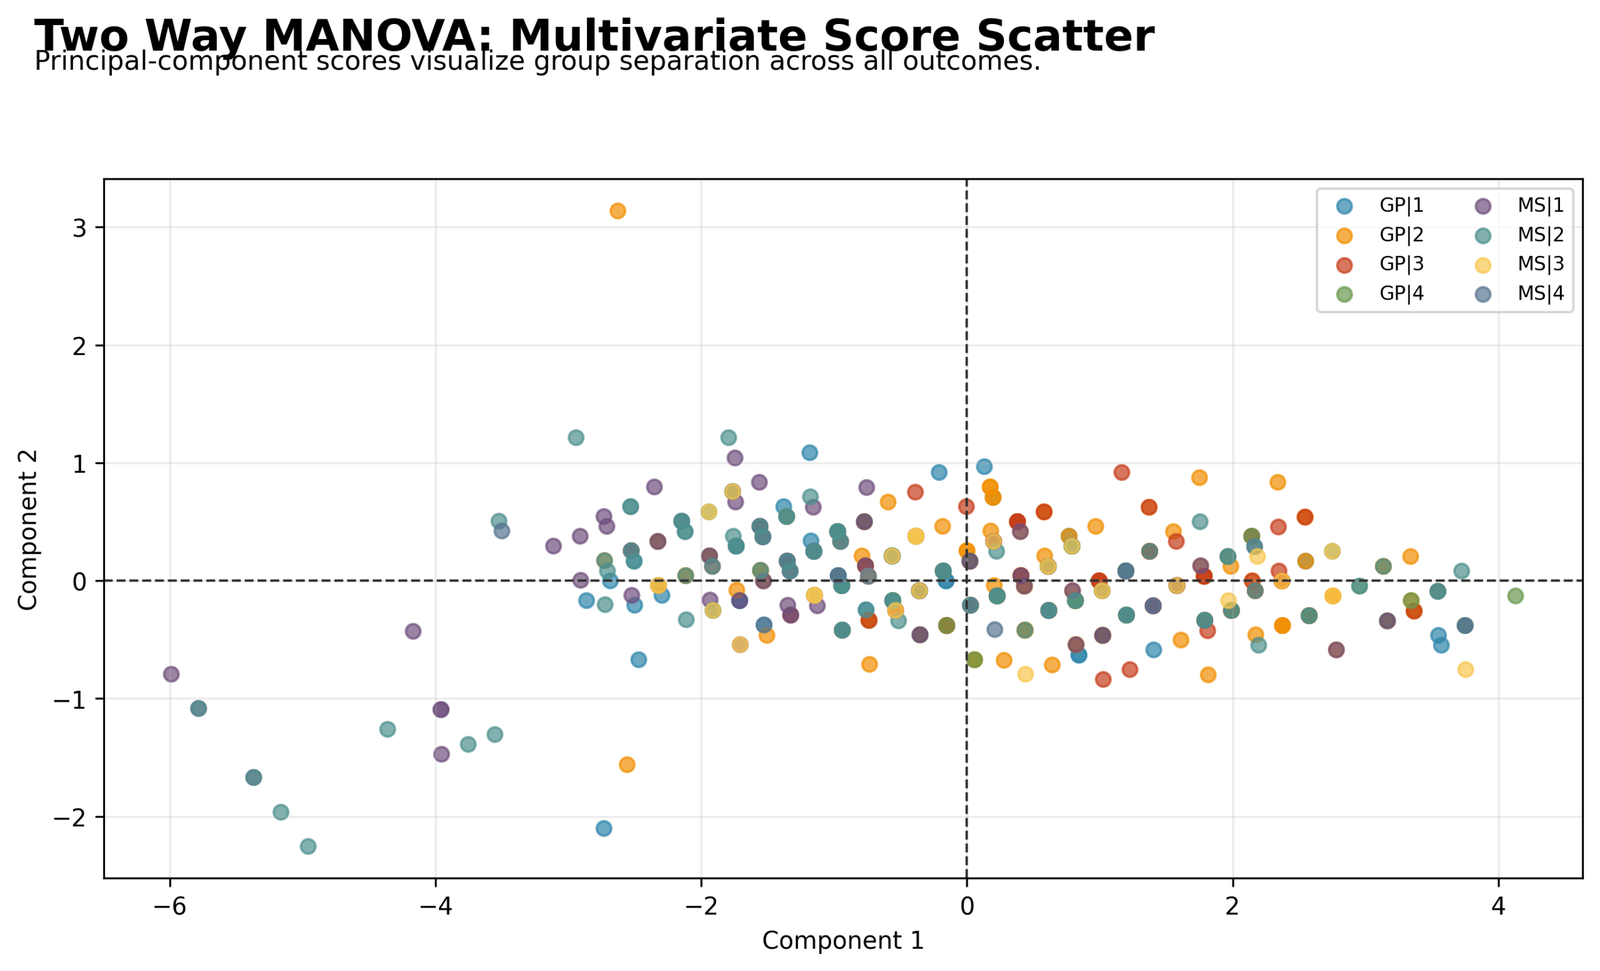
The multivariate scatter plot reduces the three dependent variables into a visual score space. The groups overlap, but there is visible separation among some school and studytime combinations.
This chart is useful for understanding why the main effects are significant while the interaction is not. The groups are not completely separate, but their centers differ enough for the multivariate main effects to be detected.
Python Chart 7: Dependent Variable Correlation
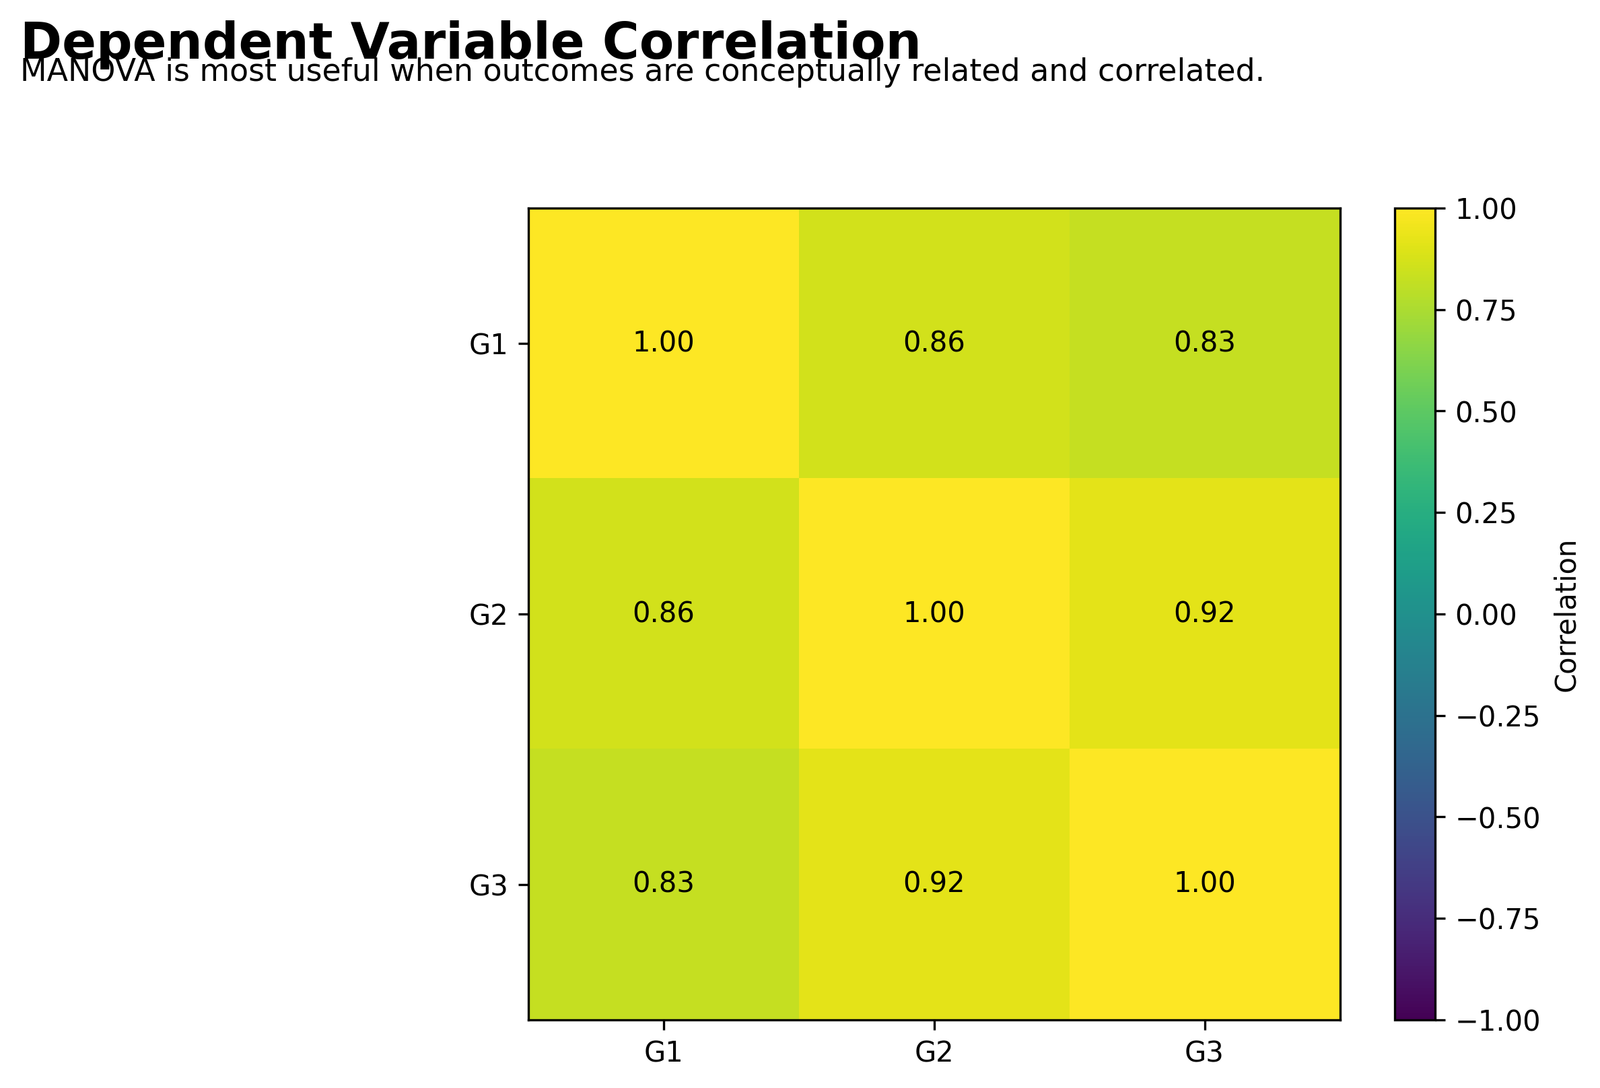
The correlation matrix shows strong positive relationships among the three outcomes. G1 and G2 correlate about 0.86, G2 and G3 correlate about 0.92, and G1 and G3 correlate about 0.83.
This is strong support for MANOVA. When dependent variables are conceptually related and statistically correlated, a multivariate test is more appropriate than immediately running isolated ANOVAs.
Python Chart 8: Two Way MANOVA Summary Table
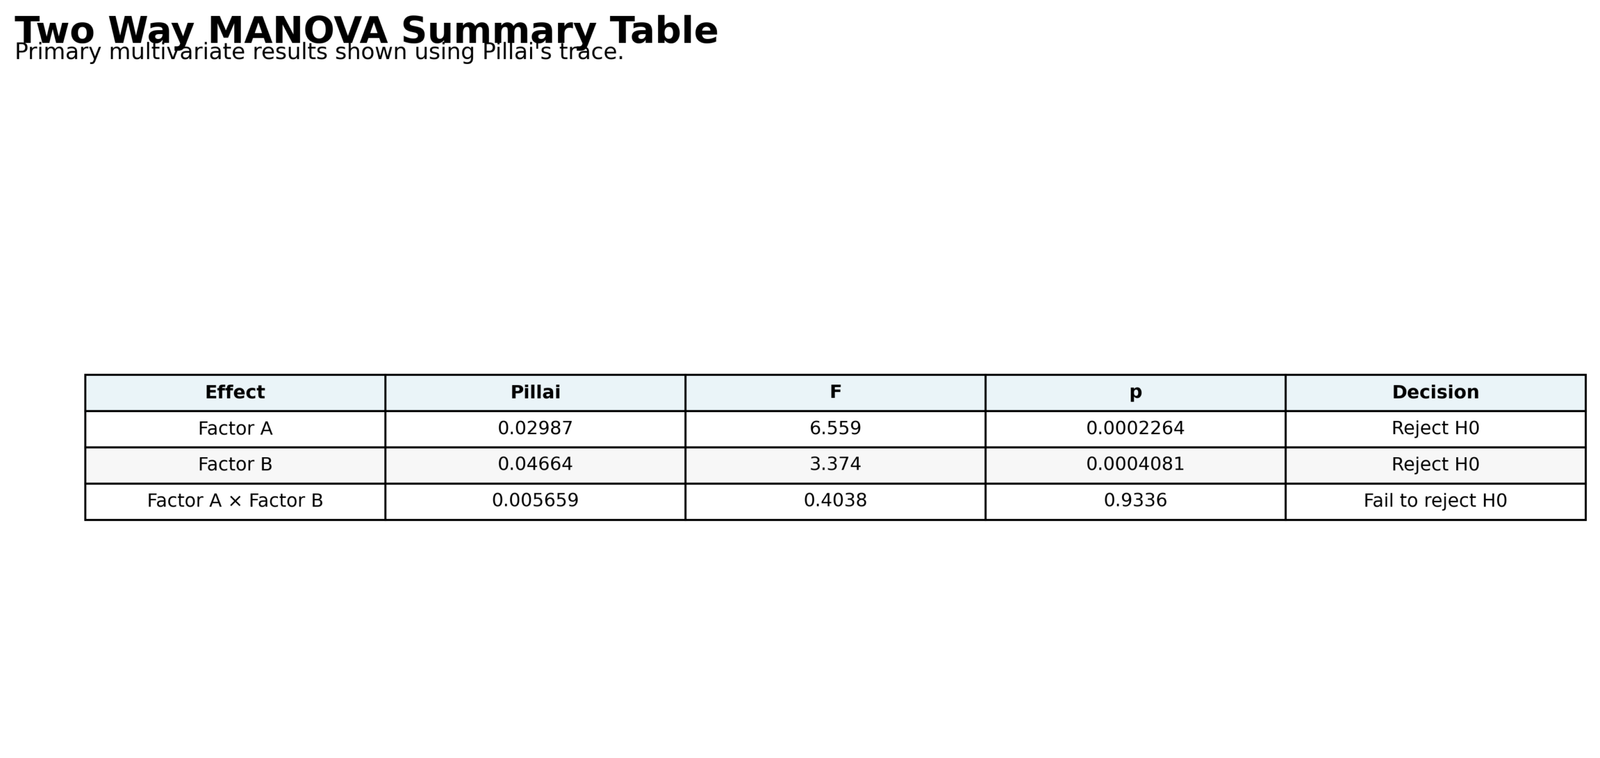
The summary table gives the final Python result in one place. Both main effects are significant, and the interaction is not significant.
This table is the best Python source for final reporting because it includes Pillai’s Trace, F statistics, p-values and decisions for the main MANOVA effects.
R Chart-by-Chart Validation
The R validation charts repeat the same workflow in a second software environment. They confirm the Pillai p-value pattern, multivariate cell mean profile, heatmap structure, follow-up ANOVA pattern, score scatter, dependent-variable correlation and final summary table.
R Chart 1: Pillai p-values
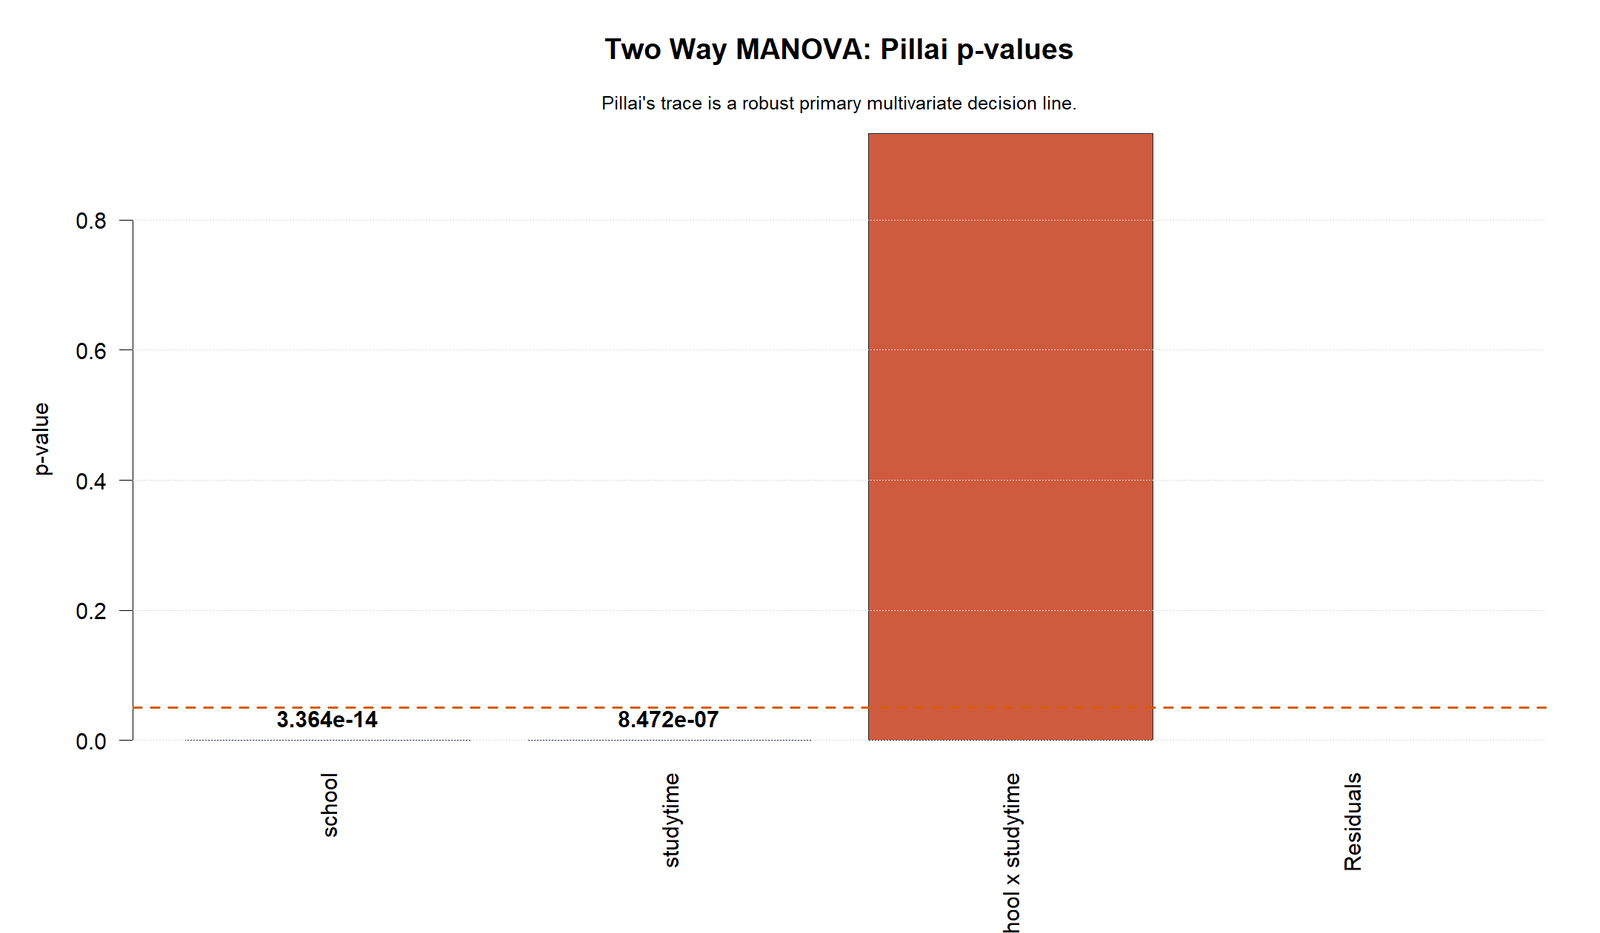
The R Pillai p-value chart confirms that both main effects are statistically significant and the interaction is not significant.
This agreement between Python and R strengthens the final decision and reduces the chance that the interpretation depends on one software environment.
R Chart 2: Multivariate Cell Mean Profile
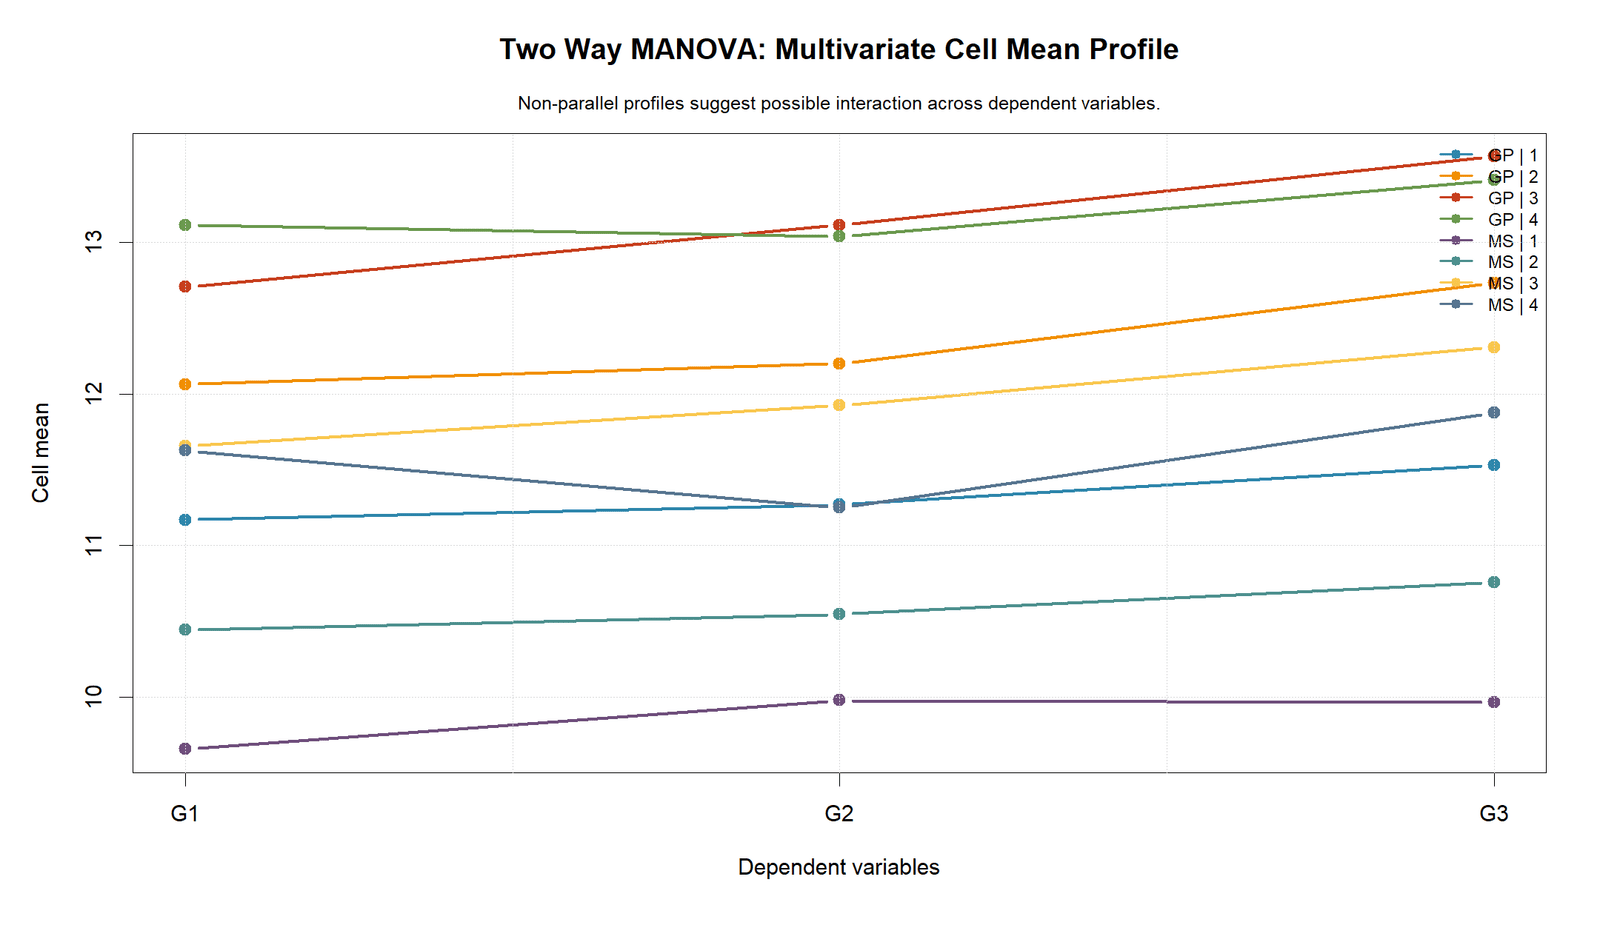
The R profile plot confirms the same main pattern: GP cells generally have higher profiles than MS cells, and higher studytime groups generally have higher scores.
The interaction remains descriptive rather than inferential because the formal multivariate interaction p-value is not significant.
R Chart 3: Cell Mean Heatmap
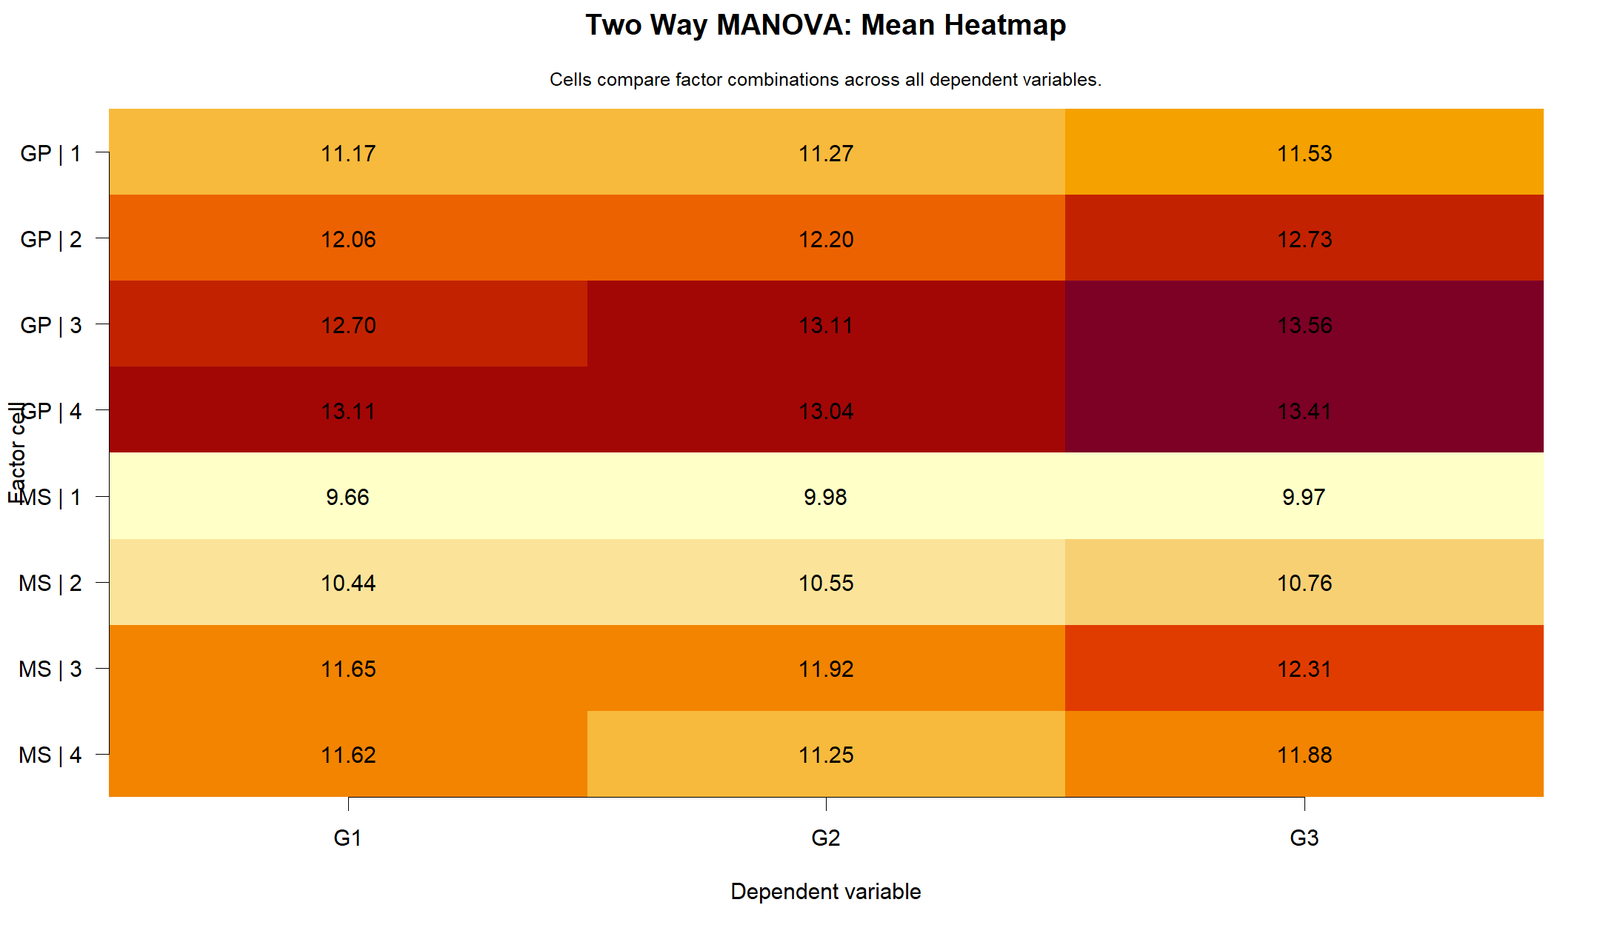
The R heatmap confirms the same visible cell mean structure. Higher GP and higher studytime combinations are generally brighter and higher.
This validates the descriptive pattern behind the significant main effects.
R Chart 4: Follow-up ANOVA Partial Eta Squared
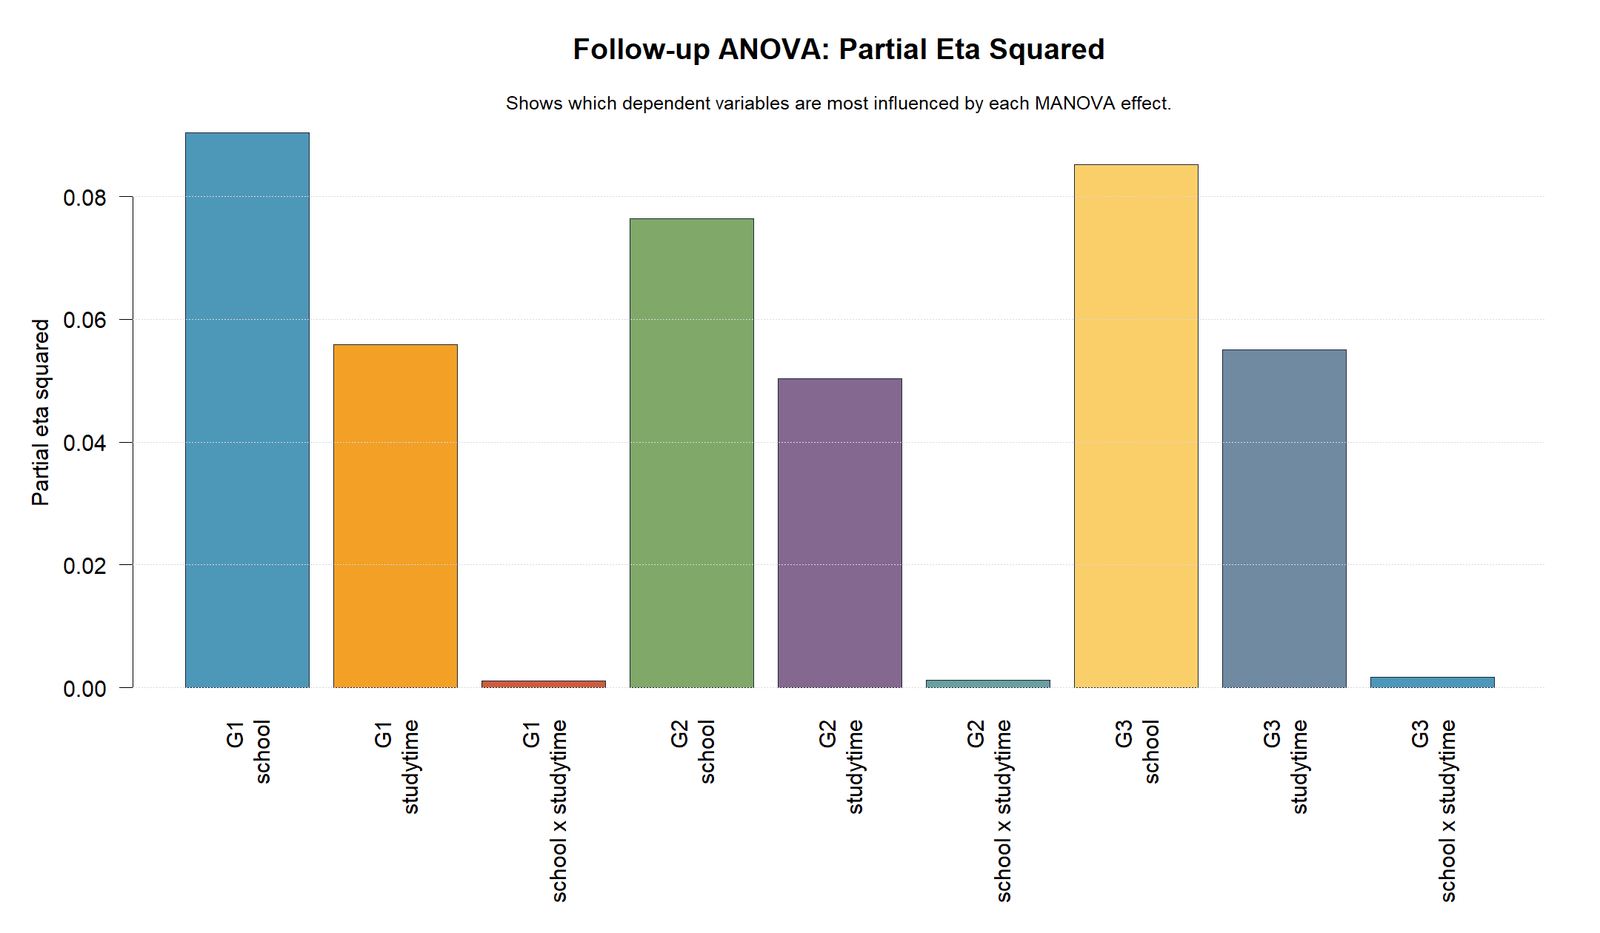
The R effect-size chart confirms that main effects have meaningful follow-up effect sizes across G1, G2 and G3, while interaction effect sizes are very small.
This supports a main-effects report and prevents overstating the interaction.
R Chart 5: Follow-up ANOVA p-values
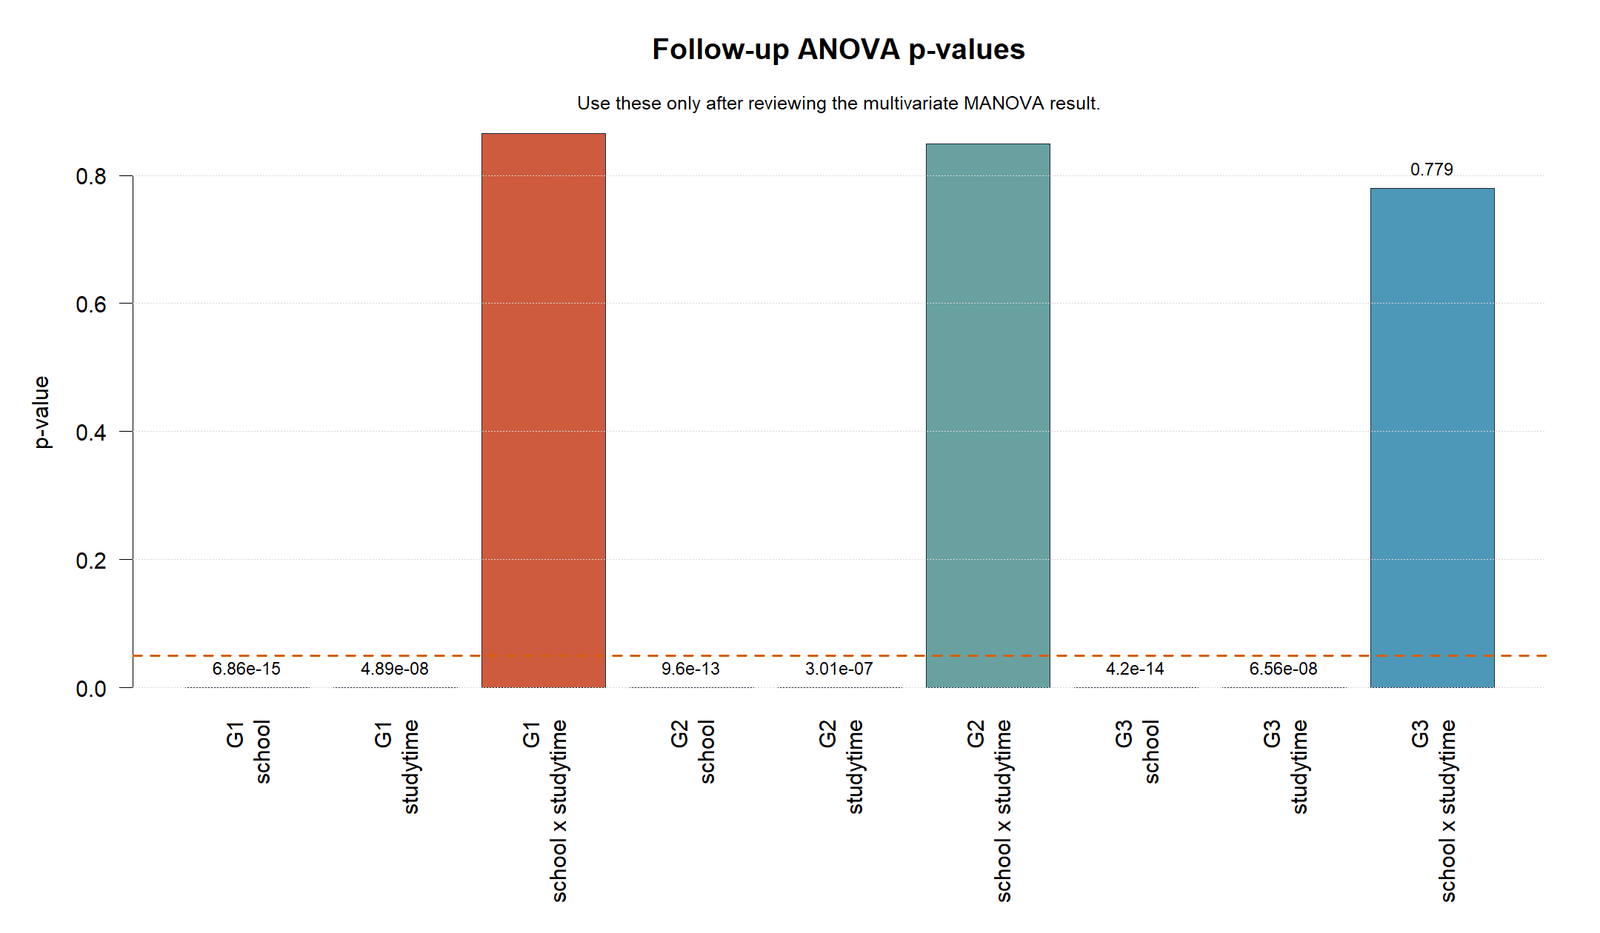
The R p-value chart confirms that follow-up main effects are significant across the dependent variables, while interaction follow-up tests are not significant.
This software validation supports the same reporting decision as Python and SPSS.
R Chart 6: Multivariate Score Scatter
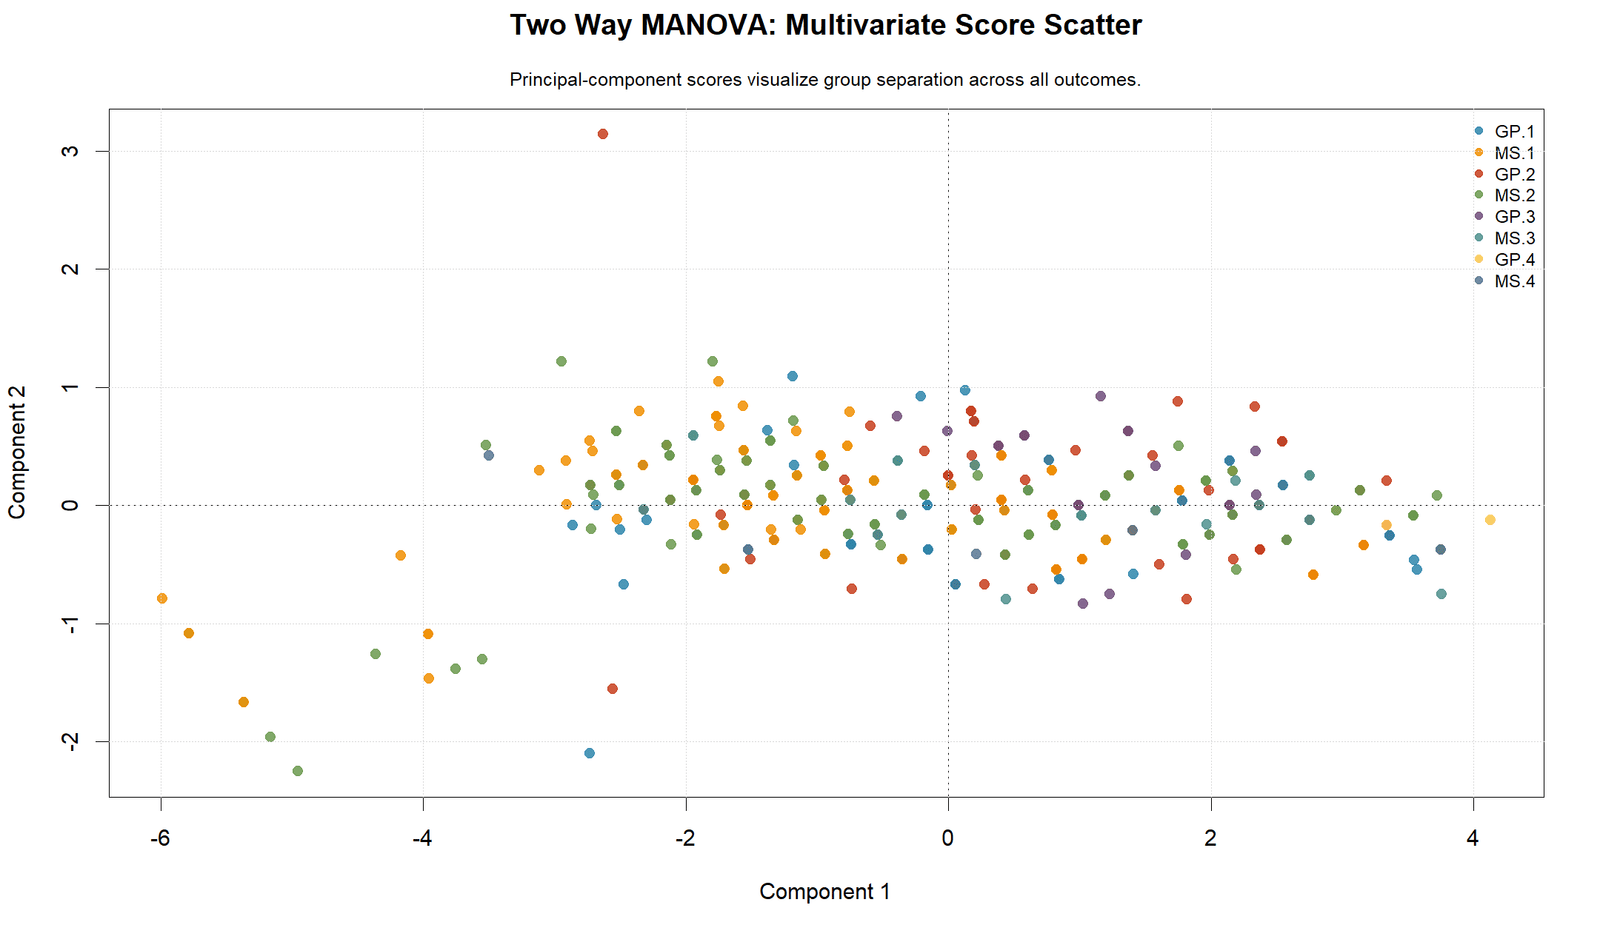
The R scatterplot confirms that the groups overlap but still show some separation in the combined outcome space.
This matches the main-effect conclusion: the groups are not completely distinct, but their multivariate centers differ enough to produce significant main effects.
R Chart 7: Dependent Variable Correlation
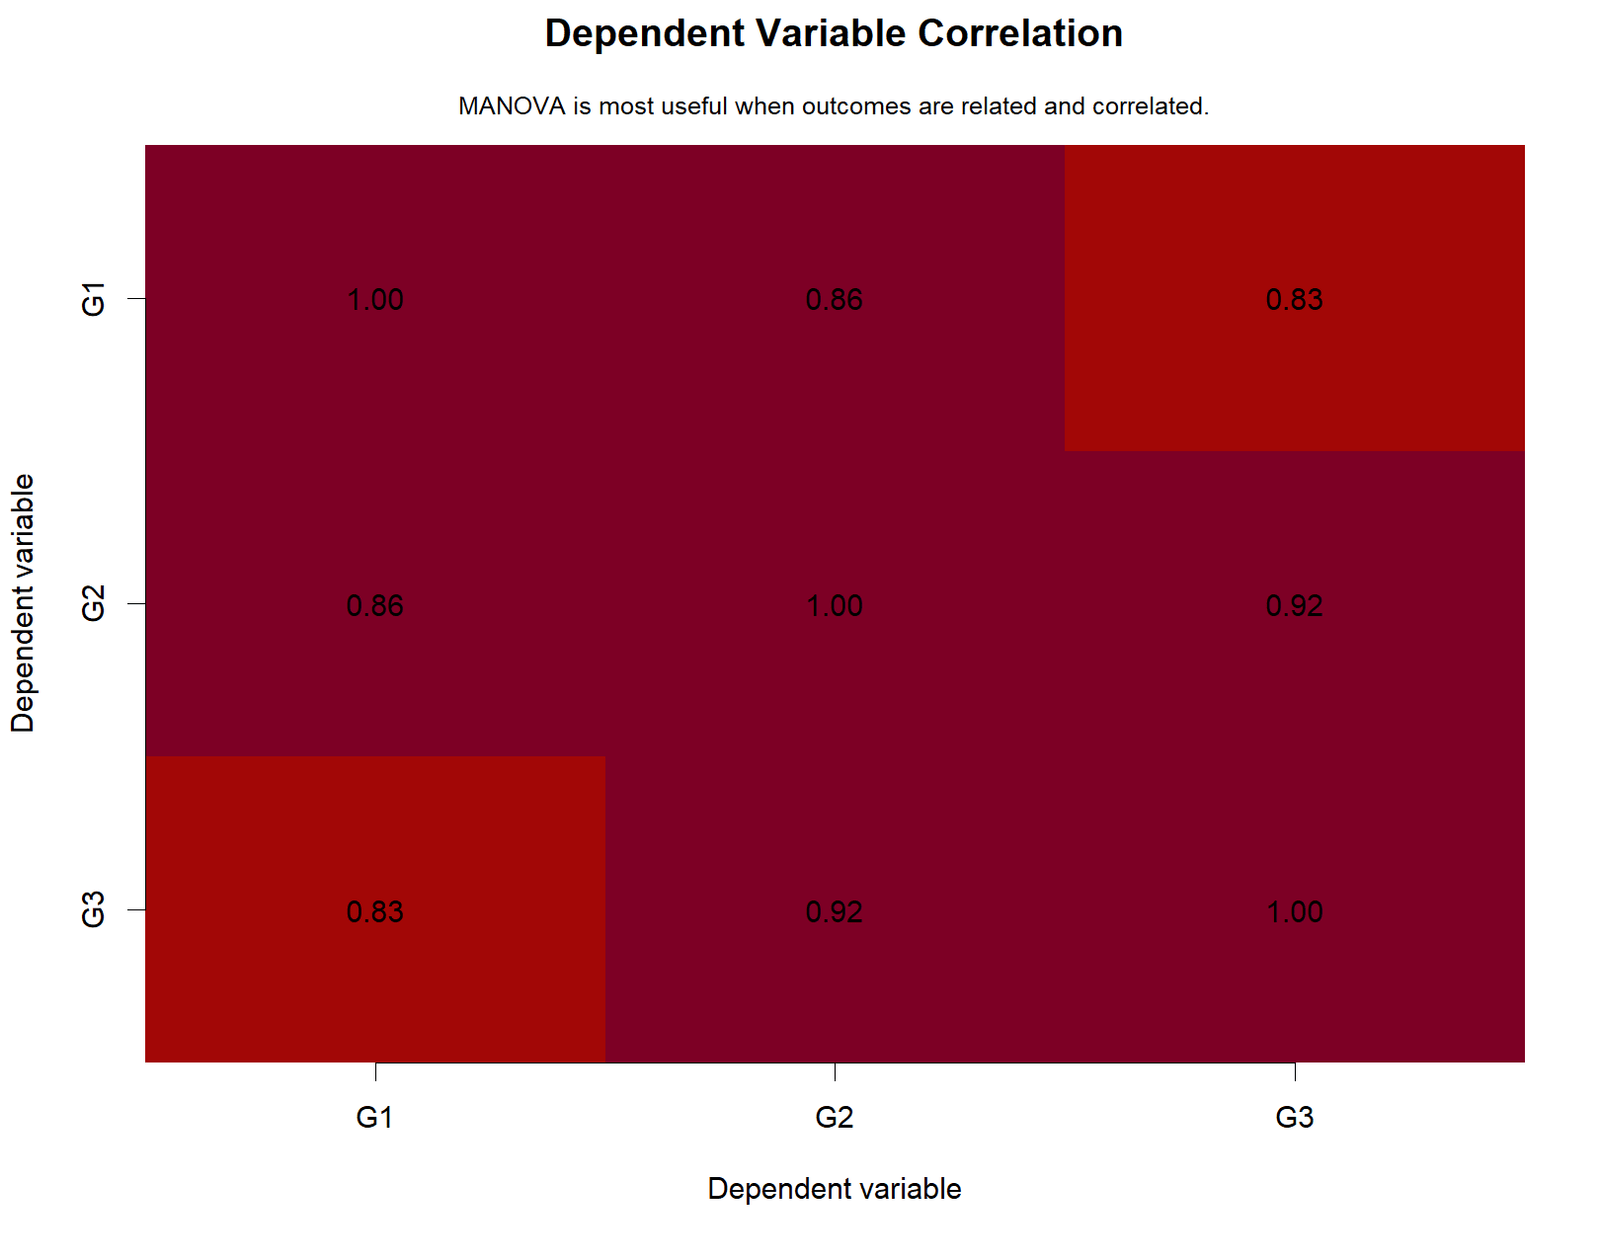
The R correlation matrix confirms that G1, G2 and G3 are strongly related. This is one of the key reasons MANOVA is useful for this example.
If the dependent variables were unrelated, separate ANOVA tests might be more defensible. Here, the strong correlations support a multivariate approach.
R Chart 8: Two Way MANOVA Summary Table
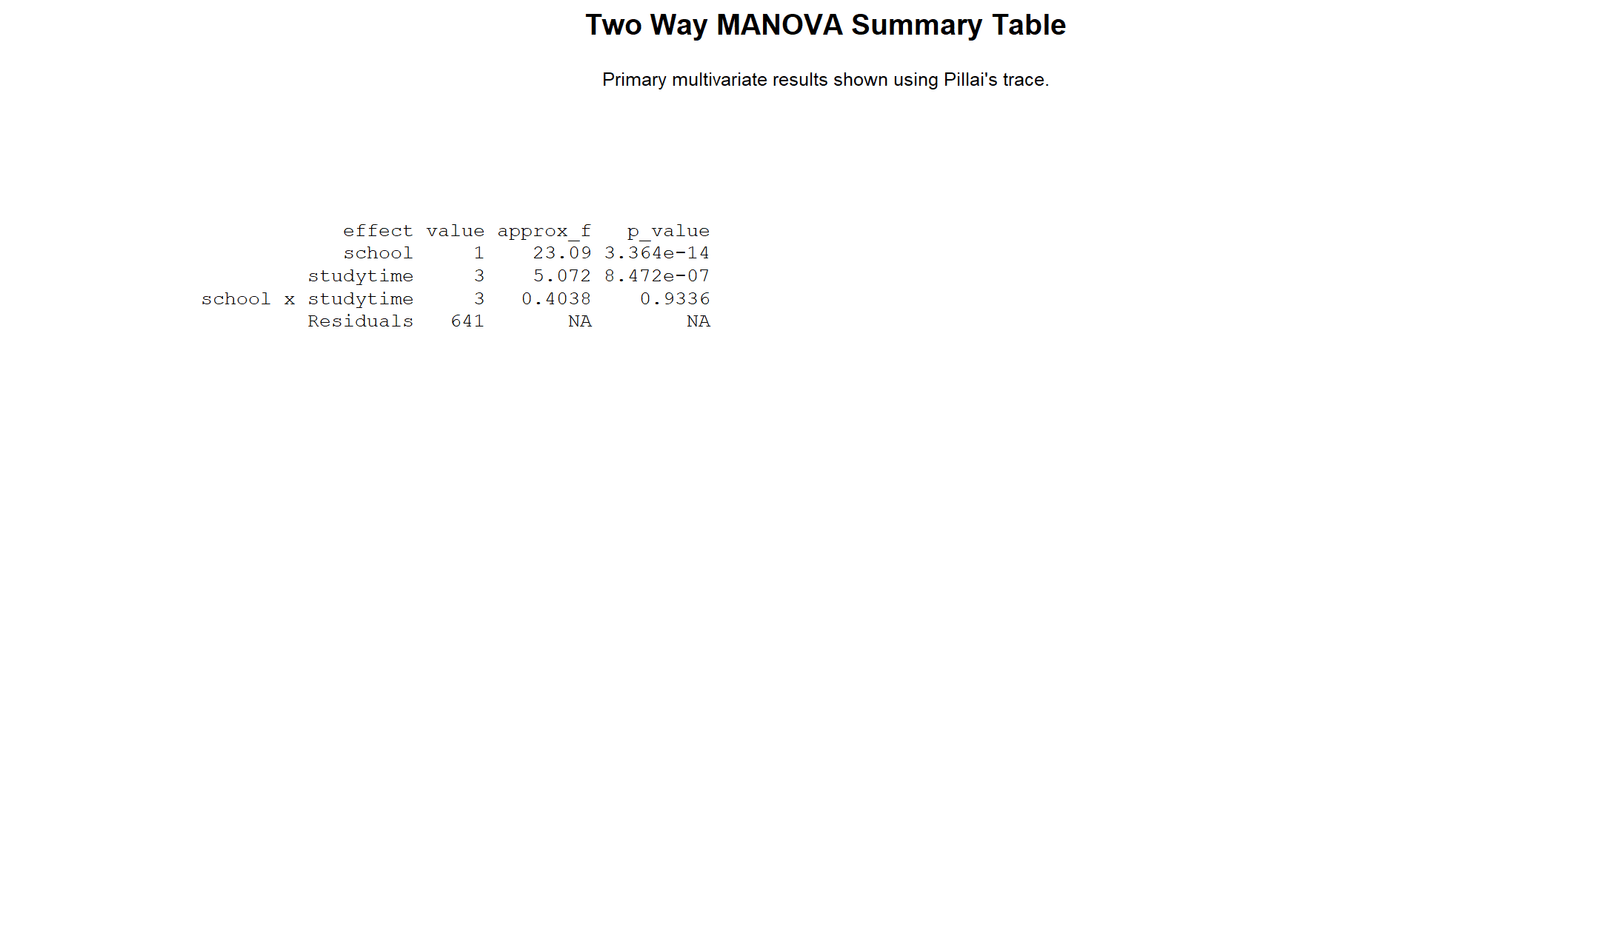
The R summary table confirms the final MANOVA decision. The two main effects are significant, and the interaction is not significant.
This agreement between Python, R and SPSS makes the final interpretation stable for a teaching post and for practical reporting.
SPSS, R, Python and Excel Workflows for Two Way MANOVA
The same Two Way MANOVA workflow can be reproduced in SPSS, R, Python and Excel. SPSS uses GLM Multivariate. R can use manova(). Python can use statsmodels.multivariate.manova.MANOVA. Excel can prepare cell means, profiles and heatmaps, but SPSS, R or Python is recommended for the formal multivariate test.
SPSS Workflow
| Step | SPSS Menu or Syntax | Purpose |
|---|---|---|
| Open dataset | File > Open > Data | Load G1, G2, G3, school and studytime. |
| Open multivariate GLM | Analyze > General Linear Model > Multivariate | Run MANOVA. |
| Set dependent variables | G1, G2 and G3 | Define the outcome vector. |
| Set fixed factors | school and studytime | Define the two grouping factors. |
| Use full factorial model | school + studytime + school × studytime | Test main effects and interaction. |
| Request options | Descriptives, effect sizes, homogeneity tests | Get means, partial eta squared and assumptions. |
| Read Pillai’s Trace | Multivariate Tests table | Primary robust decision line. |
| Export output | OUTPUT EXPORT | Save SPSS output as PDF. |
R Workflow
| Step | R Action | Purpose |
|---|---|---|
| Read data | read.csv("dataset.csv") | Load the data. |
| Convert factors | factor(school), factor(studytime) | Define categorical factors. |
| Fit MANOVA | manova(cbind(G1, G2, G3) ~ school * studytime) | Run Two Way MANOVA. |
| Read Pillai test | summary(model, test = "Pillai") | Get robust multivariate decisions. |
| Follow-up ANOVA | summary.aov(model) | Explain which outcomes contribute. |
| Charts | Profile plots, heatmaps and correlation matrix | Explain the multivariate result visually. |
Python Workflow
| Step | Python Action | Purpose |
|---|---|---|
| Read data | pandas.read_csv() | Load G1, G2, G3, school and studytime. |
| Clean data | Drop missing values in all model variables | Use complete MANOVA cases. |
| Fit MANOVA | MANOVA.from_formula() | Run multivariate model. |
| Read Pillai results | mv_test() | Get Pillai, Wilks, Hotelling and Roy output. |
| Follow-up ANOVA | Separate OLS ANOVA for G1, G2 and G3 | Explain dependent-variable contributions. |
| Charts | Pillai p-values, heatmap, profile, scatter and correlation | Build a complete reporting workflow. |
Excel Workflow
| Excel Task | Formula or Tool | Purpose |
|---|---|---|
| Prepare data | Columns for G1, G2, G3, school and studytime | Organize the multivariate dataset. |
| Create PivotTables | Rows = school and studytime, Values = average G1/G2/G3 | Build cell means. |
| Create profile chart | Line chart of G1, G2 and G3 by cell | Visualize grade profiles. |
| Create heatmap | Conditional formatting on mean table | Show high and low cells. |
| Create correlation table | =CORREL() | Check whether outcomes are related. |
| Formal MANOVA | Use SPSS, R or Python | Excel is not recommended for the official MANOVA test. |
Code Blocks for Two Way MANOVA
SPSS Syntax for Two Way MANOVA
* Two Way MANOVA in SPSS.
* Dependent variables: G1, G2, G3.
* Factors: school and studytime.

TITLE "Two Way MANOVA: G1 G2 G3 by School and Studytime".

GLM G1 G2 G3 BY school studytime
  /METHOD=SSTYPE(3)
  /INTERCEPT=INCLUDE
  /PRINT=DESCRIPTIVE ETASQ HOMOGENEITY
  /PLOT=PROFILE(school*studytime)
  /CRITERIA=ALPHA(.05)
  /DESIGN=school studytime school*studytime.

OUTPUT EXPORT
  /CONTENTS EXPORT=VISIBLE
  /PDF DOCUMENTFILE="two_way_manova_spss_output.pdf".
Python Code for Two Way MANOVA
import pandas as pd
from statsmodels.multivariate.manova import MANOVA
from statsmodels.formula.api import ols
from statsmodels.stats.anova import anova_lm

df = pd.read_csv("dataset.csv")

for col in ["G1", "G2", "G3"]:
    df[col] = pd.to_numeric(df[col], errors="coerce")

df["school"] = df["school"].astype("category")
df["studytime"] = df["studytime"].astype("category")

data = df[["G1", "G2", "G3", "school", "studytime"]].dropna().copy()

# Two Way MANOVA
mv_model = MANOVA.from_formula(
    "G1 + G2 + G3 ~ C(school) * C(studytime)",
    data=data
)

print(mv_model.mv_test())

# Correlation among dependent variables
print(data[["G1", "G2", "G3"]].corr())

# Follow-up ANOVA for each dependent variable
for outcome in ["G1", "G2", "G3"]:
    model = ols(f"{outcome} ~ C(school) * C(studytime)", data=data).fit()
    table = anova_lm(model, typ=2)
    error_ss = table.loc["Residual", "sum_sq"]
    table["partial_eta_sq"] = table["sum_sq"] / (table["sum_sq"] + error_ss)
    print("\nOutcome:", outcome)
    print(table)

# Cell means for profile plots and heatmaps
cell_means = data.groupby(["school", "studytime"])[["G1", "G2", "G3"]].mean()
print(cell_means)
R Code for Two Way MANOVA
# Two Way MANOVA in R

library(tidyverse)

df <- read.csv("dataset.csv")

df$G1 <- as.numeric(df$G1)
df$G2 <- as.numeric(df$G2)
df$G3 <- as.numeric(df$G3)
df$school <- as.factor(df$school)
df$studytime <- as.factor(df$studytime)

data <- df %>%
  select(G1, G2, G3, school, studytime) %>%
  drop_na()

# MANOVA model
model <- manova(cbind(G1, G2, G3) ~ school * studytime, data = data)

# Pillai's Trace is recommended when assumptions are not perfect
summary(model, test = "Pillai")

# Other MANOVA criteria if needed
summary(model, test = "Wilks")
summary(model, test = "Hotelling-Lawley")
summary(model, test = "Roy")

# Follow-up ANOVA
summary.aov(model)

# Dependent variable correlations
cor(data[, c("G1", "G2", "G3")])

# Cell means
data %>%
  group_by(school, studytime) %>%
  summarise(
    n = n(),
    G1_mean = mean(G1),
    G2_mean = mean(G2),
    G3_mean = mean(G3),
    .groups = "drop"
  )
Excel Notes for Two Way MANOVA
Excel support workflow:

1. Arrange the data:
   G1 | G2 | G3 | school | studytime

2. Create a cell mean PivotTable:
   Rows = school and studytime
   Values = average of G1, average of G2, average of G3

3. Create a profile plot:
   X-axis = G1, G2, G3
   Lines = school and studytime cell combinations

4. Create a heatmap:
   Use conditional formatting on the cell mean table.

5. Create dependent-variable correlations:
   =CORREL(G1_range, G2_range)
   =CORREL(G2_range, G3_range)
   =CORREL(G1_range, G3_range)

6. Formal Two Way MANOVA:
   Use SPSS, R or Python for Pillai's Trace, Wilks' Lambda,
   Hotelling's Trace, Roy's Root and follow-up ANOVA.
APA Reporting Wording
When reporting Two Way MANOVA, include the dependent variables, factors, multivariate test statistic, p-values, effect sizes and follow-up ANOVA interpretation. Because Box’s M and Levene diagnostics show assumption pressure, use Pillai’s Trace as the main decision line.
APA-style report: A two-way MANOVA was conducted to examine whether the combined grade profile of G1, G2 and G3 differed by school and studytime. Using Pillai’s Trace, there was a significant multivariate effect of school, Pillai’s Trace = .032, F(3, 639) = 6.975, p < .001, partial η² = .032. There was also a significant multivariate effect of studytime, Pillai’s Trace = .064, F(9, 1923) = 4.693, p < .001, partial η² = .021. The school × studytime interaction was not significant, Pillai’s Trace = .006, F(9, 1923) = .404, p = .934, partial η² = .002. Follow-up ANOVA results showed significant school and studytime effects for G1, G2 and G3, while the interaction remained non-significant for all three outcomes.
Short reporting version: School and studytime had significant multivariate main effects on the combined G1, G2 and G3 grade profile. The school × studytime interaction was not significant, so interpretation should focus on the two main effects.
Common Mistakes
| Mistake | Why It Is Wrong | Correct Practice |
|---|---|---|
| Running separate ANOVAs before MANOVA | G1, G2 and G3 are strongly correlated and should first be tested as a combined outcome profile. | Run MANOVA first, then follow-up ANOVA if the multivariate result supports it. |
| Ignoring Pillai’s Trace | Assumption diagnostics are not perfect in this example. | Use Pillai’s Trace as the primary robust decision line. |
| Overstating the interaction | The interaction p-value is 0.9336 in the Python summary and .934 in SPSS Pillai output. | Report the interaction as non-significant. |
| Reporting only p-values | P-values do not show practical size. | Report partial eta squared and connect it with ANOVA Effect Size. |
| Ignoring dependent-variable correlation | MANOVA is most useful when outcomes are related. | Report the G1-G2, G2-G3 and G1-G3 correlations. |
| Treating MANOVA as ordinary Two Way ANOVA | MANOVA tests a vector of outcomes, not one outcome. | Compare this guide with Factorial ANOVA and One Way MANOVA. |
When to Use Two Way MANOVA
Use Two Way MANOVA when you have two categorical factors and two or more related numeric dependent variables. It is common in education, psychology, social science, medicine, business experiments and survey research where several outcomes belong to one conceptual family.
| Situation | Use Two Way MANOVA? | Reporting Note |
|---|---|---|
| Two factors and several related outcomes | Yes | Use a two-factor MANOVA model. |
| Two factors and one numeric outcome | No | Use Factorial ANOVA or Two Way ANOVA. |
| One factor and several outcomes | No | Use One Way MANOVA. |
| Repeated measurements are involved | Maybe | Compare with Mixed MANOVA. |
| One outcome plus a covariate | No | Use ANCOVA or One Way ANCOVA. |
Two Way MANOVA should be compared with One Way MANOVA, Mixed MANOVA, Factorial ANOVA, One Way ANOVA, Mixed ANOVA, Fixed Effects ANOVA, Nested ANOVA, ANOVA Assumptions, ANOVA in SPSS, ANOVA in R and ANOVA in Python.
Downloads and Resources for Two Way MANOVA
Use these resources to reproduce the Two Way MANOVA workflow. The Python report, R report and SPSS output PDF are included as verification files. Script and workbook placeholders can be replaced after the final downloadable files are uploaded to the WordPress Media Library.
Download Dataset
Practice dataset with G1, G2, G3, school and studytime variables.
Download Two Way MANOVA Python Report PDF
Python report PDF for Pillai p-values, profiles, heatmaps, correlations and follow-up ANOVA.
Download Two Way MANOVA R Report PDF
R validation PDF for MANOVA interpretation.
Download Two Way MANOVA SPSS Output PDF
SPSS GLM multivariate output PDF for reporting and verification.
Download Python Script
Python code for MANOVA, follow-up ANOVA, charts and summary tables.
Download R Script and Excel Workbook
R workflow and Excel support workbook for MANOVA summaries.
FAQs About Two Way MANOVA
What is Two Way MANOVA?
Two Way MANOVA is a multivariate analysis that tests whether two categorical factors affect two or more related numeric dependent variables.
What variables were used in this example?
The dependent variables were G1, G2 and G3. The grouping factors were school and studytime.
Why was MANOVA suitable here?
MANOVA was suitable because G1, G2 and G3 are conceptually related grade outcomes and are strongly correlated.
Which MANOVA statistic should be reported first?
Pillai’s Trace is the safest primary line in this example because Box’s M and variance checks show assumption pressure.
Were the main effects significant?
Yes. The multivariate main effects were significant in the Python and SPSS summaries.
Was the two-way MANOVA interaction significant?
No. The interaction was not significant, with Python Pillai p = 0.9336 and SPSS Pillai p = .934.
Should follow-up ANOVA be used?
Yes, but only after reading the multivariate result. Follow-up ANOVA helps explain which dependent variables contribute to significant MANOVA effects.
Can Two Way MANOVA be done in Excel?
Excel can prepare cell means, correlations, profile plots and heatmaps, but SPSS, R or Python is recommended for the formal MANOVA test.
How is Two Way MANOVA different from Two Way ANOVA?
Two Way ANOVA tests one numeric outcome. Two Way MANOVA tests multiple related numeric outcomes at the same time.
How do I report this Two Way MANOVA in APA style?
A concise report is: School and studytime had significant multivariate main effects on the combined G1, G2 and G3 profile, while the school × studytime interaction was not significant.

