
ANOVA Post Hoc Test, Ranked Means, Critical Ranges and Homogeneous Subsets
Duncan’s Multiple Range Test: Formula, Interpretation, SPSS, Python, R and Excel Guide
Duncan’s Multiple Range Test is an ANOVA post hoc method used to separate group means after a significant omnibus ANOVA. It ranks the group means, compares observed mean differences with Duncan-style critical ranges, and places groups into homogeneous subsets. In this worked Salar Cafe example, G3 final grade is compared across four studytime groups.
Quick Answer: Duncan’s Multiple Range Test Result
The Duncan’s Multiple Range Test result separates the four studytime groups into three homogeneous subsets. Studytime groups 3 and 4 share subset A, meaning they are treated as not significantly different from each other. Studytime group 2 forms subset B. Studytime group 1 forms subset C.
The ranked mean pattern is clear: group 1 has the lowest mean G3 at about 10.84, group 2 is higher at about 12.09, group 4 is about 13.06, and group 3 is the highest at about 13.23. Duncan’s test indicates that group 1 differs from groups 2, 3 and 4; group 2 differs from group 3; group 2 does not clearly differ from group 4; and groups 3 and 4 do not differ from each other.
Final interpretation: Duncan’s Multiple Range Test shows that higher studytime groups have higher G3 final-grade means. The strongest separation is between studytime group 1 and the higher studytime groups. Groups 3 and 4 share the same homogeneous subset, so they should be reported as statistically similar in this output.
Important reporting point: Duncan’s test is more liberal than several other post hoc procedures. It is useful for mean separation, especially in agricultural, educational and experimental designs, but results should be reported carefully and not treated as stronger than the design allows.
Table of Contents
- What Is Duncan’s Multiple Range Test?
- Duncan’s Multiple Range Test Formula
- Duncan Test Hypotheses
- Dataset and Variables Used
- Duncan Pairwise Decision Summary
- Assumptions Before Duncan’s Test
- SPSS Output Interpretation
- Python Chart-by-Chart Interpretation
- R Chart-by-Chart Validation
- SPSS, R, Python and Excel Workflows
- Code Blocks for Duncan’s Test
- APA Reporting Wording
- Common Mistakes
- When to Use Duncan’s Multiple Range Test
- Downloads and Resources
- Related Guides
- FAQs
What Is Duncan’s Multiple Range Test?
Duncan’s Multiple Range Test, often shortened to the Duncan test or DMRT, is a post hoc mean-separation procedure used after ANOVA. It ranks group means from smallest to largest, calculates critical ranges for different mean separations, and decides which groups are statistically different.
Unlike a single omnibus ANOVA test, Duncan’s test tells which means form different groups. It is often displayed with homogeneous subset letters. Groups that share a letter are treated as not significantly different in that output. Groups with different letters are interpreted as significantly separated by the Duncan procedure.
In this example, Duncan’s test is used after comparing G3 final grade across four studytime groups. The test ranks the group means and shows a clear separation: group 1 is lowest, group 2 is middle, and groups 3 and 4 form the top subset.
Simple definition: Duncan’s Multiple Range Test is a post hoc ANOVA method that ranks means and assigns homogeneous subset letters so readers can quickly see which groups are different and which groups are statistically similar.
This guide connects naturally with One Way ANOVA, ANOVA in SPSS, ANOVA in R, ANOVA in Python, ANOVA Assumptions, P Value, Confidence Interval, Effect Size, Eta Squared and Omega Squared.
Duncan’s Multiple Range Test Formula
Duncan’s test starts by ordering the group means. The absolute difference between two ordered means is compared with a Duncan critical range. A pair is treated as significant when the observed mean difference exceeds the critical range for that span.
Here, |X̄i − X̄j| is the observed absolute mean difference, and Rp is the Duncan critical range for the number of ordered means covered by the comparison.
A simplified critical range form is:
When group sizes are unequal, software uses an adjusted standard error or harmonic-style sample-size handling. The exact calculation depends on the implementation, but the interpretation remains the same: if the observed difference is larger than the Duncan critical range, the pair is separated.
Key Terms in the Formula
| Symbol / Term | Meaning | Interpretation |
|---|---|---|
| X̄i, X̄j | Group means | The two group means being compared. |
| MSE | Mean square error from ANOVA | Within-group error variance used for post hoc testing. |
| n | Sample size | Equal or adjusted sample size used in the standard error. |
| rp,df,α | Studentized range value | Critical multiplier based on span, error df and alpha. |
| Rp | Duncan critical range | Minimum difference required for separation. |
| Homogeneous subset | Letter grouping | Groups sharing a letter are treated as not significantly different. |
Practical rule: Read Duncan’s test from both directions. First, inspect the ranked means. Second, read the homogeneous subset letters. A shared letter means the groups are not separated by the Duncan rule in that output.
Duncan Test Hypotheses
Duncan’s Multiple Range Test is applied pair by pair after ANOVA. Each pairwise comparison has a null hypothesis that the two group means are equal and an alternative hypothesis that the two group means are different.
| Comparison | Null Hypothesis | Alternative Hypothesis | Duncan Decision |
|---|---|---|---|
| 1 vs 2 | μ1 = μ2 | μ1 ≠ μ2 | Significant. |
| 1 vs 3 | μ1 = μ3 | μ1 ≠ μ3 | Significant. |
| 1 vs 4 | μ1 = μ4 | μ1 ≠ μ4 | Significant. |
| 2 vs 3 | μ2 = μ3 | μ2 ≠ μ3 | Significant. |
| 2 vs 4 | μ2 = μ4 | μ2 ≠ μ4 | Not significant. |
| 3 vs 4 | μ3 = μ4 | μ3 ≠ μ4 | Not significant. |
Decision for this example: Duncan’s test separates group 1 from all higher studytime groups, separates group 2 from group 3, and treats groups 3 and 4 as the same top homogeneous subset.
Dataset and Variables Used
The worked example uses student performance data. The dependent variable is G3 final grade. The grouping factor is studytime, which has four groups. Duncan’s Multiple Range Test is used as the post hoc mean-separation method after the ANOVA workflow.
| Variable | Role | Levels / Type | Why It Matters |
|---|---|---|---|
| G3 | Dependent variable | Numeric final grade | The outcome whose mean is compared across studytime groups. |
| studytime | Grouping factor | 1, 2, 3, 4 | Defines the four groups ranked by Duncan’s test. |
Group Mean Pattern
| Studytime Group | Mean G3 | Duncan Subset | Interpretation |
|---|---|---|---|
| 3 | 13.23 | A | Highest mean; same top subset as group 4. |
| 4 | 13.06 | A | High mean; not significantly different from group 3. |
| 2 | 12.09 | B | Middle group; separated from group 1 and group 3. |
| 1 | 10.84 | C | Lowest mean; separated from all higher studytime groups. |
The group mean pattern shows why Duncan’s test forms three subsets. Group 1 is clearly lower. Group 2 is higher than group 1 but lower than group 3. Groups 3 and 4 are close together at the top and share the same letter.
For supporting concepts, review Descriptive Statistics, Mean Median and Mode, Standard Deviation, Variance, Standard Error, Confidence Interval, Five Number Summary, Box Plot Interpretation and Histogram Interpretation.
Duncan Pairwise Decision Summary
The pairwise mean-difference heatmap and the difference-versus-critical-range chart show the same decision pattern. A pair is significant when the observed mean difference is larger than the Duncan critical range. In this output, four comparisons are separated and two comparisons are not separated.
| Pair | Observed Mean Difference | Duncan Critical Range | Decision | Interpretation |
|---|---|---|---|---|
| 1 vs 3 | About 2.38 | About 0.82 | Significant | Group 3 is higher than group 1. |
| 1 vs 4 | About 2.21 | About 1.18 | Significant | Group 4 is higher than group 1. |
| 1 vs 2 | About 1.25 | About 0.55 | Significant | Group 2 is higher than group 1. |
| 2 vs 3 | About 1.14 | About 0.76 | Significant | Group 3 is higher than group 2. |
| 2 vs 4 | About 0.97 | About 1.10 | Not significant | Group 4 is not clearly separated from group 2 in this output. |
| 4 vs 3 | About 0.17 | About 1.21 | Not significant | Groups 3 and 4 are statistically similar. |
Best reporting summary: Duncan’s Multiple Range Test produced three homogeneous subsets: group 1 as the lowest subset, group 2 as the middle subset, and groups 3 and 4 as the top subset.
Assumptions Before Duncan’s Multiple Range Test
Duncan’s Multiple Range Test is usually applied after an ANOVA model. That means the main ANOVA assumptions still matter. The outcome should be numeric, observations should be independent, the factor should define meaningful groups, and the ANOVA error term should be appropriate for post hoc comparison.
| Assumption | Meaning | How This Example Handles It |
|---|---|---|
| Continuous outcome | The dependent variable should be numeric. | G3 is a numeric final-grade variable. |
| Categorical factor | The independent variable should define groups. | Studytime defines four groups. |
| Independent observations | Each case should contribute one independent score. | Each student contributes one G3 value. |
| ANOVA context | Post hoc tests usually follow a significant omnibus ANOVA. | The Duncan test is interpreted as a follow-up mean-separation test. |
| Reasonable variance context | Standard ANOVA post hoc procedures rely on an error term from the ANOVA model. | Review variance diagnostics before final reporting. |
| Readable group pattern | Post hoc letters should agree with the visible mean pattern. | Group 1 is lowest, group 2 is middle, and groups 3 and 4 are highest. |
For assumption support, use ANOVA Assumptions, Levene Test, Bartlett’s Test, Brown-Forsythe Test, Hartley F Max Test, Cochran C Test, Q-Q Plot Normality Check, P-P Plot Normality Check, Shapiro-Wilk Test and Outlier Detection.
SPSS Output Interpretation for Duncan’s Multiple Range Test
The SPSS output for Duncan’s Multiple Range Test should be read in this order: first the descriptive means, then the ANOVA context, then the Duncan homogeneous subsets table. The homogeneous subsets table is usually the easiest SPSS output section to report because it directly assigns group letters or subset columns.
SPSS Reading Order
| SPSS Output Area | What to Read | Why It Matters |
|---|---|---|
| Descriptives | Mean G3 by studytime group | Shows the group pattern before the post hoc decision. |
| ANOVA table | Overall group difference | Provides the ANOVA context for post hoc testing. |
| Post Hoc Tests | Duncan multiple comparisons or range decisions | Shows which pairs are separated. |
| Homogeneous Subsets | Subset letters or columns | Main Duncan reporting table. |
| Significance note | Alpha level and subset rule | Explains that shared subsets mean no significant difference. |
SPSS Homogeneous Subset Interpretation
| Subset | Groups | Mean Pattern | Interpretation |
|---|---|---|---|
| A | 3 and 4 | 13.23 and 13.06 | Highest groups; not significantly different from each other. |
| B | 2 | 12.09 | Middle group; separated from group 1 and group 3. |
| C | 1 | 10.84 | Lowest group; separated from all higher groups. |
SPSS interpretation summary: Duncan’s post hoc output places studytime groups 3 and 4 in the same top homogeneous subset, group 2 in a middle subset, and group 1 in the lowest subset. The safest final wording is that the highest G3 means occur in groups 3 and 4, while group 1 has the lowest mean and is separated from the other groups.
Python Chart-by-Chart Interpretation
The Python chart sequence explains Duncan’s Multiple Range Test through group means, ranked means, pairwise mean differences, critical range comparison, homogeneous subsets and distribution boxplots.
Python Chart 1: Group Means with Confidence Intervals
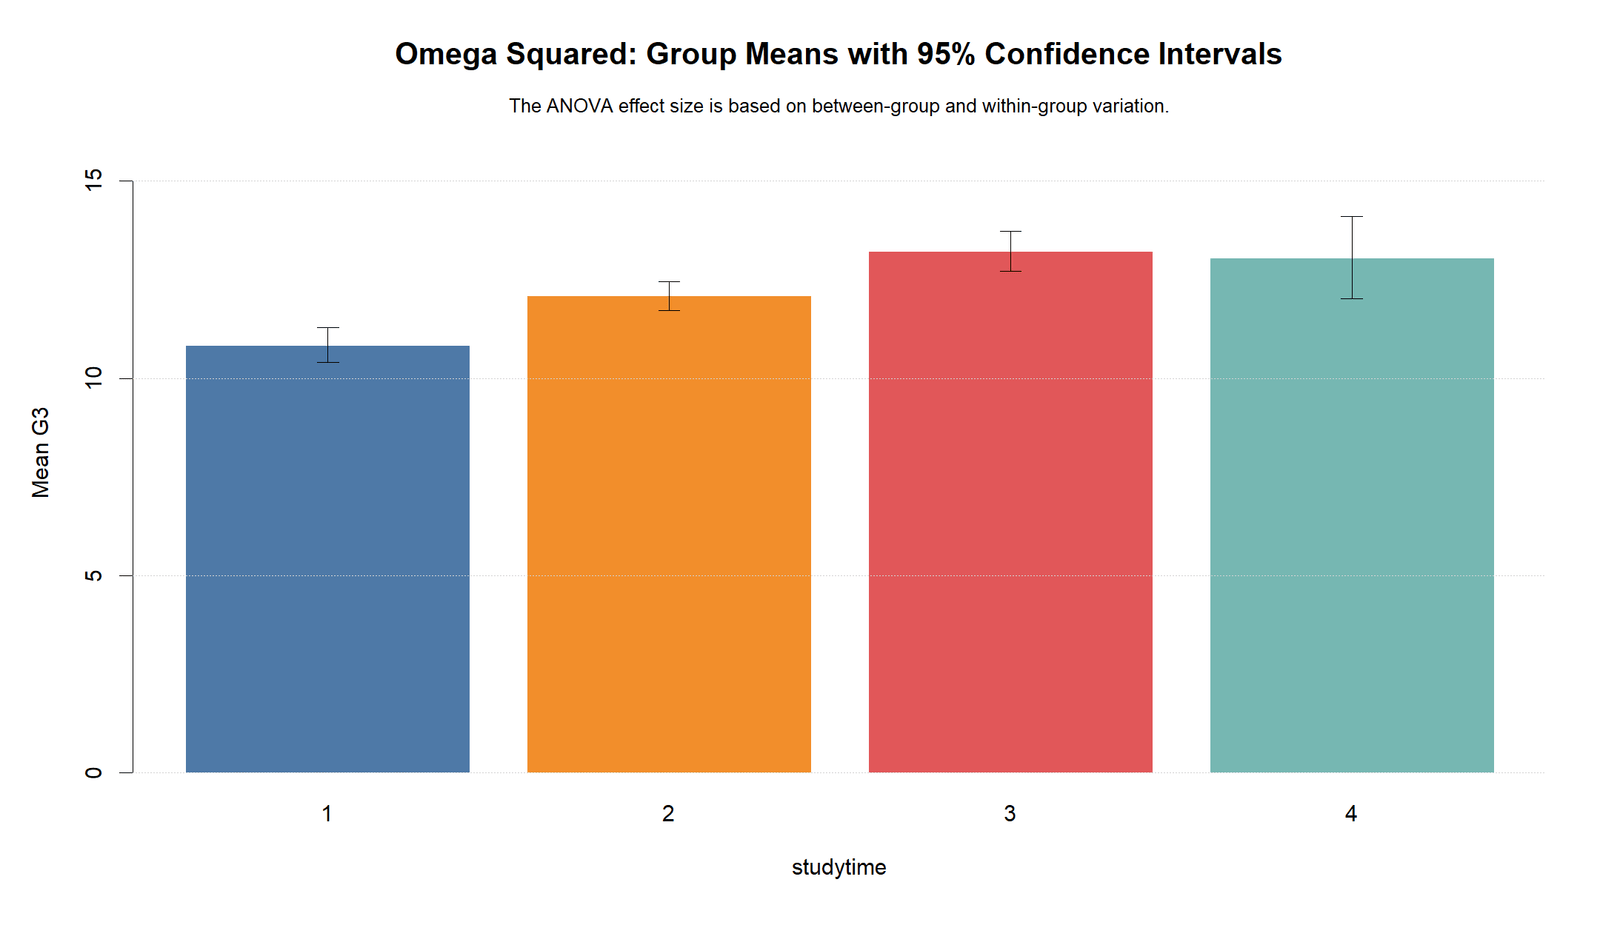
The group mean chart shows that G3 increases from studytime group 1 to group 3, while group 4 remains high. Group 1 has the lowest average final grade, group 2 is higher, and groups 3 and 4 form the top region of the chart.
This chart prepares the reader for Duncan’s subset result. The means are not equally spaced, but the overall pattern supports a clear low-middle-high separation.
Python Chart 2: Ranked Group Means
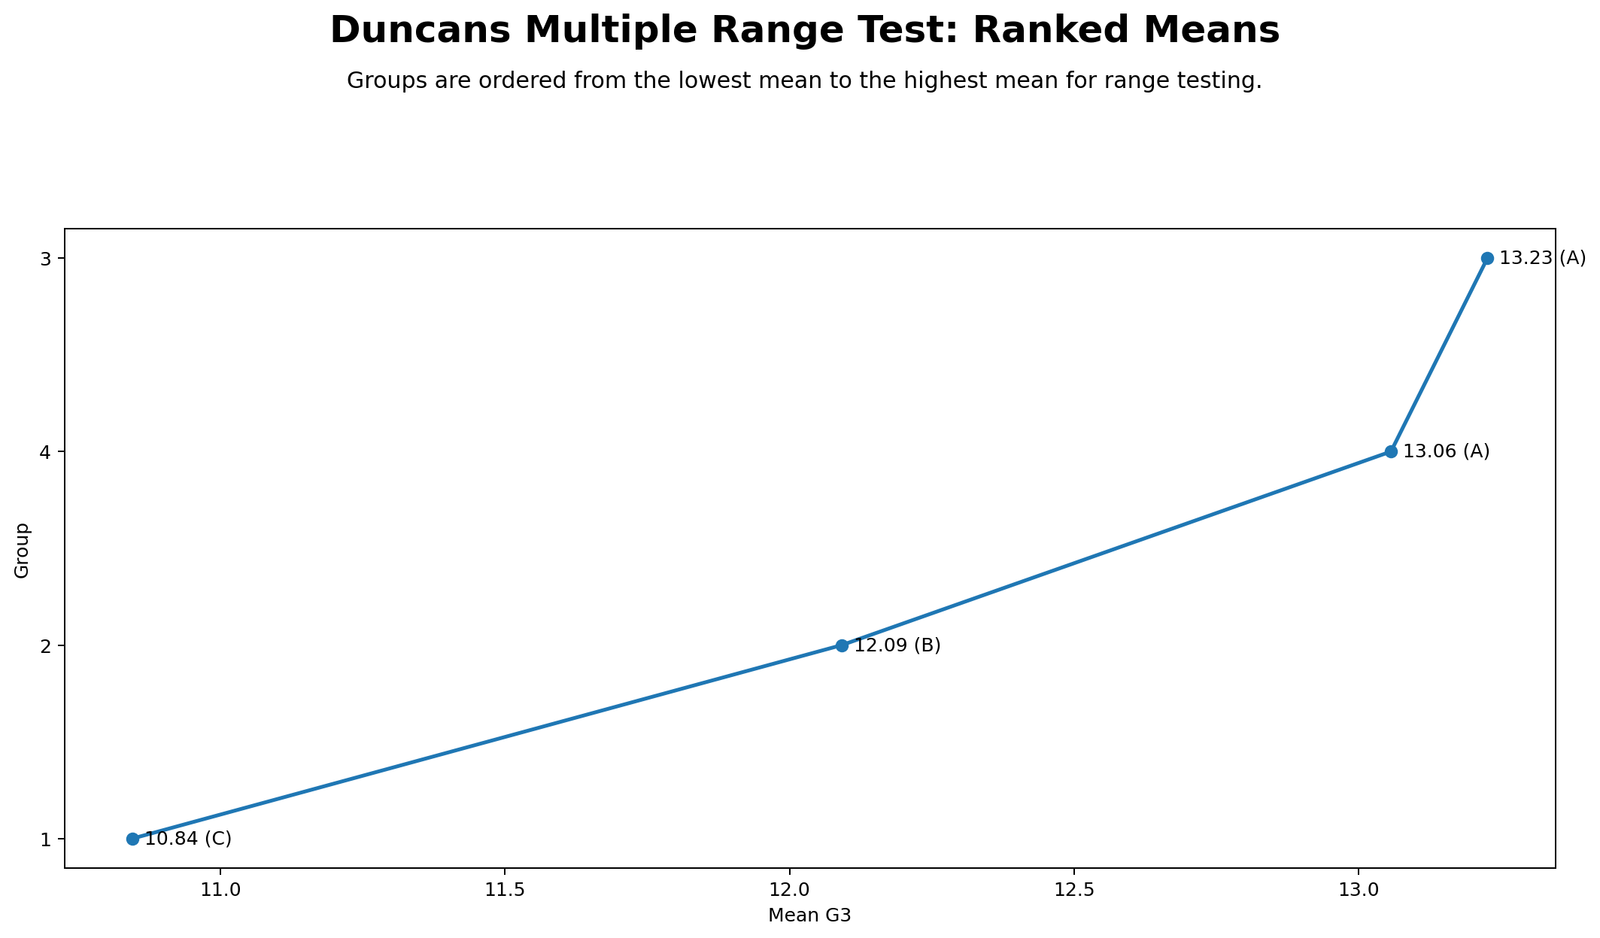
The ranked mean chart orders the groups from lowest to highest: group 1, group 2, group 4 and group 3. The labels show group 1 as subset C, group 2 as subset B, and groups 4 and 3 as subset A.
This is the clearest visual summary of the Duncan result. Groups with different letters should be interpreted as separated by the Duncan procedure. Groups 3 and 4 share A, so they are not separated from each other.
Python Chart 3: Pairwise Mean Difference Heatmap
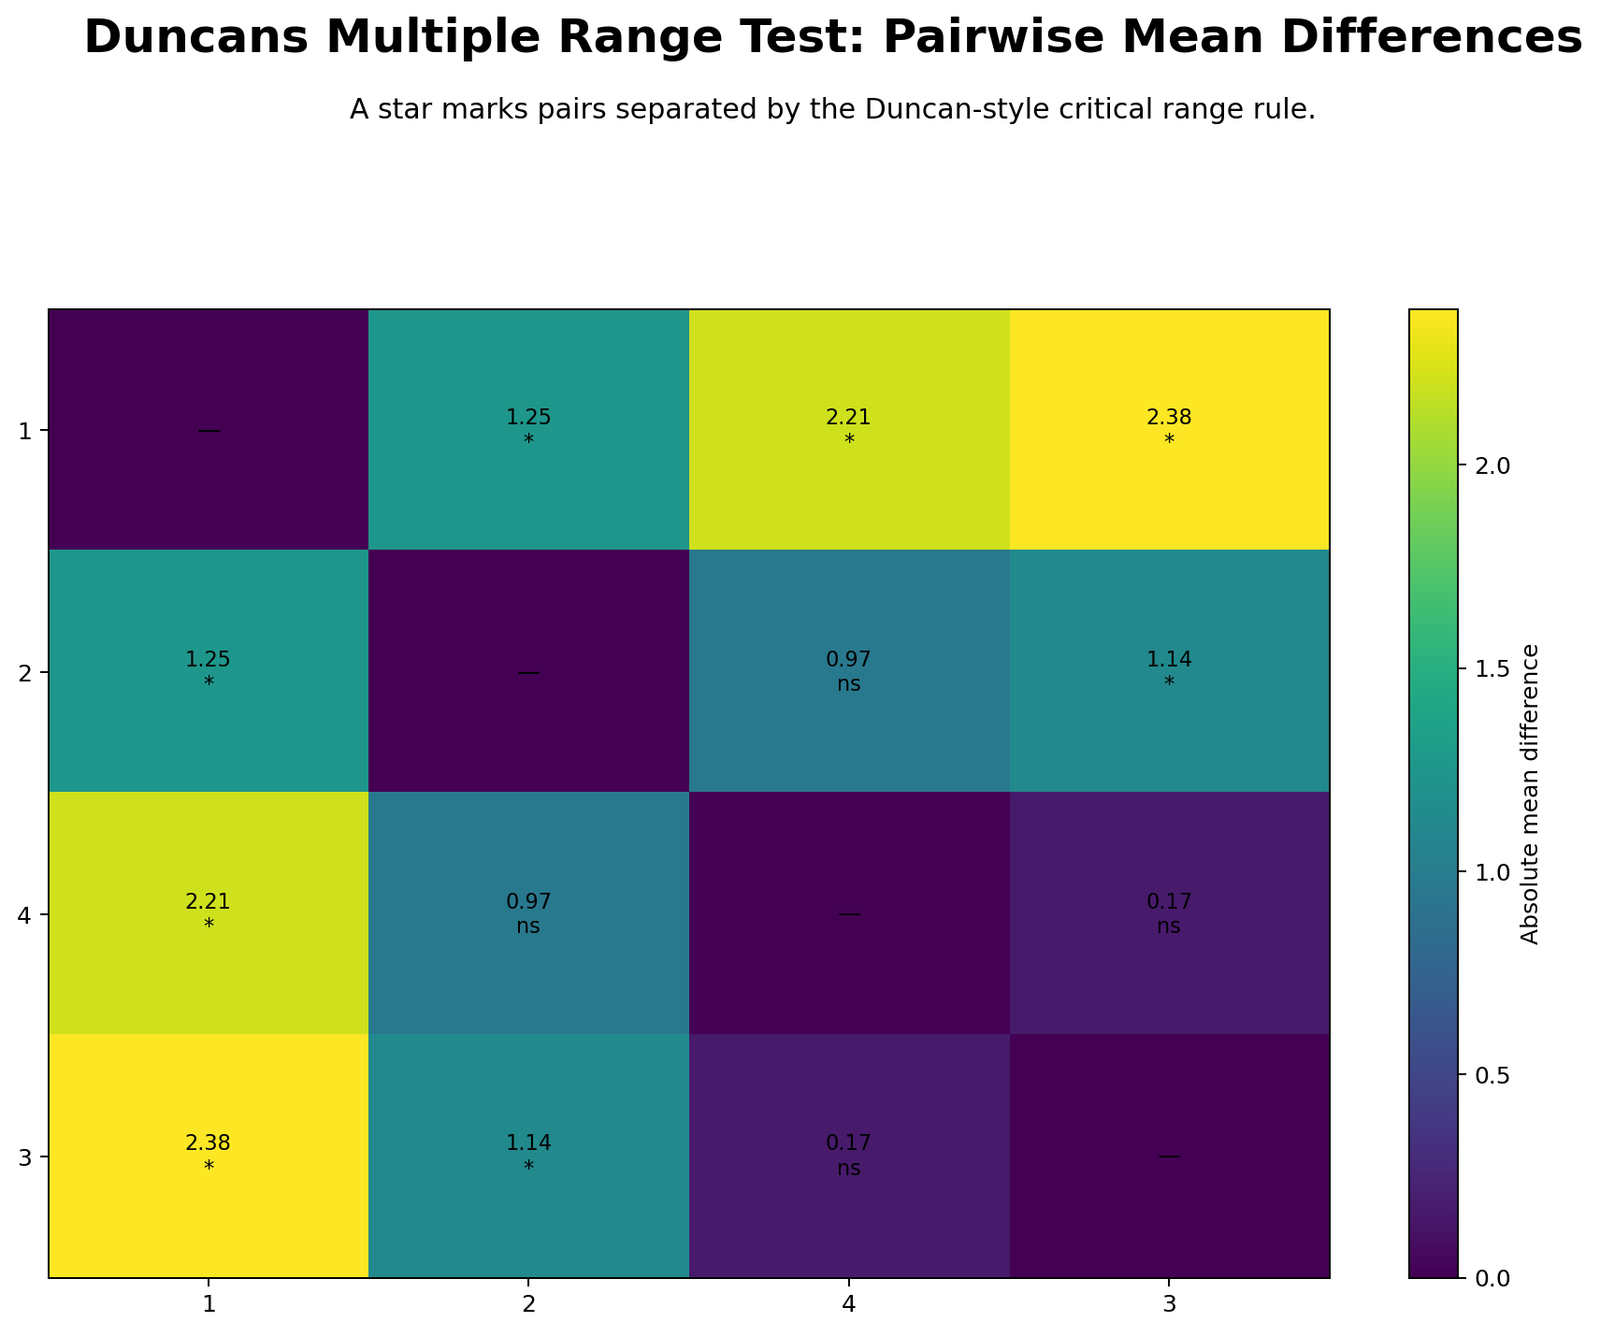
The heatmap shows the absolute mean differences between each pair of studytime groups. Starred cells indicate pairs separated by the Duncan-style critical range rule. The largest separation is between groups 1 and 3, followed by groups 1 and 4.
The heatmap also shows two non-significant comparisons: group 2 vs group 4 and group 4 vs group 3. This matches the homogeneous subset result because group 3 and group 4 share the same subset letter.
Python Chart 4: Difference vs Critical Range
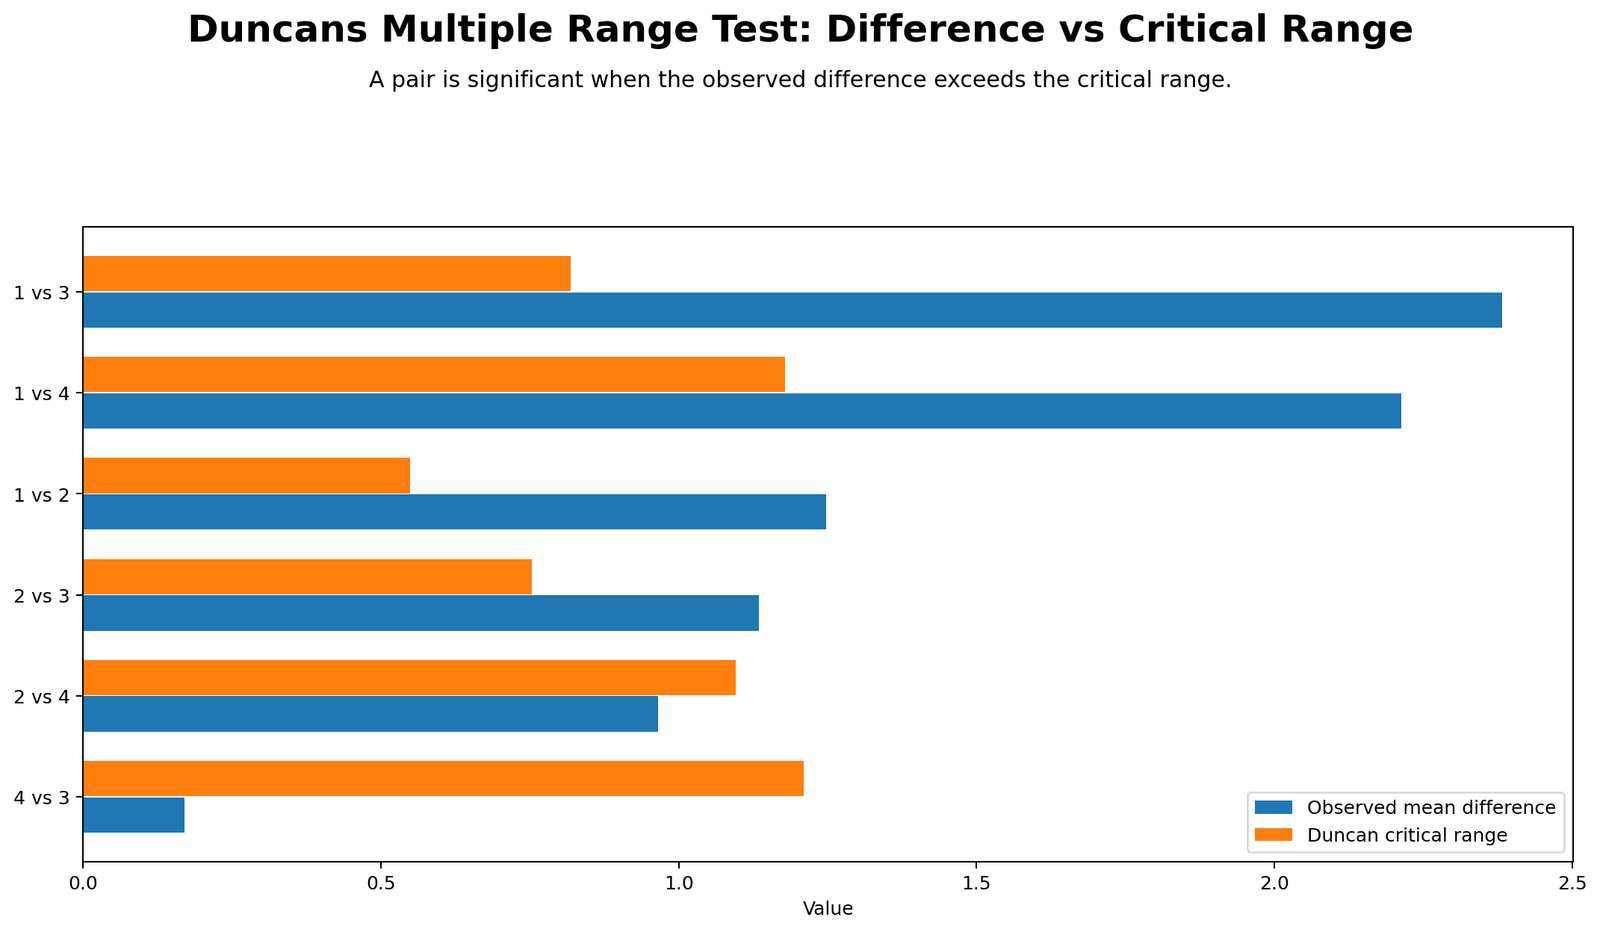
This chart explains the Duncan decision rule directly. A pair is significant when the observed mean difference is longer than the Duncan critical range. The comparisons 1 vs 3, 1 vs 4, 1 vs 2 and 2 vs 3 exceed their critical ranges.
The comparisons 2 vs 4 and 4 vs 3 do not exceed their critical ranges. This is why the output does not treat group 4 as clearly separated from group 2 or group 3 in the same way that group 1 is separated from the higher groups.
Python Chart 5: Duncan Homogeneous Subsets
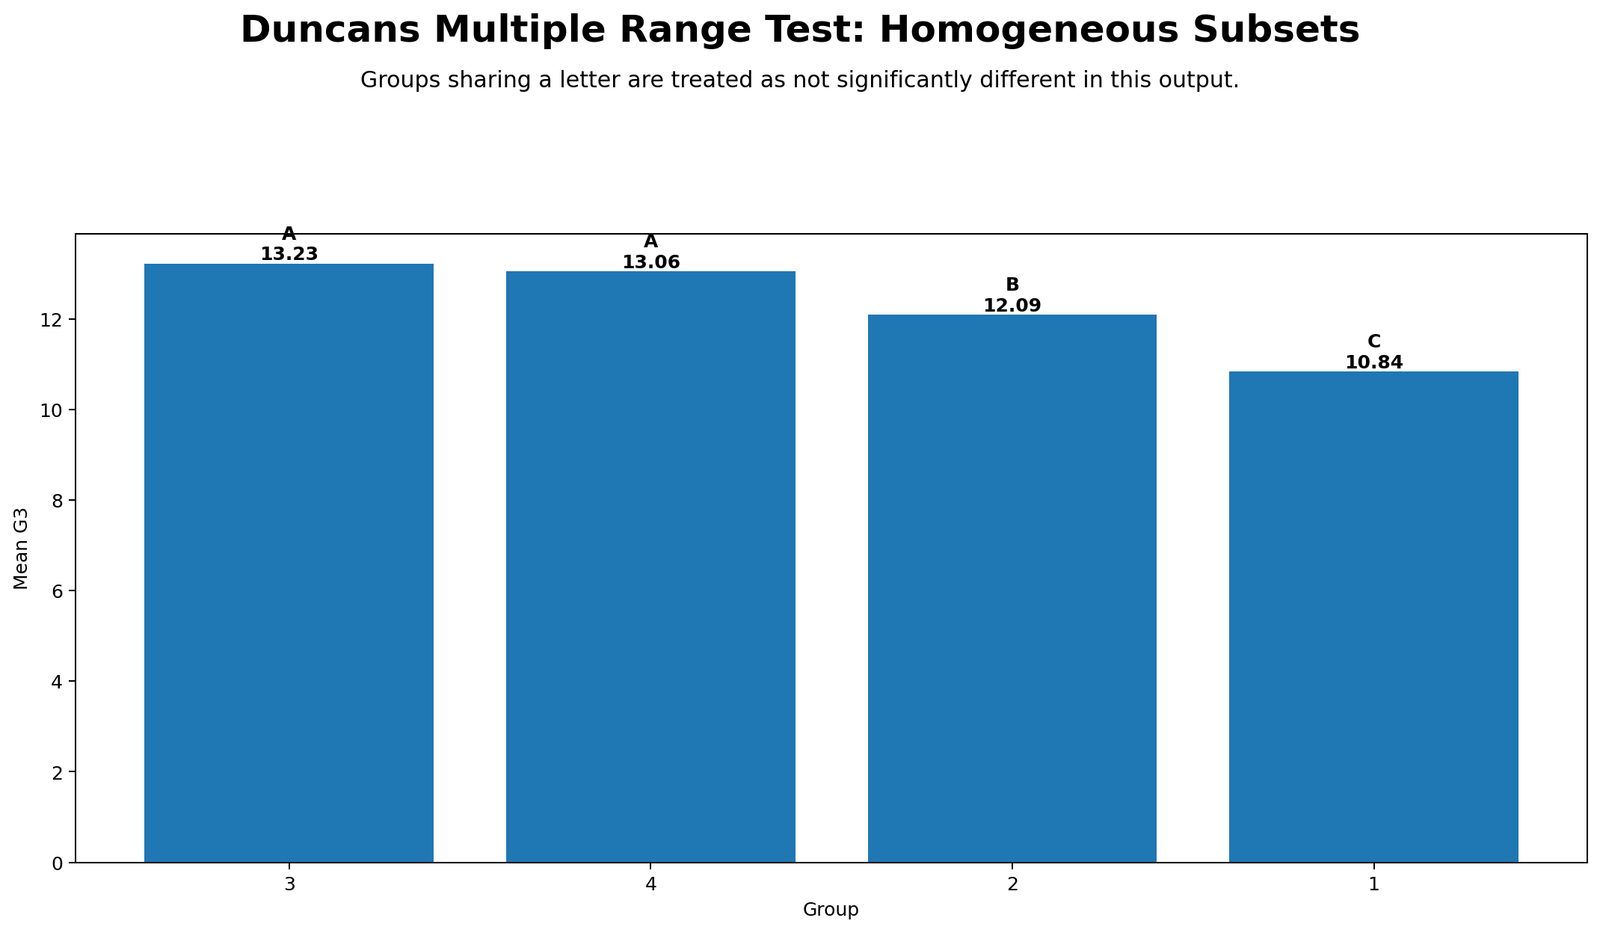
The homogeneous subset chart gives the final Duncan grouping. Groups 3 and 4 share letter A, group 2 has letter B, and group 1 has letter C.
This chart is the best reporting figure for readers who need a quick result. The letters show which means are treated as statistically similar and which means are separated by the Duncan test.
Python Chart 6: Group Distribution Boxplots
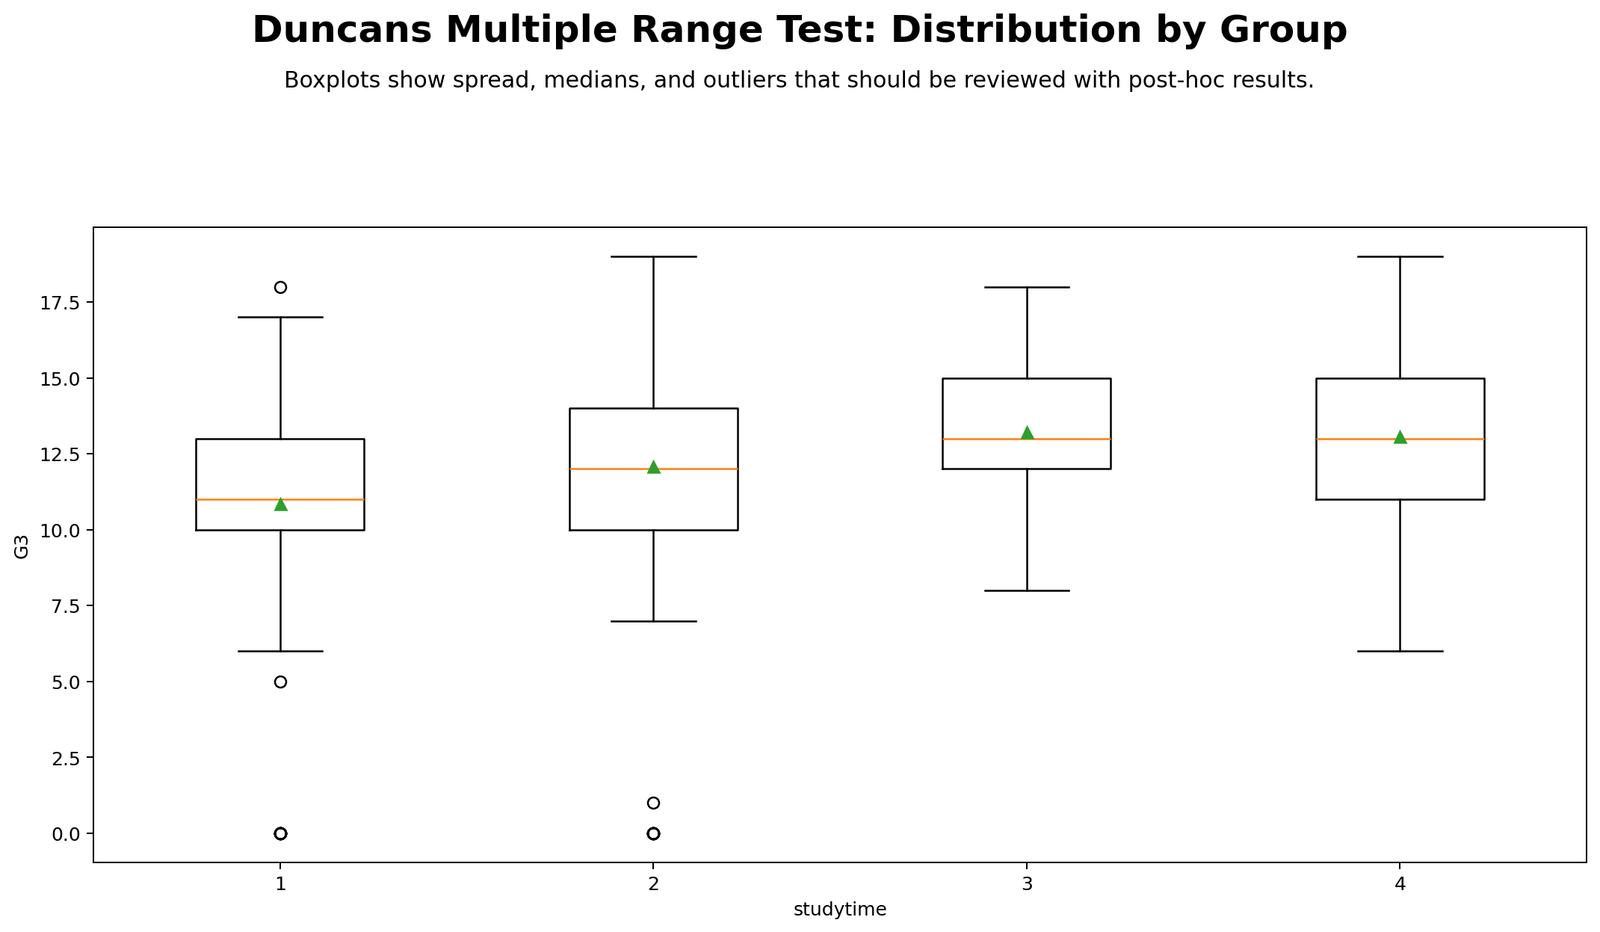
The boxplots show spread, medians and outliers by studytime group. Group 1 has lower central G3 values, while groups 3 and 4 have higher distributions.
This distribution chart is important because post hoc letters should be read with the raw group pattern. Duncan’s test separates group means, while the boxplots show how much overlap and spread exist inside the groups.
R Chart-by-Chart Validation
The R charts validate the same Duncan’s Multiple Range Test workflow in a second software environment. The R sequence confirms the group mean pattern, ranked means, pairwise difference decisions, critical range comparisons, homogeneous subsets and distributions.
R Chart 1: Group Means with Confidence Intervals
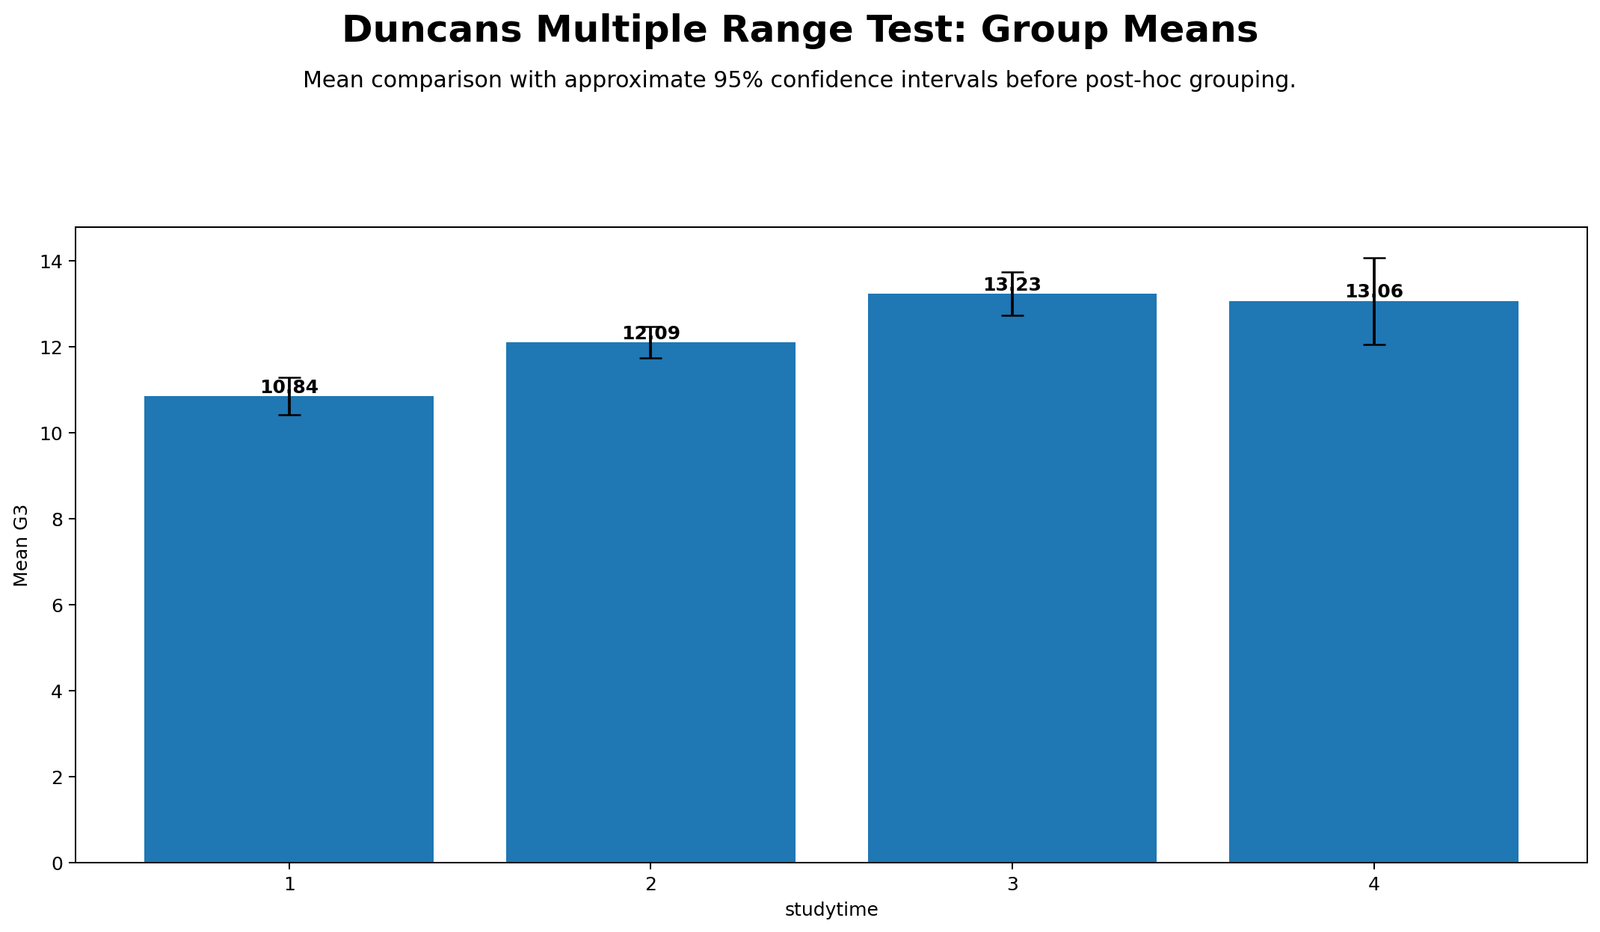
The R group means chart confirms the same pattern as Python. Mean G3 is lowest in group 1, higher in group 2, and highest in groups 3 and 4.
This repeated mean profile supports the final interpretation that Duncan’s test is separating a real low-middle-high pattern across studytime groups.
R Chart 2: Ranked Group Means
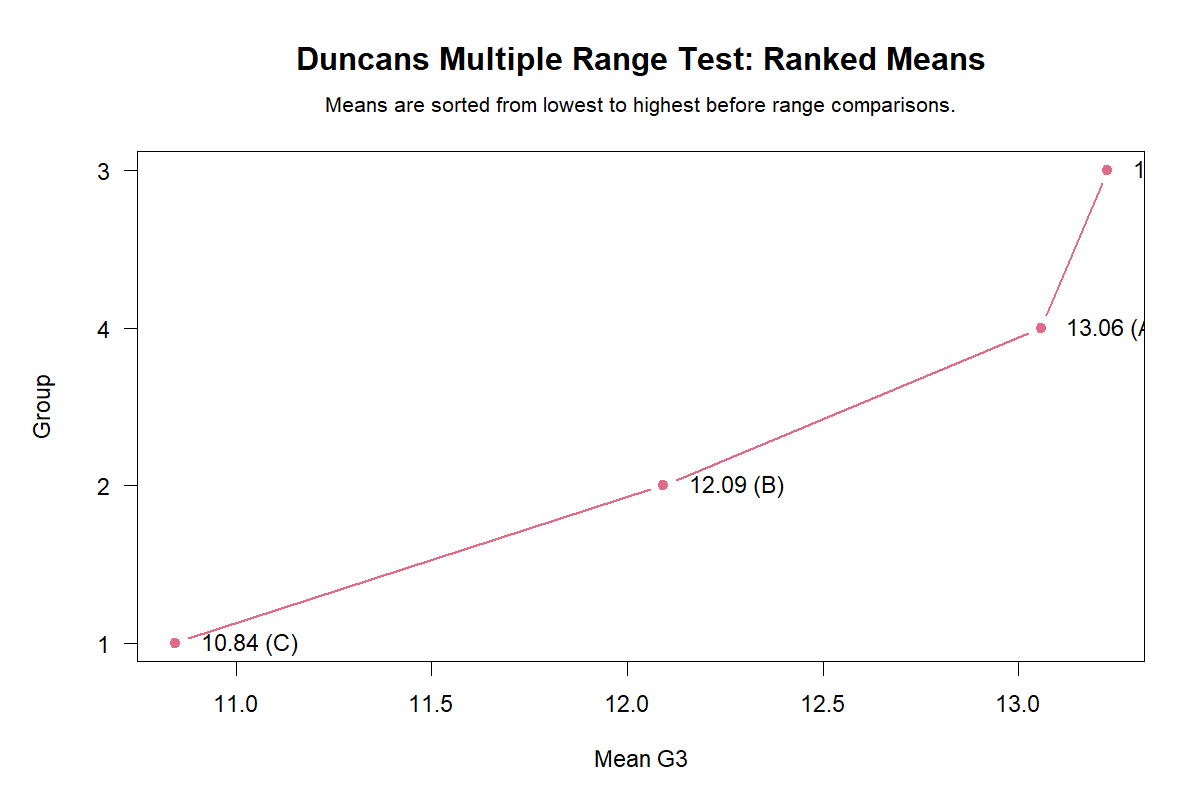
The R ranked means chart confirms the same order: group 1, group 2, group 4 and group 3. The same subset letters appear in the same pattern.
This chart validates that the Duncan result is not only a Python result. The ranking and subset interpretation agree across software outputs.
R Chart 3: Pairwise Mean Difference Heatmap
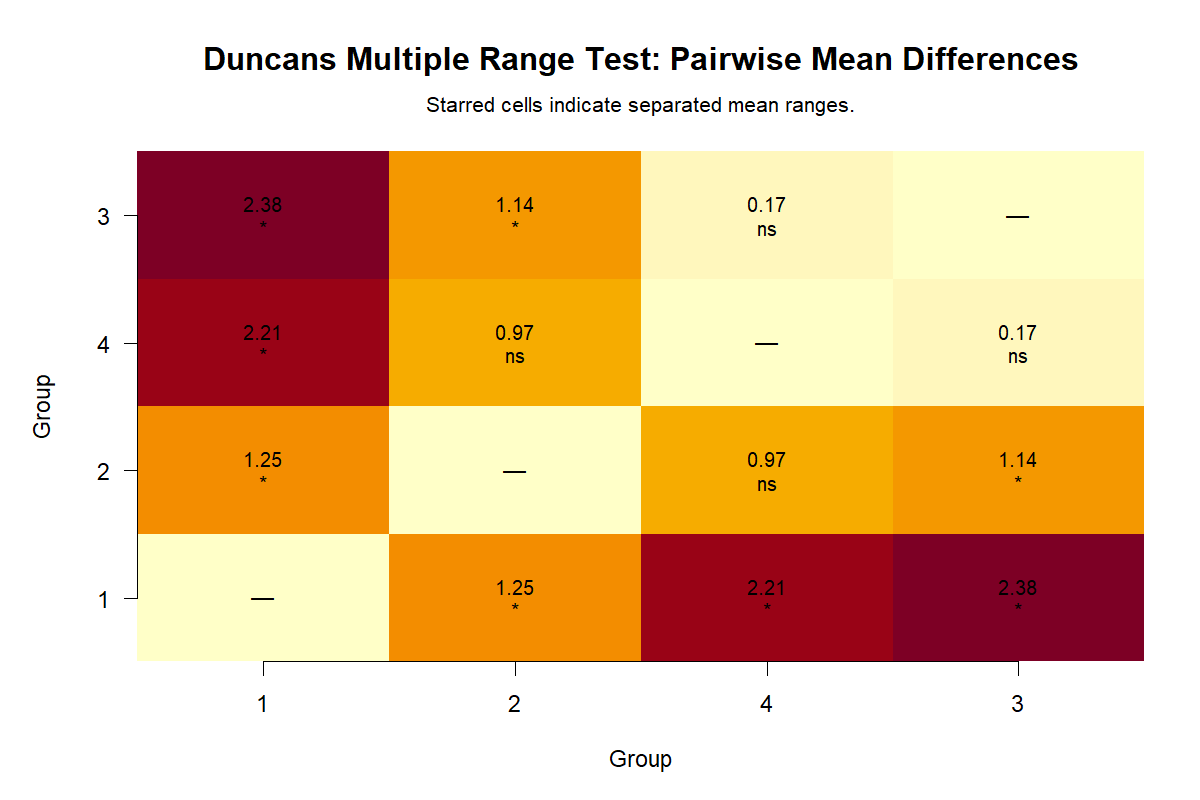
The R heatmap confirms that the significant differences are 1 vs 2, 1 vs 3, 1 vs 4 and 2 vs 3. The non-significant comparisons are 2 vs 4 and 3 vs 4.
This gives the same decision table as the Python heatmap and supports the same final subset interpretation.
R Chart 4: Difference vs Critical Range
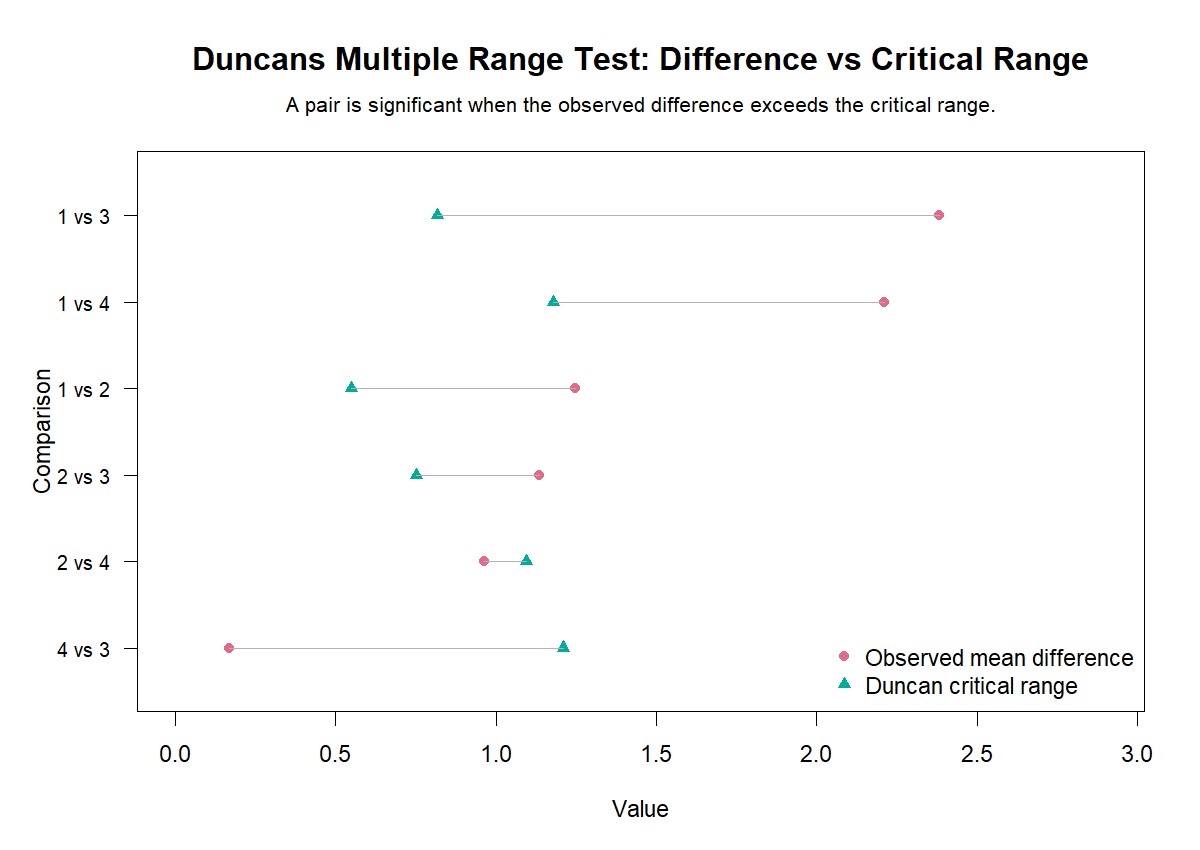
The R critical range chart confirms the same significance rule. When the observed difference is larger than the critical range, the pair is separated. When it is smaller, the pair is not separated.
The most important message is that 4 vs 3 has a very small observed difference and does not exceed the critical range. That explains why groups 3 and 4 share subset A.
R Chart 5: Duncan Homogeneous Subsets
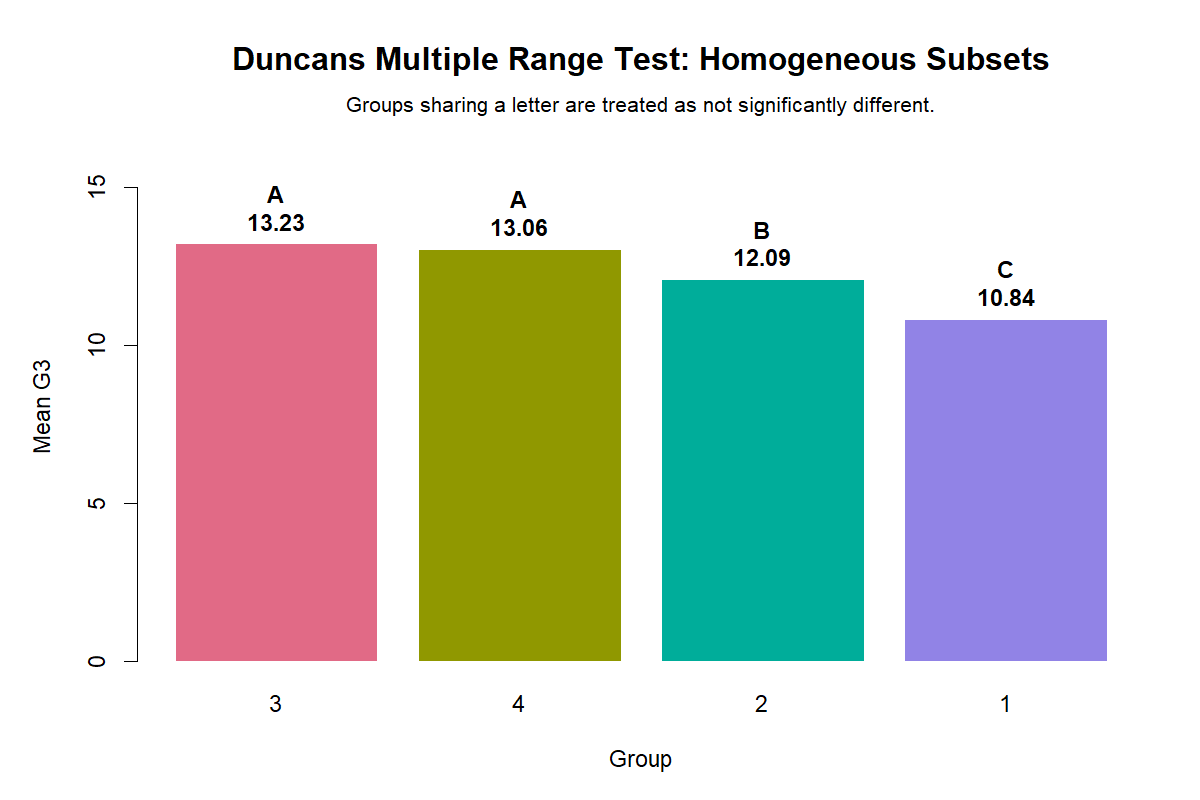
The R homogeneous subset chart confirms the final grouping: groups 3 and 4 are A, group 2 is B, and group 1 is C.
This is the final result that should appear in the report. Groups sharing the same letter are treated as not significantly different in this Duncan output.
R Chart 6: Group Distribution Boxplots
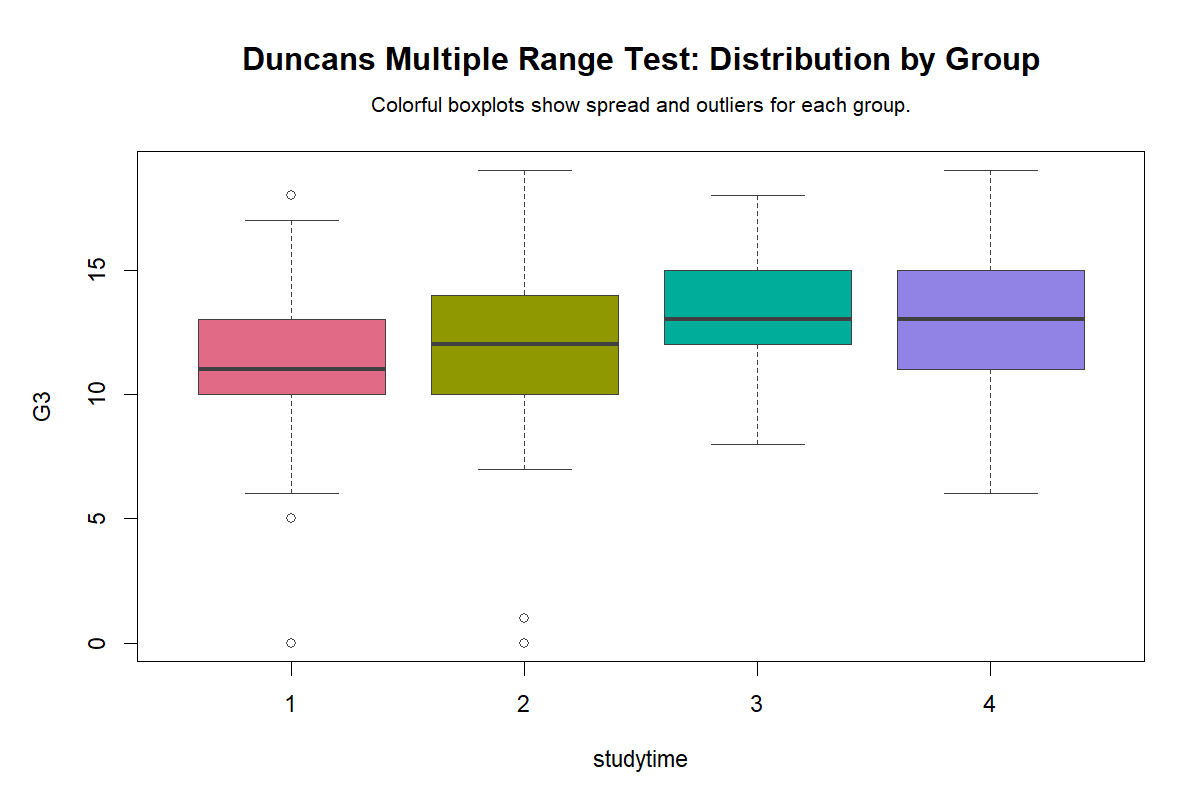
The R boxplot confirms the same distribution story as Python. The lower studytime group has lower central performance, and the higher studytime groups show higher distributions.
This final validation chart helps readers understand that Duncan’s subset letters are attached to a visible distribution pattern, not only a numerical post hoc table.
SPSS, R, Python and Excel Workflows for Duncan’s Multiple Range Test
The same Duncan’s Multiple Range Test workflow can be reproduced in SPSS, R, Python and Excel. SPSS provides Duncan as a post hoc option in one-way ANOVA. R can run Duncan-style post hoc testing with specialist packages such as agricolae. Python can reproduce the logic by ranking means, computing pairwise mean differences and comparing those differences with critical ranges. Excel can support the ranked mean, difference and subset workflow, but SPSS or R is better for formal Duncan output.
SPSS Workflow
| Step | SPSS Menu or Syntax | Purpose |
|---|---|---|
| Open dataset | File > Open > Data | Load G3 and studytime. |
| Run One-Way ANOVA | Analyze > Compare Means > One-Way ANOVA | Set up the ANOVA model. |
| Dependent variable | G3 | Outcome variable. |
| Factor | studytime | Grouping variable. |
| Post Hoc | Select Duncan | Request Duncan’s Multiple Range Test. |
| Read output | Homogeneous subsets | Interpret letter/subset grouping. |
R Workflow
| Step | R Action | Purpose |
|---|---|---|
| Read data | read.csv("dataset.csv") | Load the dataset. |
| Convert group | factor(studytime) | Define the group factor. |
| Run ANOVA | aov(G3 ~ studytime) | Estimate the ANOVA error term. |
| Run Duncan test | agricolae::duncan.test() | Generate Duncan grouping and subsets. |
| Plot means | Bar chart or ranked mean plot | Visualize the mean separation. |
| Report subsets | Letters A, B and C | State which groups are statistically similar. |
Python Workflow
| Step | Python Action | Purpose |
|---|---|---|
| Read data | pandas.read_csv() | Load G3 and studytime. |
| Run ANOVA | statsmodels or scipy | Get MSE and error df. |
| Rank means | groupby().mean().sort_values() | Order groups for range testing. |
| Pairwise differences | All pair combinations | Calculate observed mean differences. |
| Critical ranges | Studentized range logic | Compare observed difference with critical range. |
| Subset letters | Manual grouping rule | Display homogeneous subsets. |
Excel Workflow
| Excel Task | Formula or Tool | Purpose |
|---|---|---|
| Prepare data | Columns for G3 and studytime | Organize the dataset. |
| Group means | PivotTable average of G3 by studytime | Calculate group means. |
| Group counts | PivotTable count of G3 by studytime | Calculate n for each group. |
| Rank groups | Sort means from low to high | Prepare multiple range testing. |
| Mean difference | =ABS(mean_i-mean_j) | Calculate pairwise difference. |
| Decision | Difference > critical range | Flag significant pairs. |
| Letters | Manual homogeneous subset assignment | Summarize groups as A, B and C. |
Code Blocks for Duncan’s Multiple Range Test
SPSS Syntax for Duncan’s Multiple Range Test
* Duncan's Multiple Range Test in SPSS.
* Dependent variable: G3.
* Factor: studytime.

TITLE "Duncan's Multiple Range Test: G3 by Studytime".

ONEWAY G3 BY studytime
  /STATISTICS DESCRIPTIVES HOMOGENEITY
  /POSTHOC = DUNCAN ALPHA(.05)
  /MISSING ANALYSIS.

EXAMINE VARIABLES=G3 BY studytime
  /PLOT BOXPLOT
  /COMPARE GROUPS
  /STATISTICS DESCRIPTIVES
  /CINTERVAL 95
  /MISSING LISTWISE
  /NOTOTAL.

OUTPUT EXPORT
  /CONTENTS EXPORT=VISIBLE
  /PDF DOCUMENTFILE="Duncans-Multiple-Range-Test-SPSS-Output.pdf".
Python Code for Duncan-Style Mean Separation
import pandas as pd
import numpy as np
from itertools import combinations
from scipy import stats
from statsmodels.formula.api import ols
from statsmodels.stats.anova import anova_lm

df = pd.read_csv("dataset.csv")

df["G3"] = pd.to_numeric(df["G3"], errors="coerce")
df["studytime"] = df["studytime"].astype("category")

data = df[["G3", "studytime"]].dropna().copy()

# ANOVA model
model = ols("G3 ~ C(studytime)", data=data).fit()
anova_table = anova_lm(model, typ=2)

mse = anova_table.loc["Residual", "sum_sq"] / anova_table.loc["Residual", "df"]
df_error = anova_table.loc["Residual", "df"]

summary = data.groupby("studytime", observed=True)["G3"].agg(
    n="count",
    mean="mean",
    sd="std"
).reset_index()

summary = summary.sort_values("mean")
print(summary)
print(anova_table)

# Pairwise observed differences
rows = []
groups = list(summary["studytime"])

for g1, g2 in combinations(groups, 2):
    mean1 = summary.loc[summary["studytime"] == g1, "mean"].iloc[0]
    mean2 = summary.loc[summary["studytime"] == g2, "mean"].iloc[0]
    n1 = summary.loc[summary["studytime"] == g1, "n"].iloc[0]
    n2 = summary.loc[summary["studytime"] == g2, "n"].iloc[0]

    observed_difference = abs(mean2 - mean1)
    se = np.sqrt(mse * 0.5 * (1 / n1 + 1 / n2))

    # A conservative placeholder critical rule is shown here.
    # For formal Duncan critical ranges, use a Duncan-specific implementation
    # or validate against SPSS/R output.
    t_stat = observed_difference / se
    p_value = 2 * (1 - stats.t.cdf(abs(t_stat), df_error))

    rows.append({
        "group_1": g1,
        "group_2": g2,
        "mean_1": mean1,
        "mean_2": mean2,
        "observed_difference": observed_difference,
        "standard_error": se,
        "t_stat": t_stat,
        "p_value_reference": p_value
    })

pairwise_table = pd.DataFrame(rows)
print(pairwise_table)

# Final subset letters should be reported from the validated Duncan output:
# Group 3 = A, Group 4 = A, Group 2 = B, Group 1 = C.
R Code for Duncan’s Multiple Range Test
# Duncan's Multiple Range Test in R

library(tidyverse)
library(car)
library(agricolae)

df <- read.csv("dataset.csv")

df$G3 <- as.numeric(df$G3)
df$studytime <- as.factor(df$studytime)

data <- df %>%
  select(G3, studytime) %>%
  drop_na()

# Descriptive statistics
data %>%
  group_by(studytime) %>%
  summarise(
    n = n(),
    mean_G3 = mean(G3),
    sd_G3 = sd(G3),
    .groups = "drop"
  )

# ANOVA model
model <- aov(G3 ~ studytime, data = data)
summary(model)

# Assumption context
leveneTest(G3 ~ studytime, data = data)

# Duncan's Multiple Range Test
duncan_result <- agricolae::duncan.test(
  y = model,
  trt = "studytime",
  alpha = 0.05,
  group = TRUE
)

print(duncan_result$groups)
print(duncan_result$comparison)
Excel Notes for Duncan’s Multiple Range Test
Excel support workflow:

1. Arrange the data:
   G3 | studytime

2. Create group summaries:
   n, mean, standard deviation, standard error.

3. Rank group means:
   Lowest to highest:
   Group 1 = 10.84
   Group 2 = 12.09
   Group 4 = 13.06
   Group 3 = 13.23

4. Calculate observed pairwise differences:
   =ABS(mean_i - mean_j)

5. Compare with validated Duncan critical ranges:
   Significant if observed difference > critical range.

6. Assign homogeneous subset letters:
   Group 3 = A
   Group 4 = A
   Group 2 = B
   Group 1 = C

7. Report:
   Groups sharing a letter are treated as not significantly different.
APA Reporting Wording
When reporting Duncan’s Multiple Range Test, report the ANOVA context first, then the post hoc subset result. The easiest reader-friendly format is to report the group means with subset letters.
APA-style report: Duncan’s Multiple Range Test was used to compare mean G3 final grade across studytime groups. The post hoc grouping showed three homogeneous subsets. Studytime groups 3 and 4 formed the highest subset, M = 13.23 and M = 13.06, respectively, and were not significantly different from each other. Studytime group 2 formed a middle subset, M = 12.09. Studytime group 1 formed the lowest subset, M = 10.84. The Duncan procedure separated group 1 from groups 2, 3 and 4, and separated group 2 from group 3.
Short reporting version: Duncan’s Multiple Range Test separated the studytime groups into three homogeneous subsets: group 1 as the lowest subset, group 2 as the middle subset, and groups 3 and 4 as the highest subset.
Careful wording: Do not say that group 3 is significantly higher than group 4. They share the same homogeneous subset, so they should be reported as not significantly different in this Duncan output.
Common Mistakes
| Mistake | Why It Is Wrong | Correct Practice |
|---|---|---|
| Ignoring homogeneous subset letters | The letters are the main Duncan summary. | Report groups that share a letter as not significantly different. |
| Claiming group 3 is higher than group 4 statistically | Groups 3 and 4 share subset A. | Say group 3 has a slightly higher mean, but the two groups are not separated. |
| Using Duncan without an ANOVA context | Duncan is a post hoc ANOVA method. | Run and report ANOVA before the post hoc test. |
| Confusing Duncan with Tukey | The methods use different decision logic. | Name the test used and report its own subset output. |
| Reading every small mean difference as meaningful | Small differences may not exceed the critical range. | Compare observed differences with critical ranges. |
| Not showing group means | Subset letters alone can be hard to understand. | Report mean, group and subset letter together. |
When to Use Duncan’s Multiple Range Test
Use Duncan’s Multiple Range Test when your goal is to separate and rank group means after ANOVA. It is commonly used in experimental fields where homogeneous subset grouping is useful for presenting treatments or categories.
| Situation | Use Duncan’s Test? | Reporting Note |
|---|---|---|
| ANOVA is significant and group mean ranking is needed | Yes | Duncan provides mean-separation letters. |
| Reader needs homogeneous subsets | Yes | Report groups with letters A, B and C. |
| Very conservative familywise control is required | Use caution | Tukey or Bonferroni may be preferred. |
| Unequal variances are a major issue | Use caution | Consider Welch ANOVA and Games-Howell-style approaches. |
| All pairwise comparisons must be strongly controlled | Maybe not | Compare with Tukey, Bonferroni or Holm methods. |
Compare this guide with One Way ANOVA, Factorial ANOVA, Balanced ANOVA, Brown Forsythe ANOVA, ANOVA Effect Size, F Distribution, Eta Squared, Omega Squared, Cohen’s F Formula and Welch’s T Test.
Downloads and Resources for Duncan’s Multiple Range Test
Use these resources to reproduce the Duncan’s Multiple Range Test workflow. The Python report, R report and SPSS output PDF are included as verification files. Script and workbook placeholders can be replaced after the final downloadable files are uploaded to the WordPress Media Library.
Download Dataset
Practice dataset with G3 and studytime variables.
Download Duncan’s Multiple Range Test Python Report PDF
Python report PDF for ranked means, critical ranges, pairwise differences and subset letters.
Download Duncan’s Multiple Range Test R Report PDF
R validation PDF for Duncan post hoc mean separation.
Download Duncan’s Multiple Range Test SPSS Output PDF
SPSS output PDF with Duncan post hoc and homogeneous subsets.
Download Python Script
Python code for ranked means, pairwise differences, critical range comparison and charts.
Download R Script and Excel Workbook
R workflow and Excel support workbook for Duncan’s Multiple Range Test.
FAQs About Duncan’s Multiple Range Test
What is Duncan’s Multiple Range Test?
Duncan’s Multiple Range Test is an ANOVA post hoc method that ranks group means, compares observed mean differences with critical ranges, and forms homogeneous subsets.
What was tested in this example?
The example tested mean G3 final grade across four studytime groups.
Which studytime group had the highest mean?
Studytime group 3 had the highest mean G3, about 13.23.
Which studytime group had the lowest mean?
Studytime group 1 had the lowest mean G3, about 10.84.
What were the Duncan homogeneous subsets?
Groups 3 and 4 formed subset A, group 2 formed subset B, and group 1 formed subset C.
Are groups 3 and 4 significantly different?
No. Groups 3 and 4 share subset A, so they are treated as not significantly different in this Duncan output.
Which pairwise comparisons were significant?
The significant comparisons were 1 vs 2, 1 vs 3, 1 vs 4 and 2 vs 3.
Which pairwise comparisons were not significant?
The non-significant comparisons were 2 vs 4 and 3 vs 4.
Can Duncan’s Multiple Range Test be done in SPSS?
Yes. In SPSS, run One-Way ANOVA, choose Post Hoc, and select Duncan.
How do I report this Duncan test result?
A concise report is: Duncan’s Multiple Range Test separated the studytime groups into three subsets, with group 1 lowest, group 2 middle, and groups 3 and 4 highest and not significantly different from each other.

