
Moses Test of Extreme Reactions: Formula, Interpretation and Worked Example
The Moses Test of Extreme Reactions is a directional, nonparametric procedure for asking whether a comparison group produces more unusually low and unusually high responses than a designated control group. This complete guide explains the control-group span, the trimmed-span sensitivity analysis, assumptions, hypotheses, exact no-tie formula, tied-data limitations, a school-absence example, and reproducible workflows in Python, R, SPSS and Excel.
Control vs comparison
Range / dispersion
One-sided inference
Python + R + SPSS + Excel
The comparison school showed substantially more extreme absence counts.
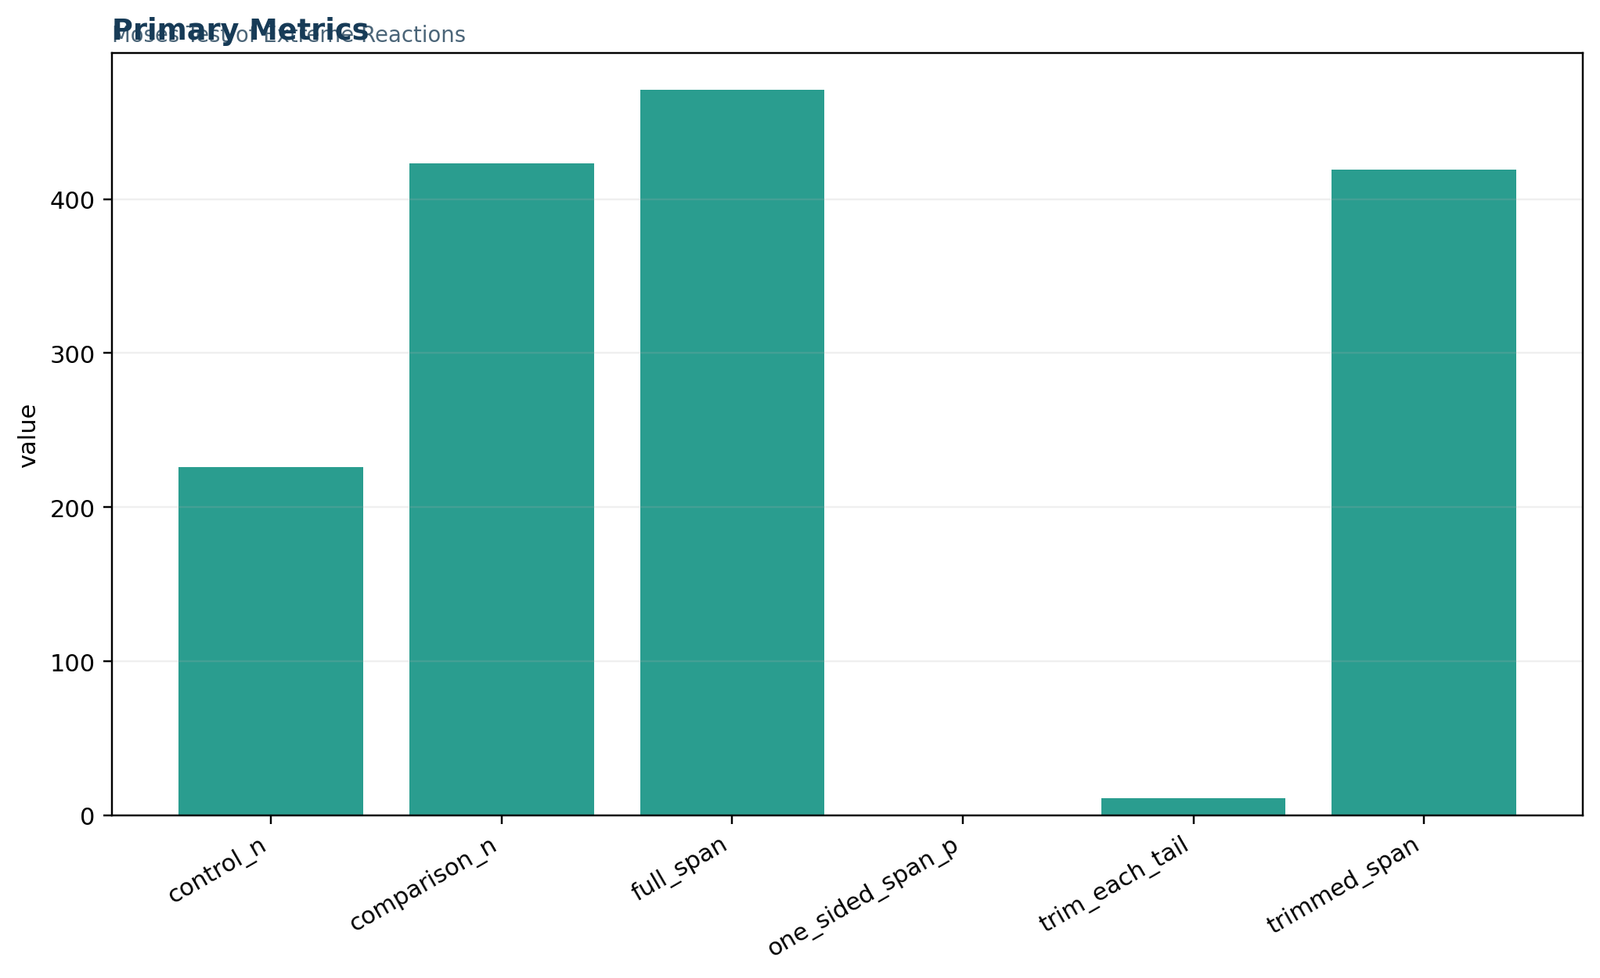
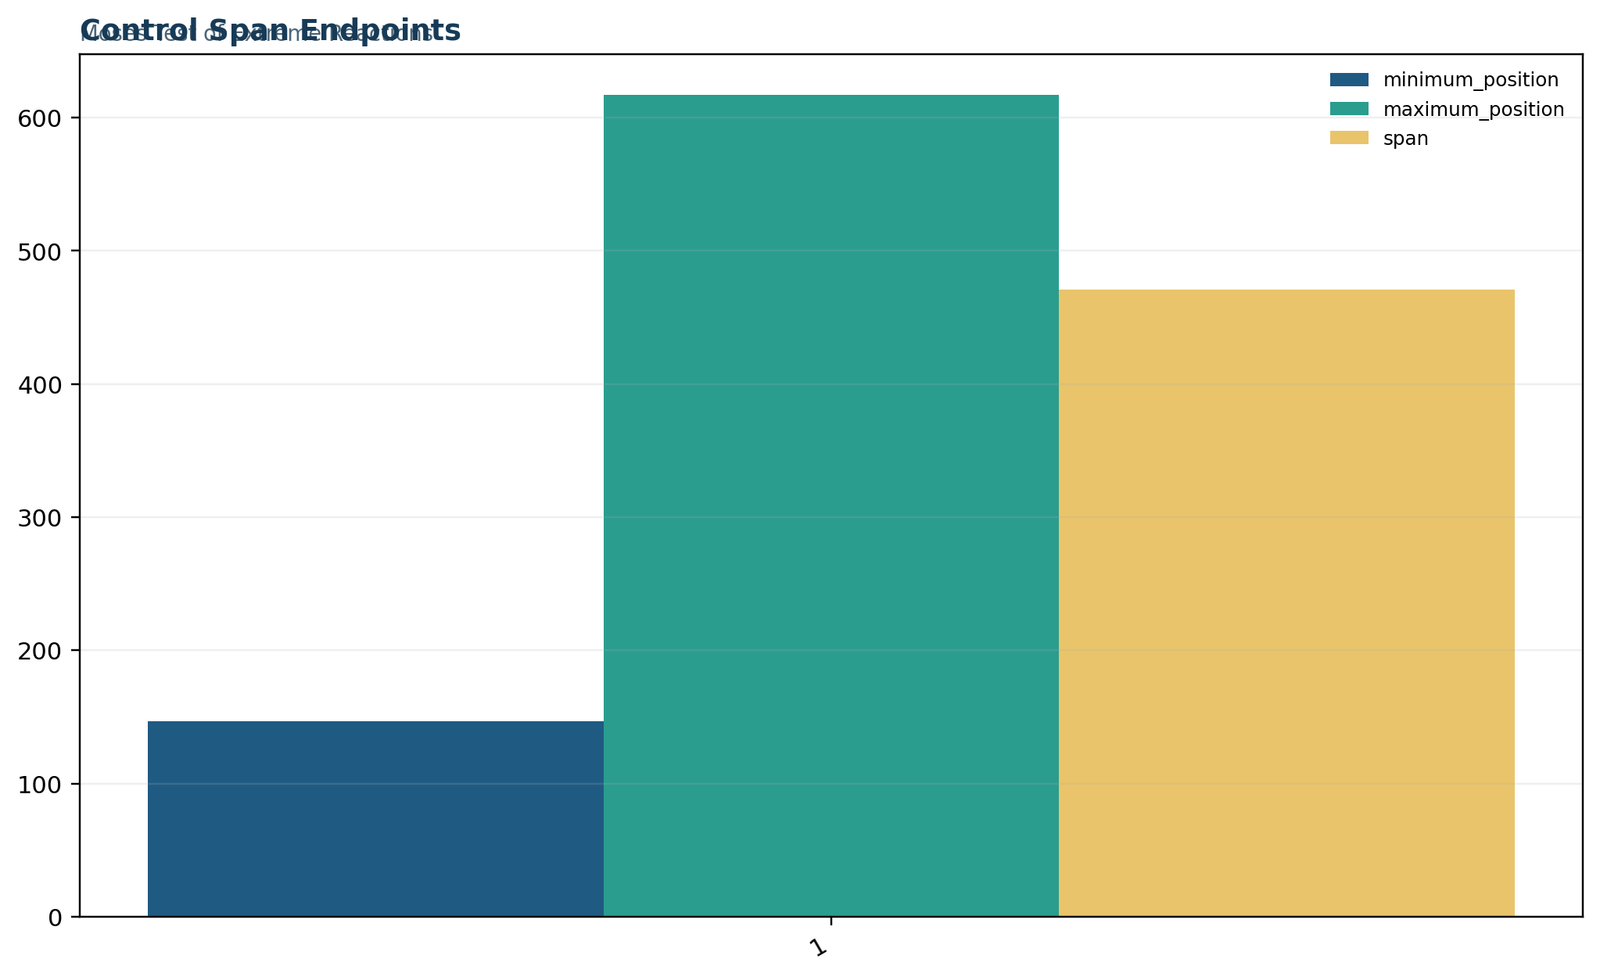
For the worked Moses Test of Extreme Reactions, MS was defined as the control group (n = 226) and GP as the comparison group (n = 423). In the deterministic Python and R ordering, the first and last MS observations occupied pooled positions 147 and 617, giving an inclusive control span of 471. Under the continuous no-tie reference distribution, the one-sided cumulative probability was p = 2.6781 × 10−39. Trimming 11 MS observations from each tail reduced the reported sensitivity span to 419.
The native SPSS implementation also found a highly significant result, but it reported a full span of 490, a trimmed span of 455, and p < .001. The statistic differs because school absences contain many ties and the implementations assign or handle tied pooled positions differently. Both analyses support the same directional conclusion: GP contains more extreme absence responses than the MS control group.
What does the Moses Test of Extreme Reactions measure?
A directional two-sample question about unusually low and high responses.
The Moses Test of Extreme Reactions asks whether a comparison or experimental group is more dispersed than a designated control group. It does this by locating the control observations in the pooled ordered sample. When the comparison group contributes observations at both extremes, the control observations become concentrated within a shorter central interval.
The statistical target
The procedure is often described as a nonparametric test of range, variability, dispersion or extreme reactions. These descriptions are related but not interchangeable. The statistic is literally based on the span of the control group in the pooled order. A small control span is evidence that the comparison sample supplies more of the pooled low-end and high-end observations.
That makes the Moses Test of Extreme Reactions especially suited to a directional substantive question: did an intervention, treatment, environment or comparison condition create both unusually weak and unusually strong reactions relative to a stable control condition? The method is not a generic test that two distributions differ in any possible way.
Why “extreme reactions” is a useful name
Suppose a treatment helps some participants but harms others. Their average response could resemble the control average even though the treatment group contains many unusually high and unusually low outcomes. A location test can miss that pattern. The Moses procedure instead checks whether the control values occupy a relatively compact part of the combined ordering while treatment values appear beyond both control endpoints.
For the school-absence analysis, both schools have a median of 2 absences, yet GP reaches a maximum of 32 compared with 12 in MS and has a larger standard deviation and interquartile range. The Moses Test of Extreme Reactions therefore addresses a pattern that is not summarized by the equal medians alone.
The Moses Test of Extreme Reactions is asymmetric. Calling MS the control and GP the comparison asks whether GP produces more extremes around the MS range. Reversing the labels asks a different question and can lead to a different statistic and p-value. The control designation must therefore come from the study design or a clearly defended analytic purpose, not from whichever ordering produces significance.
When should you use the Moses Test of Extreme Reactions?
Choose it for a planned control-versus-comparison dispersion question.
Use the Moses Test of Extreme Reactions when there are exactly two independent groups, one group has a meaningful control role, the outcome can be ordered, and the alternative specifically predicts more extreme responses in the comparison group.
Confirm independence
Each person or unit should contribute to only one group, without matching or repeated measurement.
Designate the control
The control group must be determined substantively before inspecting the favorable direction.
Order the outcome
The response must be at least ordinal and interpretable from low to high.
Predict more extremes
The comparison condition should plausibly increase both low-end and high-end reactions.
Check ties and shape
Heavy ties or very different distributional forms require caution and sensitivity analysis.
Good research situations
Situations needing another method
Do not select the Moses Test of Extreme Reactions merely because a normality test is significant. The Moses Test of Extreme Reactions must follow the planned extreme-response question. For a general comparison of central tendency, consider the Mann–Whitney U test, Brunner–Munzel test or a suitable t test. For any distributional difference, the two-sample Kolmogorov–Smirnov test is broader. For a symmetric two-sample scale question, compare the Ansari–Bradley test. For spread across two or more groups, the Fligner–Killeen test or Levene test may better match the goal.
How the Moses Test of Extreme Reactions works
Pool, order, locate the control endpoints, calculate the span and evaluate how unusually short it is.
The mechanics of the Moses Test of Extreme Reactions are transparent. The data from both groups are placed on one ordered line, and the statistic records the distance between the first and last control observations.
Step-by-step logic
- Combine the control and comparison observations into one pooled dataset.
- Sort the pooled outcome from the smallest response to the largest.
- Assign pooled positions from 1 through N.
- Find the smallest and largest positions occupied by the control group.
- Calculate the inclusive control span: maximum position minus minimum position plus 1.
- Under the null, compare the observed span with spans expected when nc control positions are randomly distributed among the N pooled positions.
If the comparison group owns many observations below the control minimum and above the control maximum, the control span is shorter than expected. The one-sided p-value is the probability of obtaining a control span at least as short as the observed span.
Why trimming is reported
A range-based statistic can be strongly affected by a small number of control observations. The trimmed version removes a chosen number of control observations from each end before measuring the remaining control span. IBM SPSS uses a default trimming rule based on approximately 5% of the control sample from each end; in the present analysis, that number is 11.
The trimmed Moses Test of Extreme Reactions is a sensitivity analysis. A significant untrimmed result that disappears after reasonable trimming may be driven by just a few control endpoints. Here, the conclusion remains strong after trimming: the custom span changes from 471 to 419, while SPSS reports 490 and 455, with both SPSS significance values below .001.
Rmin,c and Rmax,c are the first and last pooled positions occupied by control observations. The “+1” makes the span inclusive.
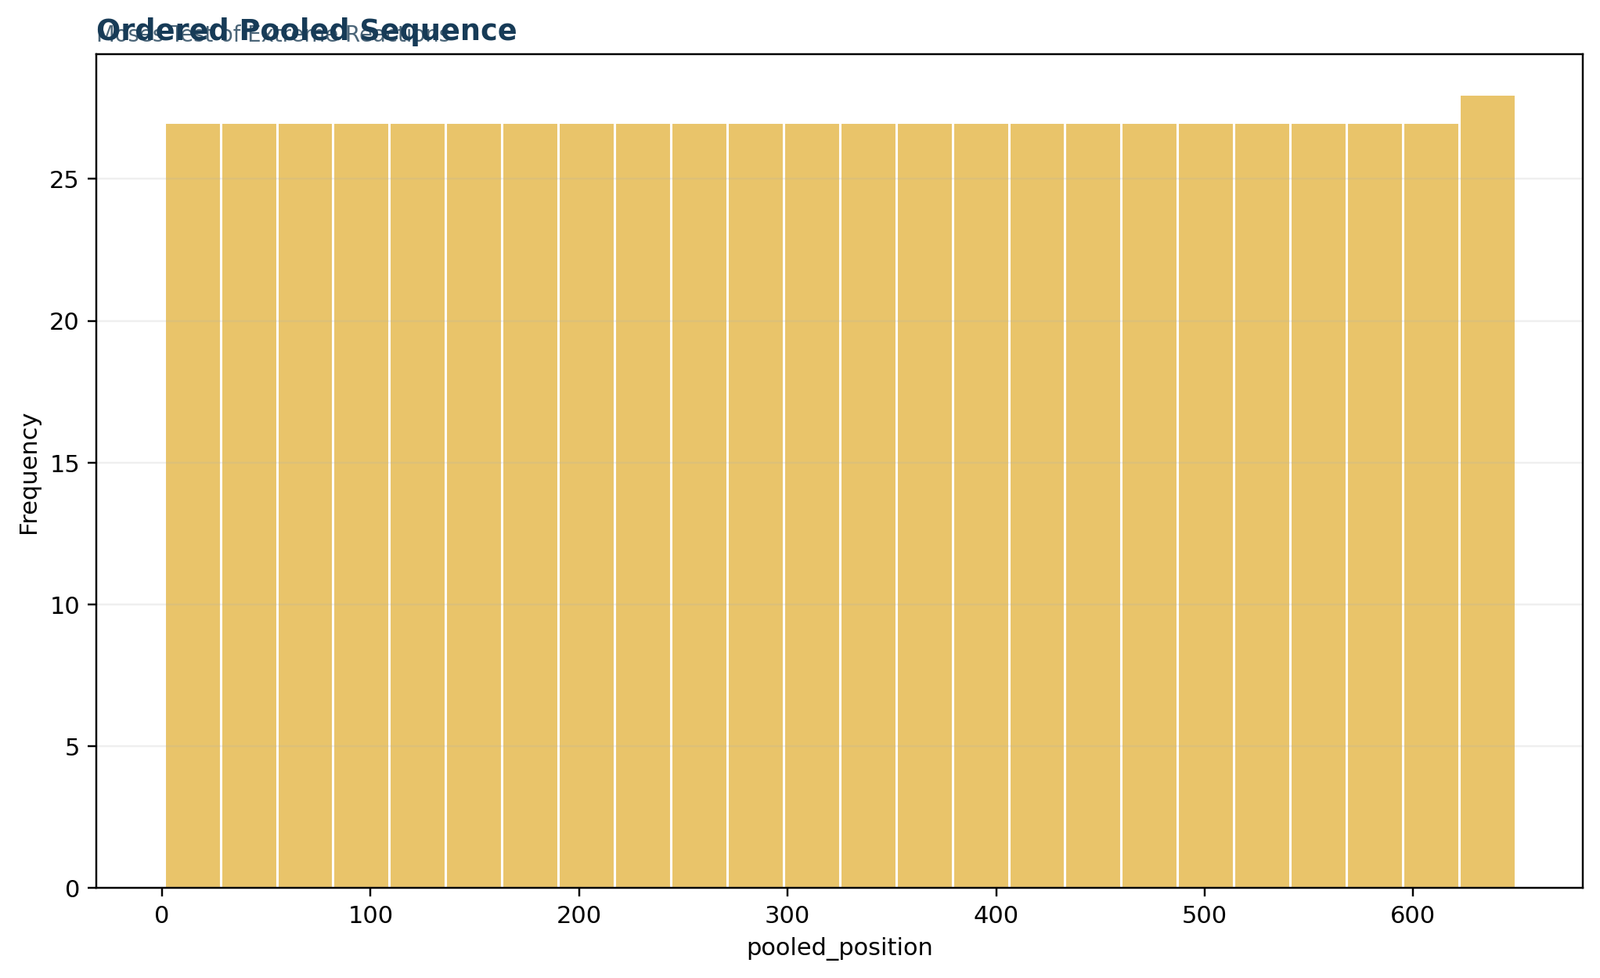
For the Moses Test of Extreme Reactions, the ordered pooled sequence chart summarizes pooled positions, not the distribution of school absences. Because positions run consecutively from 1 to 649, a frequency plot of position bins will look almost uniform by construction. It is useful as an indexing and coverage audit, but it does not by itself demonstrate a statistical effect.
Variables and data dictionary for the worked analysis
The outcome is a discrete absence count and the grouping variable defines control and comparison schools.
The worked Moses Test of Extreme Reactions uses 649 valid student records. The outcome is absences, and the school code separates MS from GP.
| Role | Variable | Coding | Meaning in this analysis | Quality check |
|---|---|---|---|---|
| Outcome | absences | Nonnegative count | Number of recorded school absences; ordered from 0 to 32. | Discrete with many ties, right-skew and several large GP values. |
| Grouping variable | school | MS / GP | Identifies the two independent schools. | Exactly two valid categories are required. |
| Control group | MS | school_n = 2 | Reference group whose pooled-order span is measured. | n = 226; minimum 0; maximum 12. |
| Comparison group | GP | school_n = 1 | Group tested for more extreme low and high responses. | n = 423; minimum 0; maximum 32. |
| Pooled index | pooled_position | 1 to 649 | Position after ordering all observations by absences and applying a deterministic tie rule. | Must be unique and complete; tie rule must be documented. |
Before running the Moses Test of Extreme Reactions, verify that the school labels are correct. A valid Moses Test of Extreme Reactions also requires a documented control code, an intentionally designated MS control group, and a numeric, sortable outcome. A swapped group code changes the direction of the test. A text-formatted count can also create lexical sorting errors, such as placing “10” before “2,” so the outcome should be stored numerically.
Moses Test of Extreme Reactions assumptions
The procedure avoids normality, but it still needs a defensible design and meaningful ordering.
The Moses Test of Extreme Reactions is distribution-free under its random-order reference model, yet “nonparametric” does not mean assumption-free. Six conditions deserve explicit attention.
1. Independent samples
Students in MS and GP must be separate observational units. The test is inappropriate for paired records, repeated measurements or clustered duplicates treated as independent. For repeated groups, consider methods such as the Friedman test when its target is appropriate.
2. Planned control designation
The control group is not interchangeable with the comparison group. The study design, policy baseline or substantive reference should determine which group is control before the outcome is inspected.
3. Ordered outcome
The outcome must support a low-to-high order. Numeric counts and continuous measurements qualify. Pure nominal categories do not. Tied ordinal categories can be analyzed by SPSS, but interpretation becomes coarser.
4. Random or representative sampling
The probability calculation treats group labels as exchangeable under the null. Convenience samples, school selection and unmeasured clustering may limit generalization beyond the observed records.
5. Comparable measurement
Absences must be recorded under comparable definitions and periods. A larger range caused by different recording windows is a measurement artifact, not an extreme-reaction effect.
6. Ties are acknowledged
The no-tie formula is cleanest for continuous outcomes. With count data, report the software convention, compare a native implementation, and avoid presenting a deterministic tie-break p-value as uniquely exact.
The Moses Test of Extreme Reactions does not require normality, and a failed Shapiro–Wilk test is not a prerequisite. The choice should be driven by the directional dispersion question. Likewise, a significant Levene test does not automatically imply that the Moses procedure is the best follow-up; Levene targets differences in spread without requiring a control-versus-comparison extreme-reaction direction.
Moses Test of Extreme Reactions hypotheses and direction
The formal alternative is directional and depends on which group is control.
For the Moses Test of Extreme Reactions, the hypotheses should describe the planned control and comparison roles rather than simply saying that two variances are unequal.
Null hypothesis, H0
The MS control group and GP comparison group have the same range/dispersion pattern under random pooled ordering. Control positions are not unusually concentrated in the center of the combined sequence.
Directional alternative, H1
GP generates more extreme responses than MS, so the first and last MS observations are closer together in the pooled order than expected under the null.
In the Moses Test of Extreme Reactions, a small p-value supports the direction specified before analysis. It does not mean that GP is “better,” “worse” or more variable in every possible sense. In this example, the practical pattern is mostly an extended upper tail: both schools have observations at 0, but GP extends to 32 while MS extends to 12. The Moses Test of Extreme Reactions nevertheless evaluates the complete pooled span arrangement, not the maximum alone.
Moses Test of Extreme Reactions formula and calculation
The no-tie reference probability follows from counting possible control-position subsets.
The exact combinatorial formula for the Moses Test of Extreme Reactions is straightforward when all pooled positions are distinct. Let N be the total sample size, nc the control sample size and S the inclusive control span.
The factor N − r + 1 counts the possible starting positions for a span of length r. After fixing the two endpoints, the remaining nc − 2 control positions can be selected from the r − 2 internal positions.
For this Moses Test of Extreme Reactions, N = 649, nc = 226 and s = 471. Substituting those values gives:
This is the deterministic Python/R no-tie reference probability. It is extremely small, but the outcome has many ties, so the native SPSS tied-data result is also reported.
Default trimming
The analysis removes 11 control observations from each tail, corresponding to approximately 5% of the 226 MS observations. If the ordered control positions are Q1 ≤ Q2 ≤ … ≤ Q226, the trimmed span uses Q12 and Q215:
The supplied custom report presents 419 as a sensitivity span. It does not provide a separate custom trimmed p-value.
Why SPSS reports different spans
Absence values such as 0, 2, 4 and 6 occur repeatedly. Within a tied block, several pooled orders are equally consistent with the observed outcome. Python and R applied a fixed deterministic order, while SPSS applies its own handling. SPSS reports 490 for the full span and 455 after trimming 11 observations at each end.
Those numbers should not be forced to match by silently changing the sort order. The honest solution is to document the conventions and emphasize the common conclusion rather than claim numerical identity.
Moses Test of Extreme Reactions worked example: school absences
MS is the control group and GP is evaluated for more extreme absence reactions.
This Moses Test of Extreme Reactions example compares the distribution of school absences across 649 students. The analysis is directional: MS is the control group, and GP is the comparison group.
| School | Role | n | Mean | SD | Median | Q1 | Q3 | Minimum | Maximum |
|---|---|---|---|---|---|---|---|---|---|
| MS | Control | 226 | 2.619 | 3.131 | 2 | 0 | 4 | 0 | 12 |
| GP | Comparison | 423 | 4.215 | 5.192 | 2 | 0 | 6 | 0 | 32 |
| Combined | Pooled | 649 | 3.660 | 4.641 | 2 | 0 | 6 | 0 | 32 |
Substantive pattern
The medians are identical at 2 absences, so the main difference is not a median shift. GP has a higher mean, larger SD, larger IQR and a much larger maximum. The upper tail is particularly important: GP reaches 32 absences, while MS stops at 12. This means that many of the largest pooled values belong to GP.
At the low end, both schools contain zeros. Because zeros are heavily tied, the exact position of the first MS observation depends on the tie rule. The custom ordering places it at pooled position 147. The Moses Test of Extreme Reactions then measures the distance to the last MS position at 617.
Verified numerical conclusion
The no-tie reference probability is 2.6781 × 10−39. The SPSS native result is also significant at p < .001 despite reporting a different tied-data span.
Reject the equal-range null in the planned direction
The Moses Test of Extreme Reactions conclusion at α = .05 is that GP displays more extreme absence responses than the MS control group. This statement is narrower and more accurate than saying that “the schools are different” or that “GP causes absences.” The design is observational, the grouping variable is school, and the test does not adjust for background variables. Any causal interpretation would require a much stronger design and additional modeling.
Moses Test of Extreme Reactions results and chart findings
Five supplied figures summarize sample sizes, pooled positions, span endpoints, group descriptives and the final result.
The chart set for the Moses Test of Extreme Reactions should be read together. Each Moses Test of Extreme Reactions figure has a different diagnostic purpose. No single figure replaces the numerical test, and two of the figures mix quantities on very different scales.
Primary metrics
The bars show control n = 226, comparison n = 423, full span = 471, 11 observations trimmed from each control tail and trimmed span = 419. The p-value is numerically tiny and therefore nearly invisible on a common linear scale.
Ordered pooled sequence
The nearly even bin counts confirm that pooled positions 1–649 were generated continuously. Because the horizontal variable is position itself, the shape is an indexing audit rather than evidence about the absence distribution.
Control-span endpoints
The decisive custom values are visible directly: first MS position 147, last MS position 617 and inclusive span 471. A shorter span supports more GP observations outside the MS control interval.
School absence summary
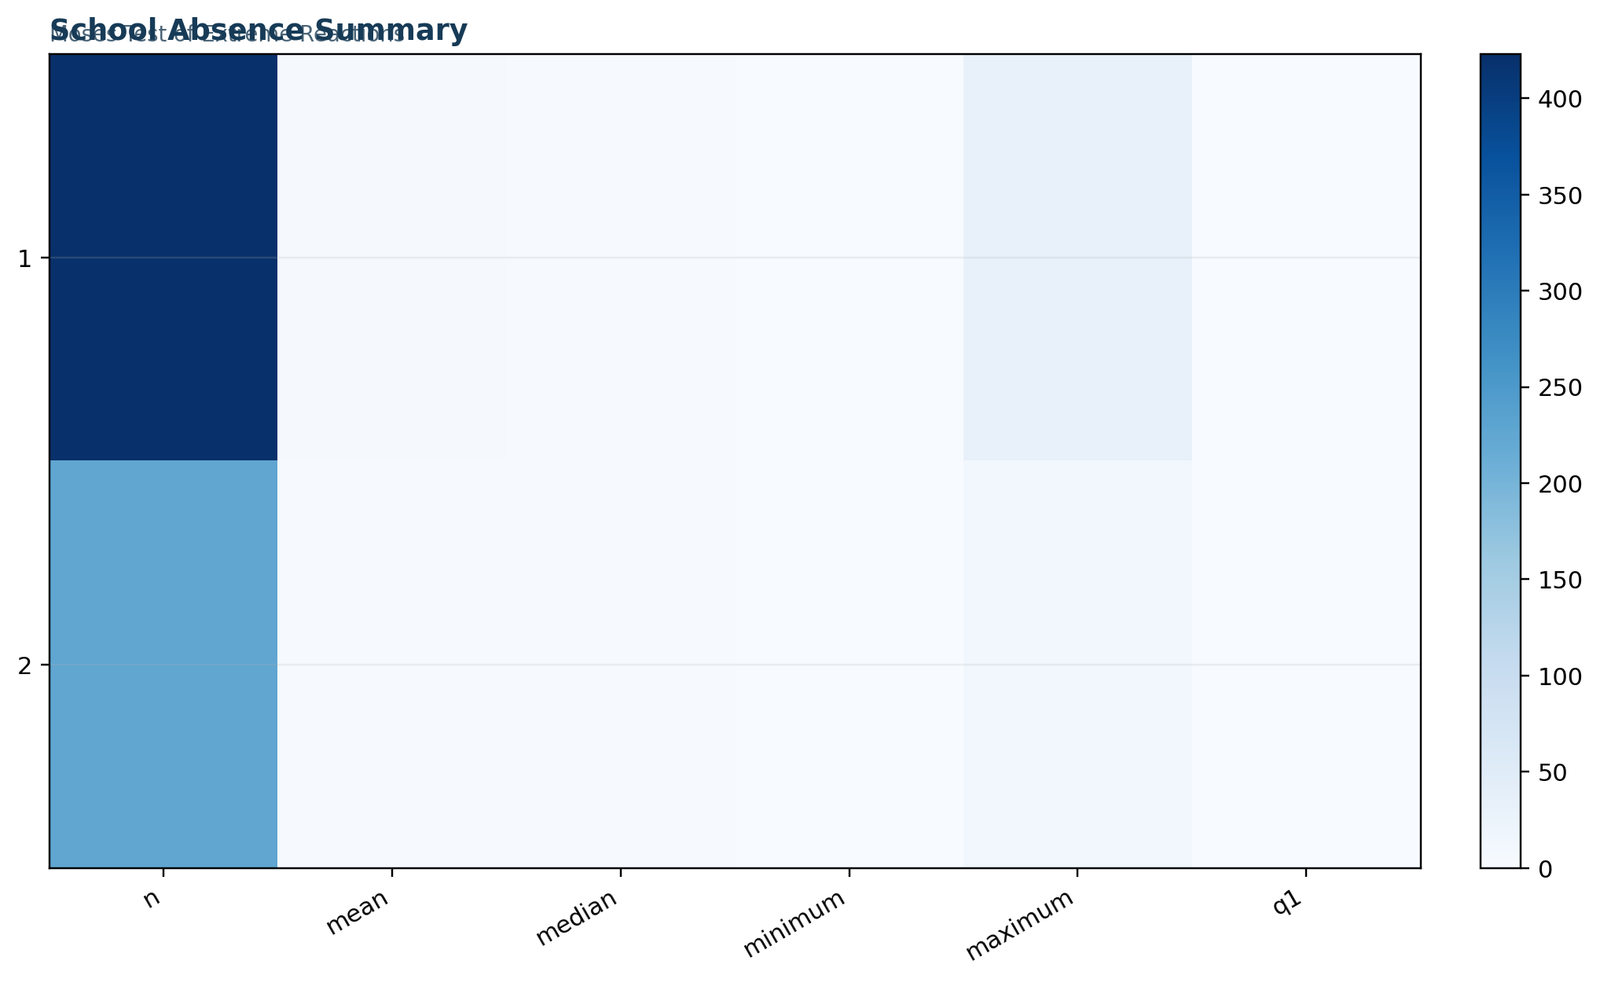
GP has n = 423, mean 4.215, median 2, minimum 0, maximum 32, Q1 = 0 and Q3 = 6. MS has n = 226, mean 2.619, median 2, minimum 0, maximum 12, Q1 = 0 and Q3 = 4.
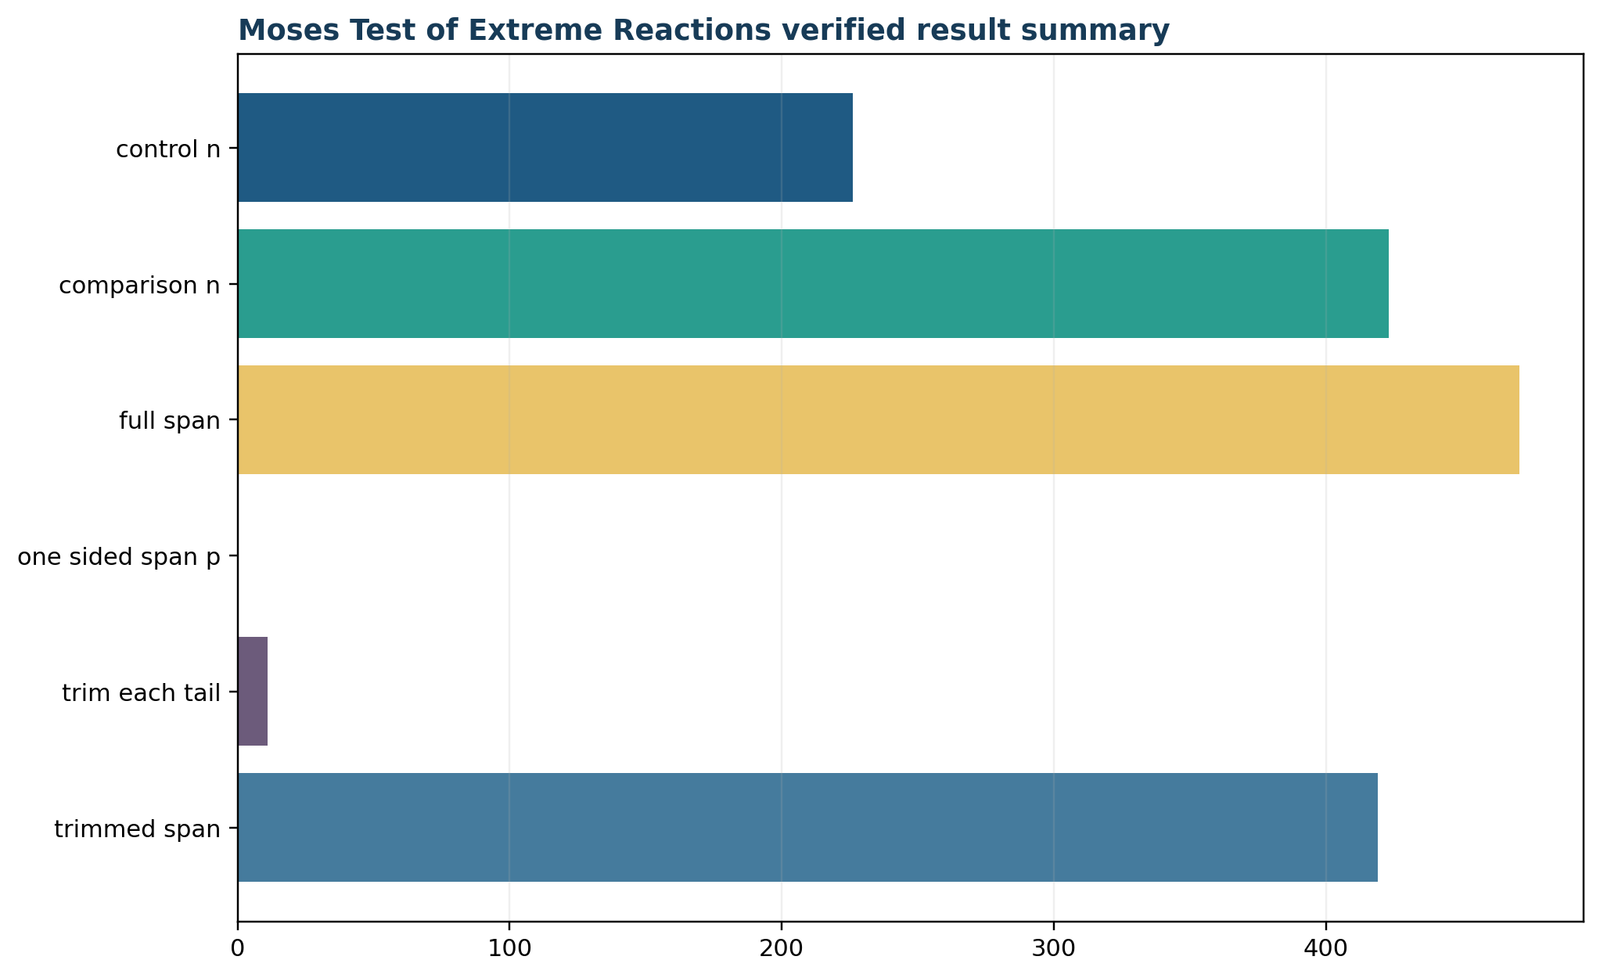
Verified result summary
The final chart repeats the key custom metrics. It confirms that the same values were used throughout the Python and R reports. Read the p-value from the accompanying text because a value near zero cannot be compared visually with counts and spans near 400.
Moses Test of Extreme Reactions in Python
A transparent custom implementation reproduces the supplied full span and no-tie reference probability.
The supplied Python analysis calculates the Moses Test of Extreme Reactions directly. This Python Moses Test of Extreme Reactions workflow avoids reliance on a black-box function. This is useful because the control definition, pooled ordering and combinatorial probability are visible.
from math import comb
import pandas as pd# df contains: absences and school ("MS" or "GP")
work = df.loc[df["school"].isin(["MS", "GP"]),
["absences", "school"]].dropna().copy()
# Predesignated roles
work["is_control"] = work["school"].eq("MS")
# Deterministic tie rule: GP first, then MS, within equal absences
work["tie_order"] = work["is_control"].astype(int)
work["source_row"] = range(len(work))
ordered = work.sort_values(
["absences", "tie_order", "source_row"],
kind="mergesort"
).reset_index(drop=True)
ordered["pooled_position"] = ordered.index + 1
control_pos = ordered.loc[
ordered["is_control"], "pooled_position"
].to_list()
N = len(ordered)
nc = len(control_pos)
first_pos = min(control_pos)
last_pos = max(control_pos)
span = last_pos - first_pos + 1
numerator = sum(
(N - r + 1) * comb(r - 2, nc - 2)
for r in range(nc, span + 1)
)
p_one_sided = numerator / comb(N, nc)
trim_each_tail = round(0.05 * nc)
trimmed = control_pos[trim_each_tail: nc - trim_each_tail]
trimmed_span = max(trimmed) - min(trimmed) + 1
print(N, nc, first_pos, last_pos, span)
print(p_one_sided, trim_each_tail, trimmed_span)
With the supplied data and tie order, the code returns N = 649, nc = 226, positions 147 and 617, S = 471, p = 2.67806279672 × 10−39, trim = 11 and Strim = 419.
What the Python code verifies
The code checks that the pooled index is complete, that MS is the control, that exactly 226 control positions are present and that the inclusive span is calculated with “+1.” It also computes the cumulative probability from integer combinations, avoiding simulation error for the no-tie reference model.
A robust script should additionally assert that the grouping variable has exactly two valid values, all outcome values are numeric, no duplicated pooled position exists and the minimum possible span is at least the control sample size.
What the Python code does not solve
It does not create a unique tied-data ordering. Changing the order of GP and MS within every tied absence count can change the endpoints and span. Therefore, the Moses Test of Extreme Reactions result should be accompanied by the native SPSS analysis or a tie-aware sensitivity strategy.
The custom p-value is a formula check under distinct positions, not a substitute for documenting ties. Readers should not round 2.68 × 10−39 to “p = 0.” Report it in scientific notation or as p < .001.
Python chart interpretation
The five Python figures use the supplied URLs shown in the previous section. The primary-metrics and verified-summary charts confirm numerical consistency; the endpoint chart displays the actual statistic; the group summary shows why GP looks more dispersed; and the pooled-position plot verifies index coverage. The Moses Test of Extreme Reactions conclusion comes from the span probability, not from visual bar height.
For related implementation skills, see data analysis in Python, outlier detection and five-number summaries.
Moses Test of Extreme Reactions in R
Base R can reproduce the custom control-span calculation and combinatorial reference p-value.
The R report matches the Python Moses Test of Extreme Reactions values. The R Moses Test of Extreme Reactions calculation returns: control n = 226, comparison n = 423, full span = 471, one-sided reference p = 2.67806279672 × 10−39, 11 observations trimmed from each control tail and trimmed span = 419.
# dat contains absences and school

x <- dat[dat$school %in% c("MS", "GP") &
!is.na(dat$absences), c("absences", "school")]x$is_control <- x$school == "MS"
x$tie_order <- as.integer(x$is_control)  # GP first within ties
x$source_row <- seq_len(nrow(x))ord <- order(x$absences, x$tie_order, x$source_row,
method = "radix")
x <- x[ord, ]
x$pooled_position <- seq_len(nrow(x))control_pos <- x$pooled_position[x$is_control]
N <- nrow(x)
nc <- length(control_pos)
first_pos <- min(control_pos)
last_pos <- max(control_pos)
span <- last_pos - first_pos + 1r <- nc:span
log_terms <- log(N - r + 1) +
lchoose(r - 2, nc - 2) -
lchoose(N, nc)
p_one_sided <- sum(exp(log_terms))trim_each_tail <- round(0.05 * nc)
kept <- control_pos[(trim_each_tail + 1):
(nc - trim_each_tail)]
trimmed_span <- max(kept) - min(kept) + 1c(N = N, control_n = nc, first = first_pos,
last = last_pos, span = span,
p = p_one_sided, trim = trim_each_tail,
trimmed_span = trimmed_span)
The logarithmic combination calculation using lchoose() avoids constructing huge integers and is numerically stable. It reproduces the supplied value to the reported precision. The R workflow uses the same deterministic tied ordering as Python, so matching numbers demonstrate cross-language reproducibility rather than independent validation of a unique tied-data statistic.
R primary metrics
The R reproduction confirms 226 MS records, 423 GP records, full span 471, trim count 11 and trimmed span 419.
R pooled-order audit
The positions cover the full 1–649 sequence. The plot is an index check, not a histogram of absence values.
R endpoint verification
The chart shows the same custom endpoints at 147 and 617 and the inclusive span of 471.
R descriptive verification
The group summaries agree with SPSS: GP has the wider upper range, larger SD and larger IQR, while both medians equal 2.
R result summary
The final chart confirms that the R report uses the same result object as the Python report.
When publishing the Moses Test of Extreme Reactions in R, include sessionInfo(), the tie-order rule and the exact group coding. General R workflows are covered in categorical data analysis in R and descriptive statistics.
Moses Test of Extreme Reactions in SPSS
SPSS provides a native implementation through the two-independent-samples legacy procedure.
The native SPSS Moses Test of Extreme Reactions is the most important tied-data cross-check. This SPSS Moses Test of Extreme Reactions analysis uses the software’s own convention. It uses MS as control and GP as comparison and reports both observed and trimmed control spans.
Menu procedure
- Choose Analyze → Nonparametric Tests → Legacy Dialogs → 2 Independent Samples.
- Move absences into the Test Variable List.
- Move the numeric school code into Grouping Variable.
- Define the control value first and the comparison value second: MS = 2, GP = 1.
- Select Moses Extreme Reactions.
- Request descriptive statistics and quartiles, then run the procedure.
SPSS syntax
NPAR TESTS

/MOSES=absences BY school_n(2,1)

/STATISTICS=DESCRIPTIVES QUARTILES.
The order (2,1) is deliberate: code 2 identifies MS as the control and code 1 identifies GP as the comparison. Reversing those values changes the hypothesis.
| SPSS output item | Value | Interpretation |
|---|---|---|
| MS control n | 226 | Number of control observations used. |
| GP comparison n | 423 | Number of comparison observations used. |
| Observed control-group span | 490 | SPSS tied-data span convention. |
| Observed significance | .000 | Report as p < .001, not p = .000. |
| Trimmed control-group span | 455 | Span after removing 11 control observations from each end. |
| Trimmed significance | .000 | The result remains significant after trimming. |
The SPSS statistic does not equal the custom Python/R statistic because tied values create multiple valid pooled orders. This discrepancy should be retained in the report rather than hidden. The strongest conclusion is not that all software must produce 471; it is that the native SPSS and transparent custom calculations both identify a highly significant GP extreme-response pattern.
For broader software guidance, use categorical data analysis in SPSS, outlier detection and box-plot interpretation.
Moses Test of Extreme Reactions in Excel
The workbook makes the pooled ordering, endpoint selection and probability calculation inspectable cell by cell.
A worked Excel file is useful for auditing the Moses Test of Extreme Reactions. The Excel Moses Test of Extreme Reactions workflow should preserve the raw data, sorted pooled sequence, control-position list, formulas and a clear tie-order note.
Import data
Place absences and school in separate columns and confirm numeric formatting.
Create role code
Assign GP = 0 and MS = 1 so GP appears first within tied values.
Sort and index
Sort by absences, role code and original row; assign positions 1–649.
Find endpoints
Use MINIFS and MAXIFS on pooled positions where school equals MS.
Calculate probability
Use the cumulative combination formula and document the no-tie limitation.
| Excel item | Example formula or value | Purpose |
|---|---|---|
| Total N | =ROWS(Pooled[absences]) | Returns 649. |
| Control n | =COUNTIF(Pooled[school],"MS") | Returns 226. |
| First control position | =MINIFS(Pooled[position],Pooled[school],"MS") | Returns 147 under the documented tie order. |
| Last control position | =MAXIFS(Pooled[position],Pooled[school],"MS") | Returns 617. |
| Full span | =LastPosition-FirstPosition+1 | Returns 471. |
| Trim count | =ROUND(ControlN*5%,0) | Returns 11. |
| Trimmed first position | =SMALL(FILTER(Pooled[position],Pooled[school]="MS"),TrimN+1) | Selects the 12th MS position. |
| Trimmed last position | =LARGE(FILTER(Pooled[position],Pooled[school]="MS"),TrimN+1) | Selects the 12th-largest MS position. |
=LET(

N,649,

nc,226,

s,471,

r,SEQUENCE(s-nc+1,,nc,1),

SUM((N-r+1)*COMBIN(r-2,nc-2))/COMBIN(N,nc)

)
The formula returns approximately 2.67806E−39. Modern Excel can represent the required combinations for these sample sizes, although a log-gamma implementation is preferable for substantially larger datasets. The workbook should label this as a no-tie reference calculation and place the SPSS result beside it.
The downloadable workbook provides the calculation for this specific Moses Test of Extreme Reactions. It should be used as a transparent worked example rather than a universal tie-adjusted calculator.
Moses Test of Extreme Reactions compared with other nonparametric tests
Different tests answer different questions even when they use the same two groups.
The Moses Test of Extreme Reactions should not be selected by name alone. Match the method to the target: extreme responses, central tendency, stochastic ordering, overall distribution or general dispersion.
| Method | Main question | Group design | Key distinction from Moses |
|---|---|---|---|
| Moses Test of Extreme Reactions | Does a comparison group create more low and high extremes than a control? | Two independent groups with planned roles | Directional and based on the pooled control span. |
| Ansari–Bradley test | Do two independent populations differ in scale? | Two independent groups | Symmetric scale test; clean interpretation generally relies on common location and comparable shape. |
| Fligner–Killeen test | Do two or more groups differ in spread? | Independent groups | General robust homogeneity-of-variance procedure without control-span direction. |
| Levene test | Do group deviations from a center differ? | Independent groups | Tests equality of spread using transformed deviations. |
| Brown–Forsythe test | Do median-centered absolute deviations differ? | Independent groups | Robust general spread test; not specifically an extreme-reaction test. |
| Mann–Whitney U test | Does one group tend to have larger observations? | Two independent groups | Targets stochastic ordering/location, not two-tailed extremes. |
| Brunner–Munzel test | Is the probability that one group exceeds the other different from .5? | Two independent groups | Stochastic superiority with fewer equal-shape requirements. |
| Two-sample K–S test | Do the empirical distributions differ anywhere? | Two independent groups | Broad distributional test, not limited to control range. |
| Mood’s median test | Do groups differ in median? | Two or more independent groups | Ignores the specific extreme-reaction pattern. |
For this school example, a median test would see identical medians and may not describe the primary difference. A Mann–Whitney analysis could detect a general upward tendency but still would not directly express the wider GP tail. The Moses Test of Extreme Reactions is attractive because the planned claim concerns GP extremes relative to MS.
Diagnostics, sensitivity checks and limitations
A trustworthy result includes tie checks, role checks, descriptive context and alternative specifications.
The most important limitation of this worked Moses Test of Extreme Reactions is not sample size. For this Moses Test of Extreme Reactions, it is the abundance of tied absence counts. A diagnostic section should make that issue visible and show whether the conclusion survives reasonable choices.
Essential sensitivity checks
Common interpretation errors
Tie-order sensitivity in this analysis
The supplied custom calculation intentionally fixes an order so Python and R can reproduce the same result. That solves computational reproducibility, but it does not turn the tied count outcome into continuous data. SPSS reports a full span 19 positions larger and a trimmed span 36 positions larger than the custom values. Despite those differences, both significance conclusions are very strong. This agreement supports robustness of the direction, but the article should retain both statistics.
Range sensitivity and trimming
A full range uses only the first and last control positions, which makes it sensitive to control outliers. The trimmed span uses more central control endpoints and is therefore less dependent on individual MS extremes. In this case, the significant SPSS finding remains after 11 control observations are trimmed from each end. That supports the claim that the GP extreme pattern is not solely an artifact of one unusual MS student.
Sampling and generalization
The Moses Test of Extreme Reactions evaluates the observed school samples. It does not account for class-level clustering, socioeconomic differences, prior achievement or other covariates. The analysis should not be generalized to all schools without considering the sampling frame. For questions involving adjusted absence counts, a count-regression model such as Poisson regression, negative binomial regression or a multilevel model may be more appropriate.
How to report the Moses Test of Extreme Reactions in APA style
State the control direction, group summaries, statistic, trimming rule, p-value convention and tied-data limitation.
An APA-style Moses Test of Extreme Reactions result should never omit which group was designated as control. It should also distinguish the native SPSS output from any custom no-tie reference calculation.
Recommended APA-style paragraph
Compact technical report
Moses Test of Extreme Reactions: MS control n = 226; GP comparison n = 423; SPSS observed span = 490, p < .001; SPSS 5%-trimmed span = 455, p < .001; custom deterministic endpoints = 147 and 617; custom span = 471; custom no-tie reference p = 2.6781 × 10−39; custom trimmed span = 419.
Reporting checklist
Do not write “the variances are unequal” unless a separate variance-focused analysis supports that exact statement. The Moses Test of Extreme Reactions establishes a directional control-span pattern. Its language should stay close to that target.
Moses Test of Extreme Reactions PDF, Excel and software downloads
Open the exact Python, R and SPSS reports or download the worked workbook.
The downloadable Moses Test of Extreme Reactions files document the same school-absence analysis. The Python and R reports match one another; the SPSS report supplies the native tied-data result; and the Excel workbook exposes the calculations.
R reportIndependent R reproduction of the custom deterministic calculation.Open R PDF →
SPSS outputNative Moses procedure with full and 5%-trimmed control spans.Open SPSS PDF →
Worked Excel filePooled sorting, control endpoints, span and transparent reference probability.Download Excel →
Moses Test of Extreme Reactions FAQs
Concise answers to the questions most likely to arise during selection, calculation and interpretation.
These frequently asked questions clarify what the Moses Test of Extreme Reactions does, how it differs from other tests and how the school-absence result should be reported.
What is the Moses Test of Extreme Reactions?
It is a nonparametric two-independent-samples test that asks whether a designated comparison group produces more extreme low and high responses than a control group. The statistic is the span between the first and last control observations in the pooled ordered data.
Is the Moses Test of Extreme Reactions a variance test?
It is often grouped with dispersion tests, but its statistic is a pooled-order control span, not a variance. Report the result as an extreme-reaction, range or control-span finding unless a separate analysis directly tests variance.
Is the test one-sided or two-sided?
The standard SPSS procedure is directional. It tests whether the comparison group has more extreme reactions than the control group. The group roles must be chosen before examining the outcome.
Why does the control group matter?
The statistic measures the control group’s pooled span. Switching control and comparison changes the statistic and the hypothesis. MS is the control in the worked analysis, and GP is tested for more extremes.
Does the Moses Test of Extreme Reactions require normal data?
No. Normality is not required. The outcome must be orderable, the groups independent and the control designation defensible. Ties still require careful treatment.
Can the test be used with ordinal data?
Yes, SPSS describes the method for ordinal or continuous variables that can be ordered. With few ordinal categories, ties may be extensive, so report the software convention and interpret the result cautiously.
What is the full control span in the worked example?
The deterministic Python/R calculation places the first MS observation at pooled position 147 and the last at 617, producing an inclusive span of 471. SPSS reports a tied-data observed span of 490.
Why do Python/R and SPSS give different spans?
The absence outcome contains many tied values. A deterministic custom order assigns specific positions inside each tied block, while SPSS uses its own convention. The values differ, but both analyses produce a highly significant directional result.
What does trimming 11 observations mean?
Approximately 5% of the 226 control observations are removed from each end of the ordered control-position list. The remaining span is less sensitive to a few control endpoints. The custom trimmed span is 419; SPSS reports 455.
Should SPSS p = .000 be reported as zero?
No. Report p < .001. The display is rounded to three decimals and does not mean the probability is mathematically zero.
What did the school-absence analysis find?
GP had more extreme absence responses than the MS control group. GP’s range was 0–32 compared with 0–12 for MS, and the native SPSS Moses result was significant at p < .001 before and after trimming.
Do equal medians contradict the result?
No. Both medians are 2, but the test concerns extremes and span rather than the median. A distribution can have the same median and a substantially wider upper tail.
What should be reported with the test statistic?
Report control and comparison labels, group sample sizes, medians, IQRs, ranges, observed span, trimmed span, trim count, one-sided p-value and the tie-handling convention.
What are the best alternatives?
Use Ansari–Bradley for a symmetric two-sample scale comparison under its assumptions, Fligner–Killeen or Brown–Forsythe for general spread differences, Mann–Whitney or Brunner–Munzel for stochastic location questions, and two-sample K–S for broad distributional differences.
Can this result be interpreted causally?
Not from the test alone. School membership was not randomly assigned in the presented analysis, and the procedure does not adjust for student characteristics. The result describes a group pattern, not a causal school effect.
Related nonparametric and dispersion guides
Continue with methods that answer neighboring questions.