
.abx-article{–ink:#102238;–muted:#52657a;–line:#dce5ed;–paper:#fff;–soft:#f4f8fb;–navy:#092a45;–teal:#0d7774;–cyan:#dff7f6;–amber:#f4a340;–amber-soft:#fff4df;–red:#a83232;–red-soft:#fff0f0;–green:#176b47;–green-soft:#e9f8f0;–violet:#6654b8;–violet-soft:#f0edff;–shadow:0 16px 45px rgba(18,44,67,.10);font-family:Inter,ui-sans-serif,system-ui,-apple-system,BlinkMacSystemFont,”Segoe UI”,Arial,sans-serif;color:var(–ink);line-height:1.72;display:block;width:100%!important;max-width:100%!important;margin:0 auto!important;background:var(–paper);font-size:17px;overflow-x:clip}
.abx-article *{box-sizing:border-box}.abx-article a{color:#075f72;text-decoration-thickness:1px;text-underline-offset:3px}.abx-article a:hover{color:#043f4c}.abx-shell{width:100%;max-width:1480px;margin:0 auto;padding:clamp(18px,2.8vw,42px)}.abx-hero{position:relative;overflow:hidden;border-radius:28px;background:linear-gradient(132deg,#07263f 0%,#0b4b61 55%,#0a7770 100%);color:#fff;padding:clamp(28px,6vw,68px);box-shadow:var(–shadow)}.abx-hero:before{content:””;position:absolute;right:-90px;top:-120px;width:360px;height:360px;border-radius:50%;background:rgba(255,255,255,.07)}.abx-hero:after{content:””;position:absolute;left:-110px;bottom:-180px;width:390px;height:390px;border-radius:50%;background:rgba(244,163,64,.10)}.abx-hero>*{position:relative;z-index:1}.abx-kicker{display:inline-flex;align-items:center;gap:9px;padding:7px 12px;border:1px solid rgba(255,255,255,.25);border-radius:999px;background:rgba(255,255,255,.09);font-size:.78rem;font-weight:800;letter-spacing:.08em;text-transform:uppercase}.abx-kicker i{width:9px;height:9px;border-radius:50%;background:#ffbd62;box-shadow:0 0 0 5px rgba(255,189,98,.16)}.abx-hero h1{font-size:clamp(2.15rem,5.2vw,4.65rem);line-height:1.04;letter-spacing:-.045em;margin:22px 0 18px;max-width:1000px;color:#fff}.abx-hero .abx-lead{font-size:clamp(1.05rem,2vw,1.34rem);max-width:900px;color:#e9f7fb;margin:0}.abx-badges{display:flex;flex-wrap:wrap;gap:10px;margin-top:25px}.abx-badge{padding:8px 12px;border-radius:999px;background:rgba(255,255,255,.11);border:1px solid rgba(255,255,255,.19);font-size:.84rem;font-weight:750}.abx-hero-result{margin-top:28px;display:grid;grid-template-columns:repeat(4,minmax(0,1fr));gap:12px}.abx-hero-metric{background:rgba(255,255,255,.10);border:1px solid rgba(255,255,255,.16);border-radius:16px;padding:14px}.abx-hero-metric span{display:block;color:#cdeaf0;font-size:.78rem;text-transform:uppercase;letter-spacing:.05em;font-weight:800}.abx-hero-metric strong{display:block;margin-top:4px;font-size:1.28rem;color:#fff}.abx-ad{display:flex;align-items:center;justify-content:center;min-height:96px;margin:26px 0;border:1px dashed #b8c6d1;border-radius:18px;background:#f8fafc;color:#718096;font-size:.78rem;letter-spacing:.14em;text-transform:uppercase}.abx-quick{display:grid;grid-template-columns:1.35fr .65fr;gap:20px;margin:28px 0}.abx-card{min-width:0;max-width:100%;border:1px solid var(–line);border-radius:22px;background:#fff;box-shadow:0 10px 30px rgba(21,48,70,.06);padding:clamp(19px,3vw,30px)}.abx-card h2,.abx-card h3{margin-top:0}.abx-answer{background:linear-gradient(145deg,#f2fbfa,#fff);border-color:#bfe5e2}.abx-answer .abx-verdict{display:inline-flex;align-items:center;gap:9px;padding:8px 12px;border-radius:999px;background:var(–green-soft);color:var(–green);font-weight:850;font-size:.84rem}.abx-answer .abx-verdict:before{content:”✓”;display:grid;place-items:center;width:22px;height:22px;border-radius:50%;background:var(–green);color:#fff}.abx-answer h2{font-size:clamp(1.55rem,3vw,2.25rem);line-height:1.15;margin:15px 0 10px}.abx-mini-table{display:grid;gap:10px}.abx-mini-row{display:flex;justify-content:space-between;gap:20px;padding:11px 0;border-bottom:1px solid var(–line)}.abx-mini-row:last-child{border-bottom:0}.abx-mini-row span{color:var(–muted)}.abx-mini-row strong{text-align:right}.abx-toc{margin:26px 0;border-radius:22px;background:var(–navy);color:#fff;padding:24px}.abx-toc h2{color:#fff;margin:0 0 14px;font-size:1.2rem}.abx-toc-grid{display:grid;grid-template-columns:repeat(3,minmax(0,1fr));gap:8px 20px}.abx-toc a{color:#d9f6f5;text-decoration:none;padding:7px 0;display:block;border-bottom:1px solid rgba(255,255,255,.12)}.abx-toc a:hover{color:#fff}.abx-section{scroll-margin-top:24px;margin:54px 0}.abx-section-head{display:grid;grid-template-columns:auto 1fr;align-items:start;gap:14px;margin-bottom:20px}.abx-num{width:42px;height:42px;border-radius:13px;background:var(–navy);color:#fff;display:grid;place-items:center;font-weight:900}.abx-section-head h2{margin:0;font-size:clamp(1.65rem,3.4vw,2.65rem);line-height:1.15;letter-spacing:-.025em}.abx-section-head p{grid-column:2;margin:5px 0 0;color:var(–muted);max-width:920px}.abx-grid-2{display:grid;grid-template-columns:repeat(2,minmax(0,1fr));gap:20px}.abx-grid-2>*,.abx-grid-3>*,.abx-grid-4>*,.abx-chart-grid>*,.abx-downloads>*,.abx-related>*,.abx-quick>*{min-width:0}.abx-grid-3{display:grid;grid-template-columns:repeat(3,minmax(0,1fr));gap:18px}.abx-grid-4{display:grid;grid-template-columns:repeat(4,minmax(0,1fr));gap:14px}.abx-callout{border-radius:18px;padding:18px 20px;border-left:5px solid var(–teal);background:var(–cyan);margin:20px 0}.abx-callout strong{color:#084f4c}.abx-warning{border-left-color:var(–red);background:var(–red-soft)}.abx-warning strong{color:var(–red)}.abx-note{border-left-color:var(–amber);background:var(–amber-soft)}.abx-note strong{color:#875311}.abx-formula{border:1px solid #cbd8e3;background:linear-gradient(180deg,#fff,#f7fafc);border-radius:20px;padding:22px;margin:18px 0;text-align:center;overflow:visible}.abx-formula .eq{font-family:”Cambria Math”,”Times New Roman”,serif;font-size:clamp(1.08rem,2.2vw,1.5rem);white-space:normal;overflow-wrap:anywhere;word-break:normal;line-height:1.55}.abx-formula p{margin:8px auto 0;color:var(–muted);max-width:850px;text-align:left;font-size:.94rem}.abx-pill-list{display:flex;flex-wrap:wrap;gap:10px;margin:15px 0}.abx-pill{background:var(–soft);border:1px solid var(–line);border-radius:999px;padding:8px 12px;font-weight:750;font-size:.88rem}.abx-flow{display:grid;grid-template-columns:repeat(5,minmax(0,1fr));gap:10px;counter-reset:flow}.abx-step{position:relative;padding:18px 14px 16px;border:1px solid var(–line);border-radius:18px;background:#fff;min-height:148px}.abx-step:before{counter-increment:flow;content:counter(flow);display:grid;place-items:center;width:30px;height:30px;border-radius:10px;background:var(–teal);color:#fff;font-weight:900;margin-bottom:10px}.abx-step h3{font-size:1rem;margin:0 0 6px}.abx-step p{font-size:.9rem;color:var(–muted);margin:0}.abx-table-wrap{min-width:0;max-width:100%;overflow-x:auto;border:1px solid var(–line);border-radius:18px;background:#fff}.abx-table{width:100%;border-collapse:collapse;min-width:720px}.abx-table.abx-compact{min-width:0}.abx-table th{background:var(–navy);color:#fff;text-align:left;padding:13px 14px;font-size:.85rem;letter-spacing:.02em}.abx-table td{padding:13px 14px;border-bottom:1px solid var(–line);vertical-align:top}.abx-table tbody tr:nth-child(even){background:#f8fafc}.abx-table tbody tr:last-child td{border-bottom:0}.abx-stat-grid{display:grid;grid-template-columns:repeat(4,minmax(0,1fr));gap:12px;margin:16px 0}.abx-stat{border:1px solid var(–line);border-radius:16px;padding:16px;background:#fff}.abx-stat span{display:block;color:var(–muted);font-size:.78rem;font-weight:800;text-transform:uppercase;letter-spacing:.05em}.abx-stat strong{display:block;font-size:1.34rem;margin-top:4px}.abx-stat small{display:block;color:var(–muted);margin-top:4px}.abx-result-panel{border-radius:22px;background:linear-gradient(145deg,#082c47,#0b5966);color:#fff;padding:26px}.abx-result-panel h3{color:#fff;margin-top:0;font-size:1.45rem}.abx-result-panel p{color:#e5f6f7}.abx-result-panel .abx-result-big{font-size:clamp(2rem,5vw,3.7rem);line-height:1;font-weight:950;color:#fff;margin:10px 0}.abx-result-panel .abx-result-tag{display:inline-block;padding:8px 12px;border-radius:999px;background:rgba(255,255,255,.12);border:1px solid rgba(255,255,255,.18);font-weight:800}.abx-figure{min-width:0;max-width:100%;margin:0;border:1px solid var(–line);border-radius:22px;overflow:hidden;background:#fff;box-shadow:0 10px 30px rgba(21,48,70,.06)}.abx-figure img{display:block;width:100%;height:auto;background:#f3f6f8}.abx-figure figcaption{padding:18px 20px}.abx-figure h3{font-size:1.08rem;margin:0 0 6px}.abx-figure p{margin:0;color:var(–muted);font-size:.94rem}.abx-chart-grid{display:grid;grid-template-columns:repeat(2,minmax(0,1fr));gap:20px}.abx-chart-grid .abx-wide{grid-column:1/-1}.abx-code{min-width:0;max-width:100%;position:relative;background:#071d2d;color:#e6f2f7;border-radius:18px;overflow:auto;padding:20px;margin:16px 0;box-shadow:inset 0 0 0 1px rgba(255,255,255,.07)}.abx-code code{display:block;white-space:pre;min-width:max-content;font-family:”SFMono-Regular”,Consolas,”Liberation Mono”,monospace;font-size:.88rem;line-height:1.65}.abx-code-label{display:inline-block;margin-bottom:8px;color:#7ee7db;font-size:.76rem;font-weight:900;letter-spacing:.08em;text-transform:uppercase}.abx-downloads{display:grid;grid-template-columns:repeat(4,minmax(0,1fr));gap:14px}.abx-download{display:flex;flex-direction:column;min-height:190px;padding:20px;border-radius:20px;border:1px solid var(–line);background:#fff;text-decoration:none!important;color:var(–ink)!important;box-shadow:0 10px 30px rgba(21,48,70,.06);transition:.2s transform,.2s box-shadow}.abx-download:hover{transform:translateY(-3px);box-shadow:0 16px 38px rgba(21,48,70,.12)}.abx-file-icon{width:46px;height:46px;border-radius:14px;display:grid;place-items:center;background:var(–violet-soft);color:var(–violet);font-weight:950;margin-bottom:16px}.abx-download strong{font-size:1.05rem}.abx-download span{color:var(–muted);font-size:.88rem;margin-top:6px}.abx-download em{margin-top:auto;padding-top:16px;color:#075f72;font-style:normal;font-weight:850}.abx-checks{display:grid;gap:10px}.abx-check{position:relative;padding:13px 14px 13px 44px;border:1px solid var(–line);border-radius:15px;background:#fff}.abx-check:before{content:”✓”;position:absolute;left:14px;top:13px;width:22px;height:22px;border-radius:50%;display:grid;place-items:center;background:var(–green-soft);color:var(–green);font-weight:950}.abx-faq details{border:1px solid var(–line);border-radius:17px;background:#fff;margin:11px 0;overflow:hidden}.abx-faq summary{cursor:pointer;font-weight:850;padding:17px 20px;list-style:none}.abx-faq summary::-webkit-details-marker{display:none}.abx-faq summary:after{content:”+”;float:right;color:var(–teal);font-size:1.4rem;line-height:1}.abx-faq details[open] summary:after{content:”−”}.abx-faq .abx-faq-answer{padding:0 20px 18px;color:var(–muted)}.abx-related{display:grid;grid-template-columns:repeat(3,minmax(0,1fr));gap:12px}.abx-related a{display:block;border:1px solid var(–line);border-radius:15px;padding:14px 16px;background:#fff;text-decoration:none;font-weight:800}.abx-footer-note{border-radius:22px;background:var(–soft);border:1px solid var(–line);padding:22px;color:var(–muted)}.abx-back{display:inline-flex;align-items:center;gap:8px;border-radius:999px;background:var(–navy);color:#fff!important;text-decoration:none!important;padding:11px 16px;font-weight:850;margin-top:18px}.abx-sr{position:absolute!important;width:1px!important;height:1px!important;padding:0!important;margin:-1px!important;overflow:hidden!important;clip:rect(0,0,0,0)!important;white-space:nowrap!important;border:0!important}
@media(max-width:960px){.abx-hero-result,.abx-grid-4,.abx-stat-grid,.abx-downloads{grid-template-columns:repeat(2,minmax(0,1fr))}.abx-toc-grid,.abx-grid-3,.abx-related{grid-template-columns:repeat(2,minmax(0,1fr))}.abx-flow{grid-template-columns:repeat(2,minmax(0,1fr))}.abx-flow .abx-step:last-child{grid-column:1/-1}.abx-quick{grid-template-columns:1fr}}
@media(max-width:680px){.abx-article{font-size:16px;width:100%!important;max-width:100%!important;margin:0 auto!important}.abx-shell{padding:12px}.abx-hero{border-radius:20px;padding:26px 20px}.abx-hero h1{font-size:2.2rem}.abx-hero-result,.abx-grid-2,.abx-grid-3,.abx-grid-4,.abx-stat-grid,.abx-downloads,.abx-chart-grid,.abx-toc-grid,.abx-related,.abx-flow{grid-template-columns:1fr}.abx-chart-grid .abx-wide,.abx-flow .abx-step:last-child{grid-column:auto}.abx-card{border-radius:18px;padding:18px}.abx-section{margin:42px 0}.abx-section-head{grid-template-columns:36px 1fr;gap:11px}.abx-num{width:36px;height:36px}.abx-section-head p{grid-column:1/-1}.abx-table{min-width:650px}.abx-formula{padding:18px 12px;text-align:left}.abx-formula .eq{font-size:1.05rem}.abx-mini-row{align-items:flex-start;flex-direction:column;gap:2px}.abx-mini-row strong{text-align:left}}
.abx-seo-context{font-size:1.02rem;color:#31475d;margin:-5px 0 20px;max-width:1180px}
.abx-model{display:grid;grid-template-columns:1.05fr .95fr;gap:20px;align-items:stretch}
.abx-model .abx-card{height:100%}
.abx-hypothesis{border:1px solid var(–line);border-radius:18px;padding:20px;background:#fff}
.abx-hypothesis h3{margin:0 0 10px}
.abx-direction{display:grid;grid-template-columns:repeat(3,minmax(0,1fr));gap:12px;margin:16px 0}
.abx-direction>div{border:1px solid var(–line);border-radius:16px;padding:16px;background:var(–soft)}
.abx-keyword-box{border:1px solid #b9d8e2;border-radius:20px;background:linear-gradient(145deg,#eff9fc,#fff);padding:22px;margin:22px 0}
.abx-keyword-box h3{margin-top:0}
.abx-equation-lines{display:grid;gap:10px;text-align:left}
.abx-equation-line{display:grid;grid-template-columns:minmax(140px,.38fr) 1fr;gap:16px;align-items:start;padding:10px 0;border-bottom:1px solid var(–line)}
.abx-equation-line:last-child{border-bottom:0}
.abx-equation-line strong{color:var(–navy)}
@media(max-width:900px){.abx-model,.abx-direction{grid-template-columns:1fr}.abx-equation-line{grid-template-columns:1fr;gap:4px}}
body:has(.abx-article) .site-main>article>.entry-header,
body:has(.abx-article) main>article>.entry-header,
body:has(.abx-article) .single-post-header,
body:has(.abx-article) .single-entry-header,
body:has(.abx-article) .post-header:not(.abx-hero),
body:has(.abx-article) .post-hero:not(.abx-hero),
body:has(.abx-article) .page-header:has(.entry-title),
body:has(.abx-article) .page-header:has(.page-title),
body:has(.abx-article) .wp-block-post-title,
body:has(.abx-article) h1.entry-title,
body:has(.abx-article) h1.post-title,
body:has(.abx-article) h1.page-title,
body:has(.abx-article) .single-post-title{display:none!important}
body:has(.abx-article) .site-content,
body:has(.abx-article) .content-sidebar-wrap,
body:has(.abx-article) .site-grid,
body:has(.abx-article) .main-content-wrap{display:block!important;grid-template-columns:minmax(0,1fr)!important;width:100%!important;max-width:none!important;margin-left:auto!important;margin-right:auto!important}
body:has(.abx-article) #primary,
body:has(.abx-article) .content-area,
body:has(.abx-article) .site-main,
body:has(.abx-article) main.site-main,
body:has(.abx-article) .main-content,
body:has(.abx-article) .entry-content:has(.abx-article){float:none!important;flex:0 0 100%!important;width:100%!important;max-width:none!important;margin-left:auto!important;margin-right:auto!important;margin-top:0!important;padding-top:0!important}
body:has(.abx-article) #secondary,
body:has(.abx-article) .widget-area,
body:has(.abx-article) aside.sidebar,
body:has(.abx-article) .content-sidebar{display:none!important}
body:has(.abx-article) .abx-shell{width:min(1480px,100%)!important;max-width:1480px!important;margin-left:auto!important;margin-right:auto!important}
body:has(.abx-article) .abx-hero{width:100%!important;margin-left:auto!important;margin-right:auto!important}
Kendall’s W Test: 7 Essential Steps, Formula and Worked Example
The Kendall’s W test measures concordance when several judges, blocks, subjects, or repeated measurements rank the same set of items or conditions. This complete guide explains the Kendall’s coefficient of concordance formula, ties, significance testing, effect-size interpretation, and a worked analysis of G1, G2, and G3 grades for 649 students, with detailed Python, R, SPSS, and Excel workflows.
Repeated or blocked rankings
Range: 0 to 1
Tie-corrected
Python + R + SPSS + Excel
The grade occasions differed significantly, but the level of concordance was weak.
In this worked Kendall’s W test example, every student formed a complete block containing G1, G2, and G3. The three grades were ranked within each student, ties received average ranks, and those ranks were combined across 649 students. The Friedman statistic was χ²(2) = 167.3283 with p = 4.625 × 10−37. The corresponding coefficient of concordance was W = 0.128912.
What does Kendall’s W test measure?
A single coefficient summarizing how consistently several judges or blocks rank the same items.
The Kendall’s W test, also called Kendall’s coefficient of concordance, measures agreement across multiple rankings. It is used when the same items, treatments, candidates, occasions, or variables are ranked by several judges or observed within several complete blocks. The coefficient ranges from 0, representing no systematic concordance, to 1, representing complete agreement in rank ordering.
The concordance question
Suppose several judges rank the same products. If every judge places the products in exactly the same order, Kendall’s W equals 1. If the judges’ rank orders show no consistent pattern, W approaches 0. The same mathematics applies to repeated-measures data when each subject acts as a block and ranks the repeated conditions according to the subject’s observed values.
In the grade example, each student effectively ranks G1, G2, and G3 from lowest to highest. The Kendall’s W test asks whether students show a consistent ordering of those three occasions. Because G3 tends to receive the highest within-student rank, the observed rank sums are not equal.
Agreement, effect size, and significance
Kendall’s W serves two related roles. In an inter-rater design, it is a coefficient of agreement. In a Friedman repeated-measures design, it is commonly reported as a rank-based effect size. The significance test is derived from the same rank information as the Friedman test, but the coefficient and the p-value answer different questions.
The p-value from the Kendall’s W test addresses whether the observed ordering could plausibly arise under the null hypothesis of equal rank positions. W describes the strength of concordance on a standardized 0-to-1 scale. This distinction parallels the broader difference between p-values and effect sizes.
When should Kendall’s W test be used?
Use it when the same items are ranked repeatedly and the goal is concordance or a Friedman effect size.
The Kendall’s W test fits designs with multiple judges, repeated observations, matched blocks, or panel members ranking the same objects. The method is especially useful for ordinal rankings and for continuous values that can be converted to ranks within each block.
Common items?
Every judge or block must evaluate the same set of items or conditions.
Three or more items?
Kendall’s W is most informative when at least three items or repeated conditions are ranked.
Independent judges or blocks?
The judges or subject blocks should be independent of one another.
Rankable responses?
Ordinal ratings or numeric observations must support meaningful within-block ranking.
Agreement question?
The scientific aim should concern concordance, consistency, or repeated-condition effect size.
Common applications
The repeated-measures role is related to repeated-measures ANOVA, but Kendall’s W is based on ranks rather than a normal-theory variance model.
Designs requiring another statistic
Kendall’s W test assumptions and data requirements
The method is nonparametric, but the ranking design must be valid.
The assumptions behind the Kendall’s W test concern the structure of the rankings rather than normality. Correct interpretation depends on a common item set, independent judges or blocks, meaningful rank order, and transparent handling of ties and missing values.
Common item set
Every judge or block ranks the same k items or conditions. In the worked analysis, each of the 649 students has G1, G2, and G3.
Independent blocks
One student’s ranking is treated as independent of another student’s ranking. Clustered or nested judges require a more complex design.
Ordinal meaning
The responses must support a defensible order. Numeric grades clearly satisfy this requirement.
Complete rankings
The classical calculation uses a complete block for every judge. Missing conditions reduce the usable sample or require a specialized approach.
Ties recorded honestly
Equal values receive average ranks. The denominator must be corrected for the information lost through ties.
Comparable interpretation
The items should be meaningfully comparable. Rankings of unrelated constructs can be mathematically possible but scientifically unhelpful.
Kendall’s W test hypotheses, variables, and block structure
The null hypothesis can be framed as no concordance or no systematic occasion ordering.
The Kendall’s W test can appear in two closely related designs. In a rater study, the null states that the judges do not show concordant rankings beyond chance. In a Friedman repeated-measures study, the null states that the repeated conditions have equal rank distributions. Both forms use the same within-block ranking structure.
General concordance hypotheses
H0: the judges or blocks show no systematic concordance in their rankings of the k items.
H1: the rankings contain systematic concordance greater than expected under the null.
The significance component of the Kendall’s W test evaluates whether the observed rank sums are more unequal than would be expected if the item orderings were random.
Applied grade hypotheses
H0: G1, G2, and G3 have equal expected within-student ranks.
H1: at least one grade occasion has a different expected within-student rank.
Rejecting the null indicates a systematic occasion pattern. The coefficient W then quantifies how strongly students agree on that ordering.
649 students
G1, G2, and G3
G3 > G2 > G1 by mean rank
Kendall’s W test formula and tie correction
The coefficient standardizes the dispersion of item rank sums relative to the maximum possible dispersion.
The Kendall’s W test formula begins with ranks assigned inside every judge or block. Those ranks are summed for each item, compared with their common expected rank sum, and standardized to a 0-to-1 scale. A tie correction modifies the denominator when equal values receive average ranks.
Notation
Rank-sum dispersion
If the items receive similar rank sums, S is small. If the same items repeatedly receive high or low ranks, the rank sums separate and S increases.
Tie-corrected coefficient
For each block i, Ti is the sum of t3 − t across tied groups of size t. When no ties occur, the tie term is zero and the denominator reduces to m²(k³ − k).
Connection with the Friedman statistic
This identity is the reason Kendall’s W is widely reported as an effect size for the Friedman test. The same tie-corrected rank structure produces both the omnibus statistic and the standardized coefficient.
Block example 1: one low value and a top tie
For a student with G1 = 0, G2 = 11, and G3 = 11, the within-block ranks are 1, 2.5, 2.5. The two equal grades form a tied group of size 2, contributing 2³ − 2 = 6 to the tie term. The Kendall’s W test retains the information that G1 is lower while avoiding an arbitrary order between G2 and G3.
Block example 2: a low tie and one high value
For G1 = 12, G2 = 13, and G3 = 12, the ranks are 1.5, 3, 1.5. G2 receives the top rank, while G1 and G3 share the two lower positions. This block also contributes 6 to the tie term. Repeating this scoring logic across all students produces the item rank sums used by the Kendall’s W test.
Block example 3: complete tie
For G1 = G2 = G3 = 14, every occasion receives rank 2. A tied group of size 3 contributes 3³ − 3 = 24. This row contains no information about occasion ordering, but it remains a valid observation. The tie-corrected Kendall’s W test appropriately reduces the maximum possible concordance denominator.
Kendall’s W test example using G1, G2, and G3
The worked example uses 649 complete student blocks and three grade occasions.
This Kendall’s W test example follows each student’s grades across three occasions. Every row contains G1, G2, and G3, so no block is missing a condition. Within each row, the smallest grade receives rank 1, the largest receives rank 3, and tied grades receive average ranks.
Variables used
| Role | Variable | Meaning |
|---|---|---|
| Block | Student | Each student contributes one complete three-occasion ranking. |
| Item 1 | G1 | First-period grade. |
| Item 2 | G2 | Second-period grade. |
| Item 3 | G3 | Final grade. |
| Sample size | m | 649 complete blocks. |
Raw descriptive statistics
| Occasion | Mean | Median | SD | IQR | Range |
|---|---|---|---|---|---|
| G1 | 11.3991 | 11 | 2.7453 | 3 | 0–19 |
| G2 | 11.5701 | 11 | 2.9136 | 3 | 0–19 |
| G3 | 11.9060 | 12 | 3.2307 | 4 | 0–19 |
Exact Kendall’s W test calculation
The workbook exposes every numerical component of the coefficient.
The exact Kendall’s W test calculation is especially transparent in this example because the number of items is only three. The rank sums, expected rank sum, squared deviations, tie term, Friedman statistic, and final W value can all be checked directly.
Step 1: calculate the rank-sum dispersion
G3 contributes the largest squared deviation because its rank sum is 221 points above the common expectation. G1 is 155 points below the expectation, and G2 is 66 points below.
Step 2: apply the tie correction
The substantial reduction in the denominator reflects the many equal-grade patterns. Without the correction, the coefficient would be understated because tied blocks contain less ranking information than fully ordered blocks.
The coefficient is approximately 0.129. It is much closer to 0 than to 1, so the occasion ordering is statistically systematic but not highly concordant.
Significance test
p = 4.625 × 10−37
The Friedman chi-square can be reconstructed from W: 649 × (3 − 1) × 0.1289123863 = 167.3283. The p-value is extremely small, so equal expected ranks are rejected.
Complete rank-pattern frequency table
| Within-student ordering | Students | Percent | Contribution to the overall Kendall’s W test pattern |
|---|---|---|---|
| G1 < G2 = G3 | 131 | 20.2% | Supports G1 as the lowest occasion and shares the top position between G2 and G3. |
| G1 < G2 < G3 | 95 | 14.6% | Provides the clearest strict support for the aggregate G1-to-G3 increase. |
| G1 = G2 = G3 | 89 | 13.7% | Contains no ordering information and creates the largest within-block tie correction. |
| G1 = G2 < G3 | 83 | 12.8% | Places G3 above the tied earlier occasions. |
| G2 < G1 = G3 | 69 | 10.6% | Places G2 lowest and weakens a universal increasing-order interpretation. |
| G2 = G3 < G1 | 67 | 10.3% | Places G1 highest and directly opposes the average rank direction. |
| G1 = G3 < G2 | 27 | 4.2% | Places G2 alone at the top. |
| G2 < G3 < G1 | 24 | 3.7% | Strictly orders G1 highest and G2 lowest. |
| G2 < G1 < G3 | 19 | 2.9% | Still places G3 highest but reverses G1 and G2. |
| G3 < G1 = G2 | 17 | 2.6% | Places G3 lowest and the earlier grades together at the top. |
| G1 < G3 < G2 | 16 | 2.5% | Places G2 highest while retaining G1 as lowest. |
| G3 < G2 < G1 | 8 | 1.2% | Strictly reverses the dominant average ordering. |
| G3 < G1 < G2 | 4 | 0.6% | Places G2 highest and G3 lowest. |
The frequency table gives the single coefficient a concrete behavioral meaning. A majority of students do not follow one identical strict sequence. Instead, the Kendall’s W test aggregates several partially consistent patterns, many of which include ties. The most common patterns favor G3, but substantial counter-patterns keep W at 0.1289 rather than producing strong concordance.
Kendall’s W test interpretation
Statistical significance and concordance magnitude must be read together.
A strong Kendall’s W test interpretation reports both W and the significance test. The coefficient indicates the strength of concordance, while the p-value indicates whether the observed rank-sum pattern is unlikely under the null hypothesis.
What W = 0.1289 means
The coefficient is about 12.9% of the distance from no concordance to perfect concordance. It should not be described as 12.9% of variance explained. In this dataset, “weak concordance” or “limited agreement about the occasion ordering” is a defensible description.
What the tiny p-value means
The probability of obtaining rank-sum separation this large under equal expected ranks is extremely small. Because the sample contains 649 blocks, even a modest standardized effect can produce very strong evidence against the null.
What the direction means
G3 has the highest mean rank, G2 is intermediate, and G1 is lowest. The omnibus result shows that the ordering is systematic, but W indicates that individual students do not all follow the same pattern.
Observed rank-pattern diversity
The most common pattern was G1 < G2 = G3, observed for 131 students. A strict increase G1 < G2 < G3 occurred for 95 students. Another 89 students had identical grades across all three occasions, and 83 students had G1 = G2 < G3. The remaining students followed nine other patterns. This diversity explains why the mean ordering is clear while W remains far below 1.
A contextual Kendall’s W test interpretation scale
| W position | Contextual reading | Reporting principle |
|---|---|---|
| W = 0 | No systematic concordance in the item rank sums. | Describe the rankings as showing no aggregate agreement beyond the null structure. |
| Values near 0 | Limited or weak concordance. | Emphasize heterogeneous judge or block patterns and avoid equating significance with strength. |
| Middle of the scale | Meaningful but incomplete concordance. | Interpret with discipline-specific standards, item count, tie frequency, and practical consequences. |
| Values near 1 | Strong or near-complete concordance. | Confirm that the high value is not produced by a coding artifact or duplicated rankings. |
| W = 1 | Perfect concordance. | Every judge or block assigns the same ordering, subject to the defined tie pattern. |
The current Kendall’s W test value of 0.1289 belongs near the low end of the scale. A weak-concordance description follows directly from its mathematical position and the observed thirteen rank patterns. Fixed labels should remain secondary to the actual design and research context.
Kendall’s W test in Python: chart-by-chart results
The Python figures connect the coefficient, occasion ranks, subject patterns, and final inference.
A practical Kendall’s W test in Python can use a tie-corrected Friedman statistic and then calculate W from the identity W = Q/[n(k − 1)]. The Python report uses the same 649 complete student blocks as the workbook and reproduces every primary metric.
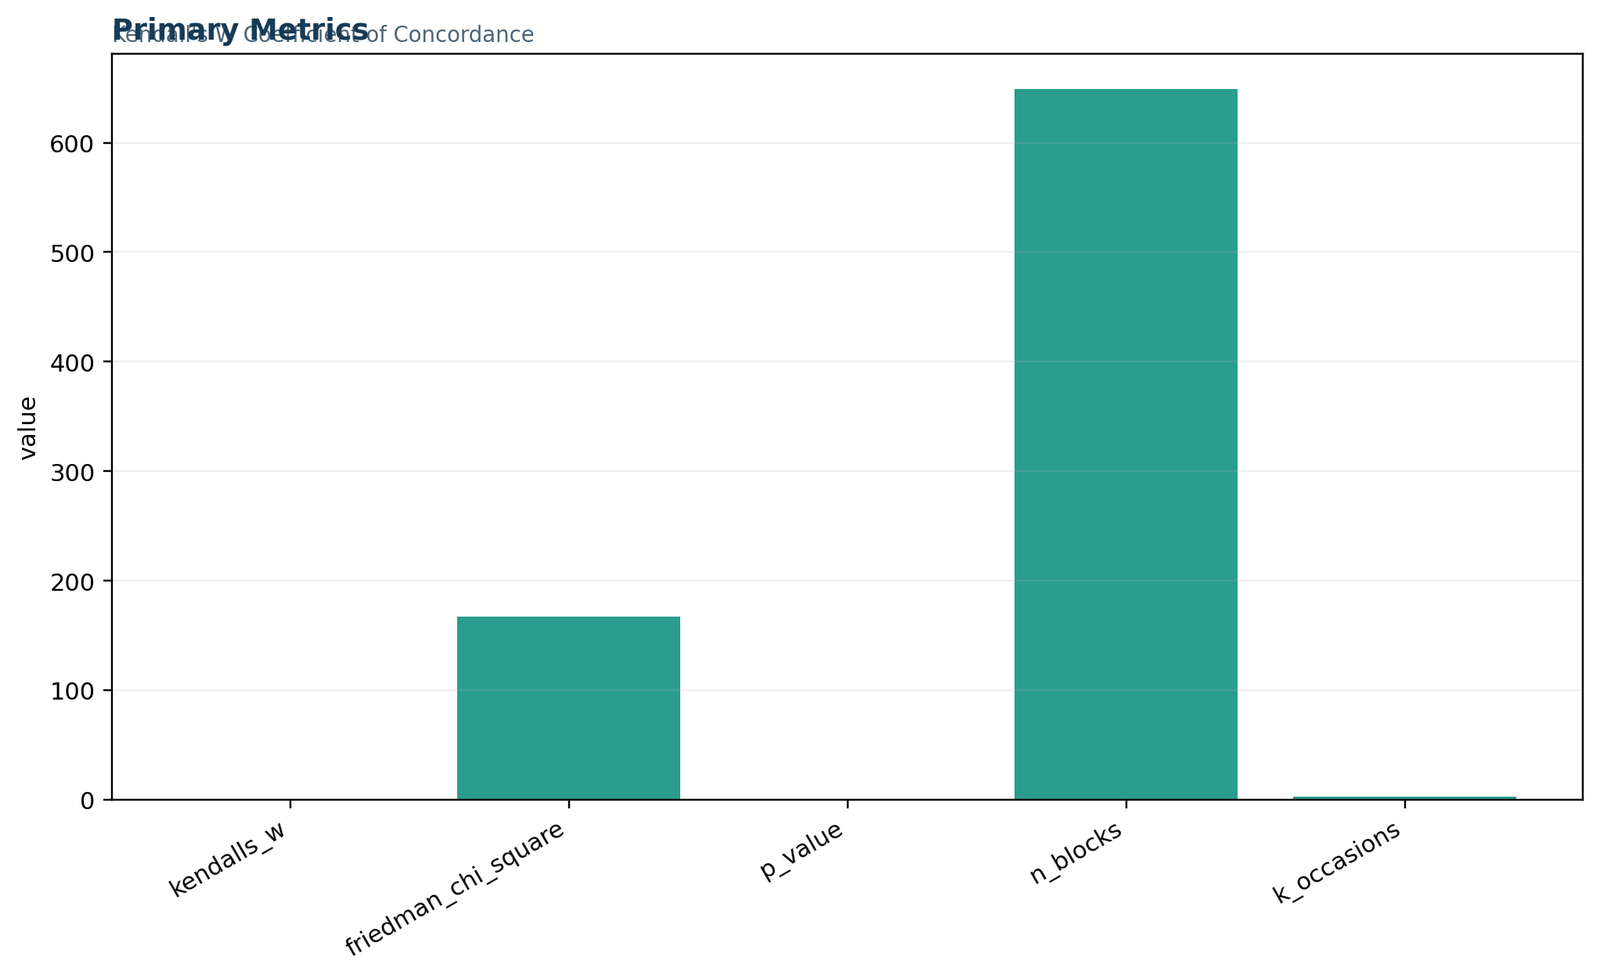
Python chart 1: primary Kendall’s W test metrics
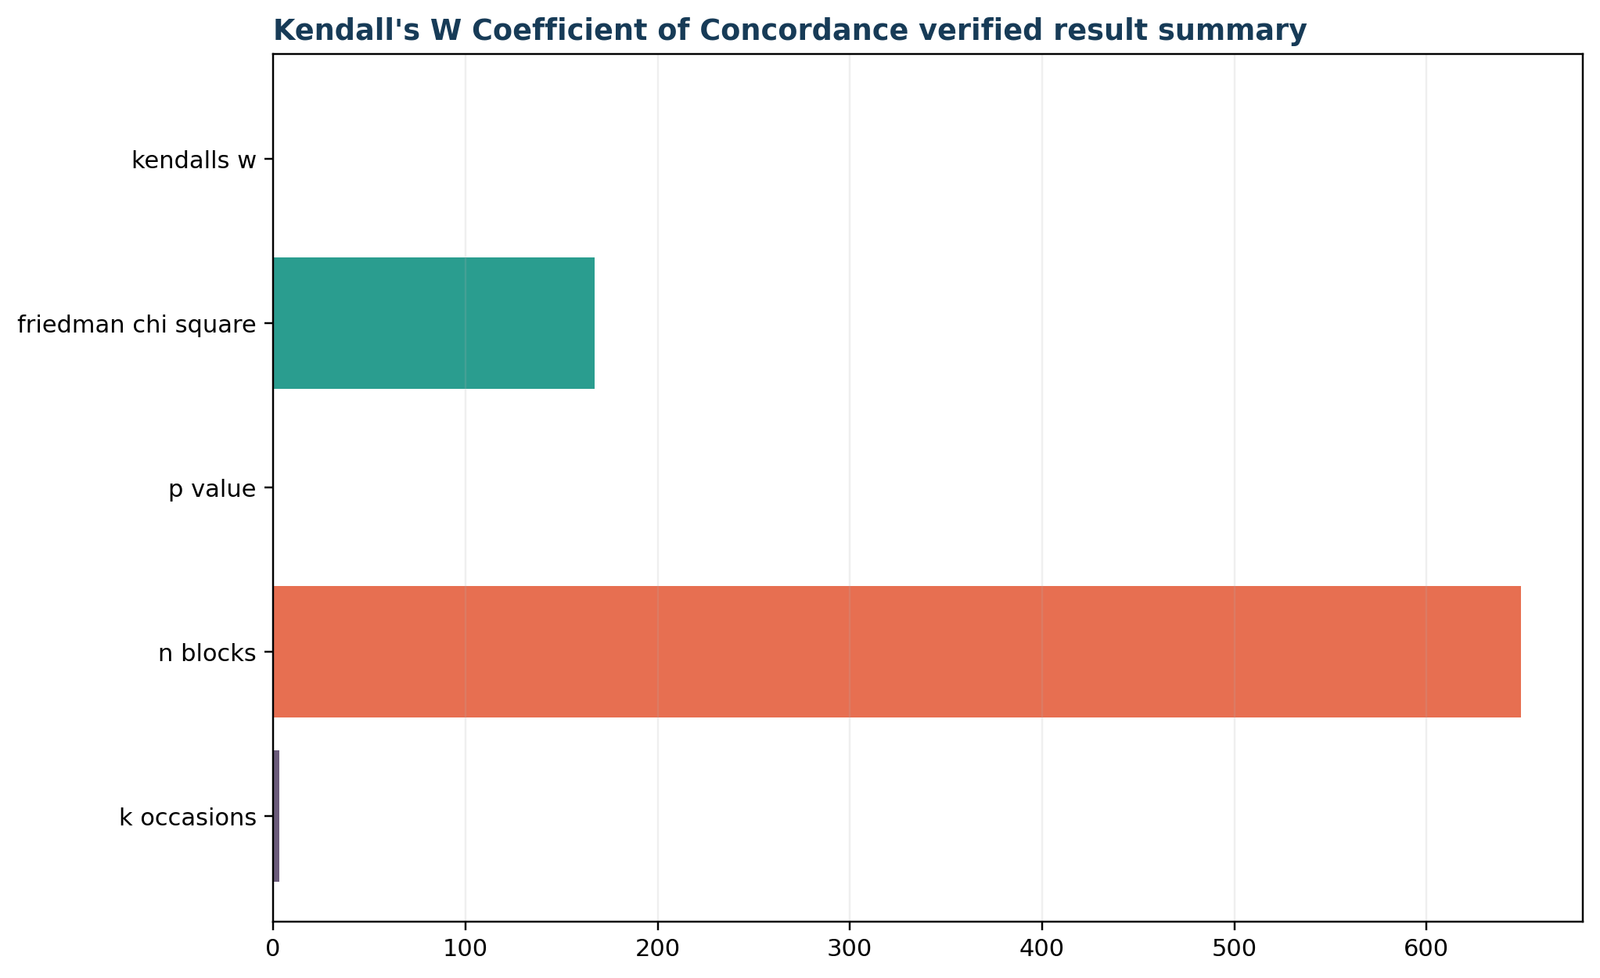
The primary-metrics figure summarizes the complete inference: 649 blocks, 3 occasions, Friedman χ² = 167.3283, df = 2, p = 4.625 × 10−37, and W = 0.128912. The chart makes the central interpretation visible: the occasion effect is statistically decisive, but concordance is weak on the 0-to-1 scale.
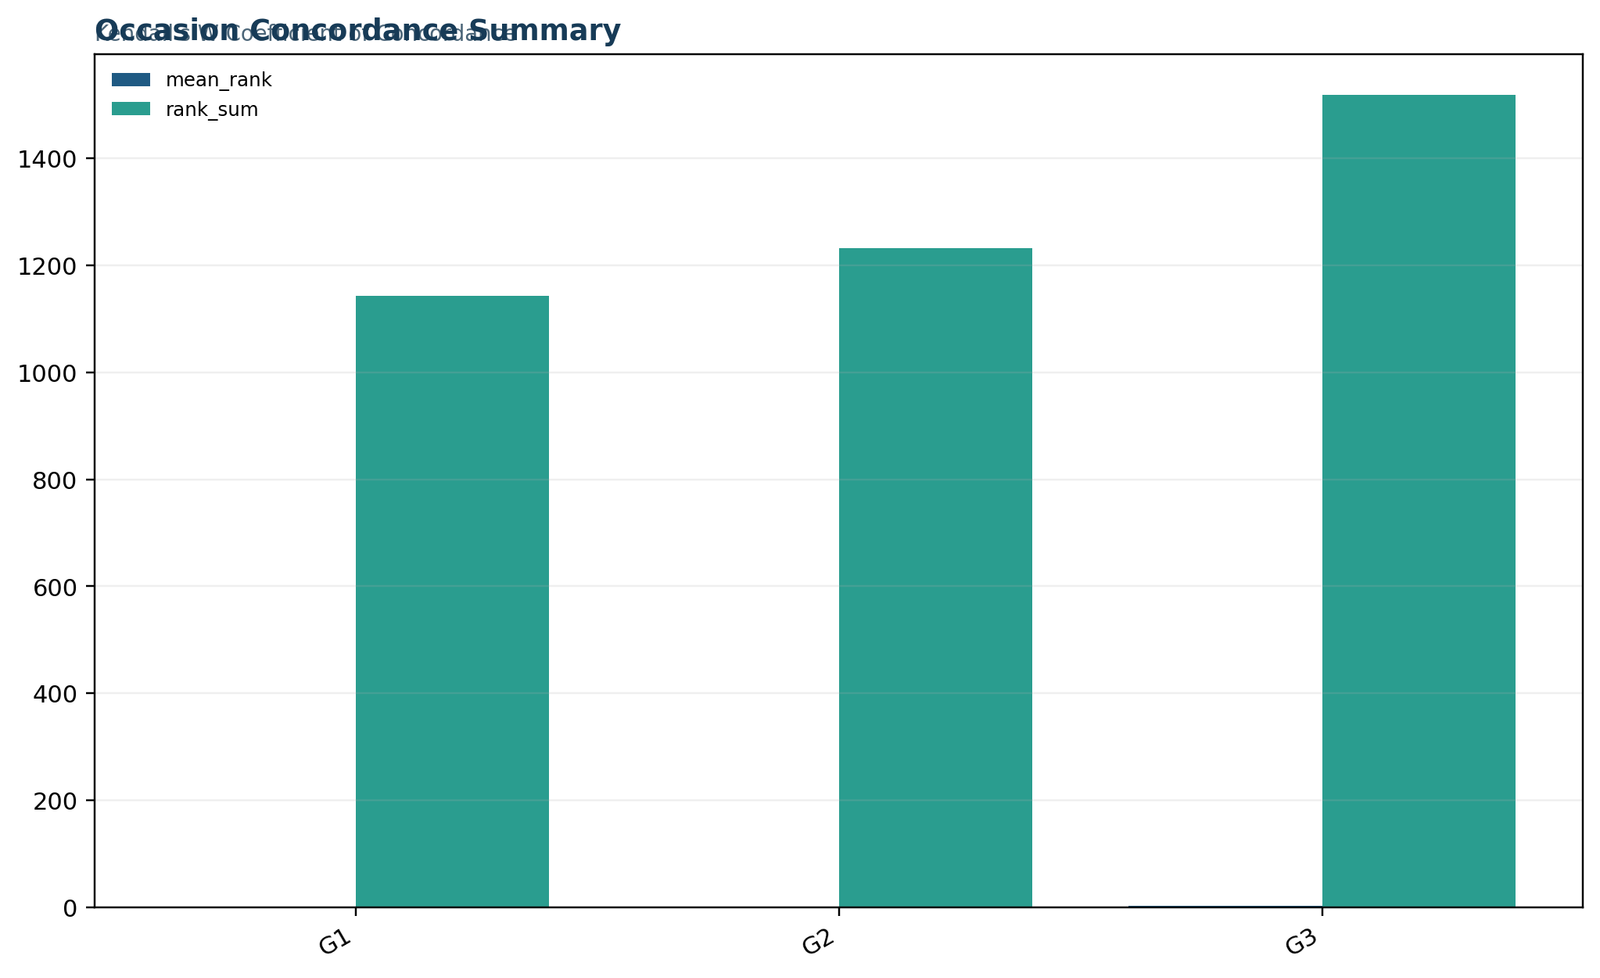
Python chart 2: occasion concordance summary
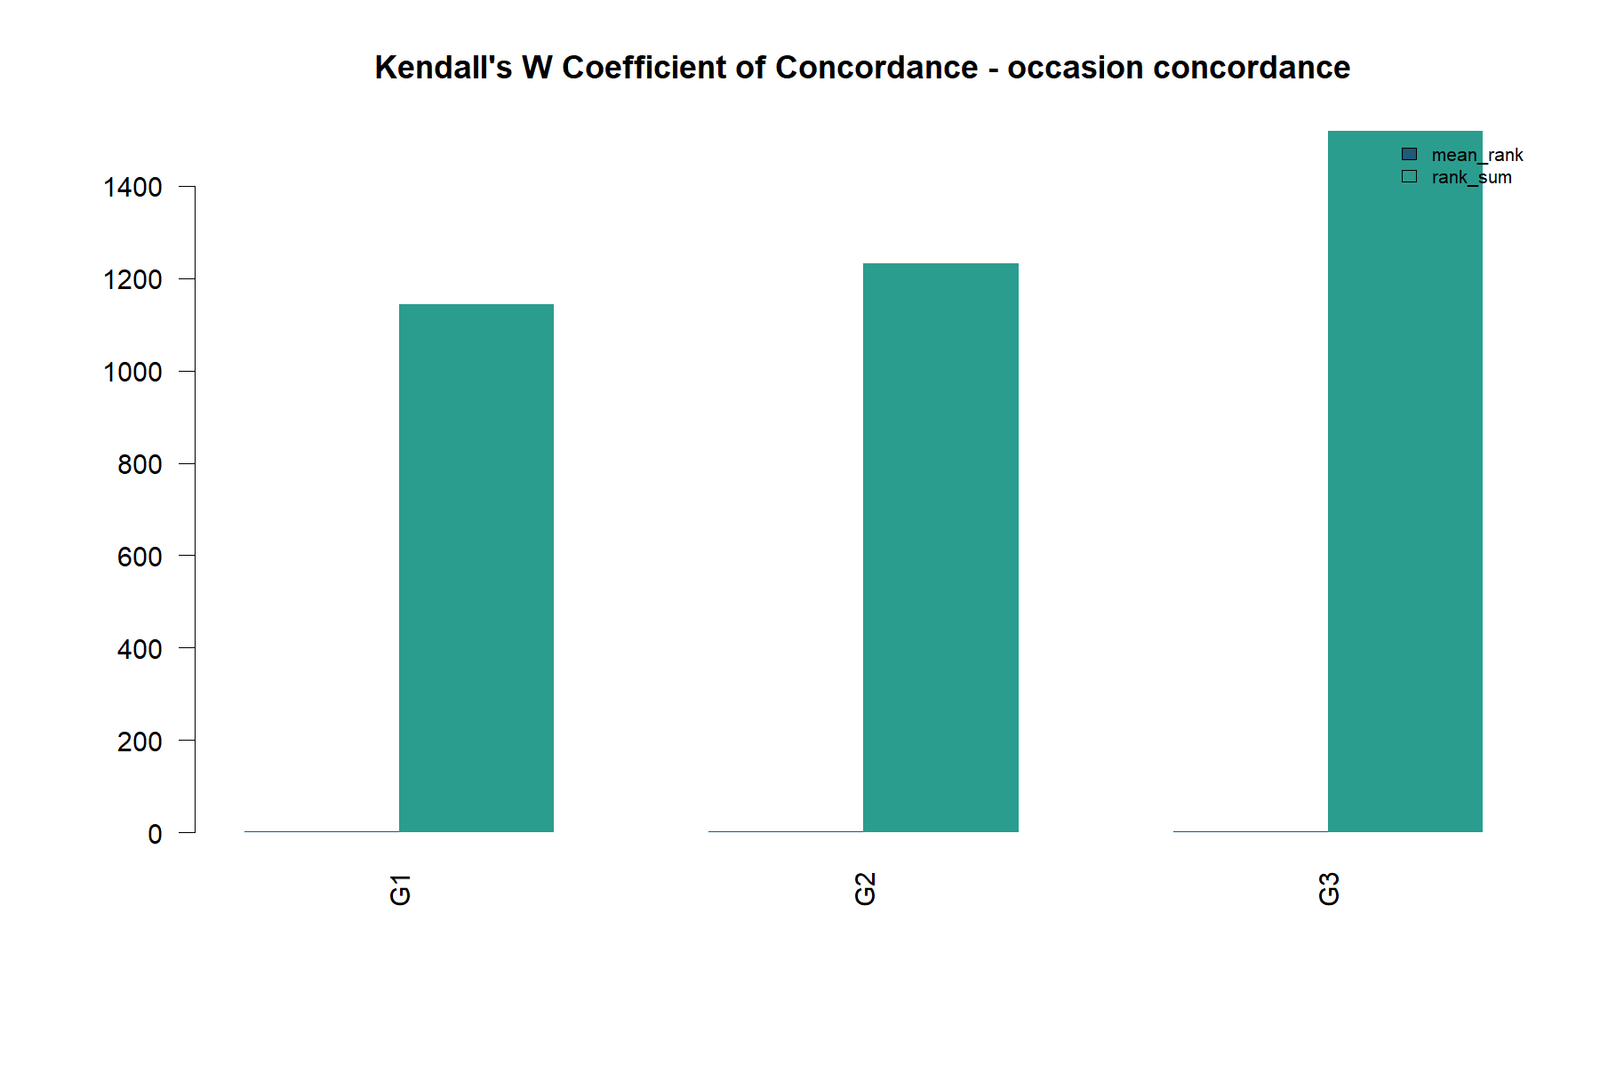
The occasion summary displays the exact mean ranks: G1 = 1.7612, G2 = 1.8983, and G3 = 2.3405. Their rank sums are 1,143, 1,232, and 1,519. G3 is therefore the occasion most consistently placed at the top of the within-student ordering.
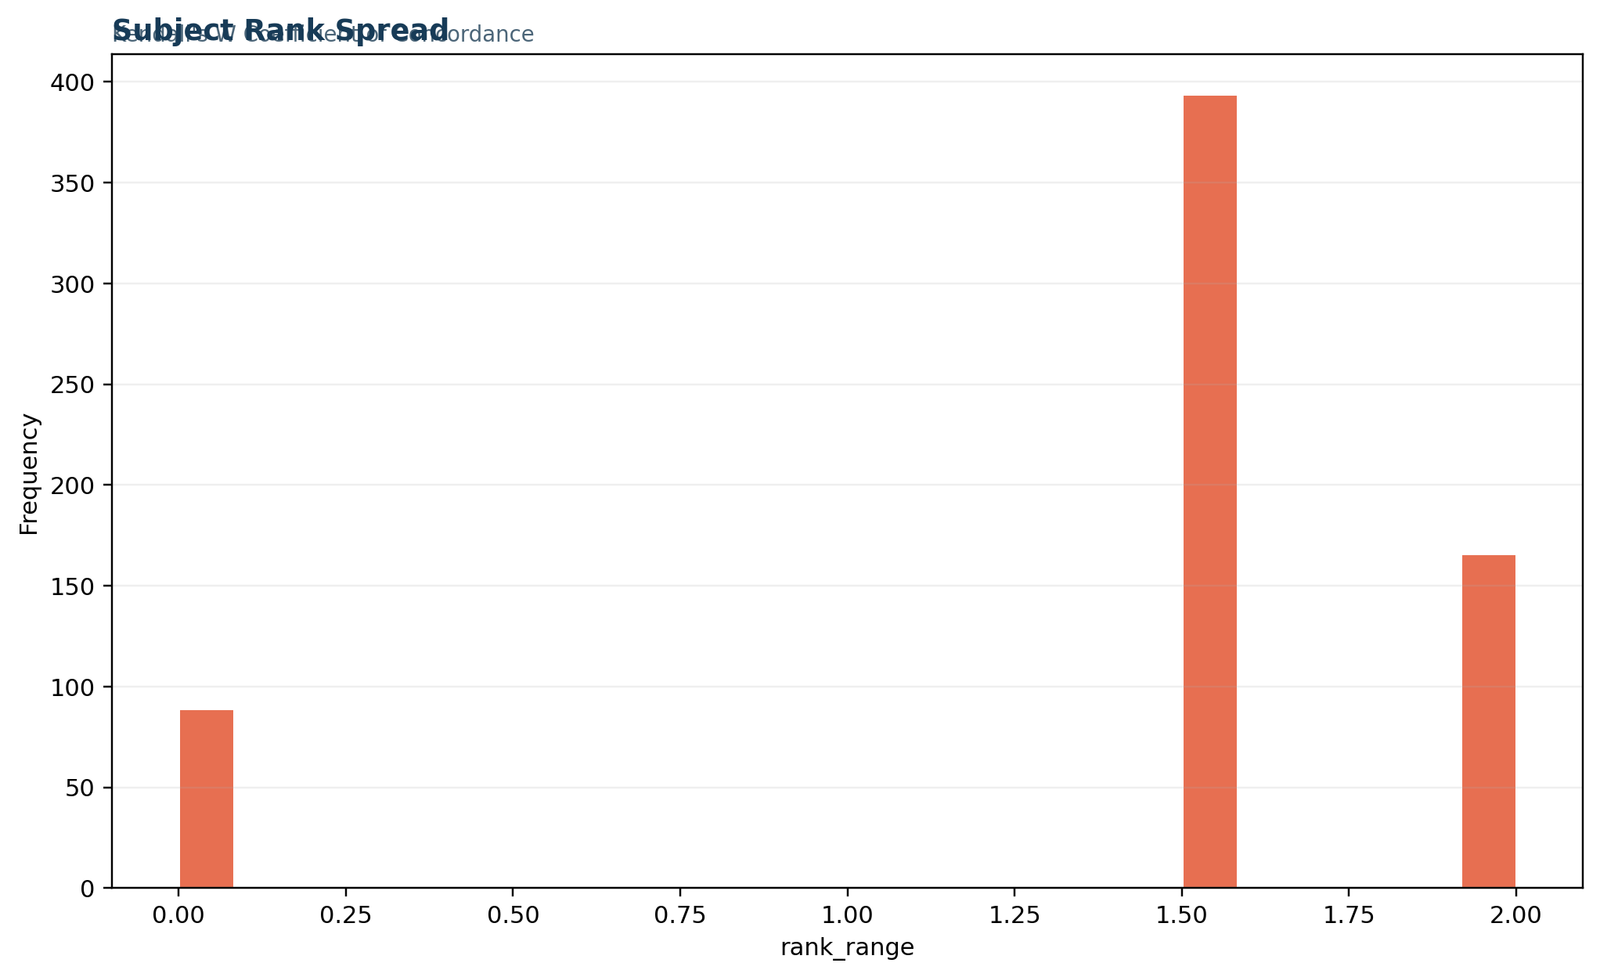
Python chart 3: subject-level grade spread
The student-block spread chart shows that 314 students (48.4%) had a raw grade range of 1 across G1, G2, and G3, 163 (25.1%) had a range of 2, and 89 (13.7%) had no change at all. Only 29 students (4.5%) had a range of 4 or more. The dominant small within-student ranges create many ties and moderate the attainable concordance.
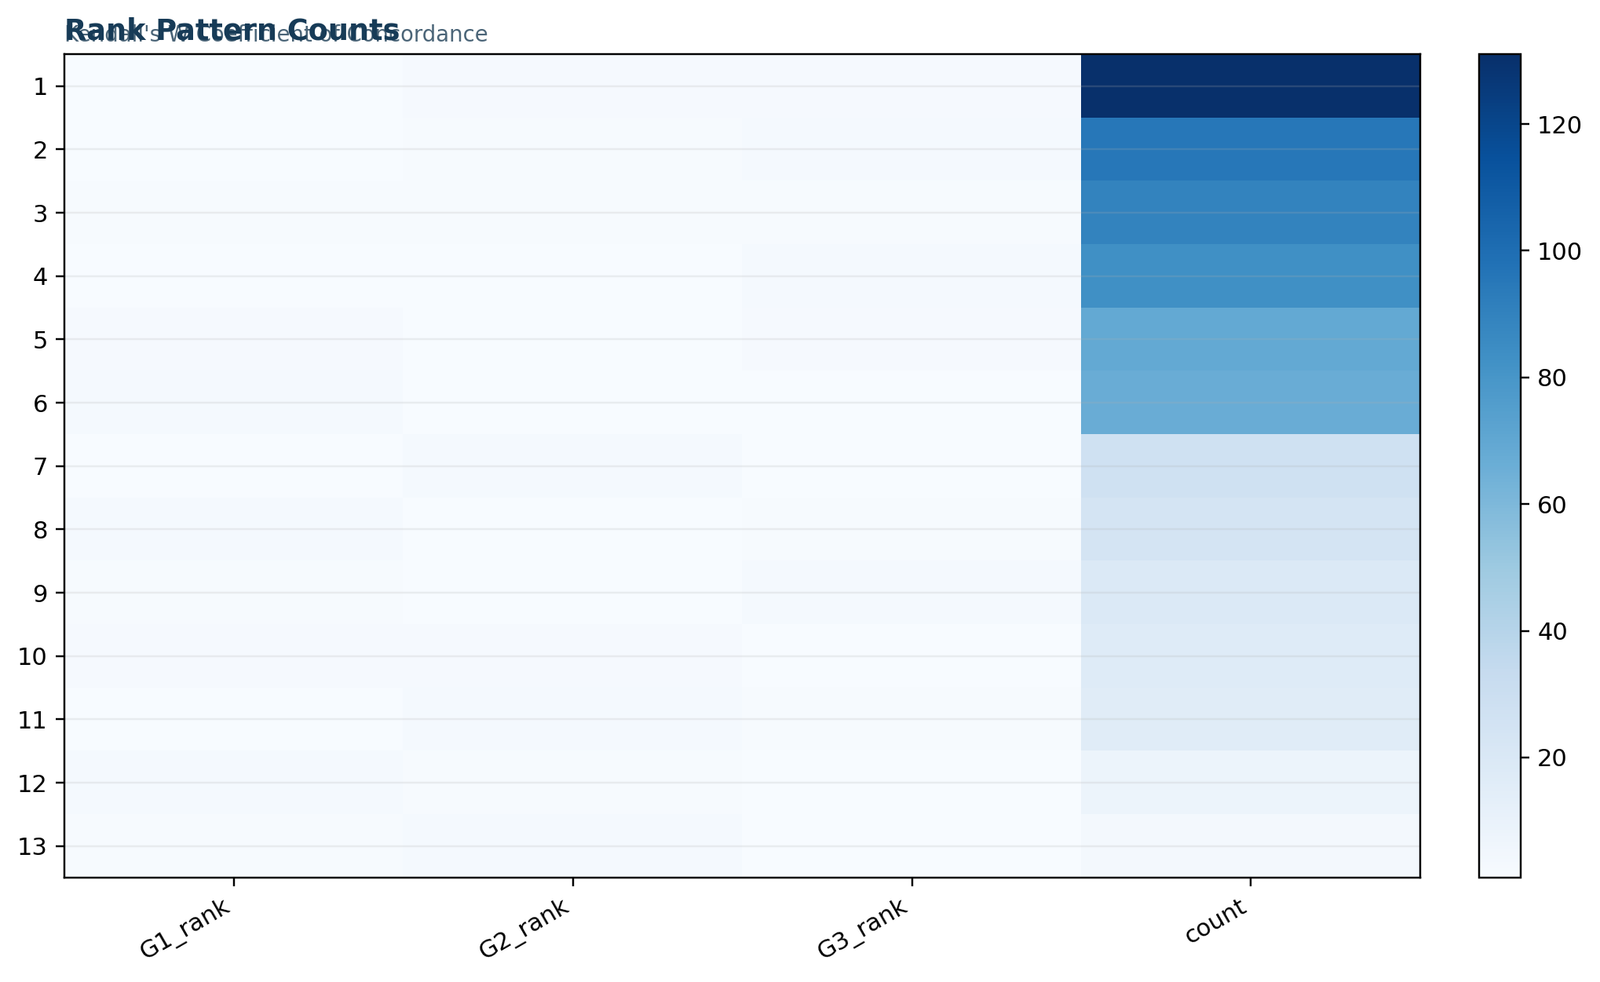
Python chart 4: rank-pattern counts
Thirteen distinct tie-aware rank patterns occur. The four largest are G1 < G2 = G3 (131), G1 < G2 < G3 (95), G1 = G2 = G3 (89), and G1 = G2 < G3 (83). These patterns support the average G3-leading direction, but the many alternative orderings explain why the Kendall’s W test does not approach complete agreement.
Python chart 5: verified result summary
The verified summary combines the statistical and substantive messages. Equal occasion ranks are rejected, G3 has the highest average rank, and W equals 0.128912. The correct conclusion is not “strong agreement”; it is a significant but weak concordant ordering across the three grade occasions.
Kendall’s W test in R: chart-by-chart results
The R analysis confirms the coefficient and adds pairwise rank-association context.
The Kendall’s W test in R can be obtained directly from a concordance function or calculated from the Friedman statistic. The R figures use the same rows, tie handling, and occasion labels as the Python and Excel analyses.
R chart 1: primary metrics
The R metrics reproduce W = 0.128912 and χ²(2) = 167.3283. Agreement across software is important because the same coefficient can be calculated through several R packages or by transforming the base Friedman statistic. All valid implementations should reconcile when the data orientation and tie handling are the same.
R chart 2: occasion concordance
The occasion-concordance chart emphasizes the directional pattern behind the coefficient. G3 has a mean rank of 2.3405, compared with 1.8983 for G2 and 1.7612 for G1. The separation is large enough to be highly significant, yet individual rank patterns remain diverse.
R chart 3: subject rank spread
The R subject-spread figure highlights the limited variation across many student blocks. A raw range of 0, 1, or 2 covers 566 of 649 students (87.2%). These compact profiles create frequent average ranks and show why the tie correction is numerically important.
R chart 4: pairwise rank correlations
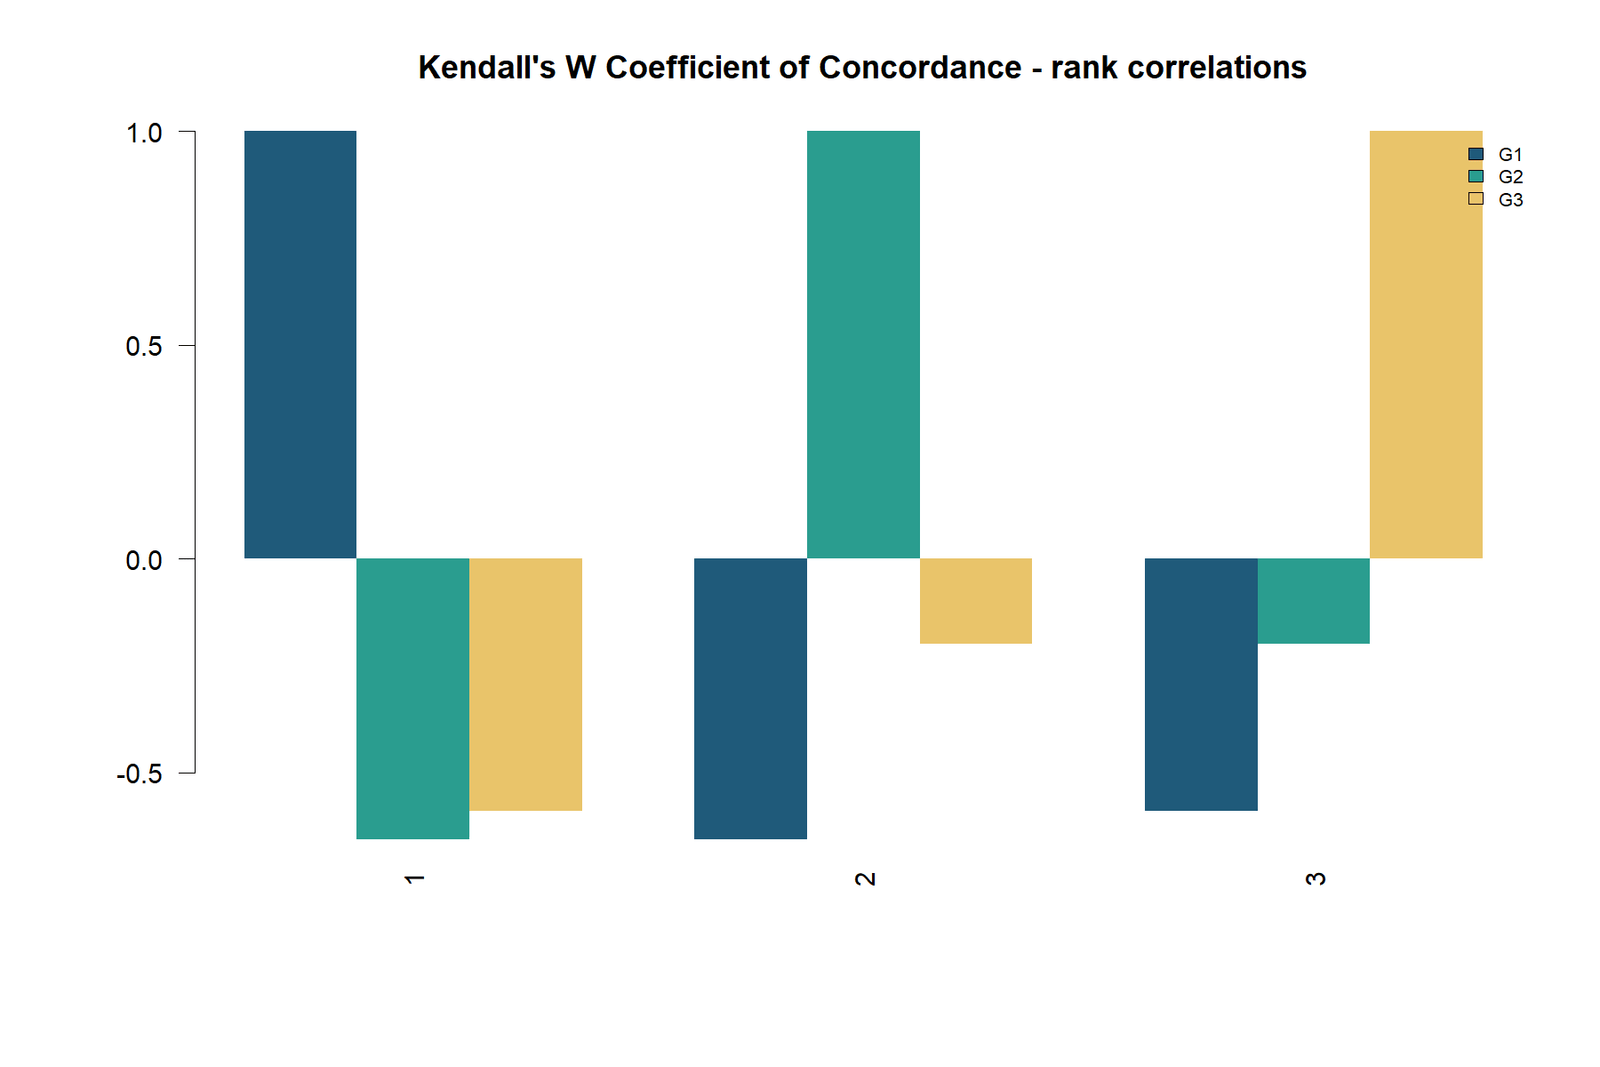
The pairwise Kendall tau-b coefficients are high: G1–G2 = 0.7806, G1–G3 = 0.7662, and G2–G3 = 0.8696. These values measure whether students retain their relative ordering compared with other students across occasions. Kendall’s W asks a different question—whether students agree about which occasion ranks highest within their own records—so high pairwise tau values can coexist with a much smaller W.
R chart 5: verified result summary
The final R summary confirms the same interpretation across all outputs: G3 tends to outrank G2 and G1, equal rank positions are rejected, and the concordance magnitude is limited. The distinction between strong statistical evidence and weak W is the central reporting point.
Kendall’s W test in SPSS
SPSS reports the mean ranks, coefficient, chi-square statistic, degrees of freedom, and significance.
The keyword Kendall’s W test in SPSS usually refers to the several-related-samples nonparametric procedure. The data should be in wide format, with one row per judge or subject and one column per ranked item or repeated condition. In this example, the three analysis columns are G1, G2, and G3.
SPSS menu workflow
The legacy syntax form is commonly written as NPAR TESTS /KENDALL = G1 G2 G3. The output should show the same mean ranks and tie-corrected test statistics as the workbook.
Expected SPSS output for this example
The ranks table should list G1, G2, and G3 in ascending mean-rank order. SPSS users can compare the workflow with correlation in SPSS and the ICC formula and SPSS guide when choosing among agreement measures.
Kendall W test Excel workflow
The worked workbook separates raw data, within-block ranks, calculations, diagnostics, and reporting.
The search phrase Kendall W test Excel reflects a common need for a transparent calculation. The completed workbook demonstrates the coefficient without hiding the rank transformations or tie terms.
| Workbook sheet | Purpose | Main Kendall’s W content |
|---|---|---|
| Guide | Method documentation | Design, null hypothesis, formula, variables, source rows, and alpha. |
| Data_Input | Raw observations | G1, G2, and G3 values for 649 students. |
| Working | Row-level transformations | Within-student ranks, block ranges, score columns, and tie terms. |
| Calculations | Primary statistics | Rank sums, mean ranks, Friedman Q, p-value, Kendall’s W, and related checks. |
| Diagnostics | Design checks | Complete blocking, average ranks for ties, and method identity. |
| Reporting | Verification | Workbook results compared with independently verified W, chi-square, and p-value. |
Key Excel formulas
Within each row, use average ranks for G1:G3. Sum each rank column to obtain RG1, RG2, and RG3. Calculate the common expected sum R̄, then S. The tie-corrected denominator requires counting repeated values inside each block and adding t³ − t for every tied group.
The final Kendall’s W test coefficient is 12S divided by the corrected denominator. A separate formula can confirm W from the Friedman statistic. The two calculations should match to rounding precision.
Workbook verification targets
Readers building companion analyses may also review correlation in Excel, descriptive statistics, and the standard error.
Cross-software reconciliation table
| Platform | Primary route | Expected Kendall’s W test result | Verification point |
|---|---|---|---|
| Python | Tie-corrected Friedman statistic followed by W = Q/[n(k − 1)] | W = 0.1289123863 | Q must equal 167.3282774 and use 649 complete rows. |
| R | Direct concordance function or Friedman-to-W transformation | W = 0.1289123863 | Rows and columns must be oriented consistently with the selected function. |
| SPSS | K related samples with Kendall’s coefficient of concordance | W = 0.129; χ² = 167.328 | The mean-rank order should be G1, G2, G3 from lowest to highest. |
| Excel | Within-row average ranks, tie term, rank sums, and corrected denominator | W = 0.1289123863 | The direct formula and Friedman transformation must match. |
Agreement across platforms is a strong quality-control check because the Kendall’s W test is sensitive to transposed data, omitted tie correction, and inconsistent missing-value handling. Matching W alone is not sufficient; the rank sums, block count, and mean-rank direction should also reconcile.
Kendall’s W effect size for Friedman test reference
The coefficient translates the Friedman statistic into a bounded, interpretable magnitude.
The phrase Kendall’s W effect size for Friedman test reference describes one of the most important uses of the coefficient. Friedman chi-square grows with the number of blocks, so its raw magnitude is not directly comparable across studies. Kendall’s W divides by n(k − 1), placing the result on a stable 0-to-1 scale.
The transformation uses the tie-corrected Friedman statistic. Using an uncorrected Q with a tie-corrected W denominator would produce inconsistent results.
Why W is useful beside Friedman p
The Friedman p-value paired with the Kendall’s W test answers whether the related occasions differ. Kendall’s W shows how strongly the blocks agree on the occasion ordering. Because the present sample is large, the p-value is extraordinarily small even though W is only 0.129. Reporting both avoids the mistaken impression that a tiny p-value automatically implies a large effect.
This principle also applies in other analyses discussed under statistical power and Type I and Type II error.
How to describe the magnitude
For the Kendall’s W test, there is no universal set of cutoffs that fits every discipline. On the mathematical scale, 0.129 is much nearer 0 than 1. In the present educational dataset, describing the result as weak concordance is reasonable because students show many different tie-aware order patterns despite the overall tendency for G3 to rank highest.
W should not be translated into a percentage of variance explained. It is a proportion of the maximum possible rank-sum concordance under the design.
Kendall’s W test compared with related statistics
Agreement, association, repeated-measures effects, and categorical reliability require different coefficients.
| Statistic | Primary question | How it differs from Kendall’s W |
|---|---|---|
| Kendall’s W | Do multiple judges or blocks show concordant rankings? | Summarizes agreement across k ranked items on a 0-to-1 scale. |
| Kendall’s tau-b | Are two ordinal variables associated? | Pairwise association, with a −1-to-1 scale, rather than multi-rater concordance. |
| Spearman correlation | Is there a monotonic relationship between two variables? | Also pairwise and association-focused. |
| Intraclass correlation | How reliable or absolutely agreeing are quantitative ratings? | Model-based, continuous-scale agreement with several forms and assumptions. |
| Kappa statistic | Do raters agree on categorical labels beyond chance? | Designed for nominal or ordinal categories rather than complete rankings. |
| Fleiss kappa | Do multiple raters agree on nominal categories? | Multi-rater categorical agreement, not rank-order concordance. |
| Friedman test | Do related conditions have equal rank distributions? | Provides the omnibus significance test; W standardizes its magnitude. |
| Repeated-measures ANOVA | Do related condition means differ under a parametric model? | Mean-based and subject to normal-model assumptions rather than rank-based. |
Kendall’s W test and rank correlation answer different questions
The high tau-b values show that students with relatively high G1 grades also tend to have relatively high G2 and G3 grades. This is an across-student association. The Kendall’s W test removes that stable between-student level by ranking the three occasions inside each row. It then asks whether the same occasion tends to occupy the same rank position across students.
A dataset can therefore have strong pairwise association and weak W. Stable high-performing and low-performing students create high correlations, while mixed within-student changes create limited occasion concordance.
Kendall’s W test and reliability are not interchangeable
Reliability statistics such as the ICC can evaluate whether quantitative measurements agree closely in absolute value or preserve relative standing, depending on the chosen model. The Kendall’s W test ignores the numerical distance between grades after ranking. A one-point and a ten-point difference can create the same order. The preferred coefficient must therefore follow the measurement question rather than a generic desire to report “agreement.”
Readers comparing reliability measures should review the site’s ICC formula and interpretation guide.
Kendall’s W test diagnostics, ties, missing data, and sensitivity
Most practical errors come from orientation, incomplete blocks, or misinterpretation rather than arithmetic.
A reliable Kendall’s W test analysis should document the number of complete blocks, the item orientation, tie handling, missing-value rule, and the distinction between concordance and pairwise association.
Check the matrix orientation
For a valid Kendall’s W test, rows should represent judges or complete blocks and columns should represent the commonly ranked items. Reversing this orientation changes the scientific question and often changes W.
Count complete blocks
The current analysis uses 649 complete rows. If an occasion is missing, listwise deletion reduces m unless a specialized incomplete-ranking method is chosen.
Verify tie corrections
The total tie term is 4,500. A no-tie formula would not reproduce the verified coefficient for these discrete grades.
Inspect rank patterns
Thirteen patterns occur, showing that the aggregate ordering does not describe every student. Pattern counts are a valuable companion to the single coefficient.
Separate p from magnitude
The p-value is driven by both effect and sample size. W is the preferred standardized magnitude for cross-study interpretation.
Use follow-up tests carefully
Kendall’s W does not identify which occasion pairs differ. Pairwise related-sample procedures require their own multiplicity adjustment.
How to report Kendall’s W test in APA style
A complete report names the blocks, items, tie handling, chi-square test, coefficient, and direction.
A useful Kendall’s W test report includes the sample size, number of ranked items, W, the associated Friedman chi-square, degrees of freedom, p-value, and a plain-language interpretation of concordance magnitude.
APA-style reporting example
A Kendall’s coefficient of concordance analysis was conducted to evaluate consistency in the within-student ordering of first-period grade (G1), second-period grade (G2), and final grade (G3) across 649 students. Ties were assigned average ranks. The occasion ranks differed significantly, χ2(2) = 167.33, p < .001, and Kendall’s W = .129. Mean ranks increased from G1 (1.76) to G2 (1.90) and G3 (2.34). Thus, G3 tended to rank highest, but the magnitude of concordance across students was weak.
Reporting checklist
Interpretation language
Use “concordance,” “agreement in ordering,” or “Friedman effect size.” Avoid calling W a simple correlation coefficient, a percentage of variance explained, or proof that all judges produced identical rankings.
When confidence intervals or bootstrap estimates are added, describe their method explicitly. General guidance is available in the site’s confidence interval and confidence interval formula resources.
Kendall’s W test downloads and related guides
Reports and the worked workbook support reproducibility across four platforms.
Python reportPrimary metrics, rank summaries, subject patterns, and verified Kendall’s W results.Open report
R reportConcordance output, rank correlations, and cross-software verification.Open report
SPSS outputMean ranks, Kendall’s W, chi-square, degrees of freedom, and significance.Open report
Excel workbookRaw grades, within-block ranks, ties, calculations, diagnostics, and reporting.Open workbook
Related statistical guides
Frequently asked questions about Kendall’s W test
Concise answers to common interpretation, software, and design questions.
What is Kendall’s W test?
The Kendall’s W test measures concordance across several rankings of the same items. W ranges from 0 for no systematic agreement to 1 for complete agreement.
What does Kendall’s W = 0.1289 mean?
It indicates weak or limited concordance. The observed ordering is statistically systematic, but the judges or blocks do not agree closely enough for W to approach 1.
Why is the p-value significant when W is small?
The p-value depends on both effect magnitude and sample size. With 649 complete blocks, a modest standardized concordance can produce very strong evidence against the null.
Is Kendall’s W an effect size for the Friedman test?
Yes. Kendall’s W is commonly reported as the standardized effect size associated with a Friedman repeated-measures test.
What is the formula connecting Friedman chi-square and W?
For n complete blocks and k conditions, W = χ²F/[n(k − 1)]. In this example, 167.3283/[649 × 2] = 0.128912.
Does Kendall’s W test require normality?
No. It is rank-based and does not require normally distributed observations.
How are ties handled?
Tied values receive average ranks. A tie term reduces the denominator to reflect the loss of ranking information.
Is Kendall’s W the same as Kendall’s tau?
No. Kendall’s tau measures association between two ranked variables, whereas W summarizes concordance across multiple rankings or conditions.
Can Kendall’s W be negative?
No. The conventional coefficient ranges from 0 to 1. Direction is interpreted from the item mean ranks rather than from the sign of W.
What does W = 1 mean?
It means every judge or block produced the same rank ordering, allowing for the defined treatment of ties.
What does W = 0 mean?
It means the item rank sums show no systematic concordance beyond the null expectation.
How many judges or blocks are needed?
The Kendall’s W test can be calculated with a small number, but stable interpretation and chi-square inference improve with more independent judges or blocks.
Can Kendall’s W test be used in SPSS?
Yes. SPSS provides Kendall’s coefficient of concordance for several related samples and reports W, chi-square, df, p-value, and mean ranks.
Can Kendall W test be calculated in Excel?
Yes. The worked Excel file ranks each row, calculates rank sums and ties, and produces the same verified W value.
What did the grade example show?
G3 had the highest mean rank, followed by G2 and G1. The occasion effect was highly significant, but concordance was weak at W = 0.1289.
Why are the pairwise Kendall correlations high while W is low?
The pairwise correlations measure whether students retain their relative standing across occasions. W measures agreement about which occasion ranks highest within each student. The questions are different.
Does Kendall’s W identify which conditions differ?
No. It is an omnibus concordance/effect-size statistic. Pairwise follow-up procedures are needed to identify specific condition differences.
How should Kendall’s W be reported?
Report the number of blocks and items, W, chi-square, df, p-value, tie handling, item mean ranks, and a contextual magnitude description.