
Quade Test: Formula, Interpretation, Python, R, SPSS and Excel Guide
The Quade test is a nonparametric procedure for comparing three or more related treatments or conditions in an unreplicated complete-block design. Unlike the Friedman test, it ranks the range of every block and gives more influence to blocks that separate the conditions more clearly. This guide explains the Quade test formula, assumptions, worked example, interpretation, post hoc comparisons, charts, and reproducible workflows in Python, R, SPSS and Excel.
Complete blocks
Range-weighted ranks
Average ranks for ties
Python + R + SPSS + Excel
The three grade occasions differ after range-weighted block adjustment.
For 649 students measured at G1, G2 and G3, the Quade test produced F(2, 1296) = 91.1481 with p = 9.1751 × 10⁻³⁸. At α = .05, the null hypothesis that the three occasions have the same location after accounting for student blocks is rejected. The weighted score sums were −65,888.25 for G1, −21,292.75 for G2 and 87,181.00 for G3. G3 therefore has the strongest positive range-weighted position, while G1 has the strongest negative position.
Raw means were 11.399, 11.570 and 11.906; medians were 11, 11 and 12. These descriptive summaries point toward increasing grades, but the Quade inference is based on within-student ranks multiplied by ranks of each student’s grade range. Blocks with little separation contribute less than blocks with a large range.
What does the Quade test measure?
A range-weighted comparison of related conditions after separating treatment ranks from block-to-block variability.
The Quade test addresses the same broad complete-block question as Friedman: do three or more related conditions have the same location? Its distinctive feature is that it uses the magnitude of separation inside each block. It first ranks the observations within a block, then ranks the block ranges, and finally multiplies the centered within-block ranks by those range ranks.
The statistical target
Suppose the same students are measured at G1, G2 and G3. Student is the block, and grade occasion is the treatment or condition. Large differences among a student’s three grades provide clearer information about condition ordering than a row in which all three grades are equal. The Quade procedure formalizes that intuition without analyzing raw differences as if they were normally distributed.
The null hypothesis states that, apart from a block effect, the population location is the same for all conditions. A significant result means at least one condition occupies a systematically different weighted rank position. The Quade test is therefore an omnibus test. It does not identify a specific pair unless a protected post hoc procedure is performed.
Why weighting changes the Quade test result
The Friedman test gives every complete block equal weight after ranking the observations within that row. The Quade test adds a second layer: the range of each block is ranked across blocks. A block whose maximum and minimum are far apart receives a higher range rank than a nearly flat block. Its centered ranks consequently contribute more to the treatment totals.
This weighting can improve sensitivity when block ranges genuinely reflect how informative each block is. It can also make the Quade test less suitable for strictly ordinal outcomes, because subtracting a minimum from a maximum requires meaningful numerical spacing. Review categorical and quantitative variables before treating ordinal labels as interval-scale measurements.
When should you use the Quade test?
Choose it for complete related-samples designs when within-block range is meaningful and varies across blocks.
A defensible Quade test begins with the design, not with a normality-test p-value. The same blocks must appear under every condition, and the numerical scale must support differences such as maximum minus minimum.
Confirm related observations
Every student, patient, site or matched set contributes one observation under each condition.
Require complete blocks
Each analyzed row must contain all k conditions; incomplete rows are normally removed as blocks.
Check the measurement scale
Within-block subtraction must be meaningful, so interval or ratio data are preferable.
Inspect block ranges
The weighting is useful when ranges differ enough to distinguish more and less informative blocks.
Run an omnibus test
Use protected post hoc comparisons only after the global result supports a treatment difference.
Good applications
Choose another method when
Use a paired sign test or Wilcoxon signed-rank method when there are only two related conditions. Use Friedman when all blocks should contribute equally or the outcome is merely ordinal. Use repeated-measures ANOVA when its model is appropriate and mean differences are the target. Use mixed-effects regression when observations are missing, timing is irregular, covariates are needed, or the design includes interactions.
For independent groups, neither Quade nor Friedman is structurally correct. Consider Kruskal-Wallis, Jonckheere-Terpstra, ordinal regression or a suitable parametric model. For a prespecified monotonic order across related conditions, Page’s trend test answers a more directional question.
Quade test versus “nonparametric repeated-measures ANOVA”
Search results often describe both Friedman and Quade as nonparametric alternatives to one-way repeated-measures ANOVA. That description is useful but incomplete. The Quade tests do not estimate the same parameter as a Gaussian ANOVA, and Quade additionally requires numerical ranges within blocks. Report the actual hypothesis, block structure, weighting rule, statistic and p-value rather than implying that all repeated-measures procedures are interchangeable.
How the Quade test works
Seven operations convert a complete data matrix into an approximate F statistic.
The computational logic of the Quade test is transparent enough to reproduce in a spreadsheet and stable enough to automate for hundreds of blocks.
1. Arrange the block matrix
Rows are independent blocks and columns are related treatments or occasions. In the worked example, one row is one student and the columns are G1, G2 and G3. The design is unreplicated because each student-condition cell contains one observation.
2. Rank within every row
Assign ascending ranks 1 through k inside each block. Tied values receive their average rank. The row 12, 13, 12 becomes 1.5, 3, 1.5; the row 14, 14, 14 becomes 2, 2, 2.
3. Calculate each range
Subtract the row minimum from the row maximum. A row of 12, 13, 12 has range 1. A flat row has range 0. The range represents the raw separation among conditions inside that block.
4. Rank all block ranges
Rank the b ranges from smallest to largest, again using average ranks for ties. In this dataset, 89 zero-range rows share average range rank 45, while two range-11 rows share rank 648.5.
5. Form weighted scores
Center each within-block rank around (k+1)/2 and multiply by the range rank. With k = 3, the center is 2. Low within-row ranks produce negative scores, high ranks produce positive scores, and the middle rank produces zero.
6. Sum and partition variation
Sum the weighted scores by condition. Then calculate A from all squared cell scores and B from the squared treatment score sums divided by the number of blocks. These terms form the Quade F ratio.
7. Evaluate the F tail
The statistic uses numerator degrees of freedom k−1 and denominator degrees of freedom (b−1)(k−1). A large upper-tail value supports the conclusion that at least one treatment location differs after block adjustment.
Variables and data dictionary
The worked example uses three student grades as repeated quantitative outcomes.
Correctly identifying blocks, conditions and outcomes is essential because the Quade test ranks across columns within each row. Reversing this orientation produces a different and invalid analysis.
| Element | Worked-example definition | Role in the Quade test | Required handling |
|---|---|---|---|
| Block | Student | Controls for stable student-to-student differences | One independent row per student |
| Condition 1 | G1, first-period grade | First related treatment/occasion | Numeric score in the G1 column |
| Condition 2 | G2, second-period grade | Second related treatment/occasion | Numeric score in the G2 column |
| Condition 3 | G3, final grade | Third related treatment/occasion | Numeric score in the G3 column |
| Within-block rank | Rank of G1, G2 or G3 inside one student | Captures relative condition position | Ascending average ranks for ties |
| Block range | Maximum grade minus minimum grade | Measures within-student separation | Must be meaningful on the measurement scale |
| Range rank Qᵢ | Rank of one student’s range among 649 ranges | Weight assigned to that block | Average ranks for tied ranges |
| Weighted score Sᵢⱼ | Qᵢ times centered within-block rank | Cell contribution to the omnibus statistic | Retain signs and decimals |
Wide data are the natural input
A matrix with one row per block and one column per condition is the clearest representation for R’s quade.test(), the manual Python implementation and the supplied Excel workbook. Long data can also be used when software accepts treatment and block factors, but the one-observation-per-cell requirement must remain visible.
Before analysis, check duplicate block identifiers, unexpected repeated rows, missing conditions and nonnumeric codes. A value such as 99 used to mean “missing” would create an extreme range and receive an enormous weight unless recoded properly.
Complete blocks and missing values
The simple Quade procedure analyzes complete blocks. If one grade is missing for a student, that student cannot be ranked consistently across all three occasions and is removed from the matrix. State the number of excluded blocks and the missing-data rule. Listwise deletion can be reasonable when few blocks are missing for ignorable reasons; otherwise, a mixed model may be more informative.
The verified workbook contains 649 source rows and 649 complete blocks. No imputation was used. The Quade test therefore compares the same set of students at G1, G2 and G3.
Quade test hypotheses
The global null concerns equal treatment locations after accounting for blocks.
The Quade test is ordinarily two-sided and omnibus. It asks whether any treatment differs, not whether the conditions follow one particular increasing order.
Null hypothesis, H₀
After allowing for block effects, the location parameter is the same for G1, G2 and G3. In shorthand:
The symbols represent condition locations under the complete-block framework. They should not automatically be rewritten as equal arithmetic means.
Alternative hypothesis, H₁
At least one condition has a different location after block adjustment:
The alternative does not identify which pair differs. Follow-up comparisons are separate hypotheses with multiplicity control.
Two-sided omnibus
The ordinary Quade F test rejects for large F regardless of whether G1, G2 or G3 is highest.
Ordered hypothesis
For a prespecified G1 < G2 < G3 trend, use Page’s test rather than converting the Quade p-value into a one-sided result.
Pairwise hypotheses
Protected post hoc tests compare θᵢ and θⱼ after the omnibus test and adjust for three pairwise questions.
Quade test formula and calculation
The statistic combines within-block ranks, ranked block ranges and an approximate F distribution.
The full Quade test formula is easier to understand when the symbols are introduced in sequence rather than displayed as one unexplained expression.
The approximate reference distribution has numerator degrees of freedom k−1 and denominator degrees of freedom (b−1)(k−1). The p-value is the upper-tail probability P(F ≥ FQ).
Why ranks are centered
The average of ranks 1 through k is (k+1)/2. Subtracting that center makes low condition ranks negative, high condition ranks positive and the row total zero. The range rank then scales the magnitude without changing the direction. This centering creates the exact weighted-score-sum audit used in the workbook.
Why the p-value must use the survival function
For F = 91.148 with 2 and 1296 degrees of freedom, the upper-tail probability is extremely small. In Python, scipy.stats.f.sf() is preferred to subtracting a cumulative probability from one because the survival function is designed for the upper tail. In R, use pf(..., lower.tail=FALSE); in Excel, use F.DIST.RT.
Worked Quade test example
Grades from 649 students illustrate every stage of the range-weighted calculation.
The worked Quade test example compares G1, G2 and G3 for the same students. The purpose is methodological: show how raw grade ranges change the influence of complete blocks.
| Illustrative row | Raw grades | Within-row ranks | Range | Average range rank | Weighted scores |
|---|---|---|---|---|---|
| Student 1 | 0, 11, 11 | 1, 2.5, 2.5 | 11 | 648.5 | −648.5, 324.25, 324.25 |
| Student 2 | 9, 11, 11 | 1, 2.5, 2.5 | 2 | 485.0 | −485.0, 242.5, 242.5 |
| Student 3 | 12, 13, 12 | 1.5, 3, 1.5 | 1 | 246.5 | −123.25, 246.5, −123.25 |
| Student 4 | 14, 14, 14 | 2, 2, 2 | 0 | 45.0 | 0, 0, 0 |
Range distribution
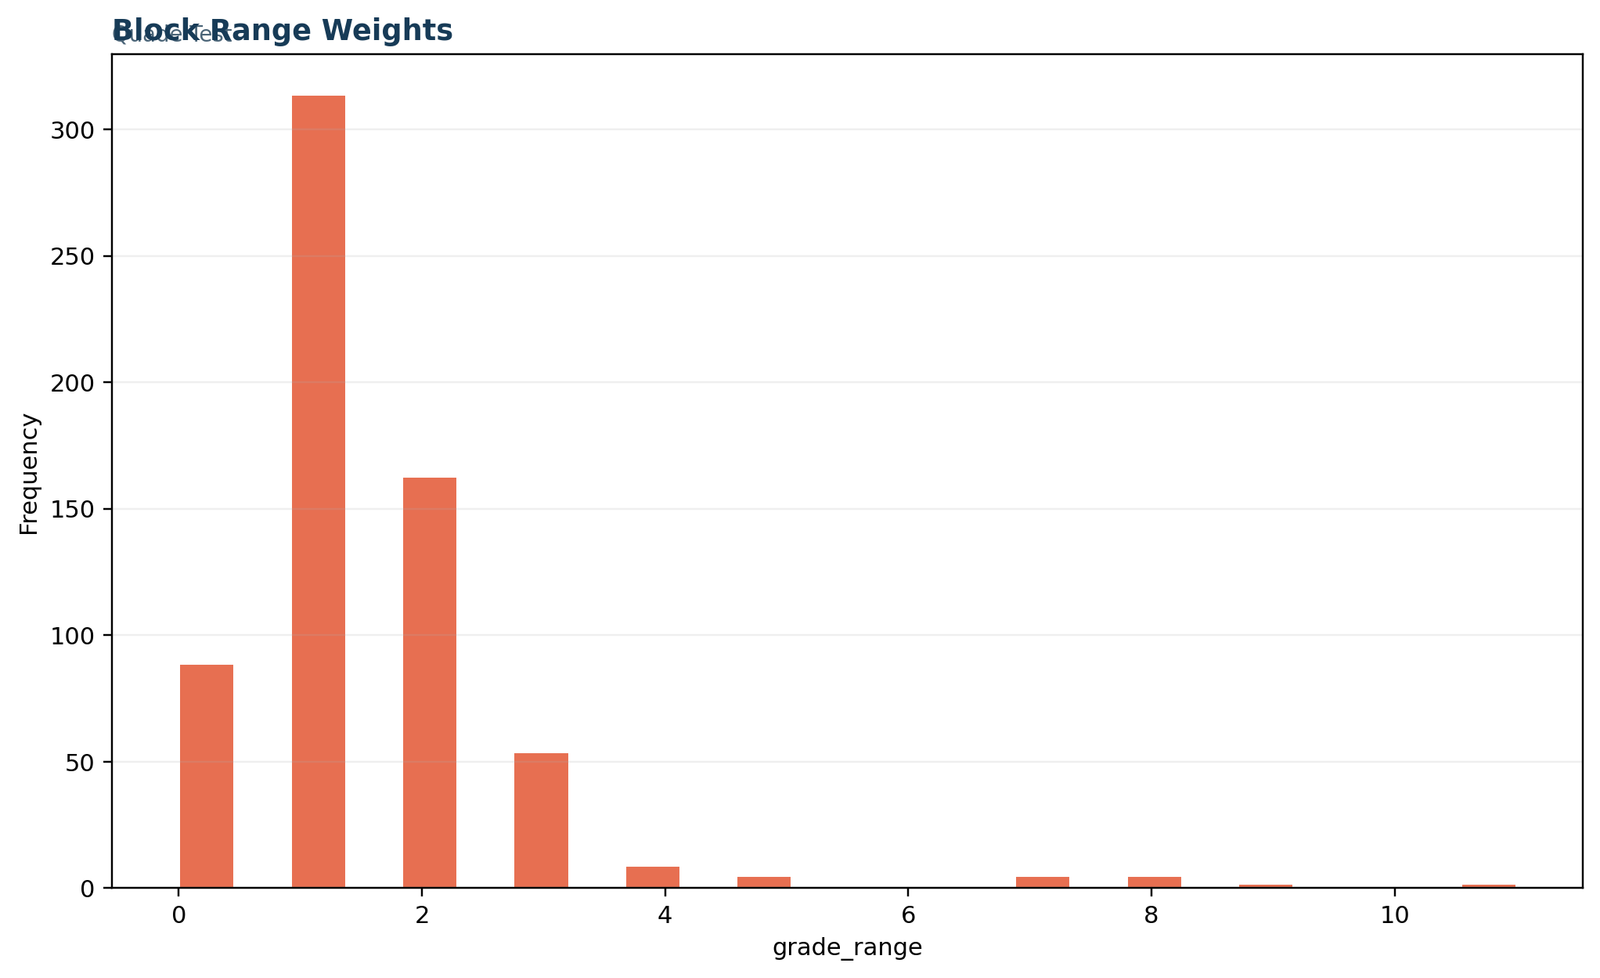
Among 649 blocks, 89 had range 0, 314 had range 1, 163 had range 2, and 54 had range 3. Only 29 students had a range of 4 or more. The quartiles were Q1 = 1, median = 1 and Q3 = 2, with maximum 11.
This concentration explains why the range-rank distribution contains large ties. All 314 range-1 blocks share rank 246.5; all 163 range-2 blocks share rank 485.0. The weighting is therefore not a simple copy of the raw range.
Weighted treatment totals
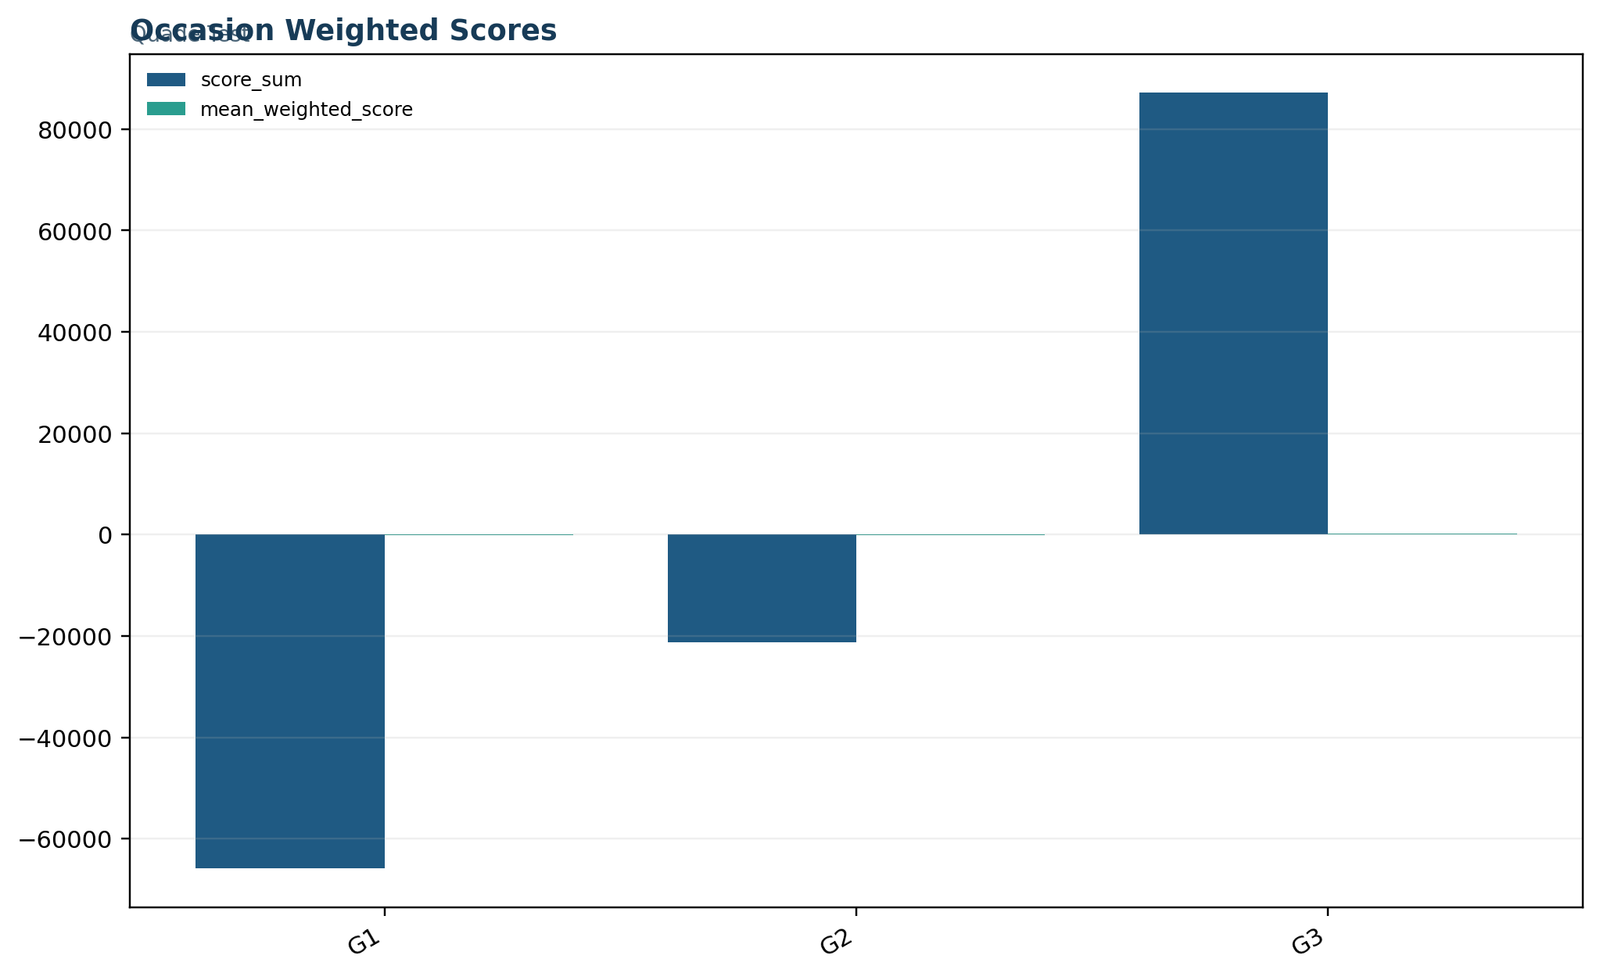
Summing the 649 weighted scores gives −65,888.25 for G1, −21,292.75 for G2 and 87,181.00 for G3. Dividing by 649 gives mean weighted scores of −101.523, −32.809 and 134.331. These signs and magnitudes indicate that high within-student ranks occur most strongly at G3, especially in blocks with larger ranges.
The ordinary within-row rank sums are 1,143, 1,232 and 1,519. The Quade test changes the result by multiplying each centered rank by the student’s range rank before the column totals are formed.
Verified omnibus result
p = 9.1751 × 10⁻³⁸
The intermediate terms were A = 154,878,660.875 and B = 19,098,874.3477. The calculation is [(649−1)B]/(A−B), producing the reported F statistic. Because the upper-tail p-value is far below .05, the equal-location null is rejected.
Python charts for the Quade test
Five visuals document the statistic, weighted scores, block-range distribution and final verification.
The Python charts make the Quade test calculation inspectable. They should be read with the exact labels because several panels combine quantities measured on very different scales.
Python chart 1: primary metrics
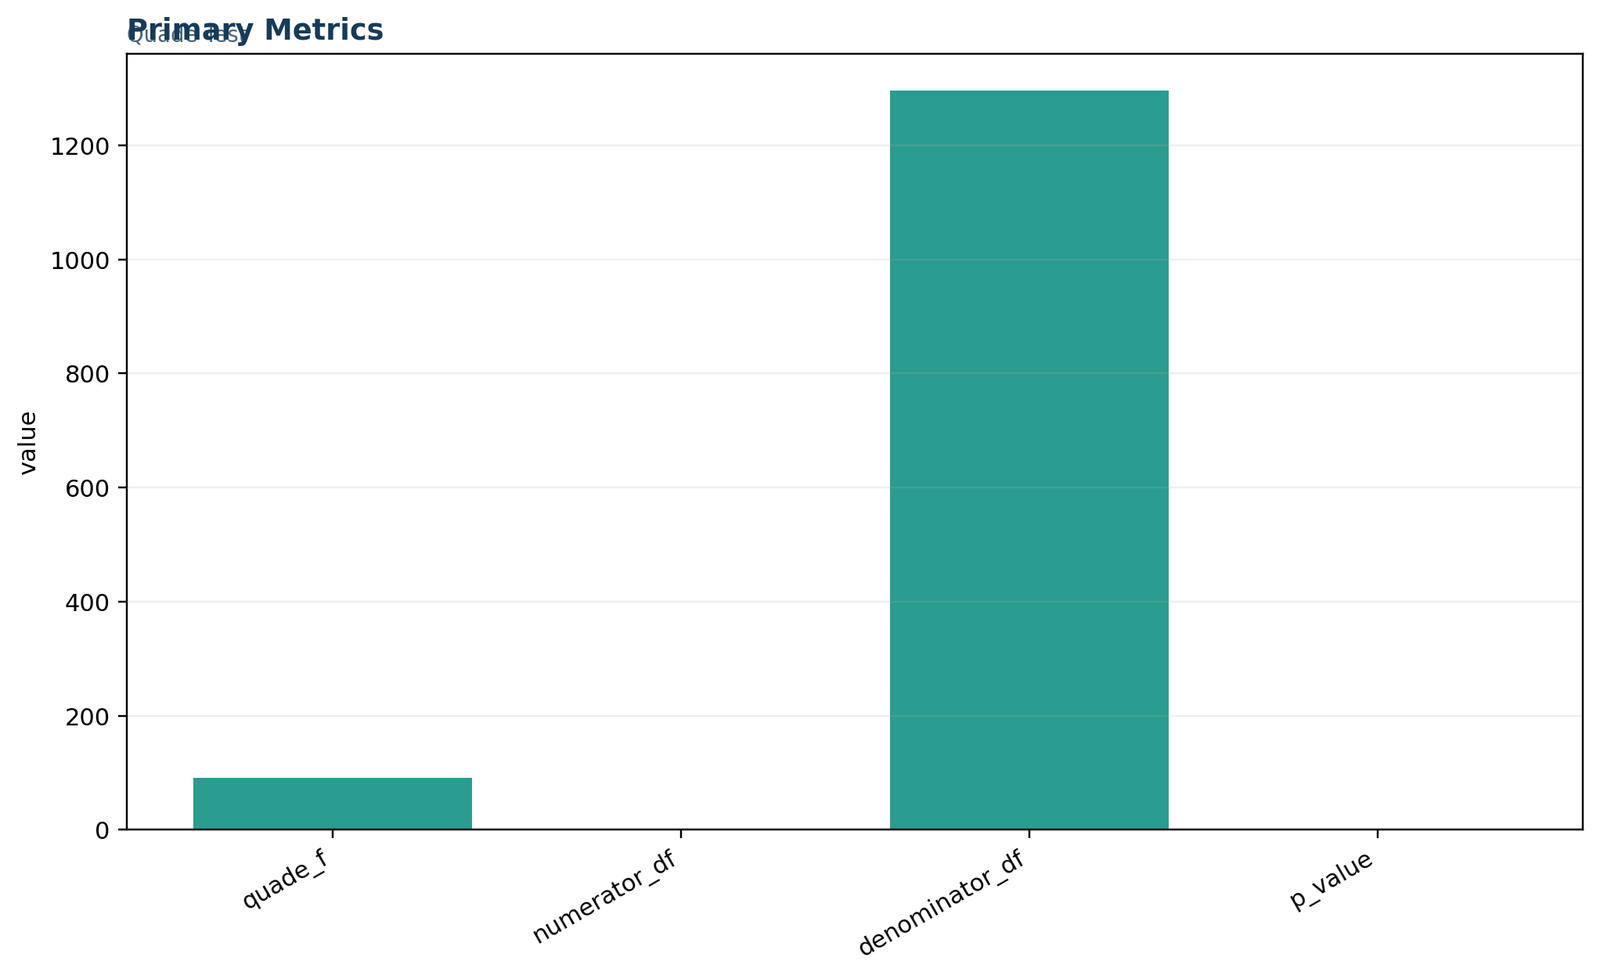
The primary panel places Quade F = 91.1481 beside numerator df = 2, denominator df = 1296 and the p-value. Denominator degrees of freedom dominate the common axis, while p = 9.18 × 10⁻³⁸ is visually indistinguishable from zero. The graph is a result inventory; the exact labels, not comparative bar lengths, provide the interpretation.
Python chart 2: occasion weighted scores
The score-sum bars show −65,888.25 for G1, −21,292.75 for G2 and 87,181.00 for G3. The negative-to-positive progression is clear, and the three sums cancel to zero. The much larger positive G3 value means that high within-row ranks are concentrated at G3, particularly in blocks assigned larger range weights.
Python chart 3: block-range weights
The distribution is concentrated at small ranges: 89 blocks have range 0, 314 have range 1, 163 have range 2 and 54 have range 3. Sparse values extend to 11. This chart explains why most rows receive moderate or low range ranks, while a small number of highly separated rows receive the largest weights.
Python chart 4: range-rank quantiles
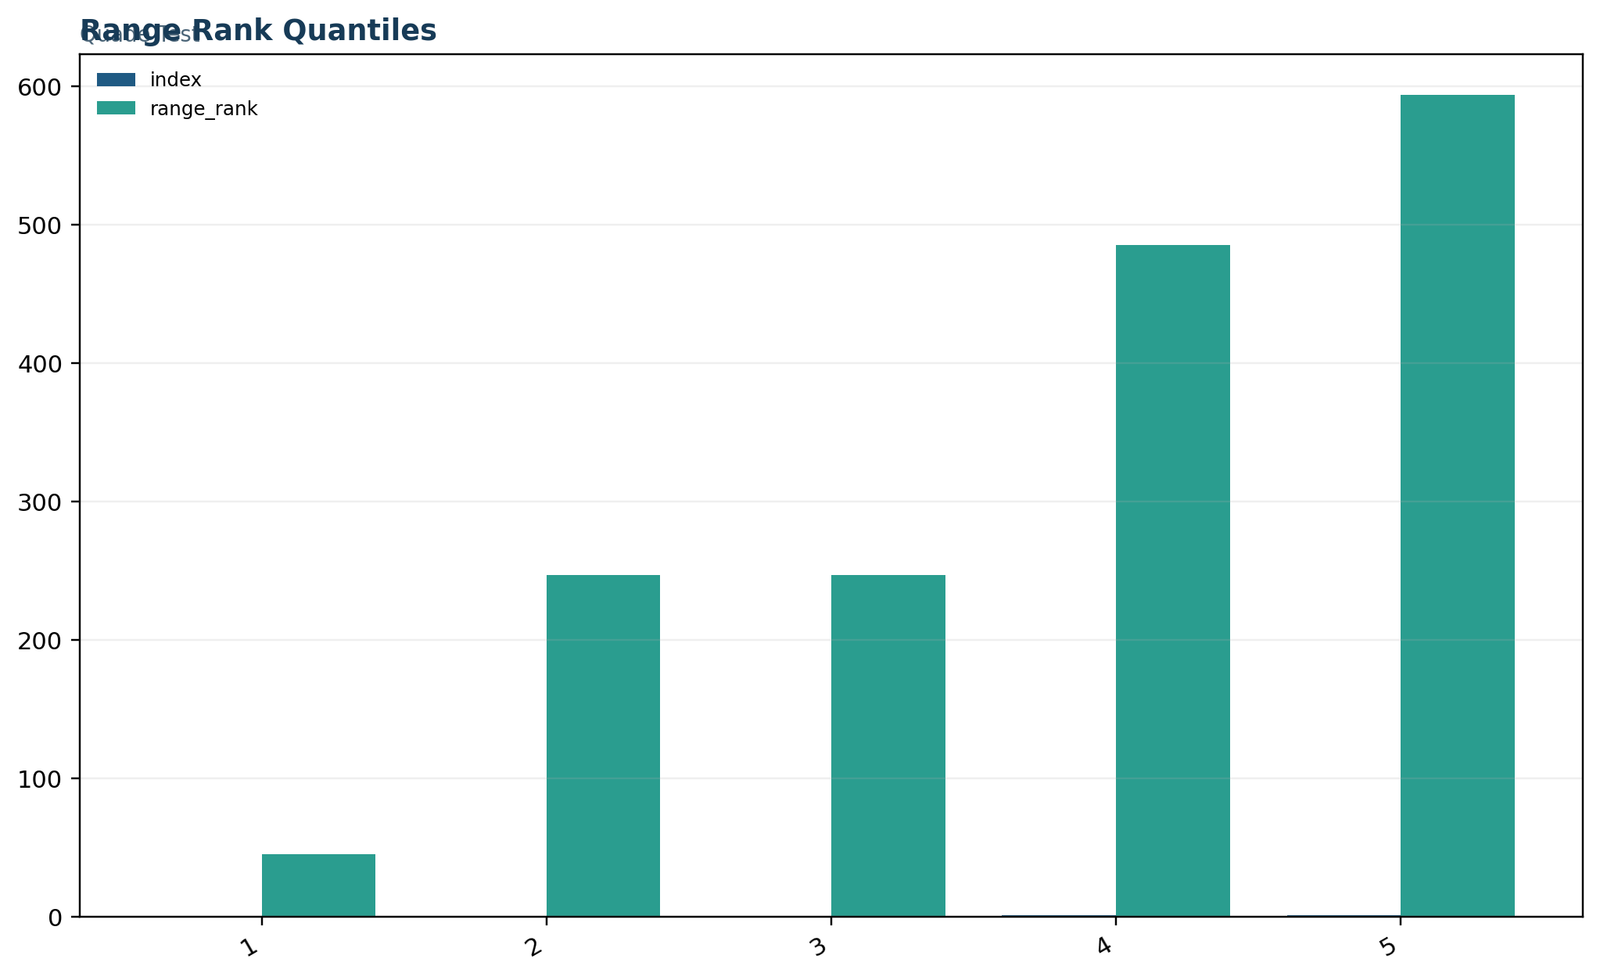
The five displayed range-rank summaries are minimum 45, Q1 246.5, median 246.5, Q3 485 and maximum 648.5. The equal first quartile and median result from the large tie group at raw range 1. These are average ranks, so a minimum rank greater than 1 is expected when 89 zero-range blocks share the bottom positions.
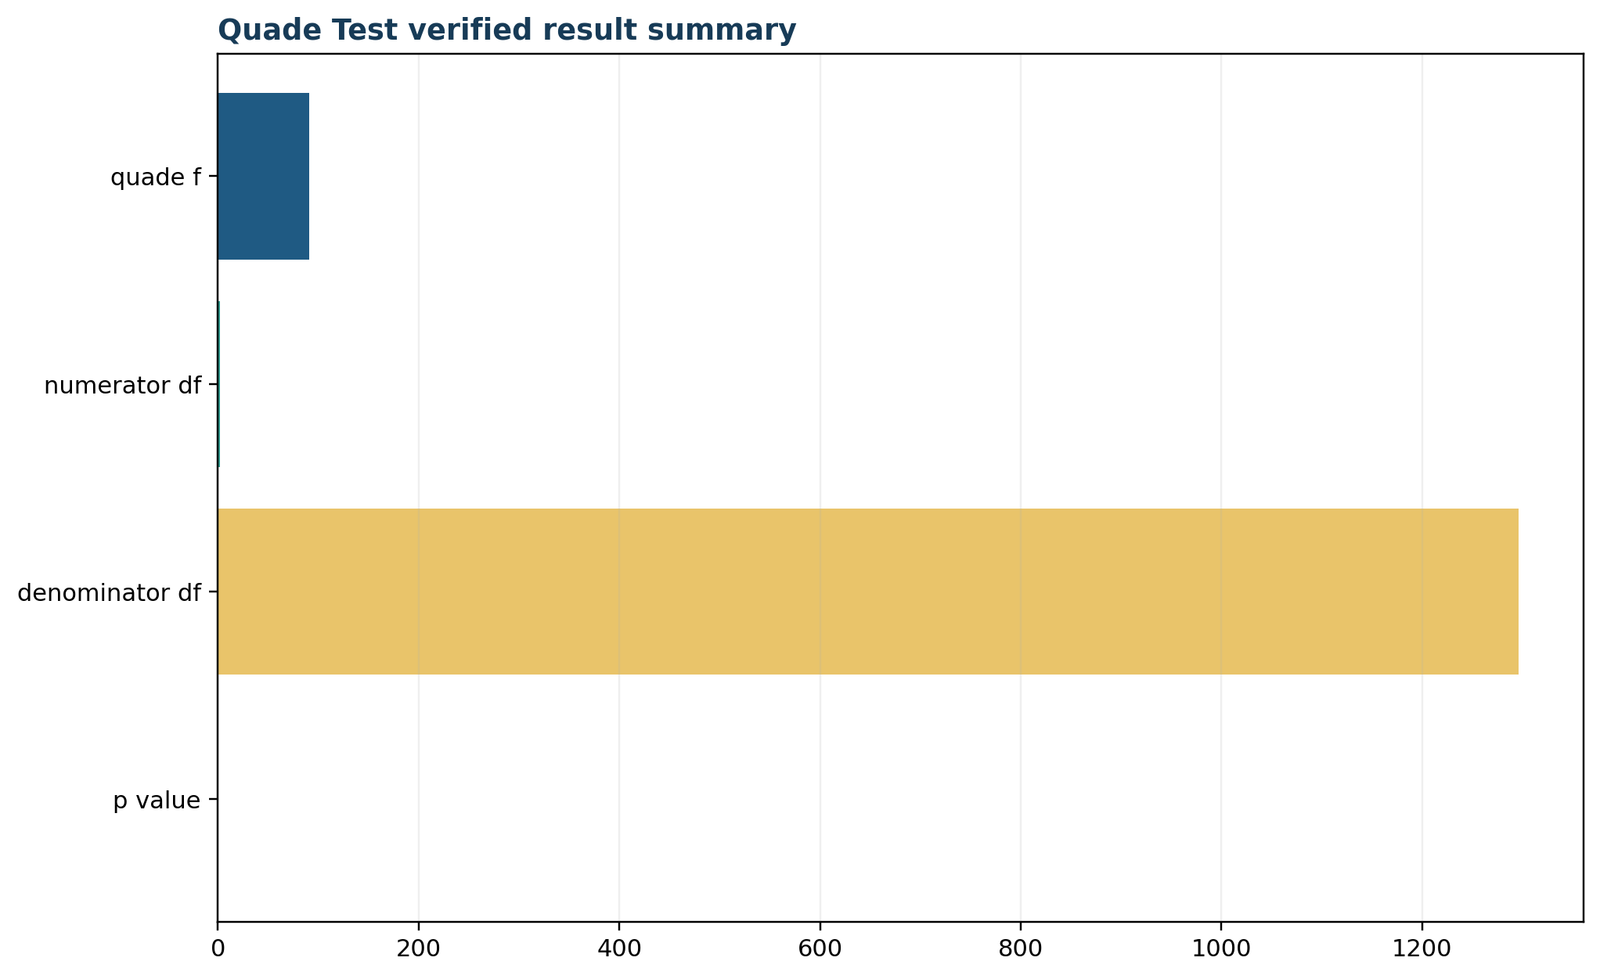
Python chart 5: verified result summary
The horizontal summary repeats F = 91.1481, df1 = 2, df2 = 1296 and p = 9.1751 × 10⁻³⁸. As in the first chart, the p-value is compressed by the common numeric scale. Agreement between the chart labels, workbook reporting sheet and manual formula confirms the primary result.
R charts for the Quade test
The R report independently confirms the same values and tie-aware weighting pattern.
The R charts reproduce the Quade test from the complete grade matrix. Matching Python and R values are a strong protection against ranking the wrong axis or using ordinary ranks for tied ranges.
R chart 1: primary metrics
The R primary-metrics plot carries the same four fields: Quade F, two degrees of freedom and the upper-tail probability. The denominator df bar is largest because it equals 1296. The important check is not visual equality with Python but exact numerical agreement at F = 91.1481074894 and p = 9.1751191712 × 10⁻³⁸.
R chart 2: weighted condition scores
R reproduces the three treatment totals exactly. G1 is strongly negative, G2 is moderately negative and G3 is strongly positive. This pattern supports the descriptive increase across grade occasions but remains part of an unordered omnibus test. A formal ordered claim belongs to Page’s test.
R chart 3: range-frequency profile
The frequency bars verify all major range counts and reveal the long, sparse right tail. Zero-range blocks make no weighted-score contribution because all their within-row ranks equal the center, even though their average range rank is 45. Large-range blocks can contribute strongly, but only according to their rank pattern and sign.
R chart 4: range-rank quantiles
The minimum and maximum range ranks are 45 and 648.5 rather than 1 and 649 because the smallest and largest raw ranges are tied. The quartiles 246.5, 246.5 and 485 align with the workbook. This is an especially useful diagnostic because incorrect tie handling often leaves the omnibus p-value plausible while changing intermediate scores.
R chart 5: verified result summary
The final R panel consolidates the test statistic and reference-distribution parameters. It confirms that the result is an approximate F statistic with two numerator and 1296 denominator degrees of freedom—not a chi-square statistic. Reporting the distribution prevents confusion with Friedman output.
How to run the Quade test in Python
Python can reproduce every intermediate term even without a dedicated one-line SciPy test function.
A transparent Python Quade test implementation uses SciPy for average ranks and the F survival function, while NumPy handles the matrix operations.
import numpy as np
import pandas as pd
from scipy.stats import rankdata, f, t# One row per complete block; columns are the three related occasions.
df = pd.read_csv("dataset.csv")
wide = df[["G1", "G2", "G3"]].dropna().astype(float)
y = wide.to_numpy()
b, k = y.shape
# Step 1: rank observations within every block. Average ranks handle ties.
within_ranks = np.apply_along_axis(rankdata, 1, y, method="average")
# Step 2: calculate each block range and rank the ranges across blocks.
block_ranges = y.max(axis=1) - y.min(axis=1)
range_ranks = rankdata(block_ranges, method="average")
# Step 3: center each within-block rank and apply its block weight.
center = (k + 1) / 2
scores = range_ranks[:, None] * (within_ranks - center)
score_sums = scores.sum(axis=0)
# Step 4: Quade's A, B, approximate F statistic, and upper-tail p-value.
A = np.sum(scores ** 2)
B = np.sum(score_sums ** 2) / b
F_quade = (b - 1) * B / (A - B)
df_num = k - 1
df_den = (b - 1) * (k - 1)
p_value = f.sf(F_quade, df_num, df_den)
print("complete blocks:", b)
print("occasions:", k)
print("weighted score sums:", dict(zip(wide.columns, score_sums)))
print("A:", A)
print("B:", B)
print("Quade F:", F_quade)
print("degrees of freedom:", df_num, df_den)
print("p-value:", p_value)
# Optional protected all-pairs comparisons after a significant omnibus test.
denom = np.sqrt((2 * b * (A - B)) / ((b - 1) * (k - 1)))
raw = []
for i in range(k):
for j in range(i + 1, k):
t_value = abs(score_sums[i] - score_sums[j]) / denom
p_raw = 2 * t.sf(t_value, df_den)
raw.append([wide.columns[i], wide.columns[j], t_value, p_raw])
# Holm adjustment.
order = np.argsort([r[3] for r in raw])
adjusted = [None] * len(raw)
running = 0.0
for step, idx in enumerate(order):
candidate = (len(raw) - step) * raw[idx][3]
running = max(running, candidate)
adjusted[idx] = min(1.0, running)
for row, p_holm in zip(raw, adjusted):
print(row[0], "vs", row[1], "t=", row[2], "raw p=", row[3],
"Holm p=", p_holm)
Rank across rows
np.apply_along_axis(rankdata, 1, y) ranks G1, G2 and G3 inside each student. Ranking down columns would compare students with one another and destroy the blocked design.
Rank the ranges separately
The second rankdata call acts on the one-dimensional vector of row ranges. Both ranking stages use method="average". Keep these steps separate so the tie policy is auditable.
Use the upper F tail
f.sf(F_quade, df_num, df_den) returns the upper-tail probability accurately. Do not use a normal distribution or a chi-square distribution for the reported Quade F approximation.
How to run the Quade test in R
Base R provides the omnibus test, and PMCMRplus supplies protected all-pairs comparisons.
R is the simplest validated route for the omnibus Quade test because stats::quade.test() accepts a complete matrix directly.
# Base R includes the omnibus Quade test.
dat <- read.csv("dataset.csv")
wide <- na.omit(dat[c("G1", "G2", "G3")])result <- quade.test(as.matrix(wide))
print(result)
# Independently reconstruct the intermediate values.
y <- as.matrix(wide)
b <- nrow(y)
k <- ncol(y)
r <- t(apply(y, 1, rank, ties.method = "average"))
q <- rank(apply(y, 1, function(x) max(x) - min(x)),
ties.method = "average")
s <- q * (r - (k + 1) / 2)
S <- colSums(s)
A <- sum(s^2)
B <- sum(S^2) / b
Fq <- (b - 1) * B / (A - B)
df1 <- k - 1
df2 <- (b - 1) * (k - 1)
p <- pf(Fq, df1, df2, lower.tail = FALSE)
print(S)
print(c(A = A, B = B, F = Fq, df1 = df1, df2 = df2, p = p))
# Optional protected post hoc comparisons.
# install.packages("PMCMRplus")
library(PMCMRplus)
posthoc <- quadeAllPairsTest(
y,
dist = "TDist",
p.adjust.method = "holm"
)
print(posthoc)
Matrix orientation
When a matrix is supplied, R interprets columns as groups and rows as blocks. Therefore as.matrix(wide) must have G1, G2 and G3 in columns and one student in every row. Transposing the matrix would produce 649 “groups” and three “blocks,” which is not the intended analysis.
R removes a block when its row contains a missing value. Report the number of complete rows that reach the function. The verified analysis retains all 649 rows.
Post hoc function choices
PMCMRplus::quadeAllPairsTest() offers t-distribution and normal approximations. The TDist option uses the Quade weighted-score sums and denominator derived from A−B, with denominator df (b−1)(k−1). Apply Holm or another justified familywise adjustment. State the package, approximation and adjustment method.
In the verified data, Holm-adjusted comparisons are significant for G1–G2, G1–G3 and G2–G3. These results localize the global difference; they do not replace the omnibus test.
Quade test in SPSS
Standard related-samples menus provide Friedman and Kendall procedures, not a dedicated native Quade command.
A reproducible SPSS Quade test workflow should call Python or R integration, or explicitly calculate both layers of ranks. Native Friedman output can support the interpretation but must not be relabeled as Quade.
* G1, G2 and G3 must be complete repeated observations in one row.
* Standard SPSS related-samples menus do not include a dedicated Quade test.
* The safest reproducible route is SPSS Python integration.BEGIN PROGRAM Python3.
import spssdata
import numpy as np
from scipy.stats import rankdata, f
variables = ["G1", "G2", "G3"]
with spssdata.Spssdata(indexes=variables, accessType="r") as cur:
rows = [list(row) for row in cur.fetchall()
if all(value is not None for value in row)]
y = np.asarray(rows, dtype=float)
b, k = y.shape
r = np.apply_along_axis(rankdata, 1, y, method="average")
ranges = y.max(axis=1) - y.min(axis=1)
q = rankdata(ranges, method="average")
s = q[:, None] * (r - (k + 1) / 2)
S = s.sum(axis=0)
A = np.sum(s ** 2)
B = np.sum(S ** 2) / b
Fq = (b - 1) * B / (A - B)
df1 = k - 1
df2 = (b - 1) * (k - 1)
p = f.sf(Fq, df1, df2)
print("Quade test")
print("Complete blocks =", b)
print("Weighted score sums =", S)
print("F =", Fq, "df =", df1, df2, "p =", p)
END PROGRAM.
* Native supporting analysis, not a substitute for the Quade statistic.
NPAR TESTS
/FRIEDMAN=G1 G2 G3
/STATISTICS=DESCRIPTIVES QUARTILES.
What native SPSS can confirm
The standard several-related-samples procedure can produce descriptives, Friedman χ² and Kendall’s W. For this dataset, the supporting Friedman result is χ²(2) = 167.328, p < .001, with W = 0.1289. Mean ranks are 1.761, 1.898 and 2.341.
These values support the conclusion that grade occasions differ, but they do not use ranked block ranges. Therefore they are not the Quade F statistic and should occupy a clearly labeled supporting section.
Why integration is safer than long syntax
For three columns, SPSS transformations can manually create within-row ranks. The difficult step is ranking the row ranges across all cases while preserving average ties, then aggregating weighted scores without losing the original file. Python or R integration implements the validated formula directly and scales to any number of conditions.
Save a transcript that prints b, k, score sums, A, B, F, degrees of freedom and p. A single final p-value is insufficient for quality control.
Quade test in Excel
The supplied workbook keeps raw values, row-level transformations, calculations, diagnostics and reporting on separate sheets.
Excel is effective for auditing the Quade test because both tie-aware ranking stages and every weighted score remain visible.
Assume G1:G3 occupy A5:C653 and there are 649 complete blocks.D5: =RANK.AVG(A5,$A5:$C5,1) [within-block rank G1]
E5: =RANK.AVG(B5,$A5:$C5,1) [within-block rank G2]
F5: =RANK.AVG(C5,$A5:$C5,1) [within-block rank G3]
G5: =MAX(A5:C5)-MIN(A5:C5) [block range]
H5: =RANK.AVG(G5,$G$5:$G$653,1) [rank of block range]
I5: =H5*(D5-(3+1)/2) [weighted score G1]
J5: =H5*(E5-(3+1)/2) [weighted score G2]
K5: =H5*(F5-(3+1)/2) [weighted score G3]
Copy D5:K5 through row 653.
Weighted sum G1: =SUM(I5:I653)
Weighted sum G2: =SUM(J5:J653)
Weighted sum G3: =SUM(K5:K653)
A term: =SUMSQ(I5:K653)
B term: =(WeightedSum_G1^2+WeightedSum_G2^2+WeightedSum_G3^2)/649
Quade F: =(649-1)*B_term/(A_term-B_term)
Numerator df: =3-1
Denominator df: =(649-1)*(3-1)
p-value: =F.DIST.RT(Quade_F,2,1296)
Decision: =IF(p_value<0.05,"Reject H0","Do not reject H0")
Workbook architecture
Data_Input contains only G1, G2 and G3. Working contains within-row ranks, block ranges, range ranks and weighted scores. Calculations aggregates treatment totals and computes A, B and F. Diagnostics records design assumptions. Reporting compares formula results with the verified reference.
This separation prevents a chart or manual result from being mistaken for source data. It also allows every published number to be traced back to one row and formula.
Excel tie handling
RANK.AVG is required twice. The relative reference $A5:$C5 ranks across a row, while the absolute range $G$5:$G$653 ranks all block ranges. Do not use RANK.EQ; tied ranges would receive the same first position without averaging the occupied positions.
Use F.DIST.RT for the p-value. If Excel displays 0 because of formatting, increase scientific-notation precision. The verified reference is 9.175119171202815E−38, not exactly zero.
Quade test assumptions and diagnostics
The Quade test is distribution-free with respect to a normal model, but it is not assumption-free.
Before reporting a Quade test, verify the complete-block structure, independence between blocks, meaningful numerical ranges and consistent tie handling.
Independent blocks
Students should be independent of other students. Dependence within a student is expected and is the reason for blocking. If students are clustered in classes or schools, an additional hierarchy may remain after the simple block adjustment.
Related conditions
Every column must represent a condition applied to or observed for the same blocks. The Quade test cannot combine unrelated group samples merely because they have equal sizes.
Complete unreplicated cells
There is one observation per block-condition combination. Replicate measurements inside a cell require a prespecified summary or a model that represents replication directly.
Meaningful range
The difference between maximum and minimum must have a meaningful scale. The Quade test therefore needs more than the ability to order categories; interval or ratio outcomes are safest.
Tie-aware ranks
Use average ranks for tied condition values and tied block ranges. Document the software rule because dense ties are common with discrete scores such as grades.
Comparable treatment effects
The usual interpretation assumes the treatment contrast is meaningful across blocks. Severe interactions, reversals or changing measurement definitions can make one omnibus location statement too simple.
| Diagnostic | Verified value | Interpretation |
|---|---|---|
| Complete-block count | 649 of 649 source rows | No analyzed row lacks G1, G2 or G3 |
| Zero-range blocks | 89 | Flat rows contribute zero weighted score |
| Range quartiles | 1, 1, 2 | Most blocks show modest separation |
| Maximum range | 11, occurring twice | Largest blocks share average range rank 648.5 |
| Weighted-score audit | Column totals sum to 0 | Centering and aggregation are internally consistent |
| Cross-software F | 91.1481074894 | Workbook, Python and R agree |
Sensitivity to extreme ranges
Quade uses ranks of ranges, not the raw ranges themselves. Consequently, an 11-point range does not receive eleven times the weight of a one-point range. It receives a high rank. This limits direct magnitude domination, but a few large-range blocks can still contribute strongly when their condition ranks align.
Review the largest ranges and verify that they are genuine observations rather than coding errors. Use outlier detection as a data-quality exercise, not as an automatic deletion rule.
Descriptive shape and practical significance
The Quade test does not require multivariate normality, but distribution plots remain useful for understanding floor effects, ceiling effects and discrete ties. Review box plots, histograms, standard deviations and interquartile ranges.
A tiny p-value should be accompanied by raw summaries and an effect-size discussion. Statistical significance is not the same as educational importance.
Quade test comparisons, effect size and post hoc analysis
Choose the Quade test according to design, scale and research question rather than by whichever p-value is smallest.
The Quade test belongs to a family of related-samples procedures, but its range weighting gives it a distinct role.
| Method | Design | Main question | Important distinction |
|---|---|---|---|
| Quade test | Three or more complete related conditions | Do locations differ after range-weighted block adjustment? | Ranks block ranges and weights centered within-block ranks |
| Friedman test | Three or more complete related conditions | Do condition rank distributions differ? | Every block contributes equally after within-row ranking |
| Page’s trend test | Ordered complete related conditions | Is there a prespecified monotonic trend? | Directional and usually one-sided |
| Repeated-measures ANOVA | Related quantitative conditions | Do model-based means differ? | Parametric mean model with covariance assumptions |
| Mixed-effects regression | Repeated or clustered observations | How do outcomes vary with conditions and covariates? | Handles incomplete and more complex structures |
| Nemenyi post hoc test | Pairs after Friedman | Which mean ranks differ? | Not the canonical range-weighted Quade follow-up |
Protected Quade all-pairs results
Using the TDist approximation and Holm adjustment, the verified weighted-score comparisons are:
All three pairs are significant, which localizes the omnibus difference. Report the adjustment method and clarify that the comparisons were protected by a significant global test.
Effect-size strategy
There is no single universally mandated Quade effect size. Report original-scale means, medians, IQRs and pairwise differences. A supporting repeated-rank effect such as Kendall’s W may be included with careful labeling; here W = 0.1289 from Friedman. It is not derived from the Quade F statistic.
For decision making, state that the mean increased by about 0.171 from G1 to G2, 0.336 from G2 to G3 and 0.507 from G1 to G3. Add confidence intervals from a suitable paired resampling or model if interval estimation is a priority. See effect size and confidence interval guides.
How to report the Quade test in APA style
State the complete-block design, weighting rationale, statistic, degrees of freedom, p-value and follow-up method.
A strong Quade test interpretation separates the omnibus conclusion from direction, pairwise localization and practical magnitude.
APA-style results paragraph
“A Quade test was conducted to compare G1, G2 and G3 grades for 649 students, treating student as a complete block and weighting within-student ranks by ranked grade ranges. Grade occasion had a statistically significant effect, FQ(2, 1296) = 91.15, p < .001. Weighted score sums were −65,888.25 for G1, −21,292.75 for G2 and 87,181.00 for G3. Holm-adjusted Quade pairwise comparisons indicated that all three grade occasions differed (all adjusted ps ≤ .000137). Raw means increased from 11.40 at G1 to 11.57 at G2 and 11.91 at G3.”
Exact-p technical report
For reproducibility, write the exact scientific-notation value in a technical appendix: p = 9.1751 × 10⁻³⁸. In ordinary APA prose, p < .001 is sufficient. Also record A = 154,878,660.875, B = 19,098,874.3477, average tie handling, complete-block deletion rules, software versions and the post hoc approximation.
Do not report p = .000 or “100% significant.” A probability displayed as zero is a formatting artifact.
Include
Number of complete blocks, number and labels of conditions, range-weighting reason, F statistic, both degrees of freedom, p-value, descriptive summaries and follow-up adjustment.
Avoid
Calling the statistic χ², saying the test compares means directly, claiming every participant changed, or describing a significant result as proof of a causal time effect.
Discuss limitations
Complete-case analysis, dense ties, possible cluster dependence beyond student, measurement-scale assumptions, and the absence of a universally standardized Quade effect size.
Quade test downloads and reproducibility files
Use the full reports for software-specific output and the workbook for cell-level auditing.
R reportBase R Quade test, independent reconstruction and R charts.Download PDF →
SPSS outputRelated-samples supporting output and documented Quade result.Download PDF →
Excel workbookRaw values, row ranks, range ranks, formulas, diagnostics and reporting.Download XLSX →
Reproducibility checklist
Publication checklist
Quade test frequently asked questions
Answers to practical questions about assumptions, software, interpretation and alternatives.
What is the Quade test?
The Quade test is a nonparametric omnibus test for three or more treatments in an unreplicated complete-block design. It ranks outcomes within blocks, ranks the numerical range of every block and weights centered treatment ranks by those range ranks.
What is the difference between the Quade test and Friedman test?
Both analyze complete related conditions. Friedman gives blocks equal influence after within-block ranking. Quade additionally ranks block ranges and gives greater weight to blocks with larger within-block separation. Quade therefore requires a scale on which subtraction is meaningful.
Is the Quade test a nonparametric repeated-measures ANOVA?
It is commonly described as a nonparametric alternative for complete repeated-measures or randomized block data, but it does not estimate the same mean-model parameters as ANOVA. Report its rank-and-range-weighted hypothesis directly.
How many groups are required?
The Quade test can be defined for two or more treatments, but it is most often used for three or more related conditions. With two treatments, it is closely related to a signed-rank approach.
Can the Quade test use ordinal data?
Within-block ranks only require order, but the block-range step subtracts the minimum from the maximum. Strictly ordinal categories may not have meaningful equal spacing, so interval or ratio outcomes are preferable.
How are ties handled?
Use average ranks both for tied outcomes within a block and for tied ranges across blocks. In the example, 314 students share raw range 1 and therefore share average range rank 246.5.
Does a significant Quade test identify the different pairs?
No. It is an omnibus result. Use a protected Quade all-pairs procedure with an adjustment such as Holm. In the worked example, all three pairs are significant after Holm adjustment.
What does F(2, 1296) = 91.148 mean?
91.148 is the approximate Quade F statistic. The numerator df is k−1 = 2, and the denominator df is (b−1)(k−1) = 1296. Its upper-tail probability is 9.18 × 10⁻³⁸.
Does Python have a built-in Quade function?
A dedicated one-line SciPy function is not necessary. SciPy’s rankdata and F survival function, combined with NumPy matrix operations, reproduce the standard calculation transparently.
How do I run the Quade test in R?
Place conditions in columns and blocks in rows, then use quade.test(as.matrix(data)). For follow-up comparisons, PMCMRplus provides quadeAllPairsTest.
Does SPSS have a native Quade menu?
Standard related-samples menus document Friedman, Kendall and Cochran procedures rather than a dedicated Quade test. Use Python/R integration or an audited custom transformation, and label native Friedman output as supporting evidence only.
Can Excel calculate the Quade test?
Yes. Use RANK.AVG within rows, calculate and rank row ranges, form weighted scores, and calculate A, B, F and F.DIST.RT. The supplied workbook exposes all intermediate cells.
What did the Quade test find in the grade example?
The conditions differed strongly: F(2, 1296) = 91.1481, p = 9.1751 × 10⁻³⁸. G3 had the largest positive weighted score sum, and Holm-adjusted pairwise comparisons found all three occasions different.
Does the result prove that every student improved?
No. The Quade test evaluates a population-level range-weighted pattern. Some students have flat grades, decreases or nonmonotonic sequences. In this dataset, 398 of 649 rows are nondecreasing and 95 are strictly increasing.
What happens to blocks with equal values?
A completely flat block has centered ranks of zero, so its weighted scores are all zero. The 89 flat rows in the example do not favor any condition, even though their ranges receive average rank 45.
What should I do with missing repeated observations?
The standard matrix test removes incomplete blocks. Report the deletion rule and remaining sample. For substantial or informative missingness, use a longitudinal model that can include partial records under explicit assumptions.
What effect size should accompany the Quade test?
There is no single universally required Quade effect size. Report raw summaries and paired differences. A supporting Kendall’s W may be reported with clear labeling; here the Friedman-based W is 0.1289.
When is Page’s trend test better?
Use Page’s test when the central hypothesis is a prespecified monotonic order across related conditions. Quade is an unordered global comparison that weights blocks by ranked ranges.