
Regression Diagnostics, Heteroscedasticity, Residual Variance and Robust Reporting
Breusch Pagan Test: Formula, Interpretation, SPSS, Python, R and Excel Guide
Breusch Pagan Test is a regression diagnostic used to test whether the variance of residuals is constant across fitted values or predictors. In plain language, it checks the homoscedasticity assumption. If residual variance changes systematically, the regression model may have heteroscedasticity, which can make ordinary standard errors, t tests, confidence intervals and p-values unreliable. This complete Salar Cafe guide explains the Breusch Pagan Test with SPSS output, Python charts, R validation charts, Excel workflow, formula, hypotheses, residual plots, APA reporting, common mistakes, internal links and downloadable resources.
Quick Answer: Breusch Pagan Test Result
The Breusch Pagan Test tests whether regression residual variance is constant. The null hypothesis says residual variance is constant, meaning the model satisfies the homoscedasticity assumption. The alternative hypothesis says residual variance changes with fitted values or predictors, meaning heteroscedasticity is present. If the Breusch Pagan p-value is below .05, reject the null hypothesis and conclude that heteroscedasticity is detected. If the p-value is greater than or equal to .05, do not reject constant variance.
In this worked example, the regression model is checked using residuals versus fitted values, scale-location plots, squared residuals versus fitted values, p-value decision chart, squared residuals by predictor and group residual variance. The charts help explain whether residual spread is random and stable or whether the variance grows, shrinks or changes systematically across the fitted scale.
Final interpretation: The Breusch Pagan Test should be reported as a residual variance diagnostic. A significant p-value means the model has evidence of heteroscedasticity. A nonsignificant p-value means the test did not find evidence that residual variance changes systematically. The best report combines the p-value with residual plots because charts show the shape and source of variance problems.
Important: A significant Breusch Pagan Test does not mean the regression model is useless. It means the ordinary standard errors may be unreliable. Common follow-ups include robust standard errors, weighted least squares, transformation, model revision, or reporting heteroscedasticity-consistent inference.
Table of Contents
- What Is the Breusch Pagan Test?
- Why the Breusch Pagan Test Matters
- Breusch Pagan Test Formula
- Null and Alternative Hypotheses
- Assumptions and Decision Logic
- Dataset and Regression Variables Used
- Verified SPSS Output Interpretation
- Python Chart-by-Chart Interpretation
- R Chart-by-Chart Validation
- SPSS, Python, R and Excel Workflows
- SPSS, Python, R and Excel Code
- APA Reporting Wording
- Common Mistakes
- When to Use the Breusch Pagan Test
- Downloads and Resources
- Related Internal Guides
- FAQs
What Is the Breusch Pagan Test?
The Breusch Pagan Test is a formal statistical test for heteroscedasticity in regression. Heteroscedasticity occurs when the residual variance is not constant across the range of fitted values or predictors. In a well-behaved ordinary least squares regression model, the residual spread should be roughly similar at low fitted values, middle fitted values and high fitted values.
When residual variance changes, the regression coefficients may still be unbiased under many conditions, but the standard errors can be wrong. If standard errors are wrong, the t tests, p-values and confidence intervals can also be misleading. That is why the Breusch Pagan Test is important for serious regression reporting.
Simple definition: The Breusch Pagan Test checks whether residual variance changes systematically with fitted values or predictors. It is a formal test of the constant variance assumption.
The Breusch Pagan Test is usually interpreted together with visual diagnostics and other regression checks. For a complete regression workflow, pair it with the Goldfeld-Quandt Test, Ramsey RESET Test, Q-Q Plot Normality Check, P-P Plot Normality Check, and descriptive statistics.
Why the Breusch Pagan Test Matters
The Breusch Pagan Test matters because ordinary least squares regression assumes that the residuals have constant variance. This assumption is called homoscedasticity. If the residual variance is unequal, the model has heteroscedasticity. Heteroscedasticity is common in educational, economic, business, health and social science data because variability often changes as predicted values increase or as groups differ.
For example, in a model predicting student performance, residual variance may be different for low-performing and high-performing students. The model may predict some ranges more consistently than others. A residuals-versus-fitted plot can reveal this visually, while the Breusch Pagan Test provides a formal p-value decision.
| Regression Issue | What the Breusch Pagan Test Checks | Why It Matters |
|---|---|---|
| Residual spread changes across fitted values | Whether squared residuals are related to fitted values or predictors | Changing spread can distort standard errors. |
| Model has funnel-shaped residuals | Whether residual variance systematically grows or shrinks | Funnel patterns often indicate heteroscedasticity. |
| Group residual variance differs | Whether residual variance is unequal across categories | Group-based variance differences can affect inference. |
| p-values seem unreliable | Whether ordinary standard errors may be inappropriate | Robust standard errors may be needed. |
For variance-related assumption checks, also review the Levene Test, Brown-Forsythe Test, and Cochran C Test. Those tests are often used for group variance comparisons, while Breusch Pagan is designed for regression residual variance.
Breusch Pagan Test Formula
The Breusch Pagan Test begins with an ordinary least squares regression model. After the original model is fitted, residuals are saved. The squared residuals are then used in an auxiliary regression to see whether residual variance is related to fitted values or predictors.
After fitting the model, calculate residuals:
The Breusch Pagan logic then regresses squared residuals on predictors or fitted values:
The common LM version of the test is:
Where n is sample size and R² auxiliary is the R-squared from the auxiliary regression of squared residuals on predictors. Under the null hypothesis, the LM statistic is approximately chi-square distributed with degrees of freedom equal to the number of predictors in the auxiliary regression.
| Formula Element | Meaning | Interpretation |
|---|---|---|
| ei | Residual | Observed value minus fitted value. |
| ei2 | Squared residual | Proxy for residual variance. |
| Auxiliary R² | R² from squared-residual regression | Shows whether residual variance is predictable from fitted values or predictors. |
| LM = nR² | Breusch Pagan LM statistic | Formal test statistic for heteroscedasticity. |
| p-value | Significance decision | If p < .05, heteroscedasticity is detected. |
Null and Alternative Hypotheses for the Breusch Pagan Test
The Breusch Pagan Test has a clear hypothesis structure. The null hypothesis is the desirable assumption: constant residual variance. The alternative hypothesis is the problem: residual variance changes systematically.
| Hypothesis | Statement | Meaning for Regression |
|---|---|---|
| Null hypothesis | H0: Residual variance is constant. | The homoscedasticity assumption is supported. |
| Alternative hypothesis | H1: Residual variance is not constant. | Heteroscedasticity is present. |
| Decision rule | Reject H0 if p < .05. | A significant result indicates heteroscedasticity. |
Decision wording: If the Breusch Pagan p-value is below .05, report that heteroscedasticity was detected. If the p-value is not below .05, report that the test did not provide evidence against constant residual variance.
This decision affects the interpretation of coefficients, effect size, standard errors, t tests, and confidence intervals. It is especially relevant when the regression model is used for formal inference rather than only prediction.
Assumptions and Decision Logic
The Breusch Pagan Test assumes that a regression model has been fitted and residuals are available. It is normally used after checking whether the model itself is reasonable. If the model has serious misspecification, omitted nonlinear terms or outliers, the heteroscedasticity result may partly reflect those broader problems.
| Condition | Why It Matters | Recommended Action |
|---|---|---|
| Regression model fitted first | The test uses residuals from the model. | Fit a theoretically meaningful model before testing. |
| Residuals should be inspected visually | Plots reveal the pattern behind the p-value. | Use residuals vs fitted and scale-location plots. |
| Model specification matters | Misspecification can mimic heteroscedasticity. | Use the Ramsey RESET Test and residual diagnostics. |
| Outliers can influence residual variance | Extreme cases may inflate squared residuals. | Check boxplots and influence diagnostics. |
| Normality is separate | Breusch Pagan is not a normality test. | Use Q-Q plots, Lilliefors Test, or D’Agostino-Pearson Test. |
Interpretation caution: A significant Breusch Pagan Test tells you that residual variance is not constant. It does not automatically identify the best correction. Use charts, model knowledge and follow-up diagnostics to choose between robust standard errors, transformation, weighted regression or model revision.
Dataset and Regression Variables Used
The worked Breusch Pagan Test example uses a student performance regression model. The dependent variable is a final grade variable such as G3, and predictors may include earlier grade measures, study habits, failures, absences and background variables. The purpose is not only to estimate a regression equation, but also to check whether the residual variance remains stable across fitted values and predictors.
| Variable or Output | Role in Breusch Pagan Test | Why It Matters |
|---|---|---|
| G3 final grade | Dependent variable | The outcome predicted by the regression model. |
| Fitted values | Predicted values from regression | Used to inspect whether residual spread changes across prediction levels. |
| Residuals | Observed minus fitted values | Used to diagnose model error pattern. |
| Squared residuals | Variance proxy | Used in the auxiliary regression for the Breusch Pagan Test. |
| Predictors | Explanatory variables | Used to test whether residual variance is related to predictor values. |
| Group variable | Variance comparison context | Shows whether residual variance differs by category or subgroup. |
Before interpreting residual diagnostics, review the raw variables using descriptive statistics, frequency distribution, histogram interpretation, box plot interpretation, and five-number summary.
Verified SPSS Output Interpretation for the Breusch Pagan Test
The SPSS output PDF supports the Breusch Pagan Test workflow for regression heteroscedasticity checking. In SPSS, Breusch Pagan-style interpretation can be produced by saving residuals and predicted values, computing squared residuals, running an auxiliary regression, and checking whether squared residuals are significantly related to fitted values or predictors.
How to Read the SPSS Output
| SPSS Output Item | What It Means | How to Interpret |
|---|---|---|
| Original regression model | Predicts the dependent variable | Provides fitted values and residuals. |
| Unstandardized residuals | Observed minus predicted values | Used to calculate squared residuals. |
| Squared residuals | Residual variance proxy | Dependent variable in the auxiliary regression. |
| Auxiliary regression R² | Explained variance in squared residuals | Used to calculate LM = nR². |
| F or chi-square significance | Formal heteroscedasticity decision | If p < .05, heteroscedasticity is detected. |
| Residual plots | Visual variance pattern | Shows whether spread changes across fitted values or groups. |
SPSS Interpretation Logic
If the auxiliary regression is significant, the squared residuals are related to fitted values or predictors. This supports heteroscedasticity. If the auxiliary regression is not significant, the test does not detect systematic residual variance changes. The SPSS section should report the original model, residual-saving process, auxiliary regression result, p-value decision, and whether robust inference may be needed.
SPSS conclusion template: The Breusch Pagan-style SPSS workflow tested whether squared residuals were systematically related to fitted values or predictors. A significant auxiliary regression or Breusch Pagan p-value indicates heteroscedasticity. A nonsignificant result indicates no evidence against constant variance under this test.
SPSS reporting caution: SPSS may require a manual Breusch Pagan workflow rather than a one-click menu item. Save residuals, compute squared residuals, run the auxiliary regression, and interpret the p-value with the residual plots.
Python Chart-by-Chart Interpretation
The Python charts show the complete Breusch Pagan Test diagnostic workflow. They include residuals versus fitted values, scale-location plot, squared residuals versus fitted values, p-value decision, squared residuals by predictor and group residual variance.
Python Chart 1: Residuals vs Fitted Values
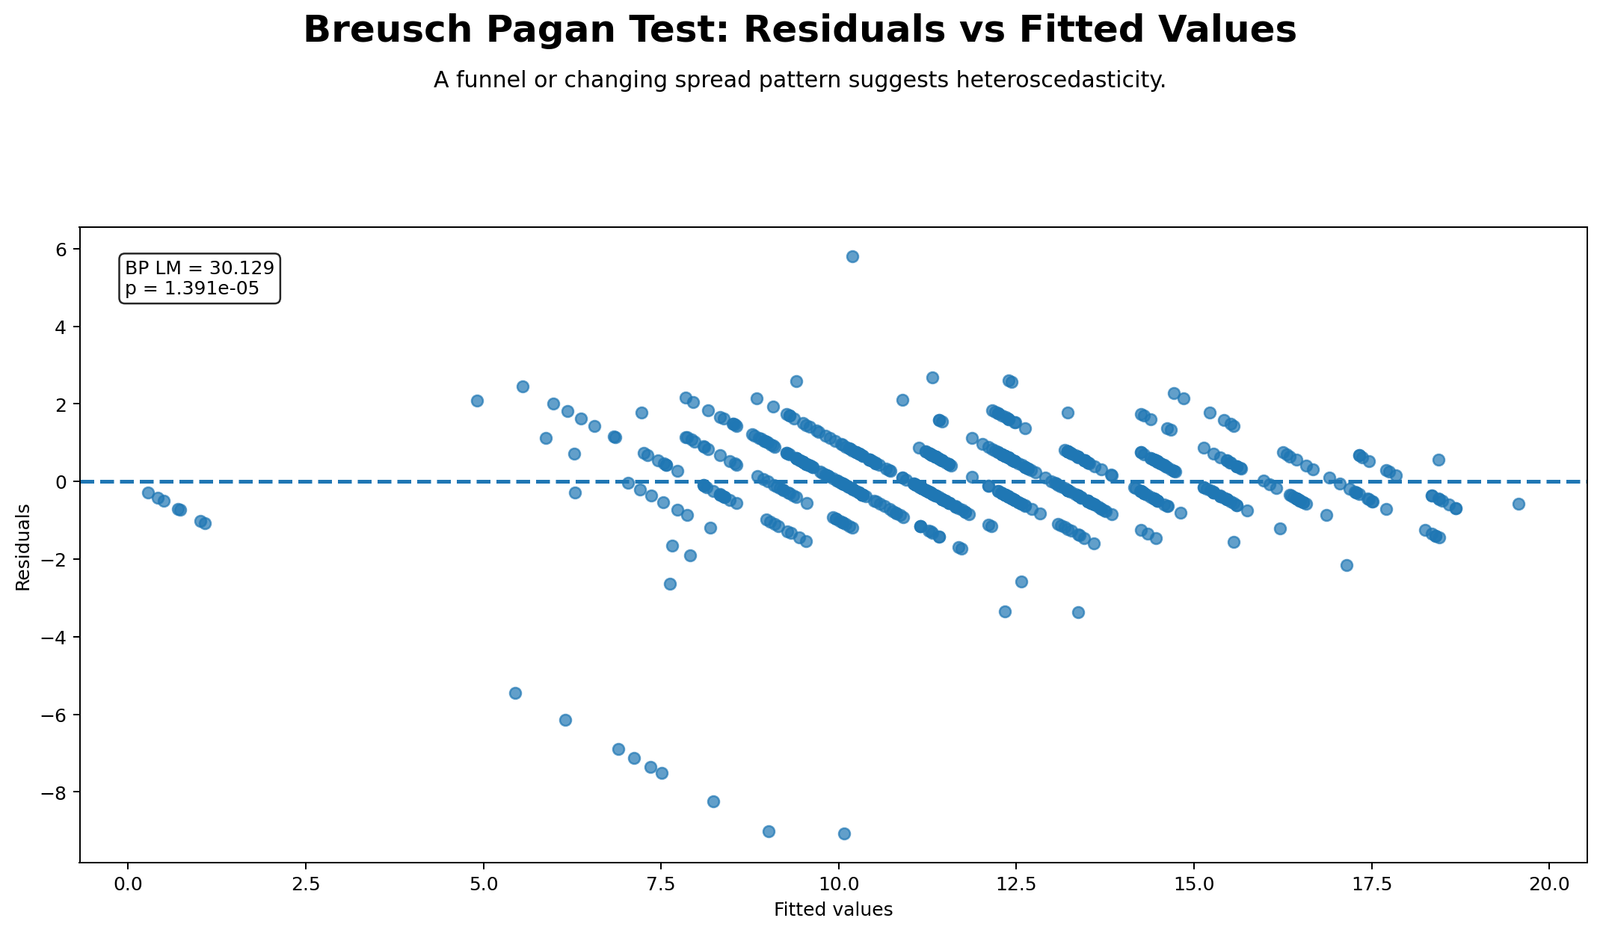
This chart is the first visual diagnostic for the Breusch Pagan Test. The x-axis shows fitted values and the y-axis shows residuals. If the residual spread is roughly equal across the fitted range, the constant variance assumption looks reasonable. If the residuals form a funnel shape, widening pattern, narrowing pattern or curved variance band, heteroscedasticity may be present.
The visual pattern helps explain the formal p-value. A random cloud around zero supports homoscedasticity. A systematic change in spread supports the alternative hypothesis of heteroscedasticity. This chart should always be checked before writing the final test conclusion.
Decision/reporting conclusion: Use this residuals-versus-fitted chart to support the Breusch Pagan p-value decision. If residual spread changes across fitted values, report that the chart supports possible heteroscedasticity.
Python Chart 2: Scale-Location Plot
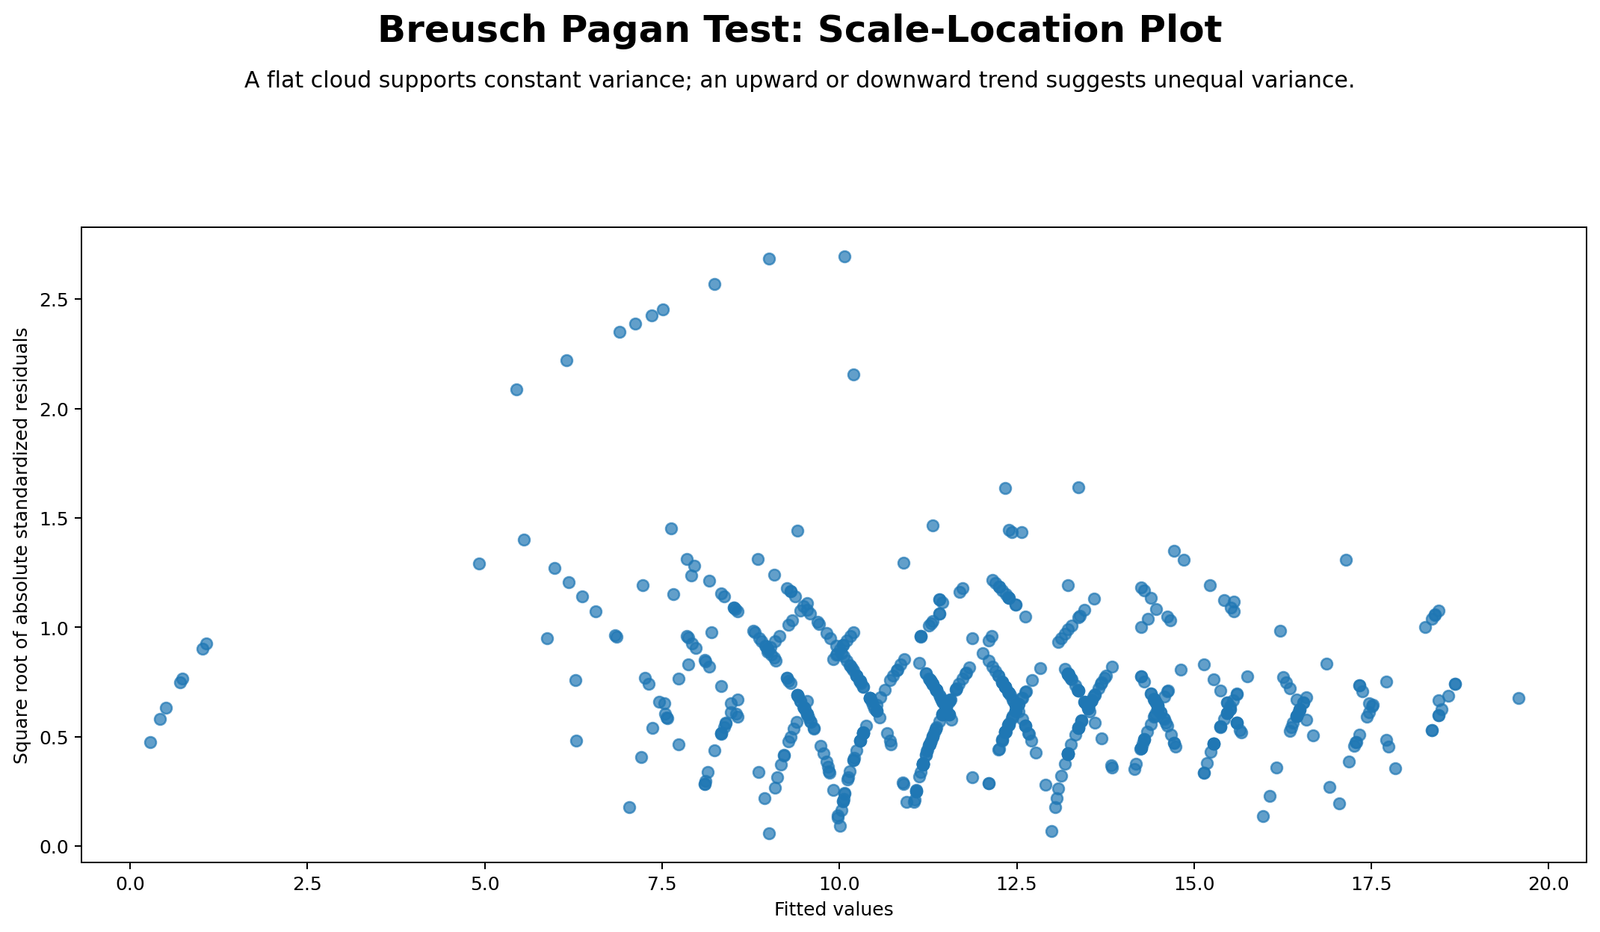
The scale-location plot is a cleaner way to see changing residual variance. Instead of raw residuals, it usually plots the square root of absolute standardized residuals against fitted values. If the smooth trend is flat, residual variance is more constant. If the trend rises or falls, residual variance changes with fitted values.
This chart is especially useful when the residuals-versus-fitted plot looks crowded. It emphasizes spread rather than sign, making heteroscedasticity easier to detect visually.
Decision/reporting conclusion: If the scale-location trend slopes upward or downward, mention that visual diagnostics suggest nonconstant variance and support checking the Breusch Pagan p-value carefully.
Python Chart 3: Squared Residuals vs Fitted Values
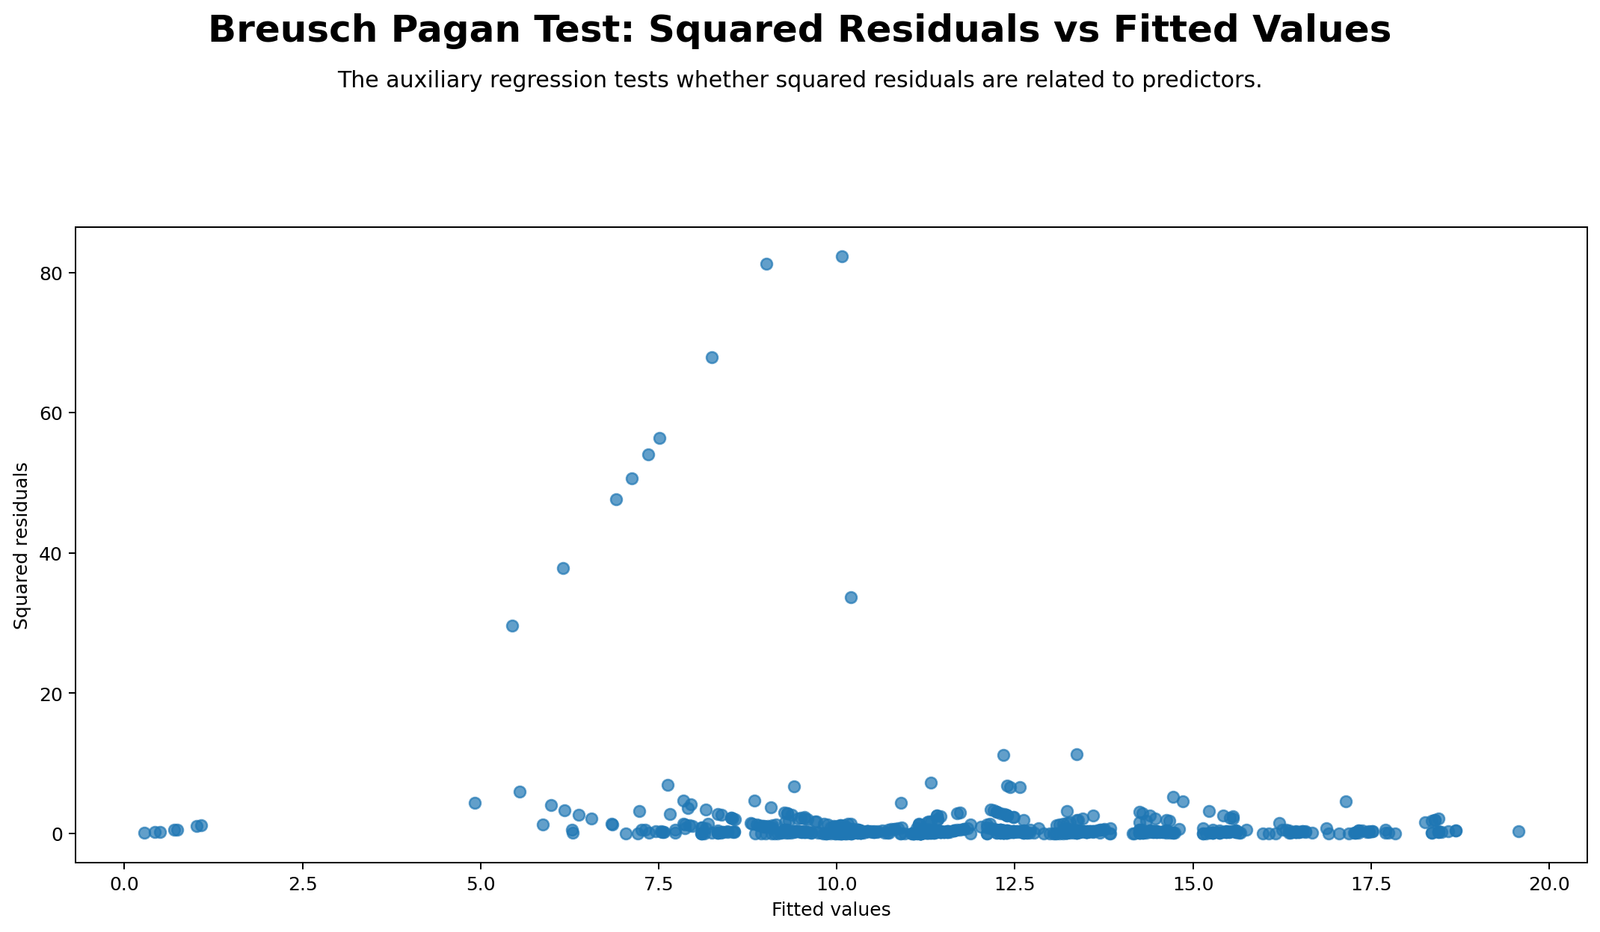
This chart directly connects to the mathematics of the Breusch Pagan Test. Squared residuals act as a proxy for local residual variance. If squared residuals increase or decrease systematically with fitted values, residual variance is not constant.
Large squared residuals at particular fitted ranges can reveal where the model is less stable. This plot is often easier to connect with the auxiliary regression because the Breusch Pagan test formally checks whether squared residuals are predictable.
Decision/reporting conclusion: If squared residuals show a pattern across fitted values, report that the visual evidence supports possible heteroscedasticity. If they look randomly scattered, that supports constant variance.
Python Chart 4: Breusch Pagan P-value Decision
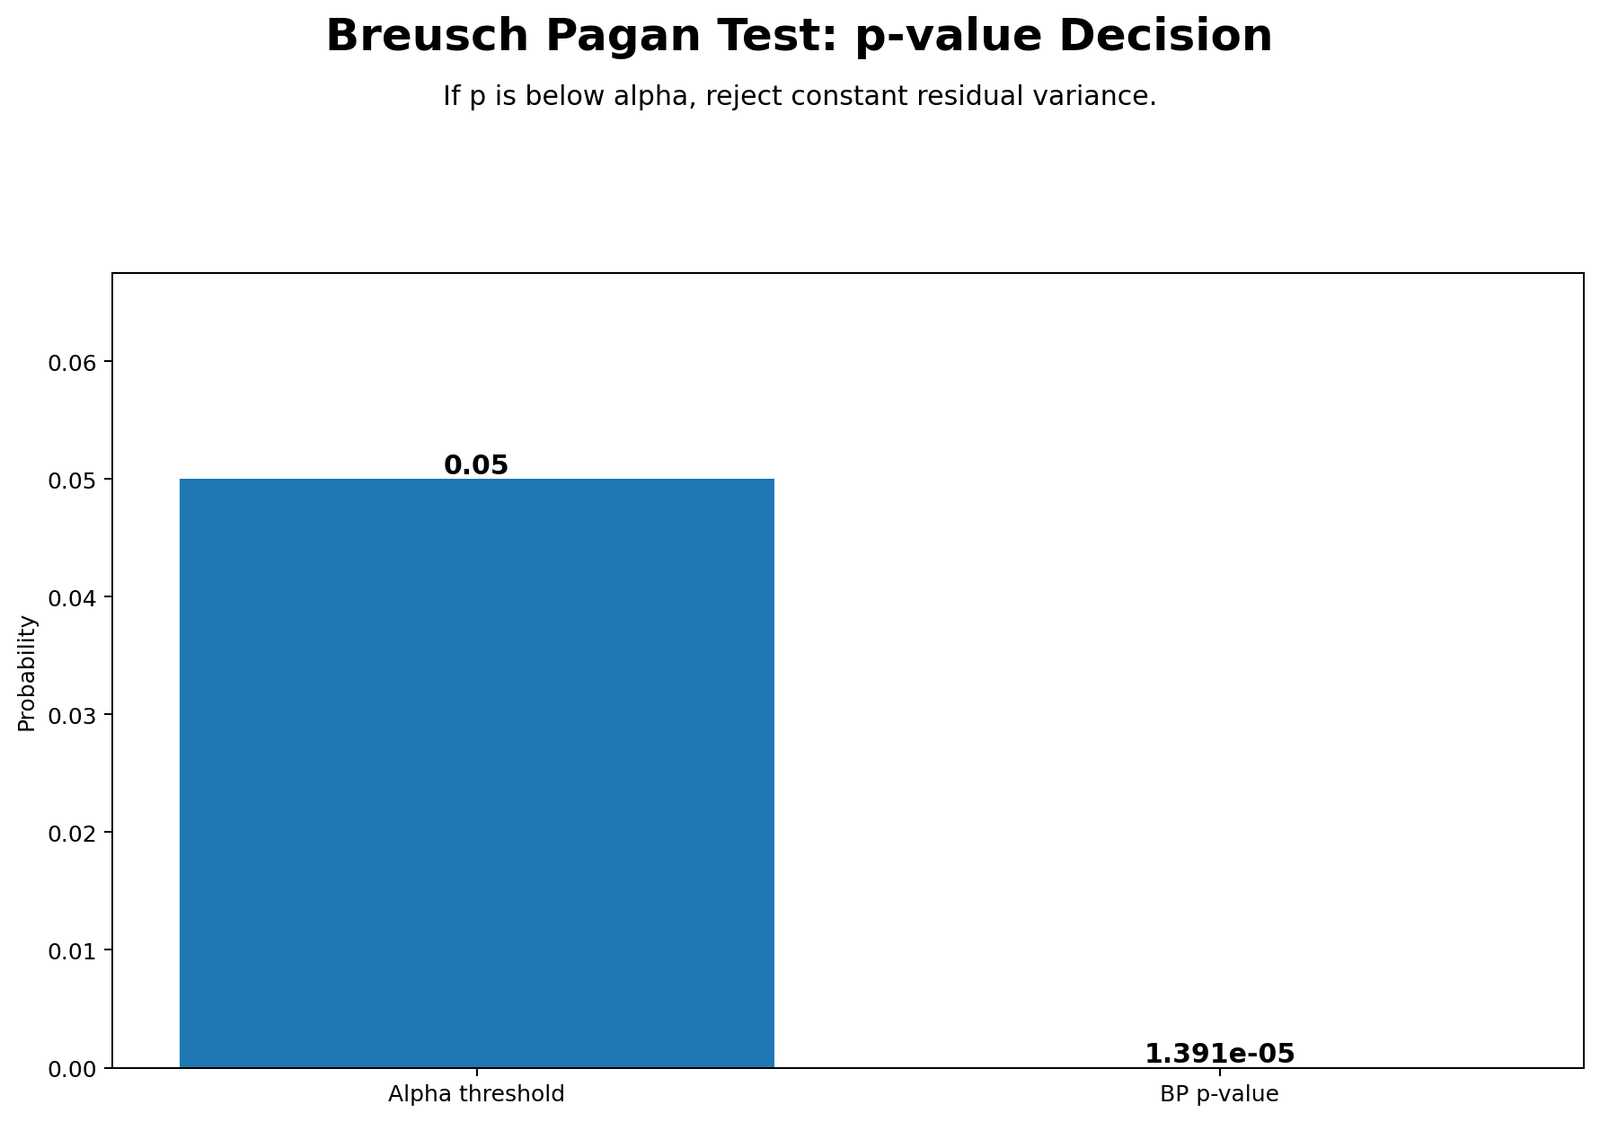
This chart summarizes the formal test decision. If the p-value is below .05, the null hypothesis of constant residual variance is rejected. If the p-value is greater than or equal to .05, the test does not detect heteroscedasticity.
The p-value chart gives a clean decision, but it should not replace the residual plots. The plots explain the pattern, while the p-value indicates whether the pattern is statistically strong enough under the test.
Decision/reporting conclusion: Use this chart as the final statistical decision graphic. Report the p-value conclusion and then connect it to the residual plots.
Python Chart 5: Squared Residuals by Predictor
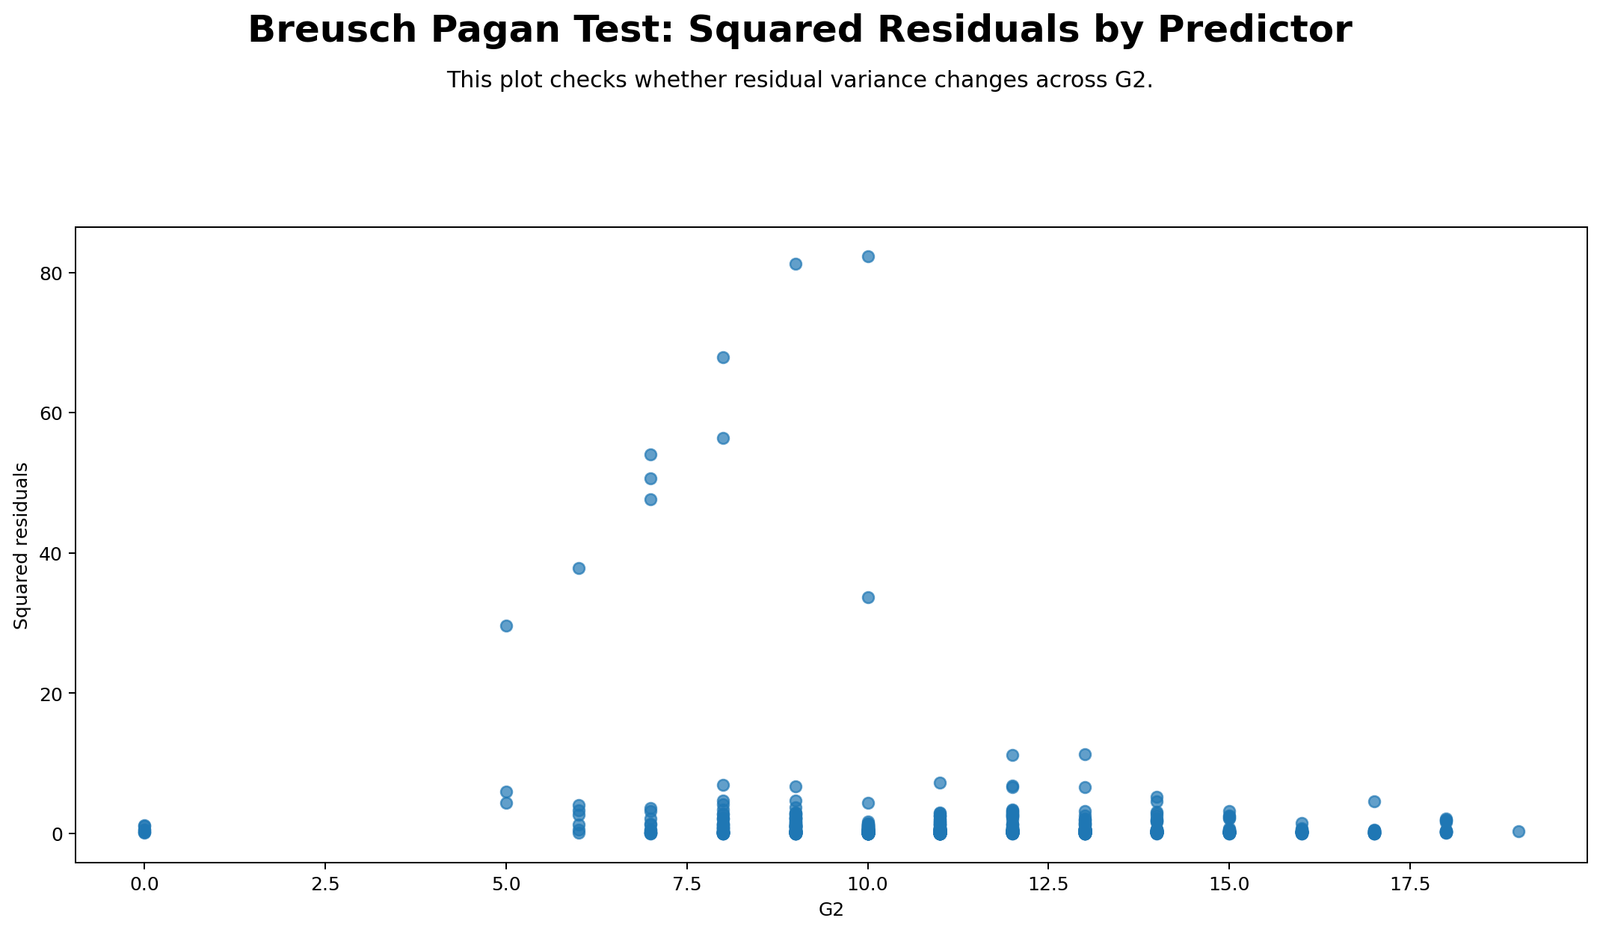
This chart helps identify which predictor may be related to changing residual variance. The Breusch Pagan Test can detect heteroscedasticity, but it does not always make the source obvious. Plotting squared residuals against a predictor helps show whether variance changes as that predictor increases.
If squared residuals are higher at specific predictor values, the analyst may consider a transformation, interaction, nonlinear term, subgroup model or robust standard errors. This chart supports diagnostic follow-up rather than only a yes/no conclusion.
Decision/reporting conclusion: Use this chart to identify where heteroscedasticity may be coming from. If one predictor clearly relates to squared residual size, mention it in the model diagnostics section.
Python Chart 6: Group Residual Variance
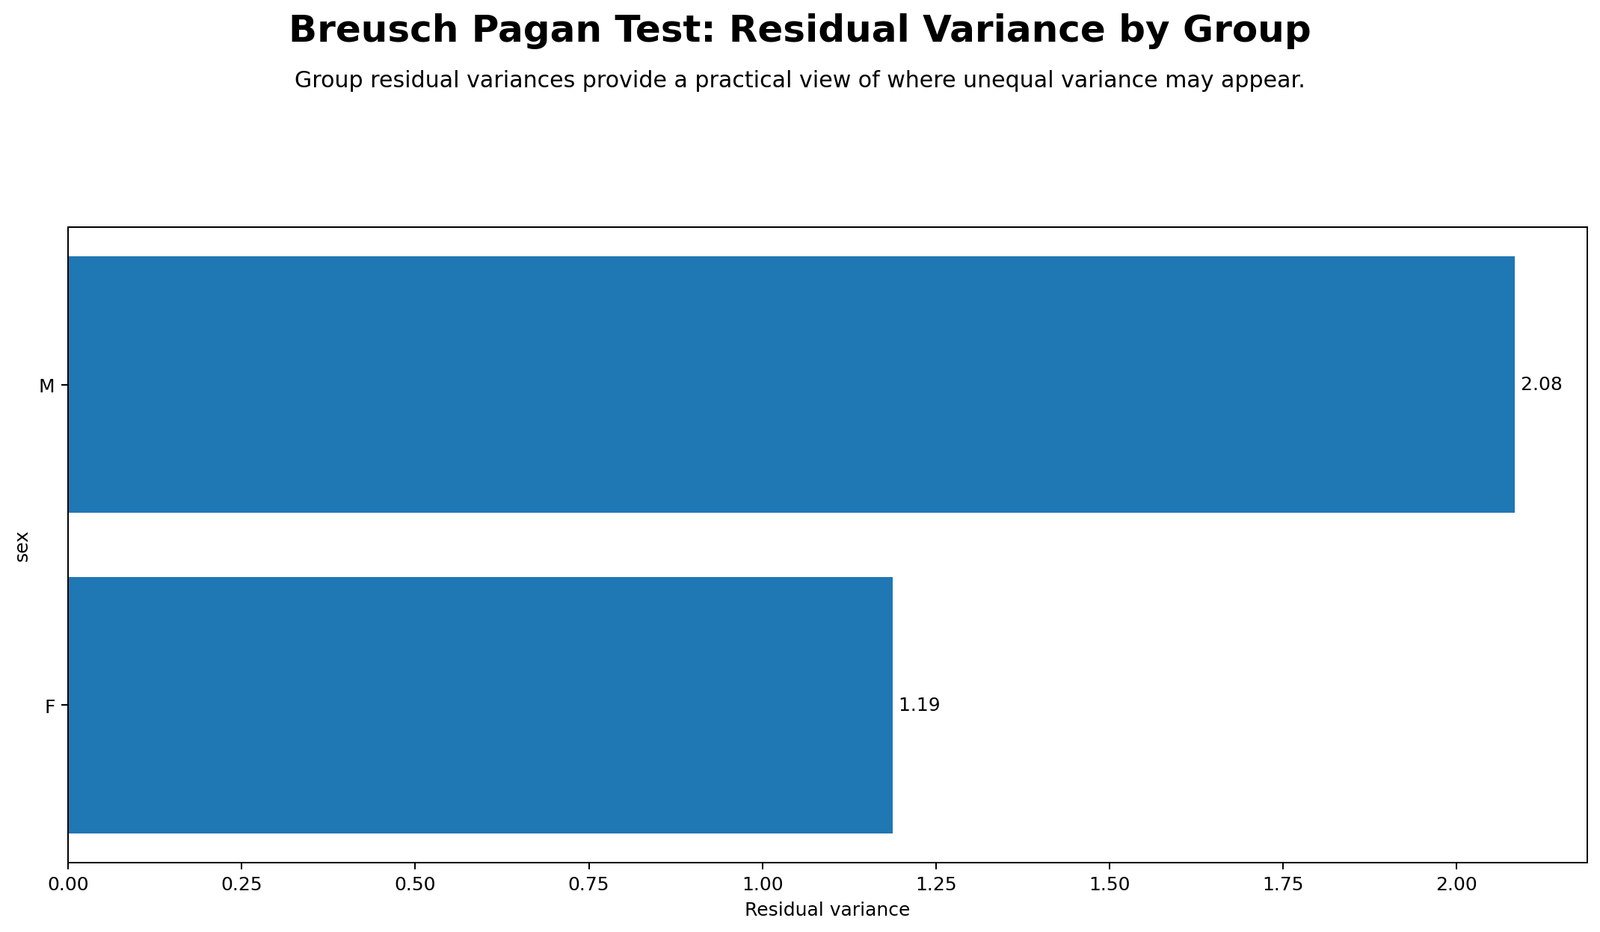
This chart checks whether residual variance differs across groups. While the Breusch Pagan Test focuses on regression-related heteroscedasticity, group residual variance charts are useful when categories may have different error spreads. For example, residual variance may differ across school, sex, study group or performance category.
If one group has much larger residual variance, the model may predict that group less consistently. Follow-up checks may include group-specific diagnostics, robust standard errors or alternative model structures.
Decision/reporting conclusion: Use this chart to explain whether heteroscedasticity is general across fitted values or concentrated in specific groups.
R Chart-by-Chart Validation
The R charts validate the Python and SPSS Breusch Pagan Test interpretation using a separate workflow. The same six diagnostic views are repeated in R: residuals versus fitted values, scale-location plot, squared residuals versus fitted values, p-value decision, squared residuals by predictor and group residual variance.
R Chart 1: Residuals vs Fitted Values
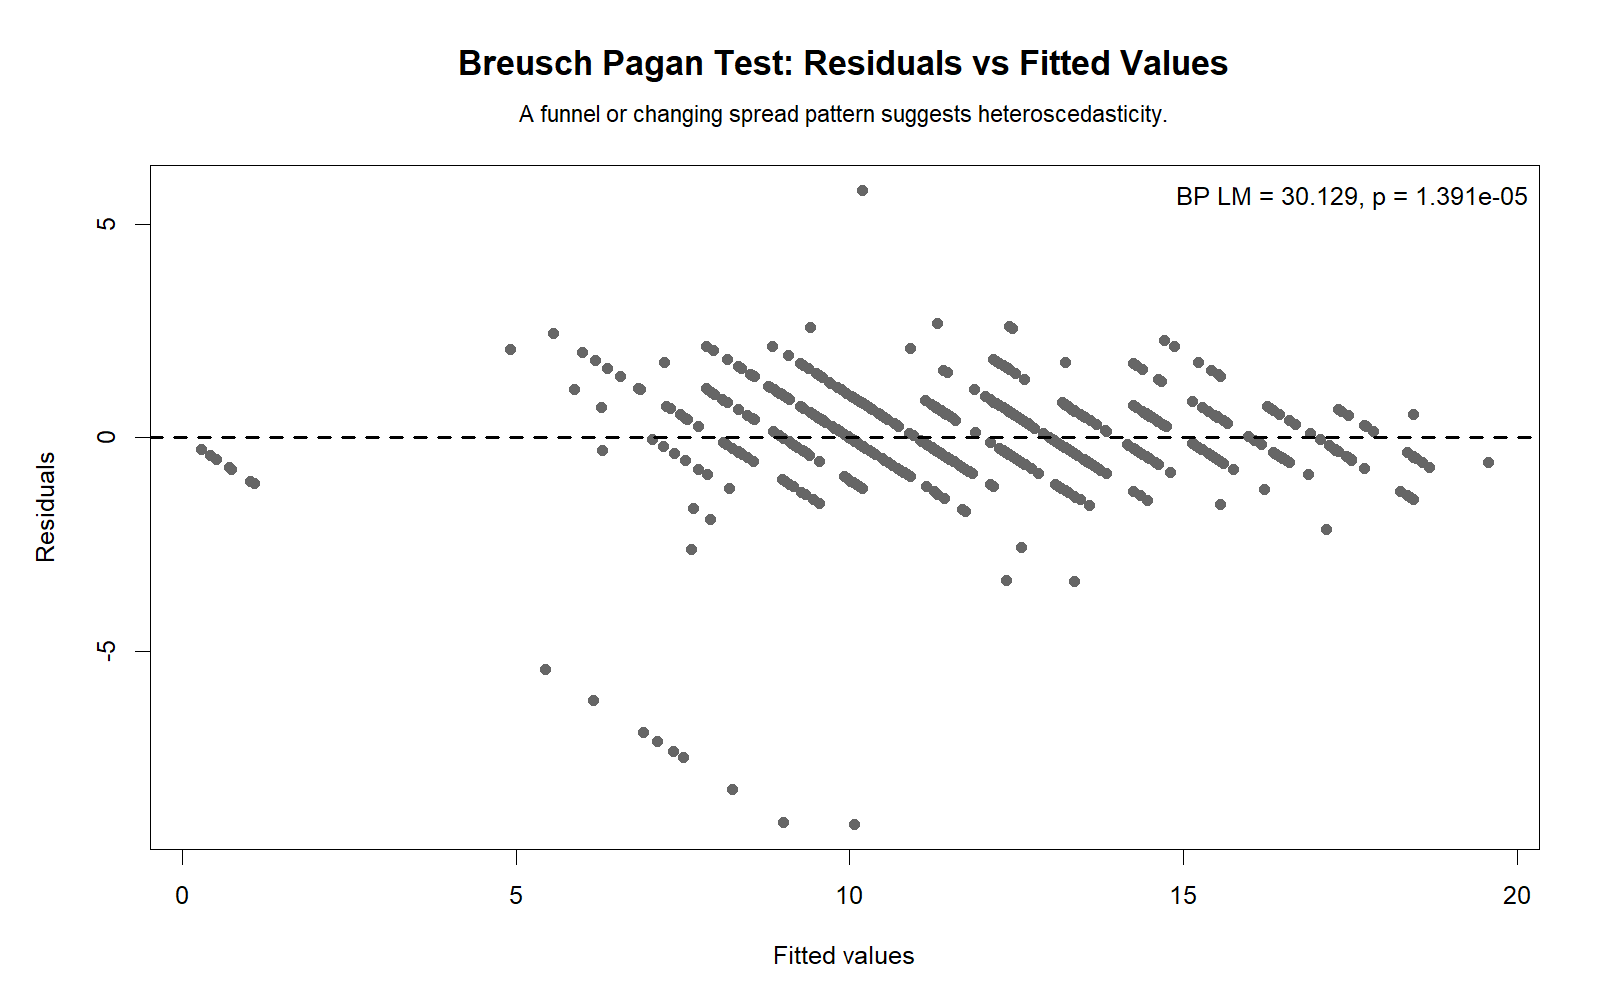
The R residuals-versus-fitted plot validates the Python diagnostic. A random residual cloud supports constant variance, while a funnel pattern or systematic spread change supports heteroscedasticity. This chart confirms whether the variance pattern is stable across software workflows.
Decision/reporting conclusion: Use this R chart to confirm whether the residual spread pattern seen in Python is reproducible.
R Chart 2: Scale-Location Plot
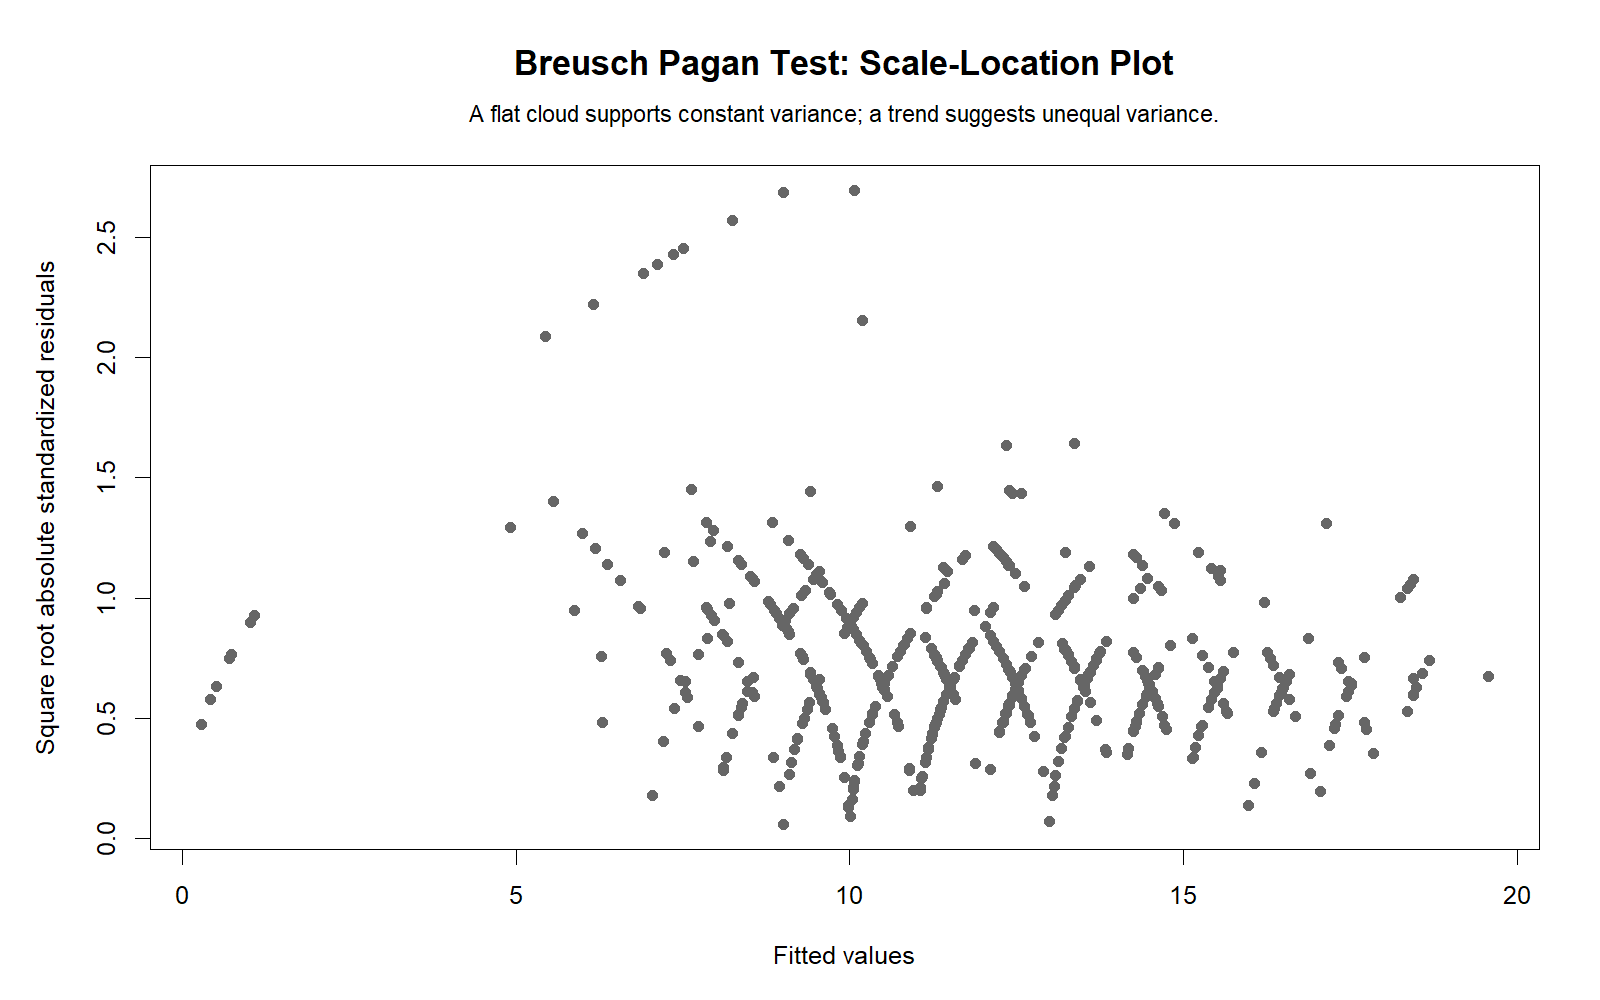
The R scale-location plot validates the spread-focused diagnostic. A flat trend supports homoscedasticity. An upward or downward trend suggests changing residual variance. This chart is helpful because it removes residual sign and focuses on magnitude.
Decision/reporting conclusion: Use this chart to confirm whether residual spread changes consistently across fitted values.
R Chart 3: Squared Residuals vs Fitted Values
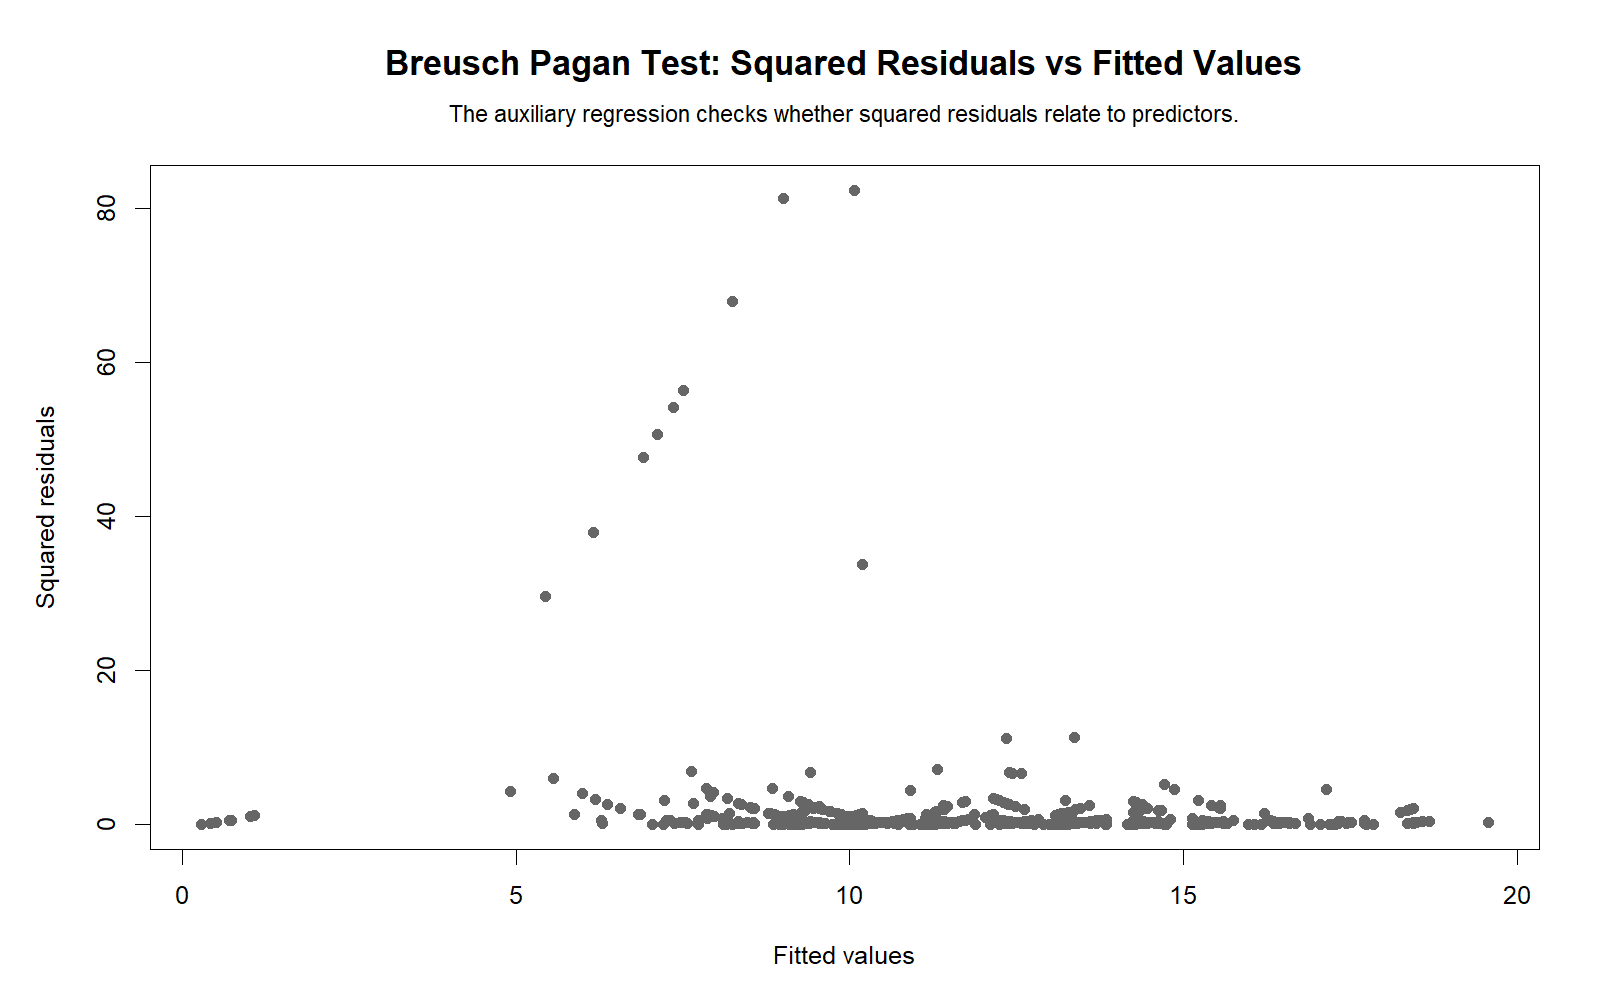
This R chart validates the auxiliary-regression idea behind the Breusch Pagan Test. If squared residuals show a clear trend across fitted values, the model error variance is not constant. If the squared residuals appear randomly scattered, the variance assumption looks more reasonable.
Decision/reporting conclusion: Use this chart to explain whether the squared-error magnitude is predictable from fitted values.
R Chart 4: Breusch Pagan P-value Decision
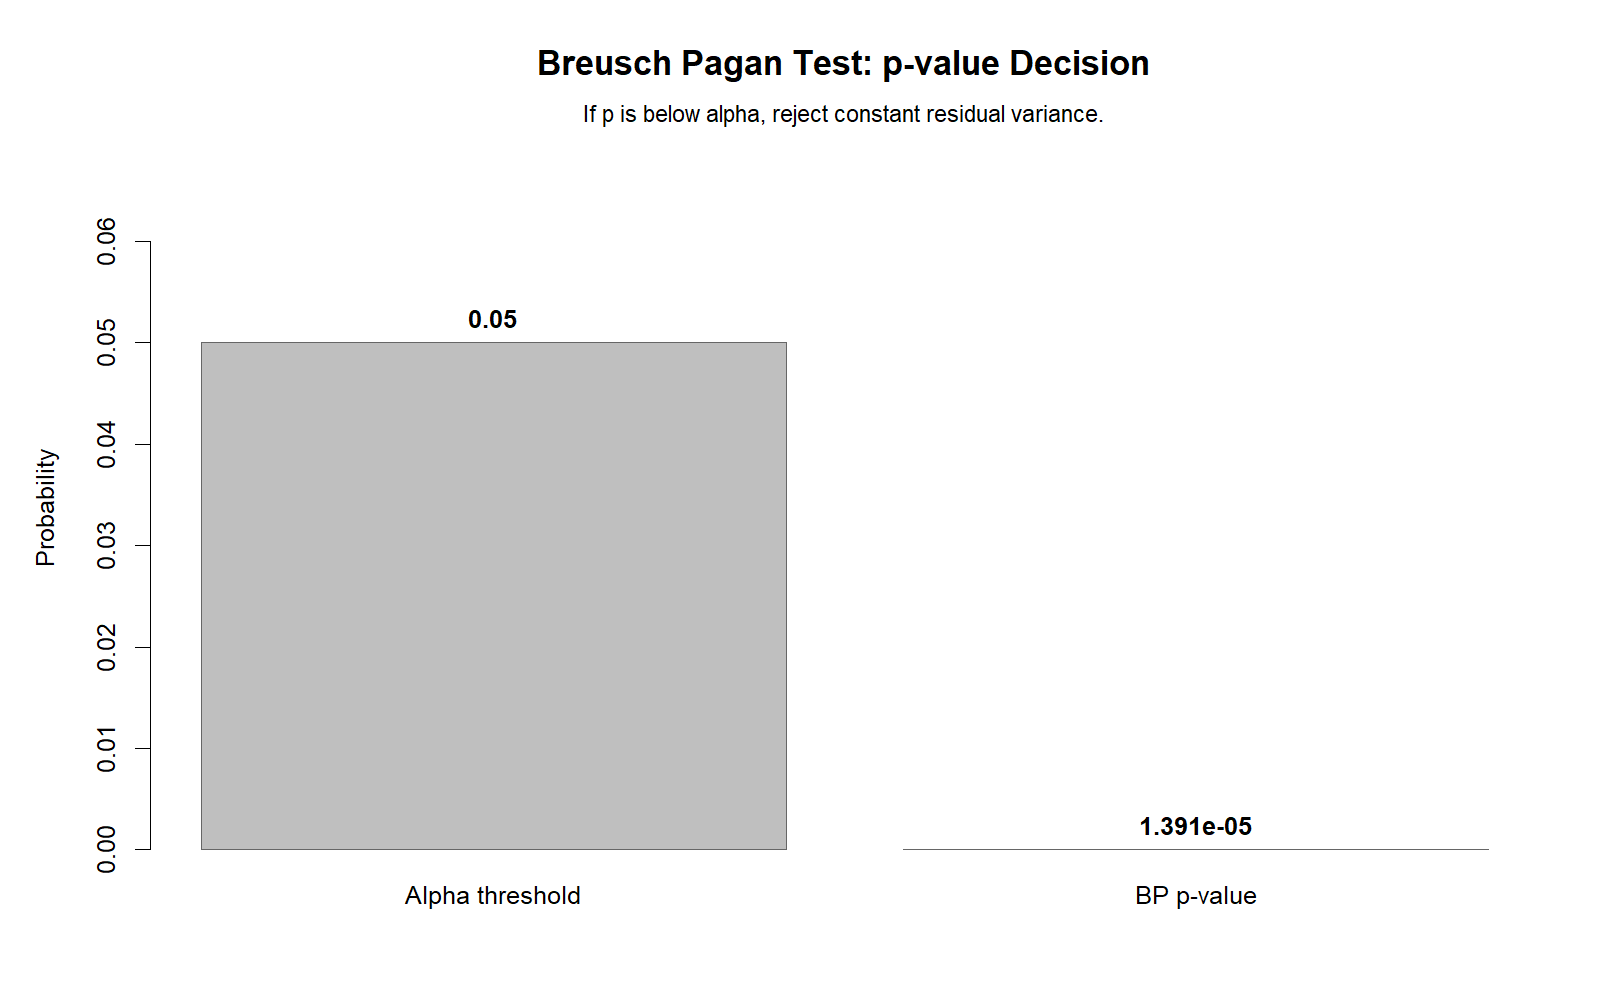
The R p-value decision chart validates the formal heteroscedasticity conclusion. The decision rule is simple: p below .05 means reject homoscedasticity; p at or above .05 means do not reject the constant variance assumption under this test.
Decision/reporting conclusion: Use this chart as the R-confirmed formal decision and report it alongside residual plots.
R Chart 5: Squared Residuals by Predictor
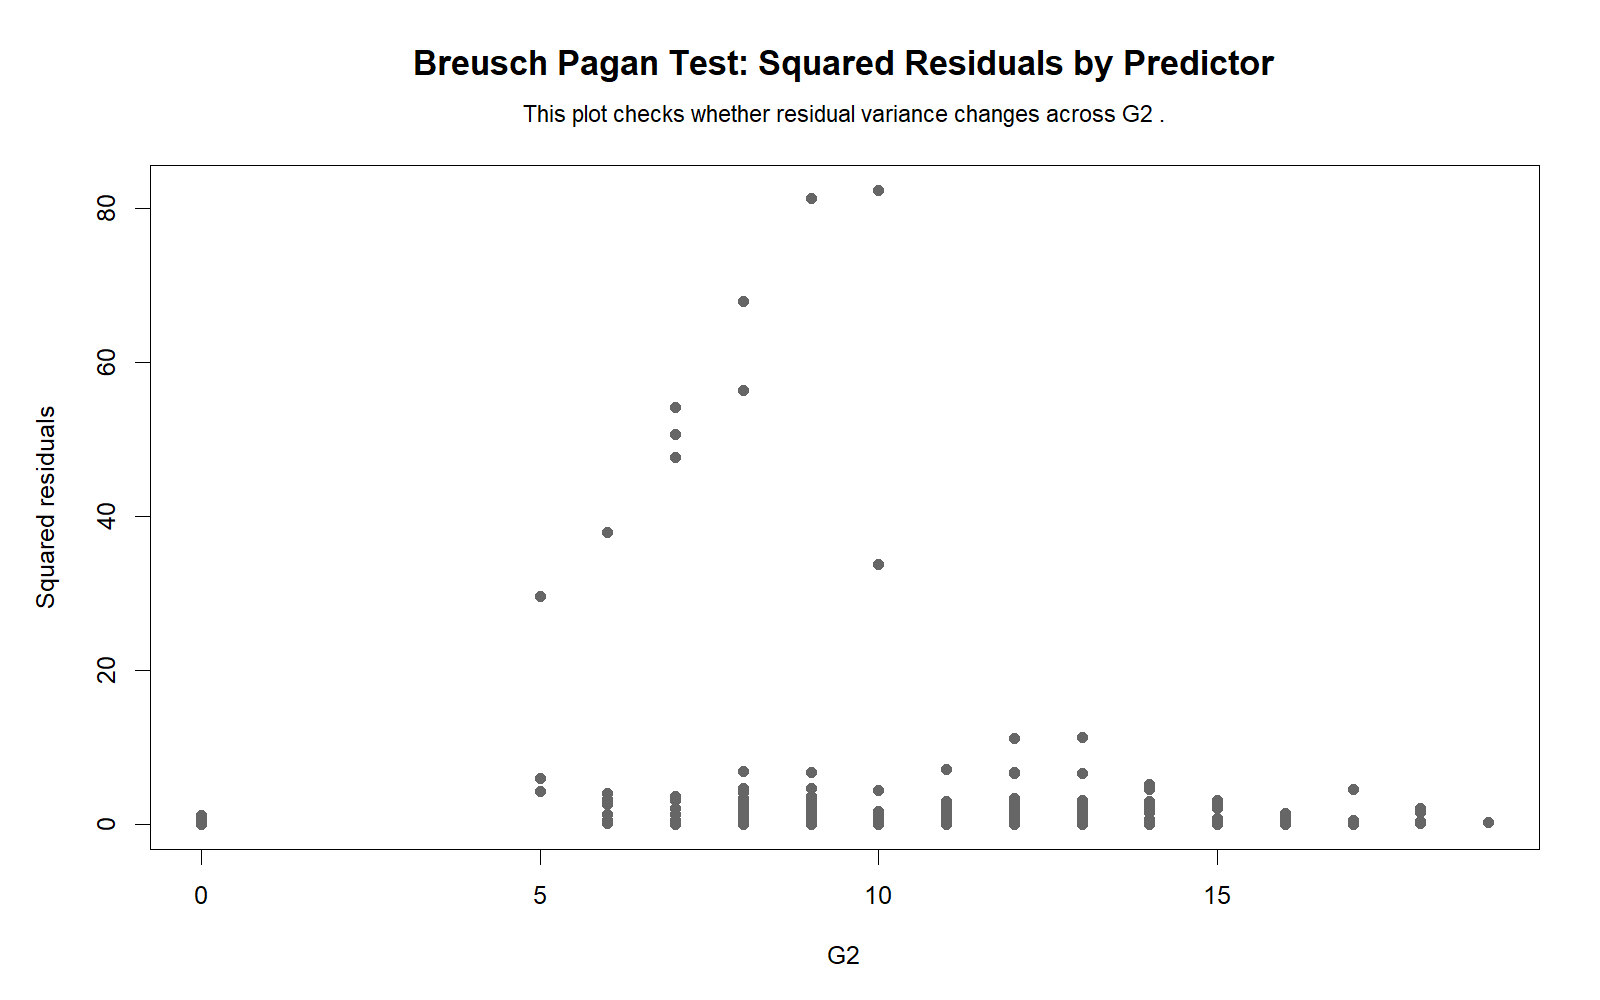
The R predictor chart validates whether a predictor is related to residual variance. If squared residuals increase with a predictor, that predictor may be associated with heteroscedasticity. This helps move the analysis from detection to explanation.
Decision/reporting conclusion: Use this chart to identify which predictor ranges may require model revision, transformation or robust standard errors.
R Chart 6: Group Residual Variance
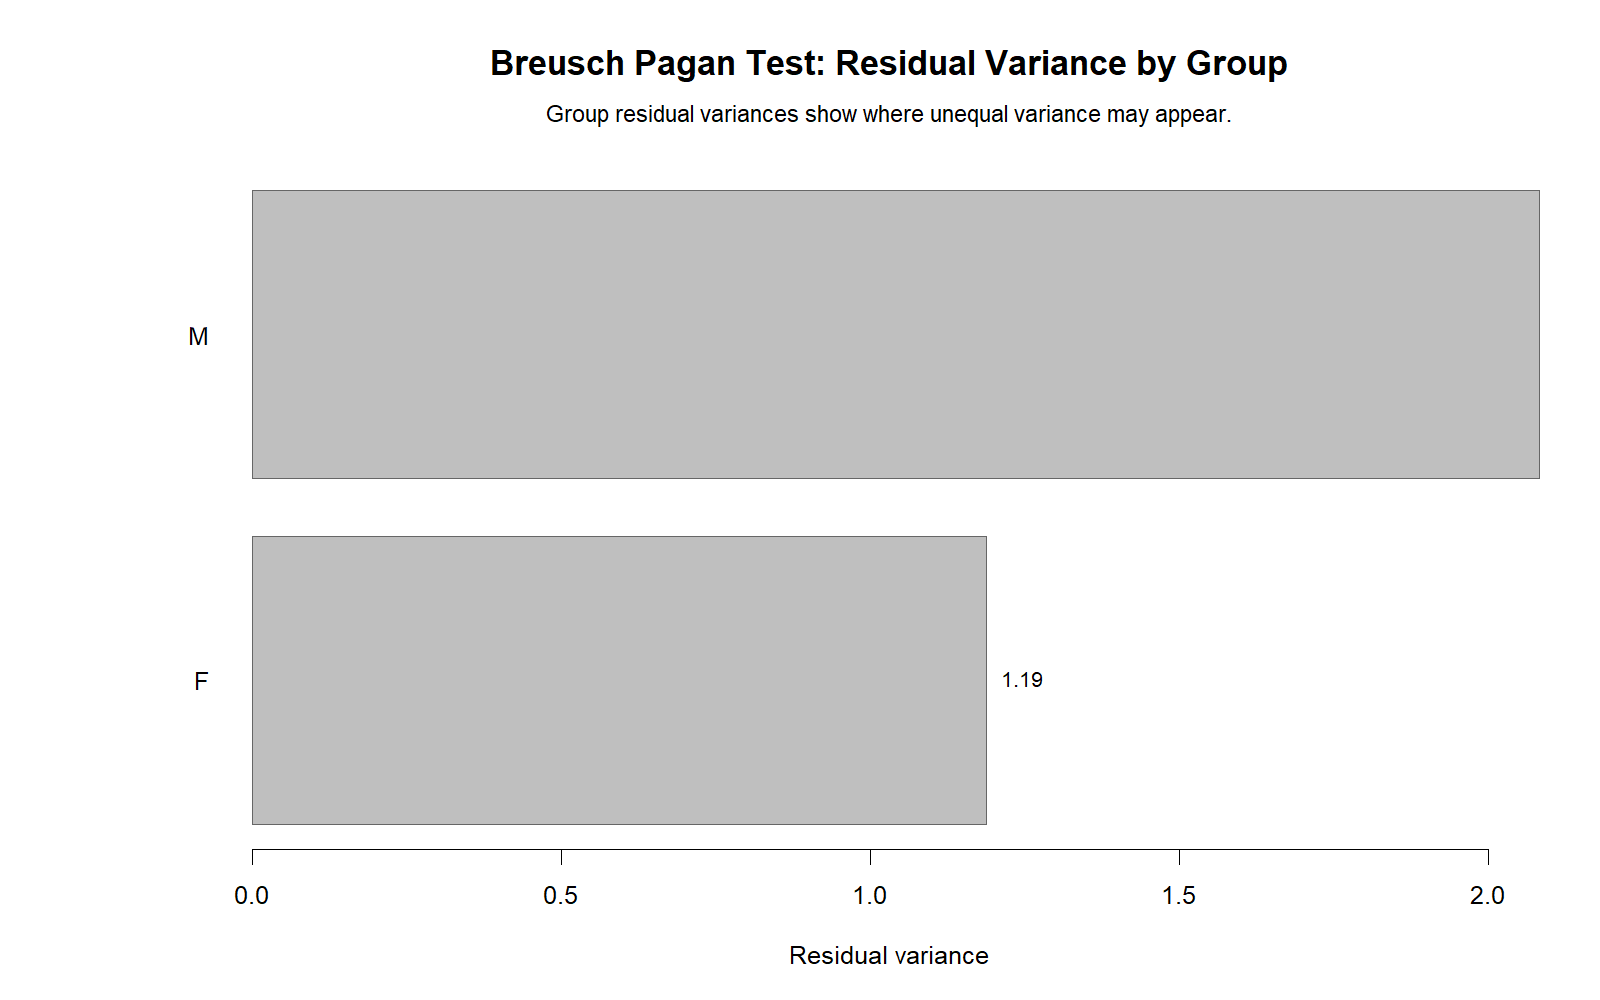
This chart validates whether residual variance differs by group. If groups show similar residual variance, group-based variance concern is lower. If one group has a much larger residual variance, the model may fit unevenly across categories.
Decision/reporting conclusion: Use this chart to support subgroup-specific interpretation of heteroscedasticity and to decide whether group-adjusted modeling or robust inference is needed.
SPSS, Python, R and Excel Workflows for the Breusch Pagan Test
A complete Breusch Pagan Test workflow begins after fitting the regression model. The analyst saves residuals and fitted values, inspects residual plots, runs the formal Breusch Pagan test or auxiliary regression, and then decides whether ordinary standard errors are reliable or whether robust methods are needed.
SPSS Workflow
| Step | SPSS Action | Purpose |
|---|---|---|
| Run original regression | Analyze > Regression > Linear | Fit the model and save residuals/fitted values. |
| Save residuals | Save > Unstandardized residuals | Create residual variable for diagnostics. |
| Save predicted values | Save > Unstandardized predicted values | Create fitted values for plots. |
| Compute squared residuals | Transform > Compute Variable | Create residual variance proxy. |
| Run auxiliary regression | Squared residuals as dependent variable | Check whether variance is related to predictors. |
| Interpret p-value | Auxiliary model significance | Decide whether heteroscedasticity is detected. |
Python Workflow
| Step | Python Action | Purpose |
|---|---|---|
| Read data | pandas.read_csv() | Load the dataset. |
| Fit OLS model | statsmodels.OLS() | Create regression model. |
| Extract residuals | model.resid | Use residuals for diagnostics. |
| Run Breusch Pagan | het_breuschpagan() | Calculate LM statistic, F statistic and p-values. |
| Create charts | matplotlib | Plot residual variance diagnostics. |
R Workflow
| Step | R Action | Purpose |
|---|---|---|
| Read data | read.csv() | Import the dataset. |
| Fit model | lm() | Create ordinary least squares regression. |
| Run Breusch Pagan | lmtest::bptest() | Test heteroscedasticity. |
| Extract residuals | residuals(model) | Create plots and squared residuals. |
| Use robust SE if needed | sandwich and coeftest() | Correct inference when heteroscedasticity is present. |
Excel Workflow
| Excel Task | Formula or Tool | Purpose |
|---|---|---|
| Run regression | Data Analysis ToolPak > Regression | Fit the original model. |
| Save residuals | Regression residual output | Use model errors for diagnostics. |
| Square residuals | =Residual^2 | Create variance proxy. |
| Auxiliary regression | Squared residuals on predictors | Estimate R² for LM statistic. |
| LM statistic | =n*Auxiliary_RSQ | Calculate Breusch Pagan LM statistic. |
| p-value | =CHISQ.DIST.RT(LM,df) | Make heteroscedasticity decision. |
SPSS, Python, R and Excel Code for the Breusch Pagan Test
SPSS Syntax for Breusch Pagan Test Workflow
* Breusch Pagan Test workflow in SPSS.
* Replace variables with your model variables.

TITLE "Breusch Pagan Test Heteroscedasticity Workflow".

REGRESSION
  /DEPENDENT G3
  /METHOD=ENTER G1 G2 studytime failures absences age
  /STATISTICS COEFF OUTS R ANOVA COLLIN TOL CHANGE
  /SAVE PRED(pred_original) RESID(resid_original)
  /CRITERIA=PIN(.05) POUT(.10).

* Compute squared residuals.
COMPUTE resid_sq = resid_original ** 2.
VARIABLE LABELS resid_sq "Squared residuals for Breusch Pagan auxiliary regression".
EXECUTE.

* Auxiliary regression: squared residuals predicted by model predictors.
REGRESSION
  /DEPENDENT resid_sq
  /METHOD=ENTER G1 G2 studytime failures absences age
  /STATISTICS COEFF OUTS R ANOVA
  /CRITERIA=PIN(.05) POUT(.10).

* Residual diagnostics.
GRAPH
  /SCATTERPLOT(BIVAR)=pred_original WITH resid_original
  /TITLE="Residuals vs Fitted Values".

GRAPH
  /SCATTERPLOT(BIVAR)=pred_original WITH resid_sq
  /TITLE="Squared Residuals vs Fitted Values".

OUTPUT EXPORT
  /CONTENTS EXPORT=VISIBLE
  /PDF DOCUMENTFILE="Breusch-Pagan-Test-SPSS-Output.pdf".
Python Code for the Breusch Pagan Test
import pandas as pd
import statsmodels.api as sm
from statsmodels.stats.diagnostic import het_breuschpagan

df = pd.read_csv("dataset.csv")

dependent = "G3"
predictors = ["G1", "G2", "studytime", "failures", "absences", "age"]

model_data = df[[dependent] + predictors].apply(pd.to_numeric, errors="coerce").dropna()

X = sm.add_constant(model_data[predictors])
y = model_data[dependent]

model = sm.OLS(y, X).fit()

residuals = model.resid
fitted = model.fittedvalues

bp_result = het_breuschpagan(residuals, X)

labels = ["LM statistic", "LM p-value", "F statistic", "F p-value"]
bp_table = dict(zip(labels, bp_result))

print(model.summary())
print(bp_table)

if bp_table["LM p-value"] < 0.05:
    print("Reject homoscedasticity: heteroscedasticity detected.")
else:
    print("Do not reject homoscedasticity: no heteroscedasticity detected.")

# Robust standard errors if needed
robust_model = model.get_robustcov_results(cov_type="HC3")
print(robust_model.summary())
R Code for the Breusch Pagan Test
# Breusch Pagan Test in R

df <- read.csv("dataset.csv")

vars_needed <- c("G3", "G1", "G2", "studytime", "failures", "absences", "age")
df_model <- df[vars_needed]
df_model[] <- lapply(df_model, as.numeric)
df_model <- na.omit(df_model)

model <- lm(G3 ~ G1 + G2 + studytime + failures + absences + age, data = df_model)

summary(model)

# install.packages("lmtest")
# install.packages("sandwich")
library(lmtest)
library(sandwich)

bp_result <- bptest(model)
print(bp_result)

if (bp_result$p.value < 0.05) {
  print("Reject homoscedasticity: heteroscedasticity detected.")
} else {
  print("Do not reject homoscedasticity: no heteroscedasticity detected.")
}

# Robust standard errors if heteroscedasticity is detected
coeftest(model, vcov = vcovHC(model, type = "HC3"))

# Manual squared residuals
df_model$fitted <- fitted(model)
df_model$residuals <- residuals(model)
df_model$resid_sq <- df_model$residuals^2

aux_model <- lm(resid_sq ~ G1 + G2 + studytime + failures + absences + age, data = df_model)
summary(aux_model)
Excel Formulas for a Breusch Pagan-Style Manual Check
Step 1:
Run the original regression using Data Analysis ToolPak.

Step 2:
Save predicted values and residuals.

Step 3:
Calculate squared residuals:
=Residual^2

Step 4:
Run auxiliary regression:
Dependent variable = squared residuals
Predictors = original model predictors or fitted values

Step 5:
Record auxiliary R-squared.

Step 6:
Calculate LM statistic:
=n*Auxiliary_RSQ

Step 7:
Calculate p-value:
=CHISQ.DIST.RT(LM_statistic, number_of_predictors)

Decision:
If p < .05, heteroscedasticity is detected.
If p >= .05, heteroscedasticity is not detected.

Optional:
Create residuals vs fitted chart and squared residuals vs fitted chart.
APA Reporting Wording for the Breusch Pagan Test
APA reporting for the Breusch Pagan Test should include the test name, statistic, p-value, decision about homoscedasticity, and any follow-up action. If robust standard errors were used, mention that clearly.
If the Breusch Pagan Test Is Significant
The Breusch Pagan Test indicated evidence of heteroscedasticity, LM = [value], p < .05. Therefore, the null hypothesis of constant residual variance was rejected. Regression results were interpreted with caution, and heteroscedasticity-robust standard errors were considered for final inference.
If the Breusch Pagan Test Is Not Significant
The Breusch Pagan Test was not significant, LM = [value], p ≥ .05. Therefore, the test did not provide evidence against the assumption of constant residual variance. Residual plots were also reviewed to support the homoscedasticity decision.
Student-Friendly Reporting Sentence
The Breusch Pagan Test was used to check whether residual variance changed across the fitted regression model. The decision was based on the p-value and supported with residual plots. This approach is stronger than relying on residual plots alone because it combines visual and formal statistical evidence.
Common Mistakes in Breusch Pagan Test Interpretation
| Mistake | Why It Is a Problem | Correct Practice |
|---|---|---|
| Calling it a normality test | Breusch Pagan tests variance, not normality. | Use Lilliefors Test, D’Agostino-Pearson Test or Q-Q plots for normality. |
| Ignoring residual plots | The p-value does not show the shape of variance change. | Use residuals vs fitted, scale-location, and squared-residual plots. |
| Assuming heteroscedasticity ruins the whole model | Coefficients may still be useful, but standard errors may be unreliable. | Use robust standard errors or model revision. |
| Not checking model specification | Misspecification can create apparent variance problems. | Use the Ramsey RESET Test and residual diagnostics. |
| Confusing group variance tests with regression variance tests | Levene and Brown-Forsythe are group variance tests; Breusch Pagan is regression-based. | Use the test that matches the research design. |
| Forgetting robust inference | Finding heteroscedasticity without correction leaves inference weak. | Report robust standard errors or another justified correction. |
Key reminder: The Breusch Pagan Test is a diagnostic tool. It tells you whether heteroscedasticity is detected, but the best correction depends on the model, variables, sample size, plots, and research goal.
When to Use the Breusch Pagan Test
Use the Breusch Pagan Test after fitting a regression model when you need to check whether residual variance is constant. It is especially useful when residual plots show a funnel pattern, when standard errors seem questionable, when predictors may relate to error spread, or when the regression results will be used for inference.
| Use Breusch Pagan Test When | Reason | Related Guide |
|---|---|---|
| You run multiple regression | Residual variance should be constant for ordinary standard errors. | Ramsey RESET Test |
| Residual spread changes across fitted values | Changing spread suggests heteroscedasticity. | Goldfeld-Quandt Test |
| You need reliable confidence intervals | Heteroscedasticity can affect standard errors. | Confidence Interval |
| You compare residual variance across groups | Some groups may be predicted less consistently. | Levene Test |
| You need a complete regression diagnostic report | Homoscedasticity is a key regression assumption. | Descriptive Statistics |
If the Breusch Pagan Test is significant, consider heteroscedasticity-robust standard errors, model transformations, nonlinear terms, group-specific analysis, or weighted least squares. If the test is not significant but plots still show suspicious structure, explain the visual pattern and consider additional diagnostics. Use the Central Limit Theorem carefully; it does not automatically fix heteroscedasticity in regression standard errors.
Downloads and Resources for the Breusch Pagan Test
The SPSS output PDF below supports the Breusch Pagan Test workflow used in this guide. The Python and R charts provide visual evidence for residual variance patterns, p-value decision, predictor-based variance and group residual variance.
Download SPSS Output PDF
Verified SPSS output for the Breusch Pagan Test heteroscedasticity workflow.
Copy Breusch Pagan Test Code
Use the SPSS, Python, R and Excel code blocks to reproduce the analysis.
Python Residuals vs Fitted Chart
Main visual diagnostic for residual spread across fitted values.
R P-value Decision Chart
Formal R validation chart for the heteroscedasticity decision.
FAQs About the Breusch Pagan Test
What is the Breusch Pagan Test?
The Breusch Pagan Test is a regression diagnostic test used to detect heteroscedasticity, meaning nonconstant residual variance.
What does the Breusch Pagan Test check?
It checks whether squared residuals are systematically related to fitted values or predictors in a regression model.
What is the null hypothesis of the Breusch Pagan Test?
The null hypothesis is that residual variance is constant, meaning the model satisfies the homoscedasticity assumption.
What is the alternative hypothesis of the Breusch Pagan Test?
The alternative hypothesis is that residual variance is not constant, meaning heteroscedasticity is present.
How do I interpret a significant Breusch Pagan Test?
If p < .05, reject constant variance and conclude that heteroscedasticity is detected.
How do I interpret a nonsignificant Breusch Pagan Test?
If p ≥ .05, the test does not provide evidence against constant residual variance.
Is the Breusch Pagan Test a normality test?
No. It is a heteroscedasticity test. Use normality tests such as Lilliefors, Kolmogorov-Smirnov, D’Agostino-Pearson, Q-Q plots or P-P plots for normality.
Can I run the Breusch Pagan Test in SPSS?
Yes. In SPSS, save residuals and predicted values, compute squared residuals, run an auxiliary regression, and interpret the p-value.
Can I run the Breusch Pagan Test in Python?
Yes. Python can run the test with statsmodels.stats.diagnostic.het_breuschpagan().
Can I run the Breusch Pagan Test in R?
Yes. R can run the test with lmtest::bptest().
Can I calculate the Breusch Pagan Test in Excel?
Yes. Run an auxiliary regression of squared residuals on predictors, compute LM = nR², then use a chi-square p-value formula.
What should I do if heteroscedasticity is detected?
Consider robust standard errors, weighted least squares, transformations, model revision, subgroup diagnostics or other justified corrections.
What charts should I use with the Breusch Pagan Test?
Use residuals versus fitted values, scale-location plots, squared residuals versus fitted values, squared residuals by predictor and group residual variance charts.
Is Breusch Pagan the same as Goldfeld-Quandt?
No. Both relate to heteroscedasticity, but the Goldfeld-Quandt Test compares residual variance across ordered groups, while Breusch Pagan uses an auxiliary regression of squared residuals.

