
Kuder-Richardson Formula 21: 7 Essential Steps and Example
The Kuder-Richardson Formula 21 is a simplified internal-consistency reliability estimate for a test made of binary items. This complete guide explains the Kuder-Richardson Formula 21 formula, equal-difficulty assumption, worked six-item calculation, negative coefficient interpretation, differences from KR-20 and Cronbach’s alpha, and verified results in Python, R, SPSS, and Excel.
The worked Kuder-Richardson Formula 21 coefficient is negative because the equal-difficulty approximation is incompatible with the observed item pattern.
For k = 6 binary items, n = 649 complete records, mean total score M = 2.924499, and sample total-score variance s² = 1.106945, the calculation gives Kuder-Richardson Formula 21 = -0.425067. A negative value is not evidence of useful negative reliability. It is a diagnostic result showing that the KR-21 approximation should not be used as the final reliability estimate for these heterogeneous items.
What does Kuder-Richardson Formula 21 measure?
A simplified internal-consistency approximation for a test made of binary items.
Kuder-Richardson Formula 21, often shortened to Kuder-Richardson Formula 21, estimates the internal consistency of a set of dichotomously scored items. Every item must contribute two possible numerical values, conventionally 0 and 1. In an achievement test, 1 usually represents a correct response and 0 an incorrect response. In a questionnaire, 1 may represent endorsement and 0 nonendorsement, although the interpretation then requires particular care because the items may not behave like parallel test questions.
Internal consistency asks whether the items behave as parts of one coherent composite score. It is not the same as stability across time, agreement among judges, or validity. A high coefficient can occur when items are redundant, and a low coefficient can occur when the items deliberately sample several different domains. The result therefore has to be interpreted beside the test blueprint, response process, dimensional structure, score use, and item characteristics. General descriptions of scale summaries can be reviewed under descriptive statistics, while the difference between a raw score and a variable type is covered in variables in statistics.
The distinctive feature of Kuder-Richardson Formula 21 is that it does not use each item’s observed proportion of 1 responses. Instead, it uses only the number of items, the mean total score, and the variance of total scores. That economy made the formula attractive when item-level calculations were difficult. The price of that simplicity is a strong assumption: all items are treated as if they have approximately the same difficulty or endorsement rate. When that assumption fails, Kuder-Richardson Formula 21 can underestimate reliability severely.
What the coefficient summarizes
The coefficient summarizes the ratio of observed total-score variation to the amount of variation expected from a simplified equal-difficulty binary-item model. Values nearer 1 usually indicate stronger internal consistency under an appropriate design. Values near 0 indicate little dependable common-score variation. Negative values signal that the model and data do not support a conventional reliability interpretation.
What it does not establish
Kuder-Richardson Formula 21 does not prove that a scale is unidimensional, unbiased, valid, fair, or stable over time. It does not provide a p-value, identify a causal relationship, or show agreement between raters. Those questions require different designs and statistics, such as Fleiss kappa, weighted kappa, or the intraclass correlation coefficient.
A useful definition is therefore: Kuder-Richardson Formula 21 is a simplified lower-bound-style estimate of internal consistency for binary items when item difficulties are sufficiently similar. The phrase “sufficiently similar” is central. The formula is most defensible for a deliberately constructed test in which items target comparable difficulty and measure a common domain. It is least defensible for a collection of unrelated yes/no indicators with very different prevalence rates.
The term internal consistency is sometimes misunderstood as evidence that every item should be almost identical. That is not the goal. A well-designed test samples a domain with enough breadth to support interpretation while retaining sufficient common covariance for a dependable total. Kuder-Richardson Formula 21 reflects that balance only indirectly. It responds to the total-score variance and the assumed binary-item variance, but it cannot inspect content representation. For that reason, a high numerical value should never replace expert review of the item set.
Binary scoring simplifies the scale but does not simplify the meaning of responses. In a knowledge test, a 1 may indicate mastery of an item. In a support index, a 1 may indicate access to a resource. Those response processes are different. Kuder-Richardson Formula 21 is mathematically available in both cases, yet the reflective reliability interpretation may be appropriate only in the first. The intended score model therefore comes before the formula.
Reliability also concerns the precision of distinctions among people. When nearly everyone has the same total, even accurately recorded items provide little information for separating respondents. The resulting restricted variance lowers an internal-consistency estimate. This dependence on sample spread is not a defect in the arithmetic; it is a reminder that score precision is conditional on the population in which the score is used.
When should you use Kuder-Richardson Formula 21?
Use the decision logic below before calculating or reporting Kuder-Richardson Formula 21.
Use Kuder-Richardson Formula 21 when the planned score is the sum of several 0/1 items, the items are intended to measure one broad construct, and their difficulty levels are reasonably homogeneous. A classroom test containing many similarly targeted true/false or right/wrong questions is the classic setting. A certification test may also qualify when the blueprint and item-development process intentionally control difficulty and content coverage.
The coefficient is especially useful as a quick historical calculation, a hand-calculation exercise, or a preliminary comparison with KR-20. It can also be useful when only the number of items, total-score mean, and total-score variance are available. In modern analysis, however, item-level data are commonly available, so the more exact KR-20 or binary-item Cronbach’s alpha is usually preferable. The Cronbach’s alpha guide explains the general alpha framework, while corrected item-total correlation helps identify items that do not align with the remaining score.
Confirm binary scoring
Every analyzed item must be coded consistently as 0 or 1, with no hidden third response category.
Confirm one score
The items must be intended to contribute to the same total score rather than several unrelated subscales.
Review difficulty
Compare item proportions. Similar values support the equal-difficulty approximation.
Inspect total scores
Check the score distribution, variance, floor effects, ceiling effects, and missing-data rule.
Compare estimates
Calculate KR-20 or alpha when item-level data are available and explain material differences.
Do not choose Kuder-Richardson Formula 21 merely because the variables happen to be binary. Binary indicators can describe entirely different behaviors or circumstances. For example, school support, family support, paid tutoring, extracurricular activity, intention to pursue higher education, and internet access are all yes/no variables, but they do not automatically constitute a single psychometric test. Their coding type is categorical, as discussed in categorical and quantitative variables; their shared format does not guarantee a common latent trait.
Kuder-Richardson Formula 21 is also unsuitable when items receive partial credit, have more than two ordered categories, or use different score weights. Treating a four-category Likert item as binary discards information and changes the construct. Similarly, combining items with opposite scoring directions without correct reverse coding can create artificial negative covariance. Before any reliability calculation, audit the coding, labels, valid ranges, and scoring key.
Sample design matters as well. Reliability is a property of scores in a particular population and context, not an eternal property of the instrument. A narrowly homogeneous sample can reduce total-score variance and lower the coefficient, even when the same test is more reliable in a diverse population. Review sampling methods and sampling bias when the sample is intended to support broader score use.
A practical decision sequence is to ask whether the total score will be used for individual interpretation, group description, research adjustment, or simple counting. Individual decisions require stronger precision evidence than a descriptive group summary. If the score is only a count of different conditions, internal consistency may not be the primary quality standard. If the score is intended to represent one latent ability, item covariance and dimensionality become central.
Kuder-Richardson Formula 21 is sometimes selected for examination questions because all responses are right or wrong. That criterion is necessary but not sufficient. A test containing very easy recall items, very difficult synthesis items, and several unrelated content domains can violate the equal-difficulty and common-score conditions even though every response is binary. Pilot item statistics are therefore essential.
When summary statistics are inherited from an old report and raw responses no longer exist, Kuder-Richardson Formula 21 may be the only reproducible coefficient. In that situation, report the limitation directly. Do not imply that the approximation equals an item-level analysis. The historical result can be useful for documentation while still being unsuitable for current operational decisions.
Kuder-Richardson Formula 21 assumptions: six conditions to check
Kuder-Richardson Formula 21 is simple to calculate, but its equal-difficulty approximation is restrictive.
The first assumption of Kuder-Richardson Formula 21 is dichotomous scoring. Each item must enter the total as 0 or 1. Missing responses must not be silently converted to 0 unless the scoring policy explicitly defines omission as incorrect. A missing-value rule changes both the item means and the total-score variance, so it must be documented before calculation.
The second assumption is approximate equal item difficulty. In an achievement test, difficulty is the proportion answering correctly; a larger proportion means an easier item. In an endorsement scale, the same numerical quantity is better described as the endorsement rate. Kuder-Richardson Formula 21 treats every item as though its proportion were equal to the overall mean item score, M/k. This replacement is reasonable only when the individual proportions cluster around that common value.
The third assumption is a coherent score. The items should measure a sufficiently common domain for a total score to be meaningful. Internal consistency is driven by covariance. Items that represent unrelated constructs, opposite directions, or mutually exclusive circumstances can have weak or negative covariance even when each item is measured accurately. Reliability cannot repair an invalid scoring model.
| Assumption | What to check | Consequence of violation |
|---|---|---|
| Binary scoring | Every item is coded 0/1 with a documented missing-data rule. | The KR formulas no longer match the score scale. |
| Similar difficulty | Item proportions are reasonably close to M/k. | KR-21 becomes overly conservative and can be negative. |
| Common score domain | Content and empirical relationships support one composite. | The coefficient can be low because the score is multidimensional. |
| Independent response errors | Items are not duplicated, locally dependent, or mechanically linked. | Reliability can be inflated or distorted. |
| Adequate score variance | The sample includes enough spread in total scores. | Restricted range lowers reliability and destabilizes interpretation. |
| Consistent scoring direction | All 1 values represent the same intended direction. | Incorrect keys can create negative inter-item covariance. |
Local independence is another useful condition. After accounting for the intended construct, responses should not remain strongly dependent because of shared wording, a common stimulus, item chaining, or repeated content. Local dependence can make several items behave like one repeated question and inflate internal consistency. Conversely, speeded testing can introduce a block of omitted items near the end, creating position effects that are not part of the intended construct.
Although normality is not required for binary items, the total-score distribution still deserves inspection. Floor and ceiling effects reduce score variance and limit discrimination. The worked distribution is concentrated around 3 and 4, with very few totals at 0 or 6. Related guidance appears in frequency distribution, histogram interpretation, and variance.
Finally, Kuder-Richardson Formula 21 is a point estimate. It does not automatically provide a confidence interval. Resampling or specialized reliability methods can be used when interval estimation is needed, and the method must be named explicitly. General interval principles are reviewed in confidence intervals.
Approximate equality does not require every item proportion to be numerically identical. Sampling variation guarantees some differences. The question is whether the spread is small enough that replacing all p values with M/k has little practical effect. The strongest empirical check is the difference between Kuder-Richardson Formula 21 and KR-20. If the two estimates are close, the approximation is working adequately for the observed data.
Unidimensionality is not explicitly written in the Kuder-Richardson Formula 21 equation, but it is implicit in interpreting one coefficient for one score. A multidimensional set can sometimes produce a moderate coefficient because several clusters are positively related. That does not establish one dimension. Reliability and dimensionality should be investigated as complementary properties rather than substitutes.
The assumption of independent errors is particularly relevant when items share a reading passage or depend on the answer to a previous question. Such local dependence can inflate covariance and reliability. A coefficient that is high because of duplicated wording may overstate the precision of the broader construct. Content and residual diagnostics are needed to identify that situation.
Reliability question, measurement model and variables
Define the score, binary coding, item direction, and the reliability question before applying the formula.
The workbook contains 649 complete rows and six binary variables: schoolsup, famsup, paid, activities, higher, and internet. The source labels “yes” and “no” were recoded to 1 and 0. The derived total score is the row sum, so every student receives a value from 0 to 6.
| Variable | Public description | 1 means | Observed 1 count | Observed proportion | p(1-p) |
|---|---|---|---|---|---|
| schoolsup | Extra educational support from school | Yes | 68 | 0.1048 | 0.0938 |
| famsup | Family educational support | Yes | 398 | 0.6133 | 0.2372 |
| paid | Paid extra classes in the course subject | Yes | 39 | 0.0601 | 0.0565 |
| activities | Participation in extracurricular activities | Yes | 315 | 0.4854 | 0.2498 |
| higher | Intention to pursue higher education | Yes | 580 | 0.8937 | 0.0950 |
| internet | Internet access at home | Yes | 498 | 0.7673 | 0.1785 |
| Total score | Sum of the six recoded indicators | Higher count of endorsed conditions | — | Mean 2.9245 | Variance 1.1069 |
These descriptions matter because a numerical item label is not a construct definition. The total score combines several different circumstances and intentions. It can be used to demonstrate the arithmetic of Kuder-Richardson Formula 21, but the reliability result should not be interpreted as though the six indicators were a carefully developed unidimensional achievement test. Content coherence must be justified independently.
The observed common proportion assumed by Kuder-Richardson Formula 21 is M/k = 2.924499/6 = 0.4874165. Only the activities item is close to that value. School support and paid classes are much lower, while higher-education intention and internet access are much higher. This spread is the central empirical reason the approximation fails.
The distinction between item proportions and total-score statistics should remain explicit. Item proportions summarize individual binary variables, while the mean and variance summarize the composite. The mean, median, and mode and variance guides provide general background, and correlation matrix is useful for examining whether items move together.
In an operational test, the data dictionary should also document the item wording, scoring key, reverse-scored status, omitted-response rule, administration conditions, and intended subscale. Those fields allow a reviewer to distinguish genuine low consistency from coding errors or an inappropriate total score.
The six variables differ not only in frequency but also in substantive meaning. School support and paid classes are relatively uncommon services, higher-education intention is very common, and activities lies near an even split. A common-difficulty model compresses these distinct distributions into one hypothetical item. The resulting loss of information is visible in the gap between the actual and approximated variance terms.
A data dictionary should preserve original labels alongside recoded values. This prevents a 1 from being interpreted generically as success when it may instead mean endorsement, presence, or access. The public descriptions in the table clarify that the score counts conditions and intentions rather than correct answers.
For future scale development, item review can begin with endorsement rates and corrected item-total correlations, then continue with dimensional analysis. Items should not be removed solely because they are rare or common; an extreme item may be substantively essential. The decision must balance statistical behavior with content representation.
Kuder-Richardson Formula 21 formula and exact calculation
The formula uses the number of items, mean total score, and total-score variance.
Here k is the number of binary items, M is the mean total score, and s²X is the sample variance of total scores. Some texts use a population-style variance symbol. The same variance convention must be used consistently across the calculation and software comparison.
The leading factor k/(k – 1) corrects for test length. With six items, the factor is 6/5 = 1.2. The inner term compares the observed total-score variance with a simplified estimate of the summed item variances. When the observed score variance is large relative to the binary-item error term, the coefficient increases. When it is small, the coefficient decreases.
The logic becomes clearer by comparing the formula with KR-20. For binary item i, let pi be the proportion scored 1 and qi = 1 – pi. KR-20 uses the actual sum Σpiqi. Kuder-Richardson Formula 21 substitutes M(k-M)/k, which is the value that would arise if every item had the same p equal to M/k. The substitution removes the need for item-level proportions but creates the equal-difficulty limitation.
Why the approximation is usually larger
For a fixed average item proportion, the sum of p(1-p) is maximized when the item proportions are equal. Therefore, the Kuder-Richardson Formula 21 substitution tends to be at least as large as the actual sum used by KR-20. A larger subtracted term produces a smaller reliability estimate. This is why KR-21 is generally no larger than KR-20 when both are calculated consistently.
Why a negative value is possible
If the equal-difficulty term exceeds the observed total-score variance, the bracketed expression becomes negative. In the example, 1.499050 / 1.106945 = 1.354222, so 1 – 1.354222 = -0.354222. Multiplying by 1.2 gives -0.425067.
Rounding should occur only after the final step. Using the displayed mean 2.9245 and variance 1.107 produces a close result, but the verified value uses full precision. The same principle applies to standard deviation and other derived statistics: retain full numerical precision internally and round only for presentation.
The equality-based substitution can be understood through the concavity of p(1-p). For a fixed average p, the total binary variance is largest when all item proportions are equal. When proportions spread toward 0 and 1, their individual variances become smaller. Kuder-Richardson Formula 21 therefore subtracts a quantity that is too large whenever difficulty heterogeneity is substantial. The resulting coefficient is conservative and can cross below zero.
The use of total-score variance in the denominator connects the formula to covariance. The variance of a sum equals the sum of item variances plus twice the sum of item covariances. Reliability rises when positive covariance contributes a larger share of total variance. If covariances are weak or negative, the total variance cannot sufficiently exceed the item-specific variance term.
Researchers should state whether the variance was calculated with n or n-1 in the denominator. In large samples the difference is small, but exact cross-software replication depends on it. The worked analysis uses the sample variance, matching the workbook and SPSS descriptive table.
Worked substitution and arithmetic audit
The calculation uses the sample variance shown in the workbook and SPSS descriptive output. Full precision is retained until the final display value.
The result cross-checks across the worked Excel workbook, independent Python calculation, independent R calculation, and the value echoed in the SPSS output. The absolute difference between the Excel formula and the verified reference is approximately 1.61 × 10⁻¹⁵, which is ordinary floating-point precision rather than a substantive discrepancy.
Verified Kuder-Richardson Formula 21 result
Items = 6; cases = 649; mean total score = 2.924499; total-score variance = 1.106945. Cross-software verification status: pass.
A manual calculator can reproduce this result with three inputs: k, M, and s². Yet the numerical output alone is not sufficient. A responsible Kuder-Richardson Formula 21 calculator should also request or warn about item-difficulty similarity. Without item-level proportions, the user cannot verify the defining assumption, which is why a calculator based only on the formula can produce a mathematically correct but substantively unusable coefficient.
Variance conventions deserve attention. Some software reports population variance when a function is called with a denominator of n, while many statistical packages report sample variance with denominator n-1. The workbook and SPSS output use the sample variance. Replacing it with a population variance would change the final digits. Cross-platform work should therefore document the exact variance function or denominator.
There is no conventional hypothesis-test decision attached to this calculation. Although a worksheet may document a null statement for workflow completeness, Kuder-Richardson Formula 21 itself is an estimate, not an omnibus significance test. A reliability report should focus on the coefficient, assumptions, uncertainty, and score-use context rather than a p-value. General distinctions between estimation and testing are discussed in null and alternative hypotheses and p-values.
Each arithmetic stage has a diagnostic interpretation. The common item proportion is about 0.4874, the point at which binary variance is nearly maximal. Because the actual item set contains several proportions near 0 or 1, its true summed item variance is much smaller. The approximation therefore behaves as though all six items were maximally variable, which is inconsistent with the data.
The ratio of 1.3542 means the approximated error-related component is 35.4% larger than the observed total-score variance. Once that ratio exceeds one, no positive length correction can restore a nonnegative coefficient. The leading factor simply magnifies the negative inner value.
A spreadsheet or calculator should display intermediate values because they explain the result. Showing only -0.425 can make the output appear mysterious. Showing the equal-difficulty term, observed variance, ratio, and KR-20 comparison turns the result into an auditable diagnostic.
Kuder-Richardson Formula 21 worked example
A six-item, 649-case calculation with transparent coding and verified values.
Begin by recoding the six yes/no items as 1 and 0 and summing them within every row. The first several students obtain totals such as 2, 3, 3, 4, 2, and 4. Across all 649 rows, the total score has a mean of 2.924499, a median of 3, a sample standard deviation of 1.052115, and a sample variance of 1.106945.
The frequency distribution is concentrated near the middle: 5 students scored 0, 57 scored 1, 145 scored 2, 252 scored 3, 159 scored 4, 27 scored 5, and 4 scored 6. Thus, 411 students, or 63.3% of the sample, scored either 3 or 4. Only 9 students were at the two extreme endpoints combined. This concentration helps explain why the observed variance is modest.
| Total score | Frequency | Percent | Cumulative percent |
|---|---|---|---|
| 0 | 5 | 0.8% | 0.8% |
| 1 | 57 | 8.8% | 9.6% |
| 2 | 145 | 22.3% | 31.9% |
| 3 | 252 | 38.8% | 70.7% |
| 4 | 159 | 24.5% | 95.2% |
| 5 | 27 | 4.2% | 99.4% |
| 6 | 4 | 0.6% | 100.0% |
Next, insert the number of items and the score mean into the equal-difficulty component. With k = 6 and M = 2.924499, the complementary quantity k – M equals 3.075501. Their product is divided by 6, producing 1.4990499.
This approximated binary-item variance is then compared with the observed total-score variance of 1.1069452. Because the approximated term is larger than the total variance, the ratio is greater than 1. The inner reliability bracket becomes negative before the test-length adjustment is applied.
The item-level comparison confirms the mechanism. The actual sum of p(1-p) across the six items is 0.9107861. Kuder-Richardson Formula 21 substitutes 1.4990499, an increase of about 64.6%. KR-20 uses the actual smaller term and returns approximately 0.212649, close to the SPSS Cronbach’s alpha of 0.211 after display rounding.
This example is therefore educational in two ways. It demonstrates the hand calculation, and it demonstrates why assumptions must be checked before the coefficient is reported. The arithmetic is correct; the simplified model is unsuitable for the items.
The modal total of 3 is consistent with the mean of 2.9245 and median of 3. This agreement describes central location but says nothing by itself about reliability. Two tests can have identical score distributions and very different internal covariance structures. Reliability depends on how individual item responses combine within persons, not only on the histogram of totals.
The frequency table also shows that the full theoretical range is observed, but endpoint counts are sparse. Observing both endpoints does not guarantee adequate variance. Most cases remain clustered in the three central categories. A test designed for discrimination might need items targeted across the ability distribution rather than several indicators with extreme endorsement rates.
The example deliberately preserves the negative result because it is analytically informative. Replacing the value with zero, omitting it, or reporting only alpha would hide the evidence that the equal-difficulty approximation failed dramatically. Transparent reporting helps readers learn when not to use the formula.
Kuder-Richardson Formula 21 results and interpretation
Interpret the coefficient together with item difficulty, score variance, and model suitability.
Under a suitable test design, a larger positive Kuder-Richardson Formula 21 value indicates that a greater share of total-score variation is associated with common item covariance rather than item-specific error. Interpretation should be contextual. A coefficient acceptable for a brief exploratory classroom quiz may be inadequate for high-stakes individual decisions. Test length, construct breadth, consequences, and population heterogeneity all affect the standard.
Rules such as 0.70 for “acceptable” reliability are not universal laws. A broad construct may legitimately produce a lower coefficient than a narrow repetitive scale, while a high coefficient can result from redundant items. Reliability should be reported beside content coverage and intended use. The effect size concept provides a useful analogy: magnitude needs subject-matter context rather than a mechanical label.
| Observed pattern | Reasonable interpretation | Next action |
|---|---|---|
| High positive KR-21 and similar item proportions | The binary items show strong consistency under the approximation. | Confirm dimensionality, content coverage, and score use. |
| Moderate positive KR-21 | The score has some common consistency but may contain heterogeneous content or limited length. | Review item-total relationships and subscales. |
| Low positive KR-21 | Common-score variation is limited or the sample range is restricted. | Check scoring, item quality, dimensionality, and population. |
| KR-21 far below KR-20 | The equal-difficulty approximation is poor. | Prefer KR-20 or alpha and report difficulty heterogeneity. |
| Negative KR-21 | The approximation term exceeds observed total-score variance. | Do not present it as ordinary reliability; diagnose assumptions and scoring. |
In the worked analysis, the correct interpretation is not “reliability equals minus 0.43” as though negative reliability were a meaningful trait. The correct interpretation is that the Kuder-Richardson Formula 21 model fails for these items. The item proportions are extremely heterogeneous, and the six indicators do not form an obvious parallel-item test. The negative coefficient is diagnostic evidence against using KR-21 as the final summary.
The KR-20 comparison of about 0.213 is also low. It indicates weak internal consistency even after replacing the equal-difficulty approximation with the actual item variances. The SPSS alpha of 0.211 tells the same practical story. Therefore, the problem is not only the Kuder-Richardson Formula 21 approximation; the combined six-item score itself has limited common consistency in this sample.
Reliability is sample-dependent. A different population can produce a different total-score variance and different item proportions. This does not mean analysts should search for a sample that yields a desirable coefficient. It means the population and administration conditions must be named when reporting the result.
Magnitude labels should never be separated from score consequences. A low coefficient for a preliminary group-level research variable may be tolerable if uncertainty is acknowledged, whereas the same coefficient is unacceptable for licensing or placement decisions. The worked composite would not support precise individual classification on the basis of its internal consistency evidence.
A negative estimate also changes the reporting task. Instead of selecting a conventional adjective, the analyst must explain why the mathematical model is incompatible with the data. That explanation is more informative than a threshold label and helps prevent downstream misuse of the score.
The positive but low KR-20 comparison indicates that correcting the equal-difficulty assumption does not produce strong consistency. This distinction prevents an incomplete conclusion. Kuder-Richardson Formula 21 fails as an approximation, and the broader six-item composite also lacks strong common covariance.
What the negative KR-21 value means
A negative Kuder-Richardson Formula 21 value occurs when the variance term subtracted inside the formula is larger than the observed total-score variance. Algebraically, the coefficient becomes negative whenever M(k-M)/k > s²X. That exact condition holds in the worked data: 1.499050 is greater than 1.106945.
Several mechanisms can produce this pattern. The most direct is unequal item difficulty, because Kuder-Richardson Formula 21 uses the maximum-like equal-proportion substitution rather than the actual sum of binary item variances. Negative inter-item covariance, reverse scoring, heterogeneous content, restricted score range, or data errors can also lower total-score variance relative to the assumed item variance.
Model mismatch
Items with proportions near 0.06 and 0.89 cannot be represented well by one common proportion of 0.487. The approximation is therefore too large.
Weak common covariance
The KR-20/alpha comparison is only about 0.21, so the items share little common-score variation even without the Kuder-Richardson Formula 21 shortcut.
Restricted total spread
Most students score 2, 3, or 4, and only nine students occupy the two endpoints combined. The score variance is modest.
A negative value should trigger a structured investigation. First, confirm scoring direction and recoding. Second, inspect item proportions. Third, calculate KR-20 or alpha. Fourth, inspect corrected item-total correlations. Fifth, reconsider whether the items should form one scale. Sixth, document the result transparently rather than suppressing it.
Some software or reporting systems may display a warning that negative reliability violates model assumptions. Others may still print the raw number. Neither behavior changes the interpretation. The coefficient is not bounded automatically by the algebra, even though reliability as a variance ratio is conceptually expected between 0 and 1 under a valid model.
Do not claim that respondents answered “oppositely” or that the instrument has negative validity. The negative coefficient identifies an inconsistency between the score covariance and the reliability model. Validity is a broader evidentiary argument and cannot be inferred from the sign alone.
When a decision requires a dependable individual score, the instrument should be revised and revalidated before use. Adding more items can increase reliability only if the added items measure the intended domain and covary appropriately. Adding unrelated items merely increases length without solving the measurement problem.
Negative internal-consistency estimates are often more informative than a small positive value because they force attention to the scoring model. A small positive result can be casually labeled poor, whereas a negative result makes it clear that conventional interpretation has broken down. The analyst should use that signal constructively.
When reverse-key errors are suspected, inspect the item wording and the sign of item-total relationships before changing any code. Automatically reversing items until reliability rises is circular and can alter the construct. Scoring direction must be determined from the instrument definition.
If the item set is intentionally formative, low internal consistency may not be a defect. The appropriate response may be to stop treating reliability as the primary evaluation rather than to force the items into a reflective scale. The score’s conceptual model decides the criterion.
Kuder-Richardson Formula 21 in Python: complete calculation and charts
Python reproduces the coefficient, the score distribution, and the assumption diagnostics.
The Python analysis reproduces the exact workbook values and creates five publication-ready summaries. The first chart is shown full width, followed by two balanced chart pairs. The same verified image files are used in the R section because the Python and R outputs were cross-checked to the same numerical result.
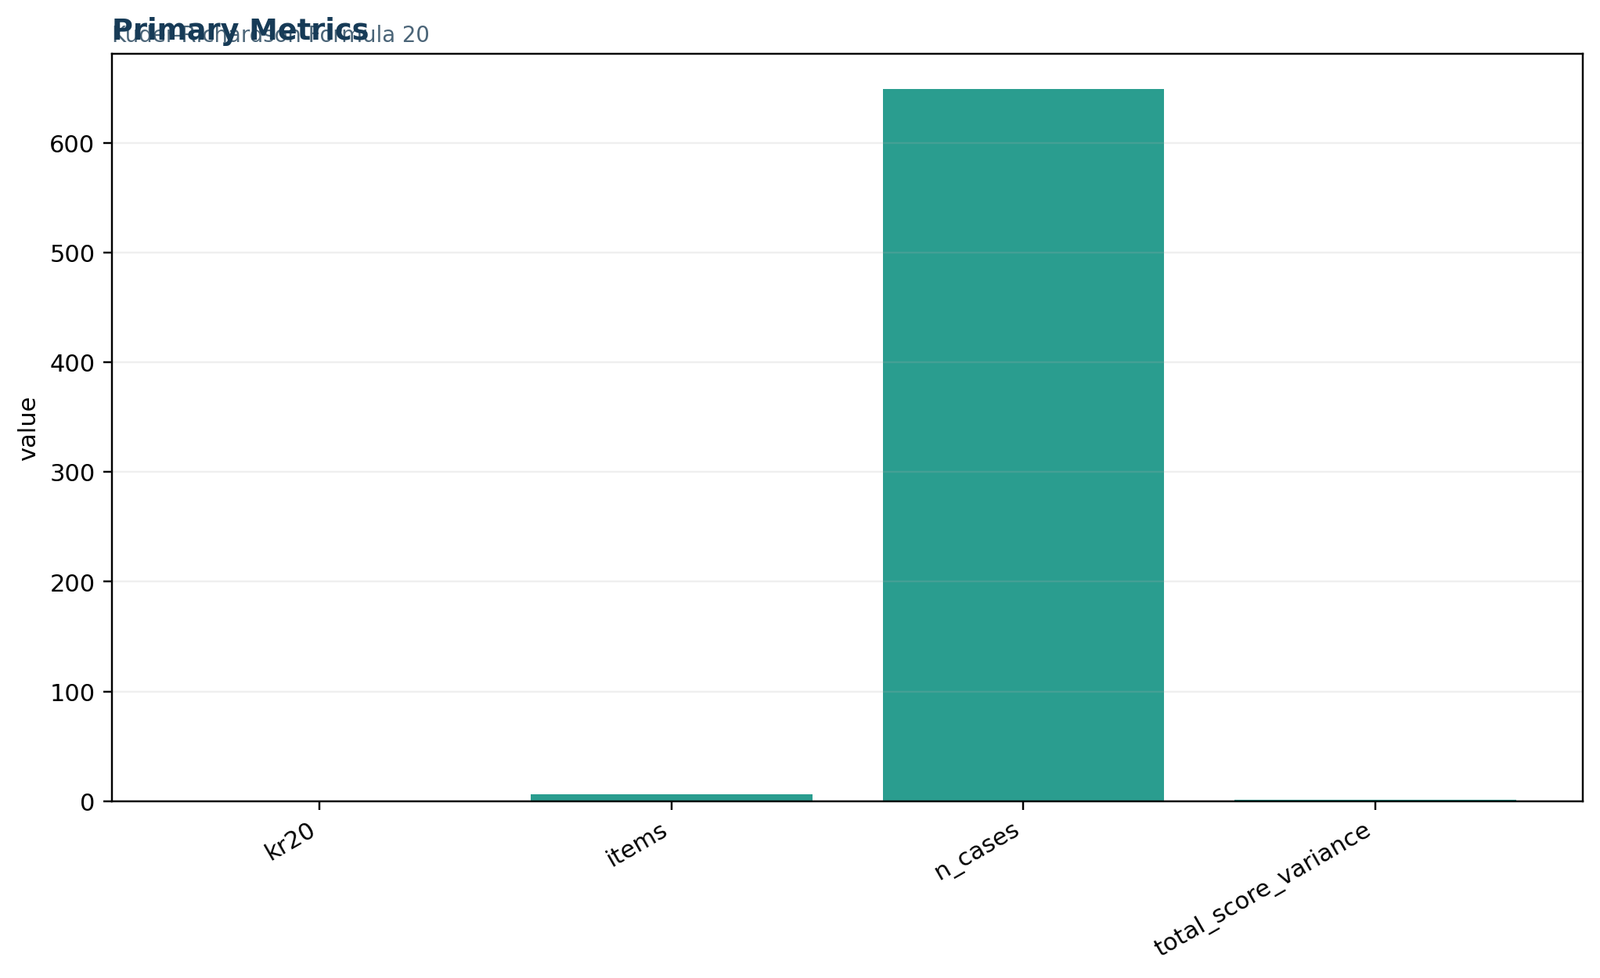
Python chart: Primary reliability metrics
The primary panel summarizes the 649 cases, six binary items, total-score mean and variance used in the Kuder-Richardson Formula 21 calculation.
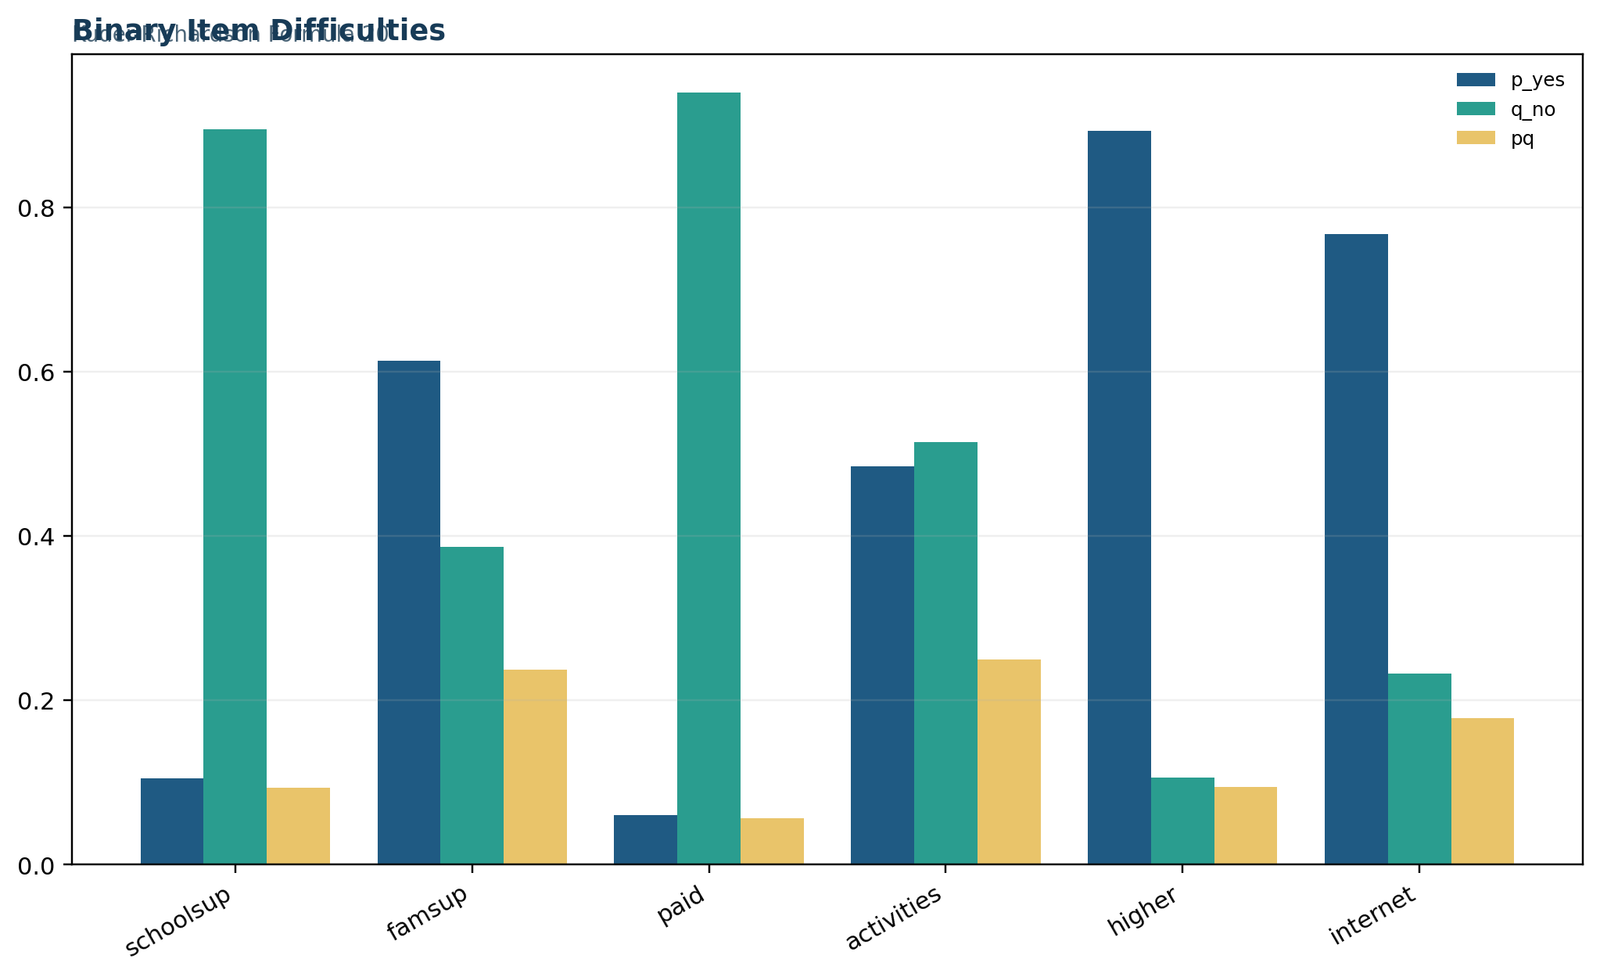
Python chart: Binary-item difficulty profile
The item endorsement rates reveal the central Kuder-Richardson Formula 21 assumption problem: the six binary items are not approximately equal in difficulty.
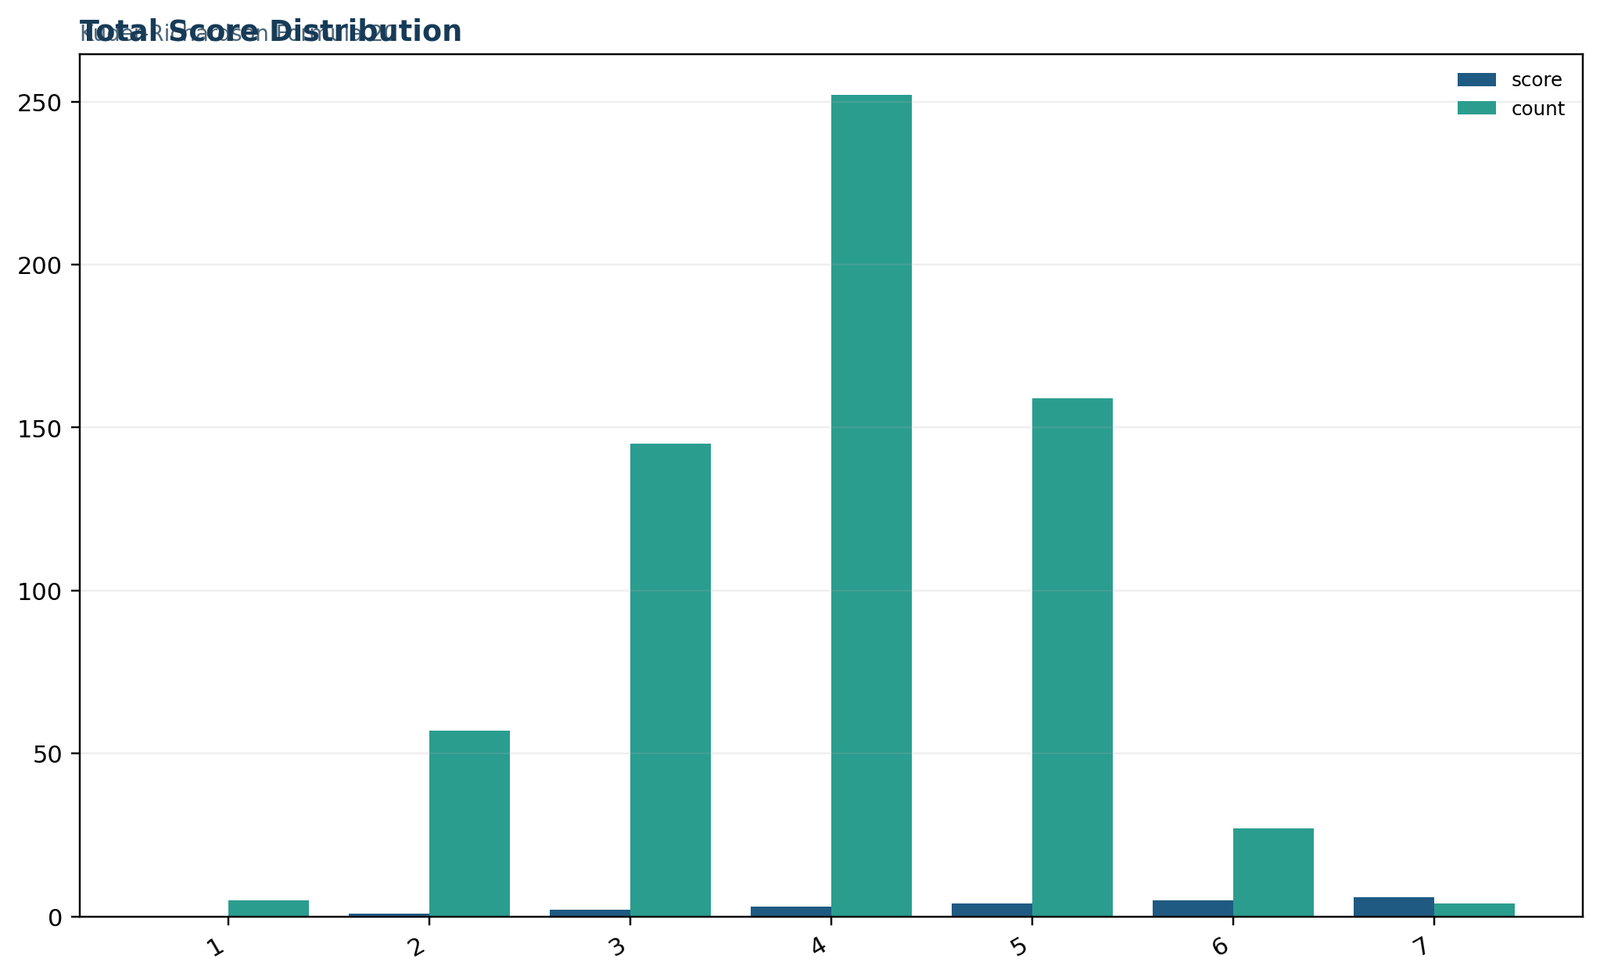
Python chart: Total-score distribution
The observed scores range from 0 to 6, with mean 2.9245 and sample variance 1.1069. These are the total-score inputs required by Kuder-Richardson Formula 21.
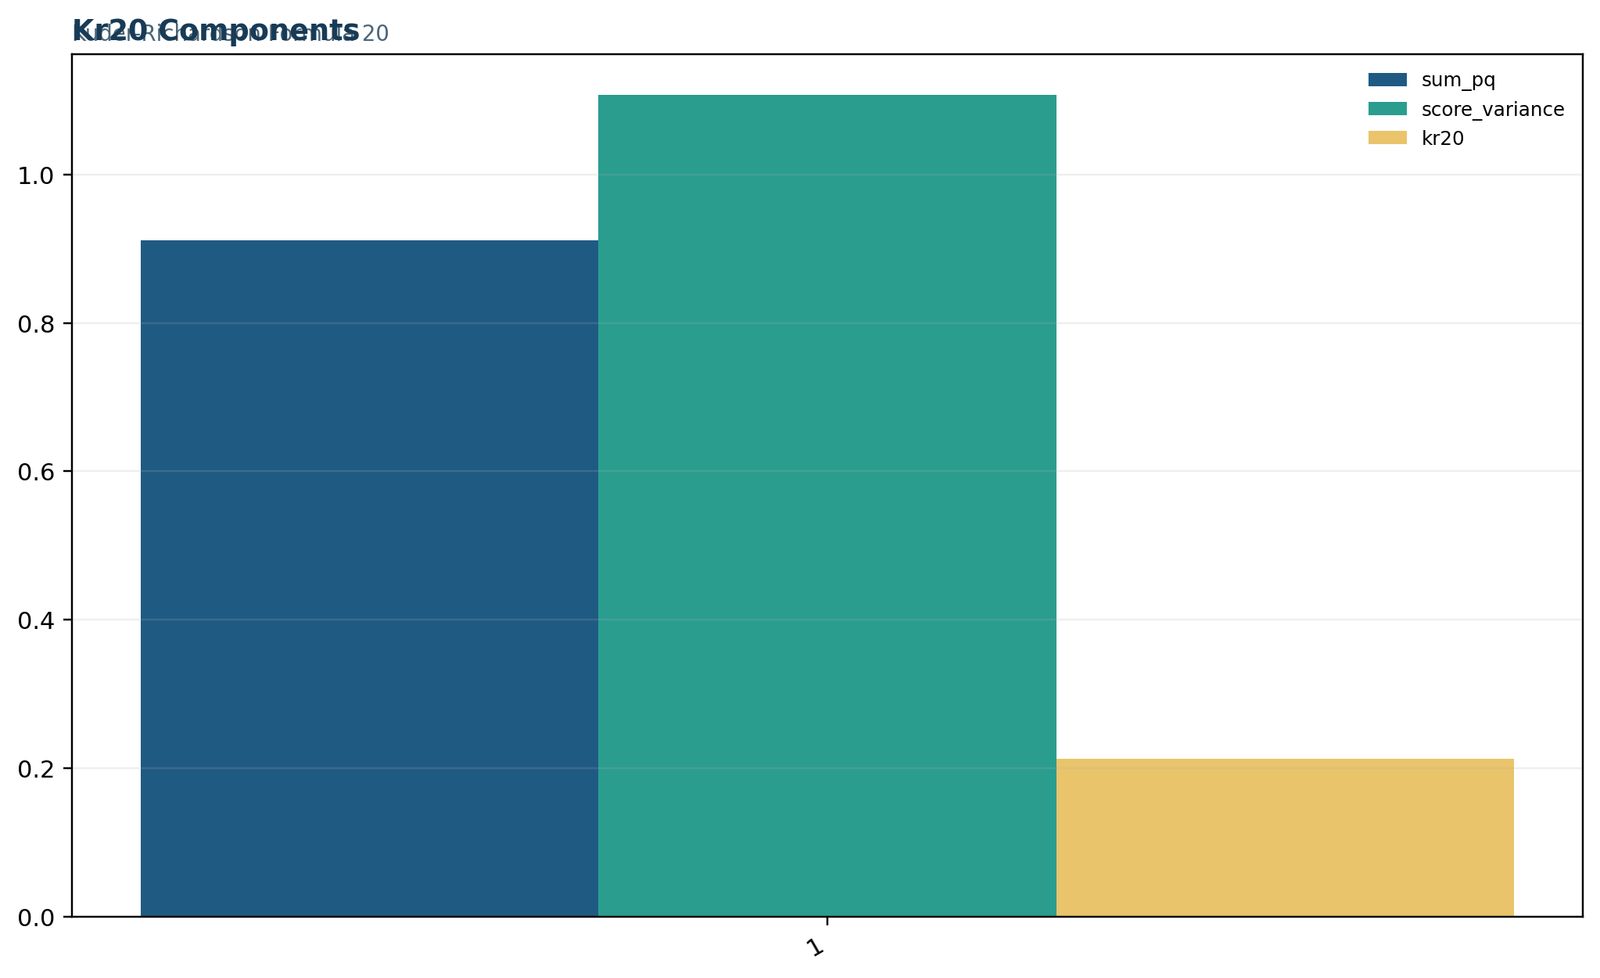
Python chart: KR-20 component comparison
The item-specific p(1-p) components provide the more detailed KR-20 comparison. Their contrast with the single Kuder-Richardson Formula 21 approximation explains the large coefficient difference.
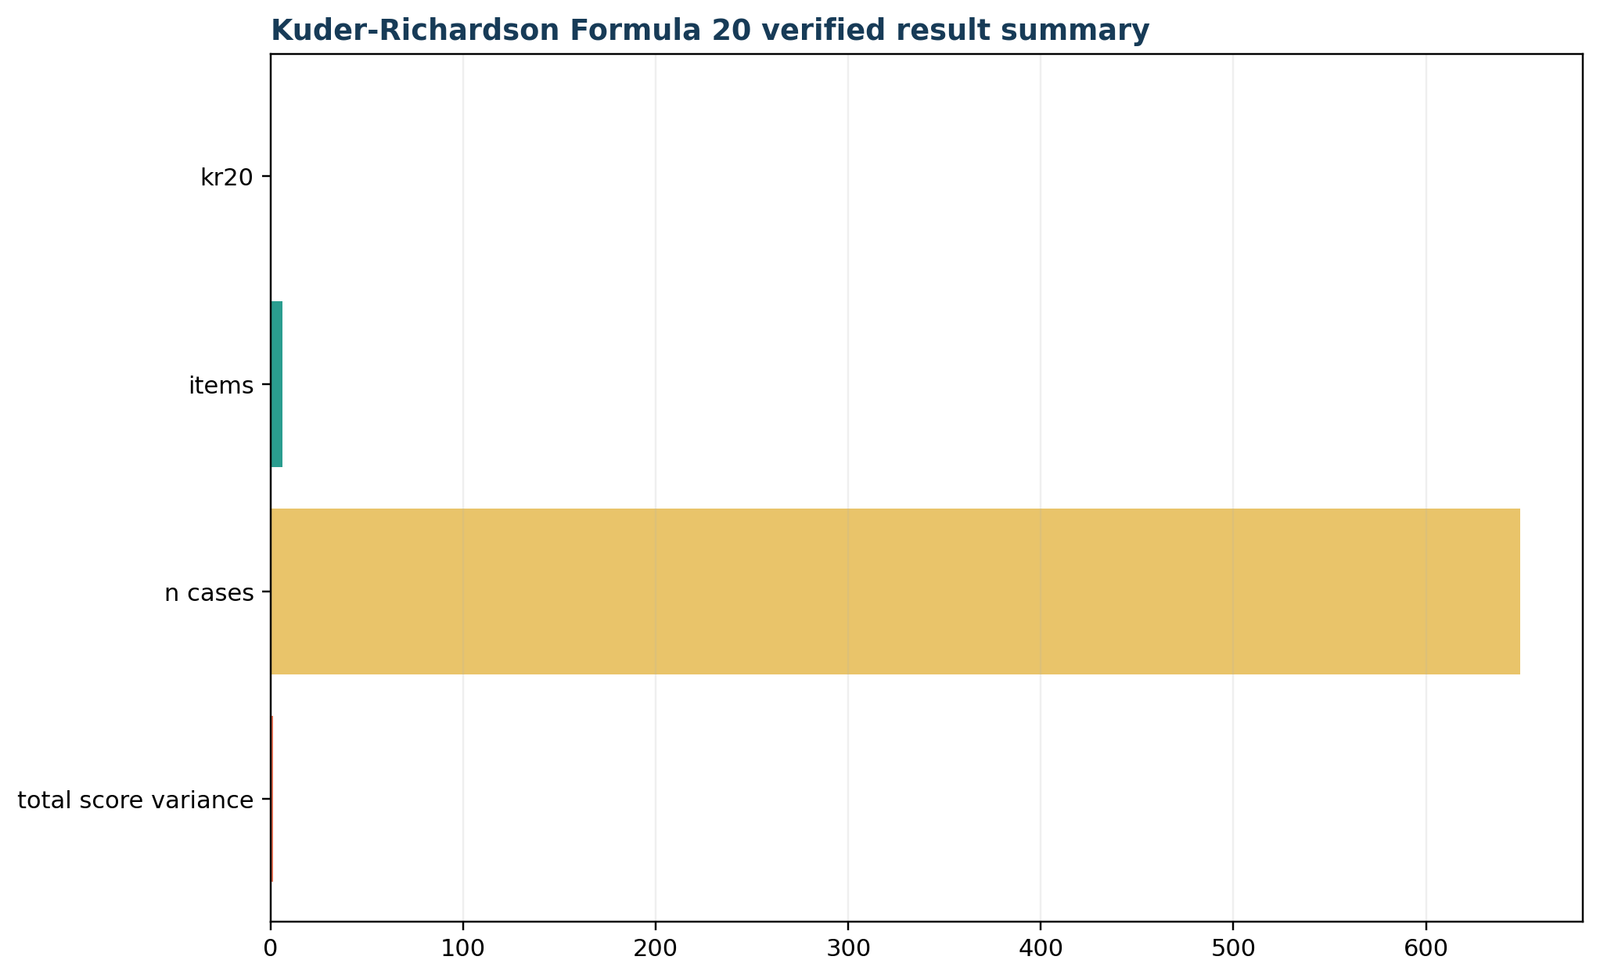
Python chart: Verified reliability summary
The final panel consolidates the verified metrics and supports the conclusion that Kuder-Richardson Formula 21 is not an appropriate final reliability estimate for this heterogeneous six-item composite.
Python can calculate Kuder-Richardson Formula 21 directly from a binary matrix by computing row sums, their mean, and sample variance. The important implementation checks are that missing values are handled explicitly, columns contain only 0 and 1, and the variance uses the intended denominator. Broader workflow examples are available in categorical data analysis in Python and correlation in Python.
A robust Python workflow should preserve a validation table containing column names, unique values, missing counts, 1 counts, proportions, and p(1-p) values. The reliability calculation should stop or flag the result when any column includes values outside 0 and 1. That design is safer than allowing implicit numeric conversion.
The score frequency table should be derived from the same row-total vector used in the formula. Separate transformations can create silent mismatches. Unit tests can verify that the sum of frequencies equals 649, the weighted frequency mean equals 2.924499, and the weighted sample variance equals 1.106945.
Cross-checking with an independent formula implementation is valuable because reliability workflows often involve recoding and missing-data choices. Agreement across two languages does not validate the construct, but it does validate the numerical execution given the same inputs.
Kuder-Richardson Formula 21 in R: calculation and verification
R independently verifies the same inputs, formula components, and final coefficient.
The R calculation uses the same six binary variables, the same 649 complete rows, and the same sample-variance convention. The R section intentionally mirrors the Python chart layout: one full-width primary figure and two paired rows. Numerical agreement confirms that the result is not caused by a software default.
R chart: Primary reliability metrics
The primary panel summarizes the 649 cases, six binary items, total-score mean and variance used in the Kuder-Richardson Formula 21 calculation.
R chart: Binary-item difficulty profile
The item endorsement rates reveal the central Kuder-Richardson Formula 21 assumption problem: the six binary items are not approximately equal in difficulty.
R chart: Total-score distribution
The observed scores range from 0 to 6, with mean 2.9245 and sample variance 1.1069. These are the total-score inputs required by Kuder-Richardson Formula 21.
R chart: KR-20 component comparison
The item-specific p(1-p) components provide the more detailed KR-20 comparison. Their contrast with the single Kuder-Richardson Formula 21 approximation explains the large coefficient difference.
R chart: Verified reliability summary
The final panel consolidates the verified metrics and supports the conclusion that Kuder-Richardson Formula 21 is not an appropriate final reliability estimate for this heterogeneous six-item composite.
In R, analysts should calculate the row total only after validating the binary columns. A frequency table for every item can reveal unexpected codes, and a correlation matrix can reveal reverse direction or weak relationships. Relevant background appears in categorical data analysis in R, correlation in R, and correlation matrices.
In R, logical values can be converted to 0 and 1, but factor conversion requires care because the underlying integer codes may not correspond to no and yes. Explicit recoding by label is safer. After recoding, column summaries and row totals should be checked before any coefficient is calculated.
The sample variance function in R uses n-1 by default, which matches the workbook. A custom function should expose this convention in documentation rather than assuming users know the default. Reproducibility improves when the function returns all intermediate components, not only the final coefficient.
R can also compare item proportions graphically and calculate KR-20 from the same matrix. Presenting both estimates is especially useful in teaching because the size of their difference visualizes the cost of the equal-difficulty shortcut.
Kuder-Richardson Formula 21 in SPSS
SPSS supplies the descriptive tables and reliability comparison, while the Kuder-Richardson Formula 21 equation is verified explicitly.
The SPSS workflow recodes the six yes/no variables into binary 0/1 items and computes kr21_score as their sum. Frequencies show 649 valid records and no missing total scores. The mean is 2.9245, median 3.0000, standard deviation 1.05211, variance 1.107, minimum 0, and maximum 6.
SPSS’s standard reliability procedure reports Cronbach’s alpha rather than a dedicated Kuder-Richardson Formula 21 line. For dichotomous items, ordinary alpha is algebraically equivalent to KR-20 when computed from the same item covariance structure. The output reports alpha = 0.211 for six items. The small positive alpha contrasts sharply with the negative KR-21 and supports the diagnosis that unequal item proportions make the KR-21 approximation too conservative.
| SPSS output element | Verified result | Interpretive role |
|---|---|---|
| Valid cases | 649 (100.0%) | Confirms complete-case analysis. |
| Total-score mean | 2.9245 | Supplies M in the KR-21 formula. |
| Total-score variance | 1.107 displayed | Supplies the reliability denominator. |
| Cronbach’s alpha | 0.211 | Approximate KR-20 comparison for binary items. |
| Number of items | 6 | Supplies k and defines the total-score range. |
| Echoed KR-21 | -0.4250668916 | Matches Python, R, and Excel. |
The item statistics reveal the difficulty problem directly. Displayed item means range from 0.06 for paid classes to 0.89 for higher-education intention. The standard deviations also vary because binary variance is p(1-p). Items near p = 0.50, such as activities, have the largest variance; very rare or very common endorsements have smaller variance.
The output also contains a subtitle-length warning because the supplied subtitle exceeded SPSS’s 60-character limit. This warning does not affect the numerical analysis. In a production syntax file, a shorter subtitle improves output presentation. Related SPSS workflow guidance is available in categorical data analysis in SPSS and correlation in SPSS.
Because SPSS alpha is only 0.211, the six-item composite shows weak internal consistency even under the more exact binary-item calculation. Item deletion, corrected item-total correlations, and dimensional analysis may help identify why. The corrected item-total correlation guide provides the next diagnostic step.
The SPSS frequency output provides an independent audit of the total-score vector. The seven frequencies sum to 649 and the displayed mean, median, standard deviation, and variance match the workbook. This confirmation is important because the reliability procedure and descriptive procedure can use different case sets when missing values are present.
The alpha table should be interpreted as a comparator rather than a substitute for the named Kuder-Richardson Formula 21 analysis. For binary items, alpha embodies the KR-20 logic through the covariance matrix. Its low value confirms weak consistency while avoiding the equal-difficulty approximation.
An SPSS production workflow can add item-total statistics and alpha-if-item-deleted output. Those diagnostics help identify unusual items, but deletion decisions should remain grounded in the intended score content.
Kuder-Richardson Formula 21 in Excel
The worked workbook exposes the recoding, total scores, formulas, diagnostics, and verification ledger.
The Excel file contains six organized sheets: Guide, Data_Input, Working, Calculations, Diagnostics, and Reporting. The Data_Input sheet preserves the source yes/no values. Working recodes them to 0/1 and calculates each row total. Calculations links the item count, case count, score mean, score variance, and Kuder-Richardson Formula 21 formula to verified reference values.
The workbook formula returns -0.4250668915887966, while the independent reference is -0.42506689158879823. The absolute difference is approximately 1.61 × 10⁻¹⁵. Similar machine-precision differences appear for the score variance. They arise from floating-point representation and do not change any reported conclusion.
Suggested Excel calculation cells
Workbook quality checks
A Kuder-Richardson Formula 21 Excel worksheet should avoid hard-coded intermediate values. When the item data change, the total score, mean, variance, and coefficient should update automatically. Separating inputs from calculations protects the raw data and makes the audit trail understandable.
The Diagnostics sheet correctly identifies the equal-difficulty assumption and states that Kuder-Richardson Formula 21 uses only the mean and total-score variance. A stronger operational workbook can add item-proportion columns, the range and standard deviation of those proportions, the actual Σp(1-p) term, and a KR-20 comparison. Those additions turn the workbook from a formula calculator into an assumption-aware reliability tool.
For charts, use the exact frequency counts rather than plotting a category index as though it were the score value. A descriptive table should always accompany or precede visual interpretation. Related Excel background is available in correlation in Excel and descriptive statistics.
Excel formulas should use structured references or clearly labeled ranges so that adding or removing cases does not silently exclude data. A count check can compare the number of computed totals with the expected 649 records. Conditional formatting can flag nonbinary inputs without changing them.
The workbook’s separation of source data and working calculations is a strong reproducibility feature. Users can inspect the recoding and trace the final value back to individual rows. Protecting formula cells while leaving only intended input cells editable reduces accidental changes.
A useful dashboard can display Kuder-Richardson Formula 21, KR-20, alpha, the difficulty range, mean total score, variance, and an assumption status. The status should be rule-based and transparent, not a decorative label that hides the underlying values.
Kuder-Richardson Formula 21 vs KR-20
The difference is the equal-difficulty approximation: KR-20 uses item-specific proportions, while Kuder-Richardson Formula 21 does not.
| Feature | KR-20 | KR-21 |
|---|---|---|
| Required inputs | Each item proportion plus total-score variance | Number of items, mean total score, and total-score variance |
| Difficulty treatment | Uses each observed p and q | Assumes every item has p = M/k |
| Accuracy | More exact for binary items | Simplified approximation |
| Typical relationship | Usually at least as large as KR-21 | Usually lower than KR-20 |
| Best use | Item-level binary data are available | Only summary data are available and difficulties are similar |
| Worked result | 0.212649 | -0.425067 |
For the worked six-item score, the actual sum of item variances is Σp(1-p) = 0.910786. KR-20 therefore calculates 6/5 × [1 – 0.910786/1.106945] = 0.212649. Kuder-Richardson Formula 21 replaces 0.910786 with 1.499050, which is much larger and forces the coefficient below zero.
The difference between the two estimates is approximately 0.637716. This is not a rounding issue. It is direct evidence that the equal-difficulty substitution is inappropriate. The item proportions are spread across most of the possible 0-to-1 range, so the common p of 0.4874 does not represent the set.
KR-20 and alpha are equivalent for conventionally scored dichotomous items when based on the same covariance and variance definitions. Differences can arise from missing-data handling, variance denominators, case selection, item weighting, or rounding. A cross-software audit should compare the number of included cases and the exact item matrix before assuming a formula discrepancy.
The phrase “Kuder Richardson formula 20 and 21” often appears in searches because students are asked to distinguish the formulas. The essential answer is that KR-20 uses detailed item information and Kuder-Richardson Formula 21 uses a test-mean shortcut. KR-21 is easier to calculate by hand but less robust. Modern software removes the computational reason to prefer the shortcut.
The mathematical relationship between the formulas explains why Kuder-Richardson Formula 21 is called a shortcut. It replaces a sum of six observed quantities with one expression derived from the total mean. The shortcut was computationally attractive before routine electronic analysis, but it discards exactly the information needed to diagnose unequal difficulty.
A close KR-20 and Kuder-Richardson Formula 21 pair does not prove that every item is parallel. It only suggests that the equal-difficulty substitution has limited numerical effect on the coefficient. Content coherence, dimensionality, and local independence still require separate evidence.
When a report includes both estimates, name which one is used for the final conclusion. In this example, KR-20/alpha is the more appropriate internal-consistency estimate, but its value remains too low to support strong score precision.
KR-21 compared with Cronbach’s alpha and related reliability coefficients
Choose a reliability coefficient that matches the item format, measurement model, and score use.
| Statistic | Primary question | Difference from KR-21 |
|---|---|---|
| Kuder-Richardson Formula 21 | Are approximately equal-difficulty binary items internally consistent? | Uses only k, mean total score, and total-score variance. |
| KR-20 / Cronbach’s alpha | Are binary items internally consistent using their observed variances? | Uses item-level information and does not assume equal difficulty. |
| Corrected item-total correlation | How strongly does each item relate to the total formed from the other items? | Item diagnostic rather than one overall reliability coefficient. |
| Split-half reliability | Do two constructed halves of a test produce similar scores? | Depends on the split and normally requires a length correction. |
| Test-retest reliability | Are scores stable across administrations? | Temporal stability rather than within-administration consistency. |
| Intraclass correlation | How reliable are continuous ratings or repeated measurements? | Model-based agreement or consistency for quantitative ratings. |
| Kappa statistic | Do raters agree on categories beyond chance? | Agreement among raters, not consistency among test items. |
| Weighted kappa | Do raters agree on ordered categories with graded disagreement? | Uses category weights rather than binary-item covariance. |
A reliability coefficient must match the data-generating design. Applying Kuder-Richardson Formula 21 to rater labels would confuse item consistency with agreement. Applying kappa to test questions would confuse categorical agreement with score reliability. The numerical range alone does not make coefficients interchangeable.
Corrected item-total correlations are particularly relevant after a low or negative Kuder-Richardson Formula 21 result. An item with a negative corrected relationship may be reverse keyed, miscoded, or measuring something different. An item with a near-zero relationship contributes little to a common score. Removing items solely to maximize reliability is not advisable, because content validity can be damaged. The item should be reviewed substantively as well as statistically.
Dimensionality is also separate from coefficient magnitude. A six-item set could contain two internally consistent three-item subscales but show weak consistency when forced into one total. Factor analysis or another dimensional assessment may reveal that structure. Reliability should be calculated for scores that have a defensible interpretation.
General association tools such as correlation matrices are useful diagnostics but do not replace a reliability model. Pairwise correlations show relationships one pair at a time; an internal-consistency coefficient summarizes the covariance structure relative to total-score variance.
Internal consistency is only one component of reliability evidence. A test can be internally consistent yet unstable across time because the measured state changes, or stable across time yet internally heterogeneous because it combines several enduring traits. The design of the score interpretation determines which form of reliability matters.
Agreement coefficients such as kappa and ICC require repeated judgments or measurements of the same targets. Kuder-Richardson Formula 21 requires multiple items contributing to one score. Confusing these data structures can produce a coefficient that is mathematically computable but conceptually unrelated to the research question.
Item response theory offers another family of models for binary test items. Those models describe item difficulty and discrimination explicitly and can estimate information across ability levels. Kuder-Richardson Formula 21 does not provide item parameters and should not be interpreted as an IRT model.
Diagnostics, sensitivity checks and final checklist
Check binary coding, item difficulty, dimensional coherence, variance convention, and cross-software agreement.
Data integrity checks
Measurement checks
The first diagnostic is binary-code validation. A single unexpected value such as 2 or -1 can change the row total and invalidate the formula. Text values may contain capitalization differences or trailing spaces. A reproducible workflow should recode explicit categories rather than relying on implicit conversion.
The second diagnostic is item difficulty or endorsement. The worked range of 0.0601 to 0.8937 is an unmistakable violation. A useful summary includes the minimum, maximum, range, mean, and standard deviation of item proportions. A plot of the six proportions would be more informative for assumption checking than a chart dominated by the case count.
The third diagnostic is the total-score distribution. The observed scores are bounded and centrally concentrated. Analysts can use histogram interpretation, box plot interpretation, and outlier detection to describe distributional features, but “outliers” in a bounded test score should be interpreted carefully. A score of 0 or 6 is not automatically erroneous.
The fourth diagnostic is covariance direction. Reliability requires positive common covariance under ordinary same-direction scoring. Negative covariances can arise from reverse-key errors, mutually exclusive items, multidimensionality, or random responding. An inter-item matrix and corrected item-total table can localize the problem.
The fifth diagnostic is population restriction. The coefficient is affected by total-score variance, so a sample containing students with similar response profiles can yield low reliability. Report the sample and intended inference population, and avoid assuming that the same coefficient applies everywhere.
Finally, verify reproducibility. Python, R, SPSS, and Excel should agree on case count, item count, total-score mean, and variance. If they do not, resolve data selection and variance conventions before discussing reliability.
A diagnostic workflow should be ordered from simple to complex. Start with valid values and scoring direction, then examine item frequencies, total-score frequencies, inter-item relationships, corrected item-total correlations, and dimensionality. This order prevents advanced modeling from obscuring a basic coding error.
The difficulty range can be supplemented with a histogram or dot plot of item proportions. For six items, a table is already sufficient to see the problem. The minimum and maximum alone should not replace the full list when the item count is small.
Reproducibility checks should compare not only the final coefficient but also the intermediate equal-difficulty term. Two implementations can coincidentally produce similar final values after offsetting errors. Matching every component provides stronger evidence of correct execution.
Final calculation and reporting checklist
Before calculation
Before reporting
The worked analysis shows why Kuder-Richardson Formula 21 must be interpreted as a conditional approximation. The formula itself is reproduced exactly: six items, 649 cases, mean score 2.924499, variance 1.106945, and Kuder-Richardson Formula 21 -0.425067. Python, R, SPSS, and Excel agree on those inputs and the final result.
The negative coefficient is not a software error. It follows from the equal-difficulty term of 1.499050 exceeding the observed total-score variance. The item proportions are highly unequal, and the more exact KR-20/alpha estimate is also low. The appropriate conclusion is that Kuder-Richardson Formula 21 is not a suitable final reliability estimate for this composite and that the score requires substantive and psychometric review.
A sound reliability report combines calculation, diagnosis, and context. It identifies what the items measure, how they were scored, who provided the data, how missing values were handled, which variance convention was used, and whether the model assumptions are plausible. That transparency is more valuable than forcing the result into a favorable label.
A checklist is useful only when each item can change the analysis. If binary validation fails, stop and correct the data. If equal difficulty fails, calculate and prefer KR-20. If score coherence fails, reconsider the total. If cross-software values differ, resolve implementation choices before publication.
The final decision should be written in terms of score use. For this example, the six-item count can still be described descriptively, but its weak internal consistency and failed Kuder-Richardson Formula 21 approximation do not support treating it as a precise unidimensional reliability scale.
The result also illustrates a broader statistical principle: verification of arithmetic and validation of a model are different tasks. Four programs can agree perfectly on a coefficient that should not be used for substantive inference.
How to report Kuder-Richardson Formula 21 in APA style
Report the coefficient, item count, sample size, score statistics, assumption limits, and practical conclusion.
An APA-style report should begin with the score and sample rather than the software. State that six dichotomous indicators were coded 0/1 and summed for 649 cases. Report the total-score mean and standard deviation, followed by the Kuder-Richardson Formula 21 coefficient. Because the coefficient is negative, explain the equal-difficulty violation and provide the KR-20 or alpha comparison.
APA-style reporting example
Internal consistency of the six-item binary composite was evaluated using Kuder-Richardson Formula 21. The analysis included 649 complete cases. Total scores ranged from 0 to 6 (M = 2.924, SD = 1.052, s2 = 1.107). The Kuder-Richardson Formula 21 estimate was negative, KR-21 = -0.425. Item endorsement proportions ranged from 0.060 to 0.894, indicating a strong violation of the equal-difficulty assumption. Accordingly, KR-21 was not interpreted as a usable reliability estimate. The item-level KR-20 estimate was 0.213, and SPSS Cronbach’s alpha was 0.211, indicating weak internal consistency for the composite in this sample.
Reporting checklist
Language to avoid
Do not write that the scale is “-42.5% reliable.” Do not convert the negative coefficient into a percentage. Do not describe Kuder-Richardson Formula 21 as a significance test, correlation with an outcome, or proof of validity. Do not report only a generic adjective such as “poor” without explaining the assumption failure.
When an interval estimate is available, name the interval method. When no interval is calculated, do not invent one from generic cutoffs.
Report enough precision to reproduce the calculation, but avoid displaying long machine-precision decimals in narrative text. Six decimals are appropriate for a calculation table; three decimals are usually sufficient in prose. The exact ledger can remain in the downloadable workbook and software reports.
The report should also separate result from recommendation. The result is the negative Kuder-Richardson Formula 21 and low KR-20/alpha. The recommendation may be to review scoring, item content, dimensionality, and intended score use. That recommendation is justified by the evidence but is not itself a statistic.
The reporting paragraph should be understandable without opening a software file. It must contain the result and the reason the result is not used conventionally. The downloadable reports then provide audit detail rather than carrying essential interpretation that is absent from the article.
When space is limited, prioritize the item count, sample size, score mean and variance, Kuder-Richardson Formula 21, item-proportion range, and KR-20/alpha comparison. Those values are sufficient to explain the negative result. Additional frequencies and item statistics can appear in a table or appendix.
A reproducible report should preserve the unrounded values in a machine-readable workbook while using readable rounded values in prose. This approach supports both verification and communication.
Kuder-Richardson Formula 21 PDF, Excel and software downloads
Use the reports and workbook to reproduce the same 649-case calculation across software environments.
Python reportExact KR-21 calculation, score distribution, component charts, and verified results.Open Python PDF
R reportIndependent R calculation, descriptive checks, and cross-software verification.Open R PDF
SPSS outputTotal-score frequencies, item statistics, alpha comparison, and echoed KR-21 result.Open SPSS PDF
Worked Excel analysisRaw binary variables, row totals, formulas, diagnostics, and exact verification ledger.Open Excel workbook
The downloadable materials use the exact Kuder-Richardson Formula 21 values reported in this article. The workbook is the most transparent source for formula auditing, while the SPSS PDF provides the descriptive and alpha comparison tables. Python and R reports provide independent computational confirmation.
The four files serve different verification roles. The Excel workbook exposes formulas and row lineage, the SPSS output documents descriptive and alpha tables, and the Python and R reports demonstrate independent calculation. Together they support numerical reproducibility without implying that software agreement validates the score construct.
Readers should begin with the Guide and Reporting sheets in Excel, then inspect the item proportions and total-score distribution. The most important diagnostic comparison is between the actual Σp(1-p) term and the Kuder-Richardson Formula 21 equal-difficulty term.
All download links are specific to Kuder-Richardson Formula 21. They should not be replaced with KR-20 assets because the formulas, component labels, and interpretation differ.
Applications, test design and responsible use
Kuder-Richardson Formula 21 is most informative when the test-development process supports its assumptions before data are analyzed.
Kuder-Richardson Formula 21 originated in a context where hand calculation and limited computing resources made a summary-data approximation valuable. In contemporary educational measurement, it remains useful for teaching reliability concepts and for historical comparability. Its most defensible operational application is a binary test with many items targeted at similar difficulty.
During test design, item writers can use a blueprint to balance content domains and target difficulty. Pilot testing then provides item proportions and item-total relationships. If difficulty varies intentionally across a broad range, KR-20 or another item-level reliability method is a better choice. The purpose of a test blueprint is not to maximize one coefficient but to support valid coverage of the intended domain.
For classroom quizzes, a low coefficient may reflect very few items. Reliability generally increases with test length when added items are positively related to the same construct. Yet length alone is not enough. Six coherent items can outperform twenty unrelated indicators. The relationship between score use and acceptable precision should guide revision.
For surveys, yes/no items often represent different experiences rather than interchangeable indicators. An index can still be useful as a count of conditions, but internal consistency may not be the appropriate quality criterion. Formative indices are defined by their components rather than caused by one latent trait, so low alpha or Kuder-Richardson Formula 21 does not automatically invalidate the index. The scoring interpretation must determine whether a reflective reliability model is appropriate.
Appropriate educational use
A 40-item right/wrong test designed around one content domain, with item difficulties clustered near 0.60, may support Kuder-Richardson Formula 21 as a quick approximation. The result should still be compared with KR-20 when item data are available.
Inappropriate index use
A count of internet access, family support, paid classes, extracurricular participation, and educational intention describes accumulated conditions. Those conditions need not be interchangeable manifestations of one trait, so conventional internal consistency may be conceptually secondary.
High-stakes decisions require stronger evidence than a single coefficient. Score reliability should be evaluated across relevant populations, forms, occasions, and administration conditions. Fairness, content representation, dimensionality, decision consistency, and consequences also matter.
When presenting a Kuder-Richardson Formula 21 example to students, show both a suitable equal-difficulty dataset and an unsuitable heterogeneous dataset. The contrast demonstrates why formulas are conditional models rather than automatic truth-generating devices.
Planning a larger study can involve precision and stability considerations, but conventional statistical power does not directly determine reliability. Likewise, Type I and Type II errors belong to hypothesis testing, not to the ordinary interpretation of Kuder-Richardson Formula 21.
In test construction, targeting every item to identical difficulty is neither necessary nor always desirable. A useful test may need a range of difficulties to measure across ability levels. In that common situation, the design itself argues for KR-20 or a more detailed model rather than Kuder-Richardson Formula 21.
For progress monitoring, alternate forms may require evidence that item difficulty and score meaning are comparable across administrations. A single Kuder-Richardson Formula 21 coefficient from one form cannot establish form equivalence. Stability and linking evidence are separate requirements.
For research covariates, measurement error can attenuate relationships with outcomes. A low reliability estimate warns that regression or correlation results involving the score may be weakened or unstable. Correcting for attenuation requires assumptions and should not be applied mechanically.
Kuder-Richardson Formula 21 FAQs
Clear answers to the questions most often asked about the formula, assumptions, software, and negative values.
What is Kuder-Richardson Formula 21?
Kuder-Richardson Formula 21 is a simplified internal-consistency reliability estimate for binary items. It uses the item count, mean total score, and total-score variance and assumes that item difficulties are approximately equal.
What is the KR-21 formula?
Kuder-Richardson Formula 21 = k/(k-1) × [1 – M(k-M)/(k s²X)], where k is the number of binary items, M is the mean total score, and s²X is the total-score variance.
When should Kuder-Richardson Formula 21 be used?
Use it for a coherent 0/1 test when item difficulties are reasonably similar, especially when only summary score information is available. When item-level data exist, KR-20 is generally preferable.
What does a negative KR-21 mean?
It means the equal-difficulty variance term exceeds the observed total-score variance. The result is diagnostic evidence of assumption failure, scoring problems, weak common covariance, or restricted score variation; it is not meaningful negative reliability.
Why is KR-21 negative in this example?
The six item proportions range from 0.0601 to 0.8937, so the equal-difficulty assumption is strongly violated. Kuder-Richardson Formula 21 substitutes 1.49905 for the actual item-variance sum of 0.91079, pushing the coefficient to -0.42507.
What is the difference between Kuder-Richardson Formula 20 and 21?
KR-20 uses each item’s observed p and q values. Kuder-Richardson Formula 21 replaces them with one common value derived from the test mean. KR-21 is simpler but usually lower and less accurate when item difficulties differ.
Is KR-21 the same as Cronbach’s alpha?
Not exactly. For binary items, Cronbach’s alpha is equivalent to KR-20 when calculated from the same data. Kuder-Richardson Formula 21 is a further equal-difficulty approximation and can differ substantially.
Can Kuder-Richardson Formula 21 be calculated in Excel?
Yes. Calculate each row total, then the mean and sample variance of those totals, and apply the Kuder-Richardson Formula 21 formula using the number of items. The downloadable workbook performs every step.
Can KR-21 be calculated in SPSS?
SPSS does not ordinarily present a dedicated Kuder-Richardson Formula 21 table. It can provide the total-score mean and variance and an alpha/KR-20 comparison, while KR-21 is calculated from the explicit formula.
Can KR-21 be calculated in Python and R?
Yes. Both languages can sum the binary item rows, compute the mean and sample variance, and apply the formula. The verified Python and R results in this example are identical.
What value of KR-21 is acceptable?
There is no universal cutoff. Interpretation depends on score purpose, consequences, test length, construct breadth, and population. The assumptions must be credible before any cutoff is considered.
Does KR-21 require normally distributed data?
No. The items are binary. However, the total-score distribution and variance still matter because restricted score spread lowers the coefficient.
Does KR-21 provide a p-value?
No. KR-21 is a reliability estimate, not an ordinary hypothesis test. A p-value is not part of the standard formula.
How many items are needed for KR-21?
The formula can be computed with more than one item, but very short tests often have unstable or low reliability. Item quality and coherence matter more than a mechanical minimum.
Should a negative KR-21 be changed to zero?
Do not silently replace it. Report the calculated value, explain why it is not interpreted as ordinary reliability, diagnose the cause, and provide a more appropriate estimate such as KR-20 when possible.
What did the worked example show?
For 649 cases and six binary indicators, the mean total score was 2.9245, variance was 1.1069, and KR-21 was -0.4251. KR-20 was about 0.2126 and SPSS alpha was 0.211, indicating weak internal consistency.
Related statistical guides
Continue with reliability, item analysis, and descriptive-statistics guides connected to KR-21.