
Ordinal association, rectangular contingency tables, concordant pairs and nonparametric reporting
Kendall’s Tau-c: Formula, Interpretation, Python, R and Excel Guide
Kendall’s Tau-c, also called Stuart-Kendall Tau-c, is a nonparametric ordinal association measure designed for ordered contingency tables, especially when the table is not square or when the number of categories differs between the two variables. In this guide, the primary worked example is studytime by G3 final grade. You will learn the formula, the contingency-table logic, concordant pairs, discordant pairs, Python chart interpretation, R validation charts, Excel formulas, assumptions, reporting wording and common mistakes.
Quick Answer: Kendall’s Tau-c Result
The primary ordinal pair in this report is studytime by G3. Studytime has 4 ordered levels, while G3 has 17 observed grade levels. Because the table is rectangular and ordinal, Kendall’s Tau-c is useful for summarizing the direction and strength of association between the two ordered variables.
The primary result is Kendall’s Tau-c = 0.225039, based on N = 649 students. The calculation uses 79,088 concordant pairs and 43,543 discordant pairs. The approximate p-value is 2.51457e-12, so the association is statistically significant at α = .05.
Final interpretation: Studytime and G3 show a statistically significant positive ordinal association. Students in higher studytime categories tend to appear somewhat more often in higher G3 final-grade categories. The effect is positive but not very large, so the correct wording is a weak positive ordinal association, not a strong relationship.
Important reporting point: The strongest overall pair in the full matrix is G2 by G3, with Tau-c = 0.831026. However, the primary worked example for this post remains studytime by G3, because it demonstrates the ordinal rectangular-table logic of Kendall’s Tau-c.
Table of Contents
- What Is Kendall’s Tau-c?
- When Should You Use Kendall’s Tau-c?
- Kendall’s Tau-b vs Kendall’s Tau-c
- Kendall’s Tau-c Formula
- Null and Alternative Hypotheses
- Dataset and Variables Used
- Primary Contingency Table: Studytime by G3
- Verified Kendall’s Tau-c Results
- Python Chart-by-Chart Interpretation
- R Chart-by-Chart Interpretation
- Excel Worked File Explanation
- Python, R and Excel Workflows
- Code Blocks and Excel Formulas
- Assumptions and Data Checks
- How to Report Kendall’s Tau-c
- Common Mistakes
- Downloads and Resources
- Related Statistical Guides
- FAQs About Kendall’s Tau-c
What Is Kendall’s Tau-c?
Kendall’s Tau-c is an ordinal association coefficient used when both variables can be arranged from low to high. It is especially useful for contingency tables where the number of categories differs between the two variables. In this post, studytime has four ordered categories and G3 has seventeen observed final-grade categories, so the table is clearly rectangular. Kendall’s Tau-c is designed to handle this kind of ordered table more directly than a simple two-variable linear correlation.
The logic behind Tau-c is based on comparing pairs of observations. If one student has a higher studytime category and also a higher G3 category than another student, that pair is concordant. If one student has a higher studytime category but a lower G3 category, that pair is discordant. Tau-c summarizes whether concordant ordering is more common than discordant ordering after adjusting for the smaller number of categories in the table.
A positive Tau-c means that higher categories of the first variable tend to occur with higher categories of the second variable. A negative Tau-c means higher categories of one variable tend to occur with lower categories of the other variable. A Tau-c value near zero means little ordered association.
Kendall’s Tau-c is related to Correlation in Python, Correlation in R, Correlation in Excel, Correlation Matrix, Correlation Assumptions, Cross Tabulation, Effect Size, p-value and Parametric vs Nonparametric Tests.
Simple definition: Kendall’s Tau-c measures the direction and strength of ordinal association in a contingency table, especially when the table is rectangular or has unequal numbers of row and column categories.
When Should You Use Kendall’s Tau-c?
Use Kendall’s Tau-c when your variables are ordered categories and you want a single effect-size coefficient for the ordinal association. It is useful when both variables have meaningful order but are not necessarily continuous in the Pearson correlation sense. It is also helpful when the table is rectangular, because Tau-c contains an adjustment for the smaller number of row or column categories.
| Situation | Use Kendall’s Tau-c? | Reason |
|---|---|---|
| Both variables are ordinal and ordered from low to high | Yes | Tau-c is designed for ordered association. |
| The contingency table is rectangular | Yes | Tau-c adjusts for the smaller number of categories. |
| One variable has 4 categories and the other has many ordered categories | Yes | This is the exact situation in studytime by G3. |
| Both variables are continuous and normally distributed | Usually no | Pearson correlation may be more direct if linear assumptions are satisfied. |
| The variables are nominal with no order | No | Use a nominal association measure such as Cramer’s V instead. |
| The goal is prediction rather than ordinal association | Not by itself | Use regression or classification methods if prediction is the main goal. |
For the student performance example, studytime is naturally ordered because categories represent increasing study duration. G3 is also ordered because a higher final grade indicates a higher performance level. Therefore, the coefficient has a meaningful direction: positive values indicate that higher studytime levels tend to align with higher final-grade categories.
Kendall’s Tau-b vs Kendall’s Tau-c
Kendall’s Tau-b and Kendall’s Tau-c are both ordinal association measures, but they are not identical. Tau-b is often used when ties are important in a square or nearly square ordinal setting. Tau-c is especially useful for rectangular contingency tables where the number of row categories and column categories differ.
| Measure | Best Use | Denominator Logic | Example |
|---|---|---|---|
| Kendall’s Tau-a | Ordered data with no ties | Uses total possible pairs without tie correction | Unique ranks from 1 to n |
| Kendall’s Tau-b | Ordered data with ties | Corrects for ties in X and Y | G2 by G3 with repeated grade values |
| Kendall’s Tau-c | Rectangular ordinal contingency tables | Adjusts using the smaller number of categories | studytime by G3, where studytime has 4 levels and G3 has 17 observed levels |
| Spearman correlation | Rank-transformed monotonic association | Pearson correlation applied to ranks | Checking monotonic relationship with ranked scores |
Practical choice: Use Tau-b when ties are the main concern and both variables are treated as paired ranks. Use Tau-c when the data are summarized as an ordinal contingency table and the table has unequal row and column category counts.
Kendall’s Tau-c Formula
The Kendall’s Tau-c formula used in the Python, R and Excel reports is:
In this formula, C is the number of concordant pairs, D is the number of discordant pairs, n is the total number of observations, and m is the smaller number of row or column categories. The value of m matters because Tau-c adjusts the maximum possible association for rectangular tables.
| Formula Element | Meaning | Primary studytime by G3 Value |
|---|---|---|
| C | Concordant pairs | 79,088 |
| D | Discordant pairs | 43,543 |
| C − D | Net ordered advantage of concordance over discordance | 35,545 |
| n | Total valid observations | 649 |
| Row levels | Number of studytime categories | 4 |
| Column levels | Number of observed G3 categories | 17 |
| m | Smaller number of row or column categories | 4 |
| τc | Kendall’s Tau-c coefficient | 0.225039 |
The positive value comes from the fact that concordant pairs outnumber discordant pairs. However, the coefficient is not close to 1, so the relationship is not strong. It is best interpreted as a statistically significant weak positive ordinal association.
Null and Alternative Hypotheses
The hypothesis test asks whether the ordinal association is zero in the population. Although Tau-c itself is an ordinal effect-size coefficient, the report uses an approximate Kendall rank-test p-value as significance context.
| Statement | Hypothesis | Meaning |
|---|---|---|
| Null hypothesis | H0: τc = 0 | There is no ordinal association between studytime and G3. |
| Alternative hypothesis | H1: τc ≠ 0 | There is an ordinal association between studytime and G3. |
| Direction in this example | τc > 0 | Higher studytime tends to align with higher final grades. |
| Decision rule | Reject H0 if p < .05 | The association is statistically significant. |
Decision: Since the approximate p-value is 2.51457e-12, the result is statistically significant. The null hypothesis of no ordinal association is rejected.
Dataset and Variables Used
The analysis used the student performance dataset with 649 valid cases. The main pair was studytime by G3. The full matrix also included age, Medu, Fedu, traveltime, studytime, failures, famrel, freetime, goout, Dalc, Walc, health, absences, G1, G2 and G3.
| Variable | Valid N | Levels | Minimum | Maximum | Role in Analysis |
|---|---|---|---|---|---|
| age | 649 | 8 | 15 | 22 | Pairwise Tau-c variable |
| Medu | 649 | 5 | 0 | 4 | Mother education ordinal variable |
| Fedu | 649 | 5 | 0 | 4 | Father education ordinal variable |
| traveltime | 649 | 4 | 1 | 4 | Travel-time ordinal variable |
| studytime | 649 | 4 | 1 | 4 | Primary X variable |
| failures | 649 | 4 | 0 | 3 | Academic risk variable |
| famrel | 649 | 5 | 1 | 5 | Family relationship ordinal variable |
| freetime | 649 | 5 | 1 | 5 | Free-time ordinal variable |
| goout | 649 | 5 | 1 | 5 | Going-out ordinal variable |
| Dalc | 649 | 5 | 1 | 5 | Weekday alcohol ordinal variable |
| Walc | 649 | 5 | 1 | 5 | Weekend alcohol ordinal variable |
| health | 649 | 5 | 1 | 5 | Health ordinal variable |
| absences | 649 | 24 | 0 | 32 | Count-like numeric variable |
| G1 | 649 | 17 | 0 | 19 | First-period grade |
| G2 | 649 | 16 | 0 | 19 | Second-period grade |
| G3 | 649 | 17 | 0 | 19 | Primary Y variable / final grade |
This dataset is useful for Tau-c because it contains a mixture of ordinal variables, grade variables, repeated values and rectangular tables. It also shows the difference between a modest ordinal relationship such as studytime by G3 and a very strong relationship such as G2 by G3.
Primary Contingency Table: Studytime by G3
The primary contingency table counts students by studytime category and final grade category. Studytime has four ordered levels, while G3 has seventeen observed ordered values. This makes the table rectangular, which is one reason Tau-c is appropriate.
| studytime \ G3 | 0 | 1 | 5 | 6 | 7 | 8 | 9 | 10 | 11 | 12 | 13 | 14 | 15 | 16 | 17 | 18 | 19 | Row total |
|---|---|---|---|---|---|---|---|---|---|---|---|---|---|---|---|---|---|---|
| 1 | 8 | 0 | 1 | 2 | 7 | 12 | 20 | 41 | 42 | 22 | 20 | 15 | 9 | 6 | 6 | 1 | 0 | 212 |
| 2 | 7 | 1 | 0 | 0 | 3 | 18 | 12 | 43 | 48 | 34 | 40 | 32 | 23 | 23 | 12 | 8 | 1 | 305 |
| 3 | 0 | 0 | 0 | 0 | 0 | 5 | 2 | 8 | 9 | 11 | 17 | 13 | 15 | 6 | 8 | 3 | 0 | 97 |
| 4 | 0 | 0 | 0 | 1 | 0 | 0 | 1 | 5 | 5 | 5 | 5 | 3 | 2 | 1 | 3 | 3 | 1 | 35 |
| Column total | 15 | 1 | 1 | 3 | 10 | 35 | 35 | 97 | 104 | 72 | 82 | 63 | 49 | 36 | 29 | 15 | 2 | 649 |
The table shows that studytime level 2 contains the largest group of students, followed by studytime level 1. Higher studytime levels have fewer students, so visual interpretation should be cautious. The positive Tau-c does not mean every higher-studytime student earned a higher final grade. It means that, across all ordered pairs, the higher-studytime/higher-grade ordering occurs more often than the higher-studytime/lower-grade ordering.
Verified Kendall’s Tau-c Results
The primary pair and the strongest matrix relationships are shown below. The primary pair explains the method, while the top-pair table shows where the strongest ordinal relationships appear in the full dataset.
| Rank | Variable 1 | Variable 2 | N | Row Levels | Column Levels | m | Concordant C | Discordant D | Kendall’s Tau-c | Approx. p-value | Direction | Strength |
|---|---|---|---|---|---|---|---|---|---|---|---|---|
| Primary | studytime | G3 | 649 | 4 | 17 | 4 | 79,088 | 43,543 | 0.225039 | 2.51457e-12 | Positive | Weak |
| 1 | G2 | G3 | 649 | 16 | 17 | 16 | 169,536 | 5,460 | 0.831026 | 2.113285e-199 | Positive | Very strong |
| 2 | G1 | G2 | 649 | 17 | 16 | 16 | 159,879 | 12,549 | 0.746209 | 4.403489e-161 | Positive | Very strong |
| 3 | G1 | G3 | 649 | 17 | 17 | 17 | 158,466 | 13,791 | 0.729899 | 2.108694e-155 | Positive | Very strong |
| 4 | Medu | Fedu | 649 | 5 | 5 | 5 | 107,233 | 17,491 | 0.532655 | 5.622318e-68 | Positive | Strong |
| 5 | Dalc | Walc | 649 | 5 | 5 | 5 | 78,377 | 8,691 | 0.413615 | 4.096093e-59 | Positive | Moderate |
| 6 | goout | Walc | 649 | 5 | 5 | 5 | 86,114 | 35,927 | 0.297880 | 1.732229e-22 | Positive | Weak |
| 7 | freetime | goout | 649 | 5 | 5 | 5 | 84,446 | 36,422 | 0.285042 | 6.841912e-21 | Positive | Weak |
| 8 | failures | G3 | 649 | 4 | 17 | 4 | 6,573 | 45,952 | -0.249312 | 2.182742e-30 | Negative | Weak |
| 9 | failures | G2 | 649 | 4 | 16 | 4 | 7,163 | 45,389 | -0.242013 | 9.916502e-29 | Negative | Weak |
| 10 | failures | G1 | 649 | 4 | 17 | 4 | 7,368 | 45,395 | -0.240753 | 1.963360e-28 | Negative | Weak |
The strongest positive associations are among G1, G2 and G3. This is expected because grade variables measure related academic performance across time. The failures variable shows the most meaningful negative grade relationships, meaning higher failure counts tend to align with lower grade categories.
Python Chart-by-Chart Interpretation
The Python report includes five charts: Tau-c heatmap, primary contingency heatmap, top Tau-c relationships, p-value context and the ordinal pattern for the primary pair. These charts are designed to explain both the full matrix and the worked studytime by G3 example.
Python Chart 1: Kendall’s Tau-c Heatmap
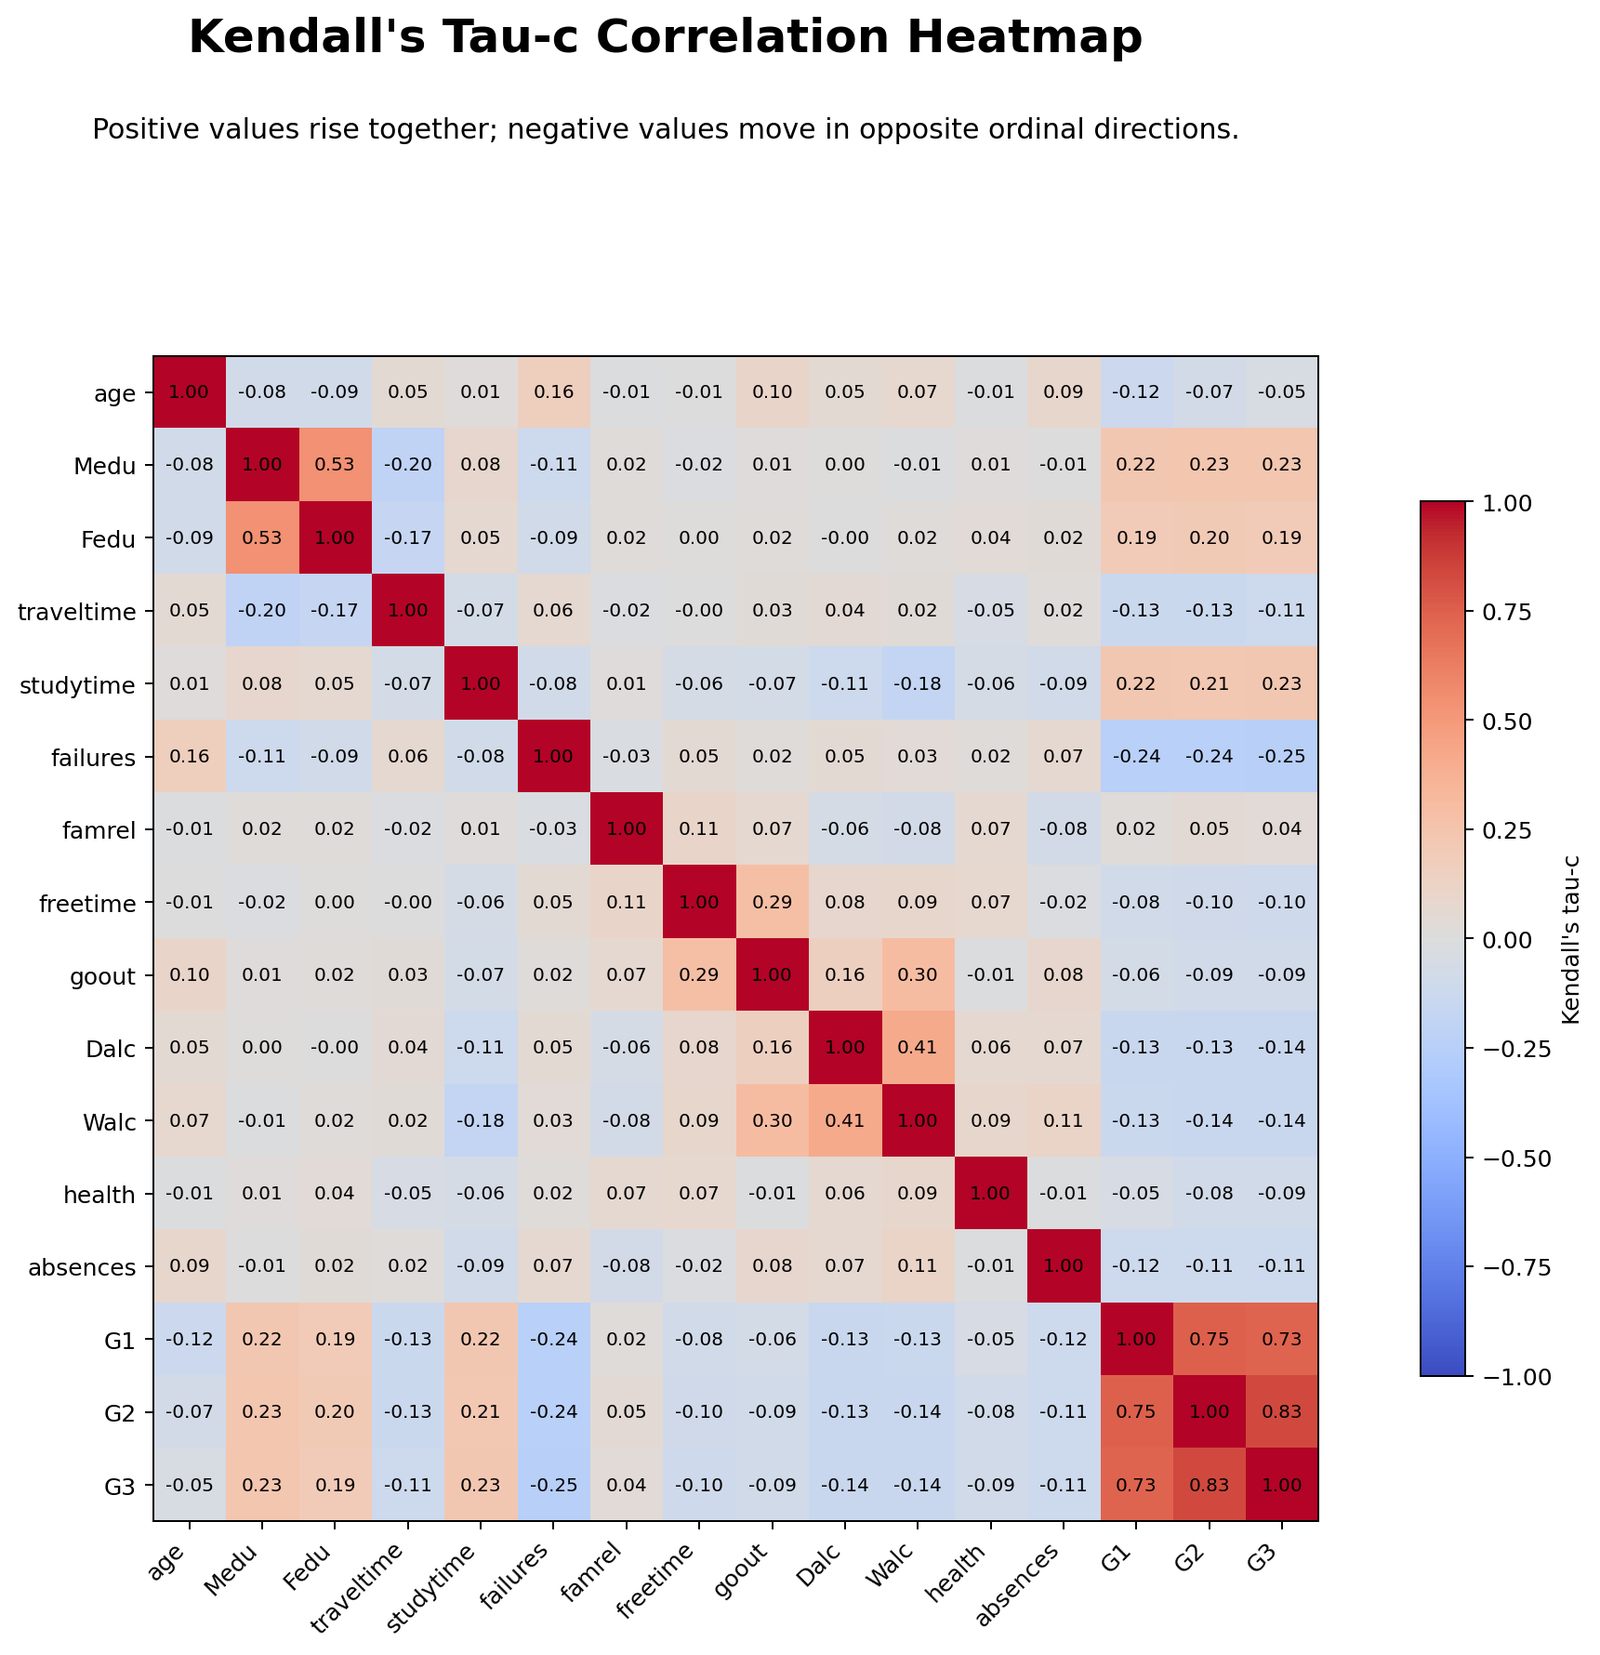
The Tau-c heatmap summarizes the direction and strength of ordinal association across the full variable set. Positive values show that higher categories of one variable tend to align with higher categories of another variable. Negative values show that higher categories of one variable tend to align with lower categories of another variable.
The strongest positive block is among G1, G2 and G3. These grade variables have very high positive associations because students who rank higher in one grade period usually rank higher in another. The heatmap also shows negative grade relationships for failures, indicating that students with more past failures tend to be ordered lower on grade outcomes.
For interpretation, this chart should not be read as a prediction model. It is an association map. It tells which ordered variables move together, which move in opposite directions and which relationships are weak or near zero.
Python Chart 2: Primary Contingency Heatmap
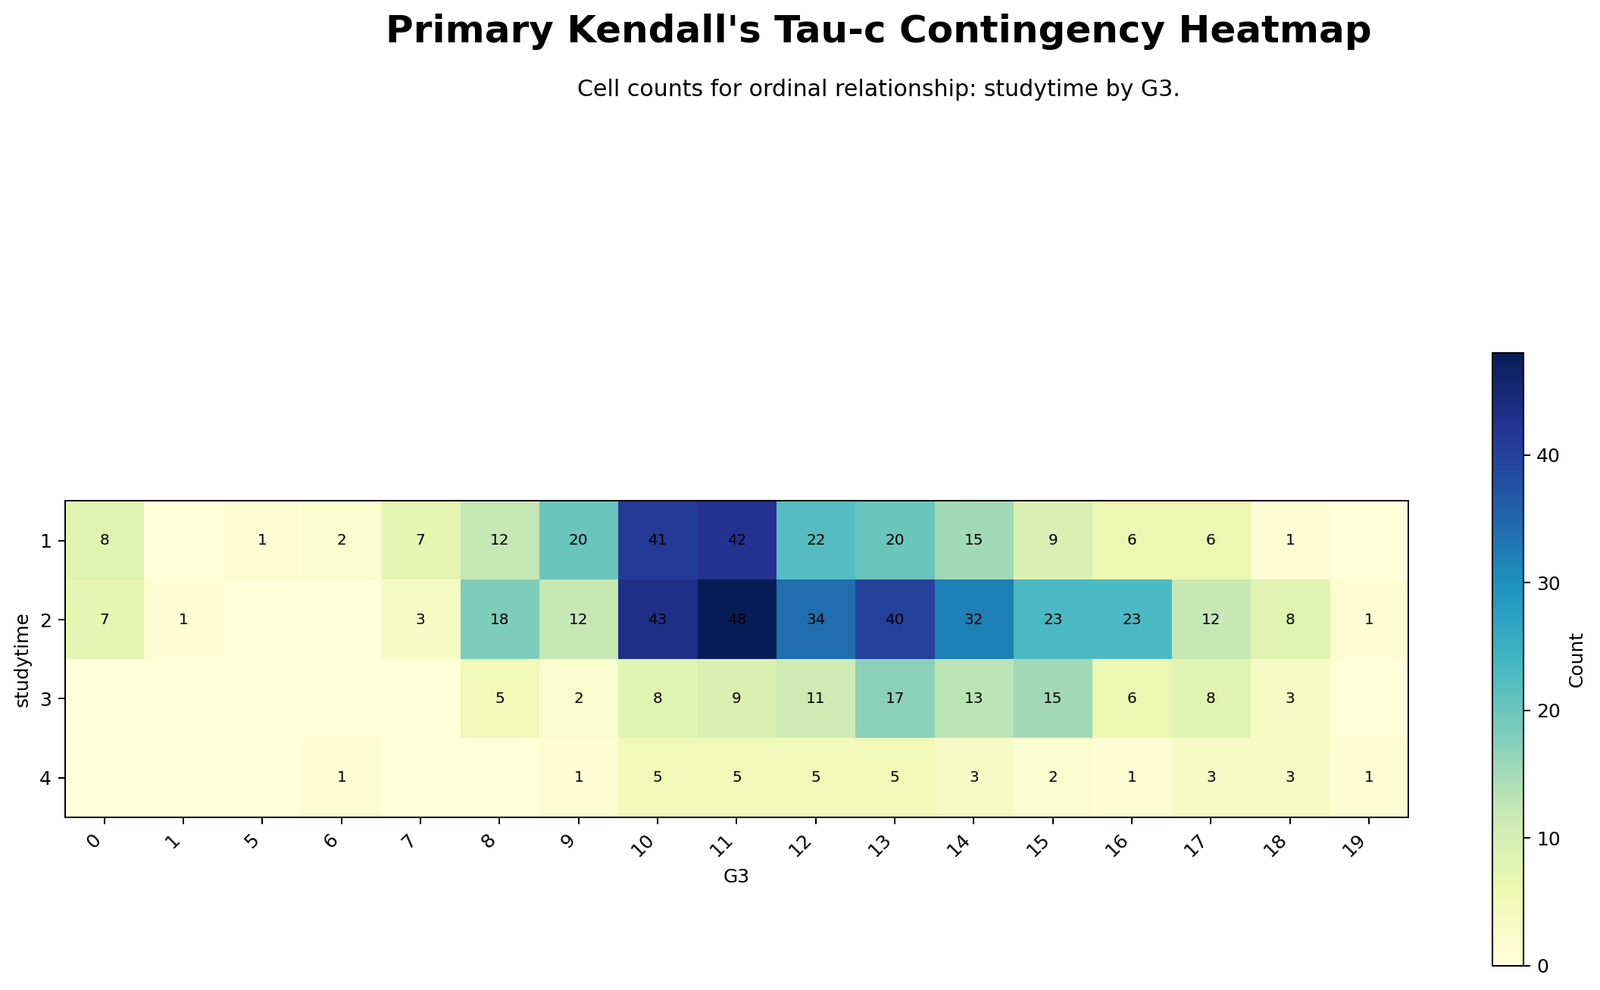
The primary contingency heatmap displays the cell counts for studytime by G3. Studytime levels appear on one axis and G3 final-grade categories appear on the other. Darker or more intense cells represent larger counts.
The table is not evenly distributed. Most students fall in studytime categories 1 and 2, while categories 3 and 4 contain fewer observations. This matters because a positive association may be statistically significant but still modest if the higher studytime categories are small and the grade distributions overlap.
The heatmap supports the final conclusion: the relationship is positive but weak. Higher studytime categories show some tendency toward higher G3 values, but the pattern is not strong enough to call the association large.
Python Chart 3: Top Tau-c Relationships
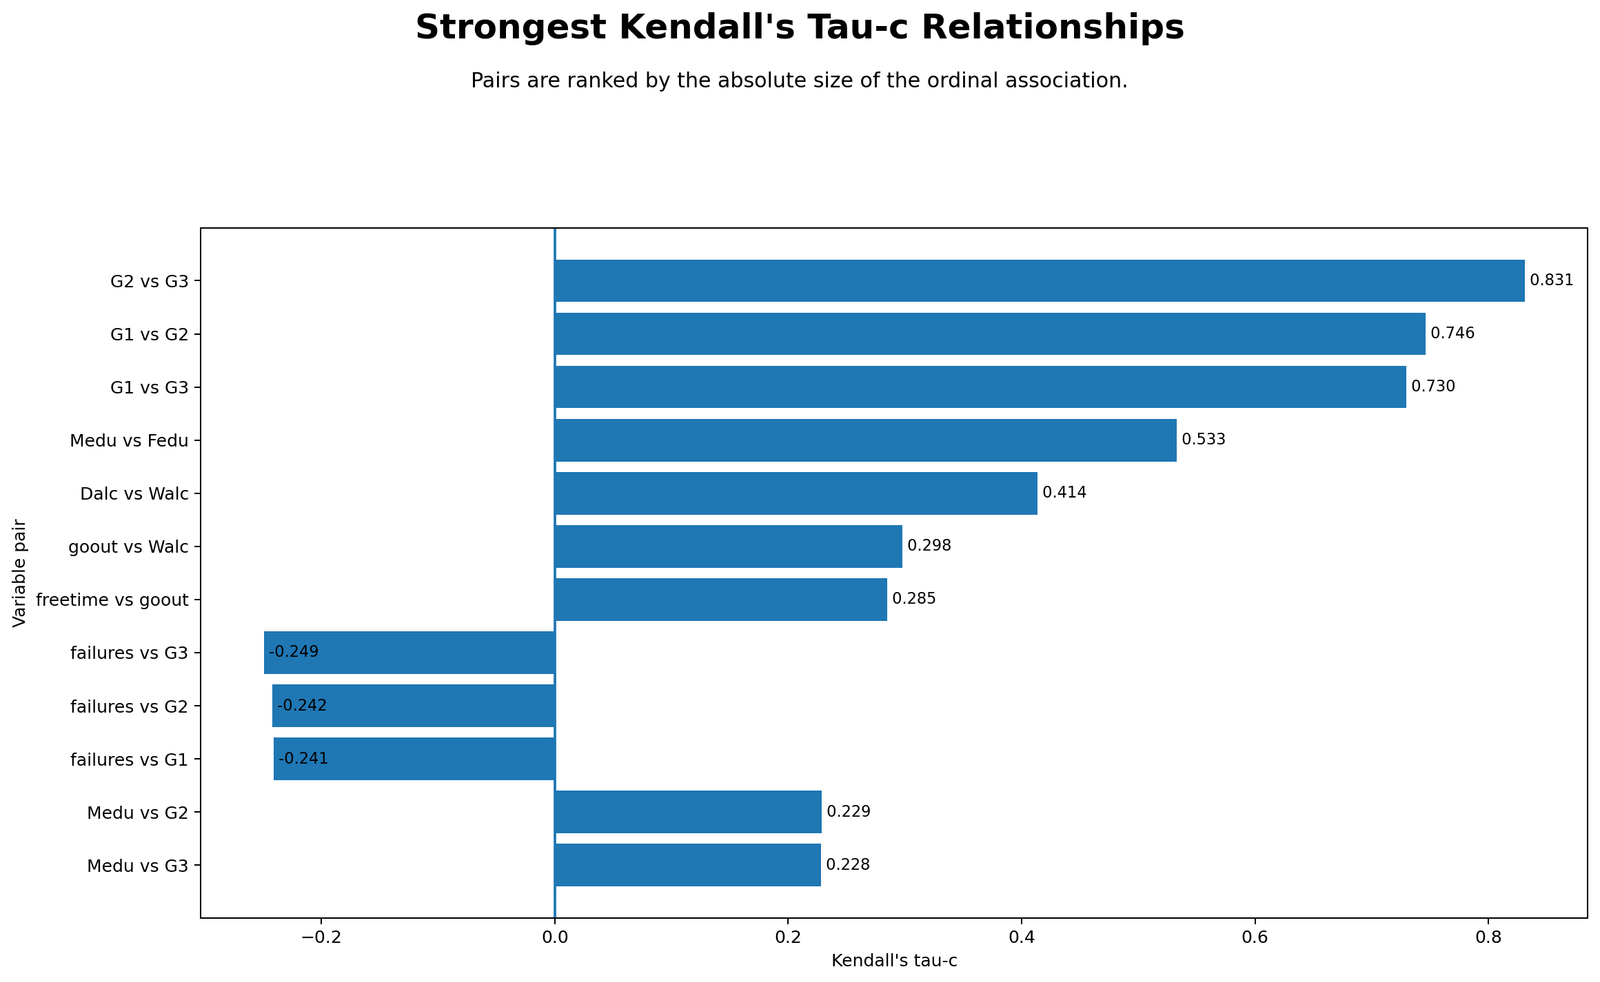
The top-relationships chart ranks pairs by absolute Tau-c value. The strongest overall pair is G2 by G3, followed by G1 by G2 and G1 by G3. These are very strong positive ordinal associations.
The chart also shows that Medu by Fedu is strong, meaning mother and father education levels tend to move together. Dalc by Walc is moderate, showing that weekday and weekend alcohol-use categories are positively ordered together.
The chart is important because it places the primary studytime by G3 result in context. Studytime by G3 is statistically significant, but it is not among the very strongest relationships in the full dataset. The strongest relationships are the grade-to-grade pairs.
Python Chart 4: Tau-c p-value Context
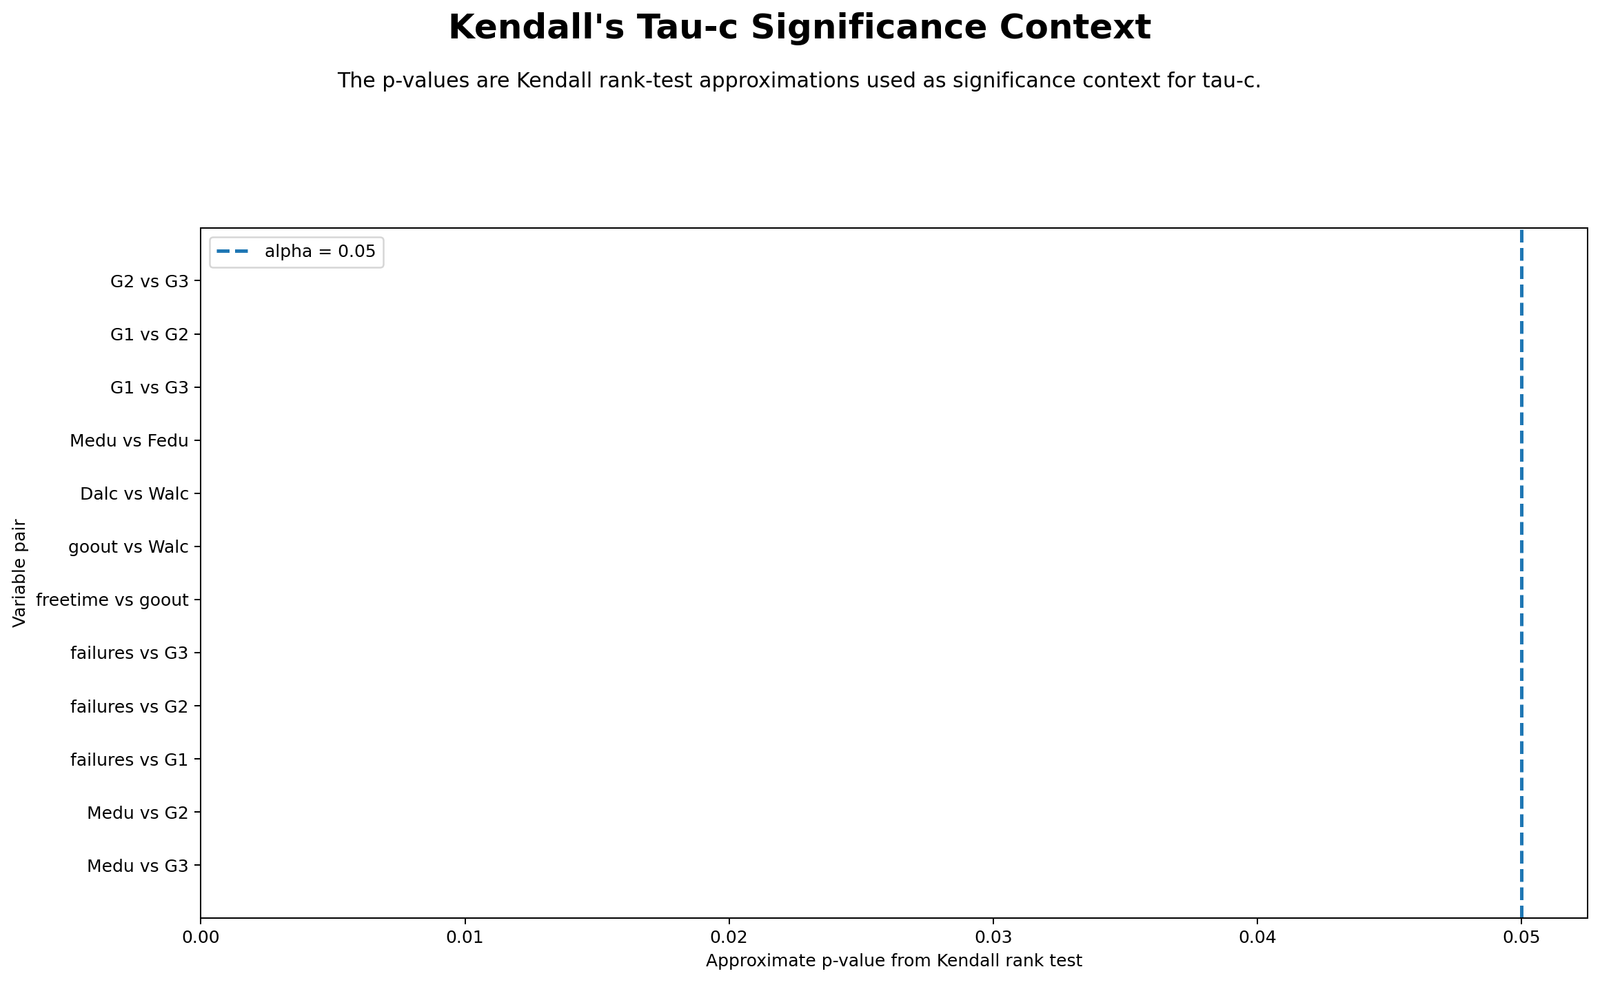
The p-value context chart shows the approximate statistical evidence for the top Tau-c relationships. The strongest grade relationships have extremely small p-values, but the studytime by G3 result is also statistically significant with p much smaller than .05.
This chart helps avoid a common mistake: confusing statistical significance with practical strength. A relationship can be statistically significant because the sample is large, even if the effect size is weak. Therefore, the primary result should be reported as statistically significant and weak positive, not as a strong association.
Python Chart 5: Primary Pair Ordinal Pattern
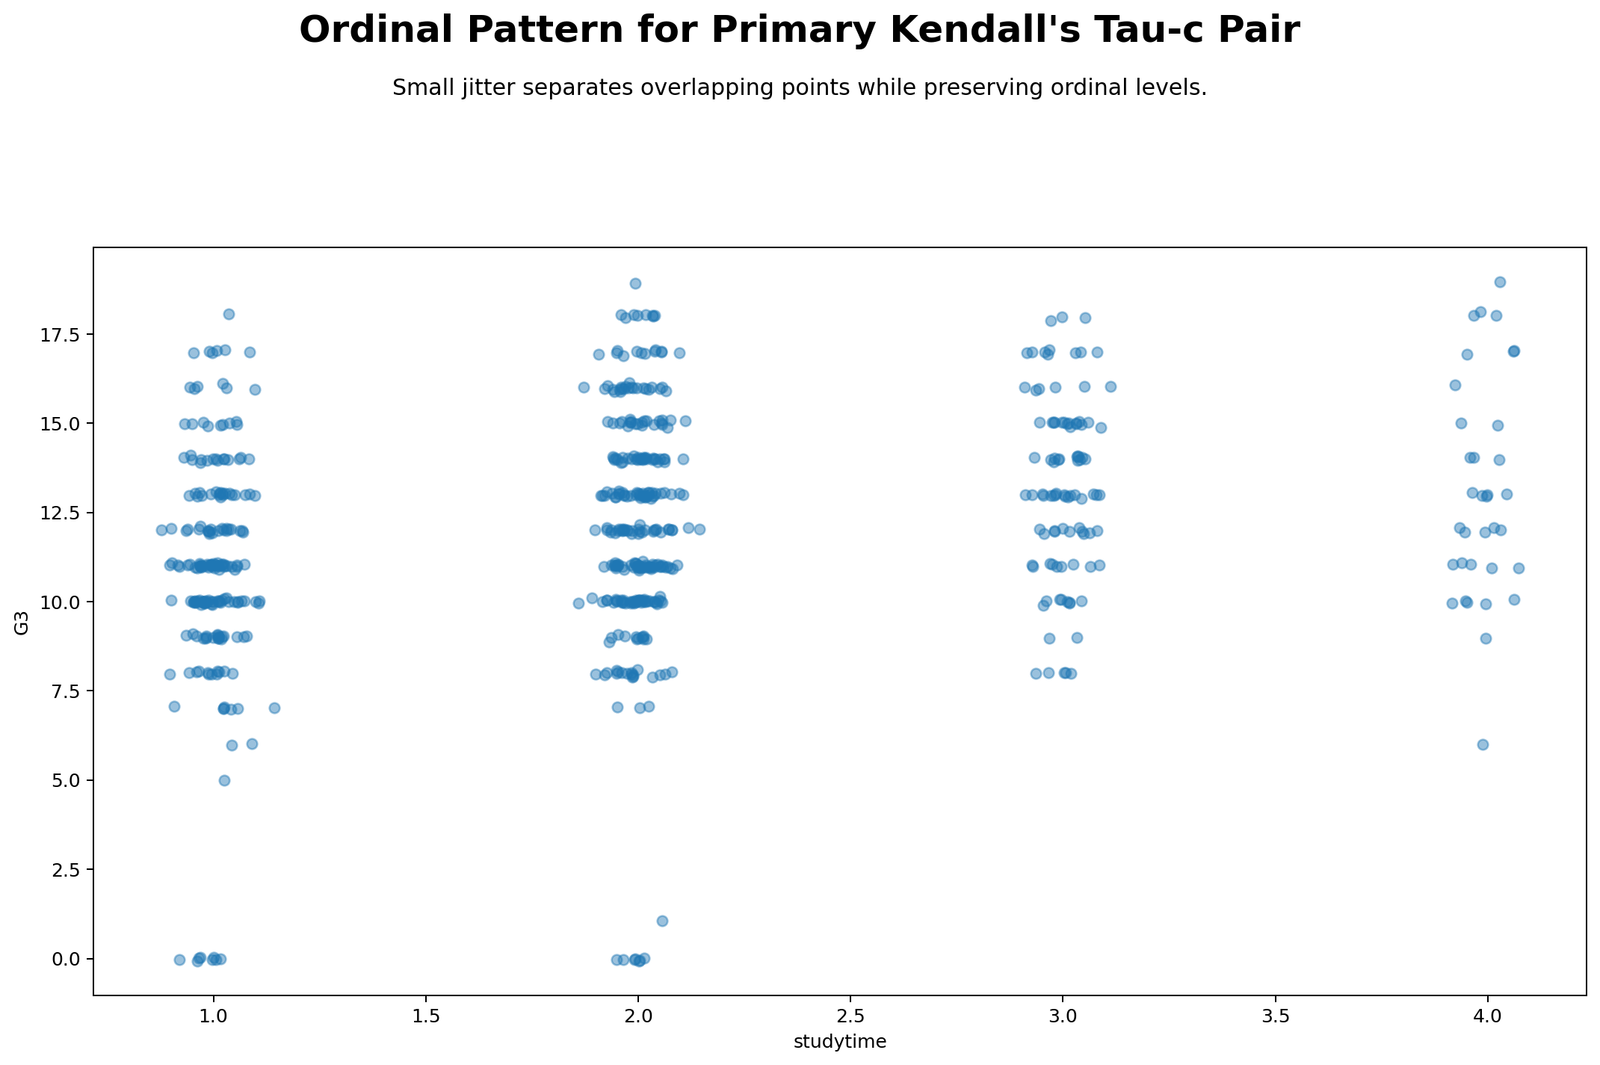
The ordinal pattern chart shows studytime categories against G3 final grades with small jitter so overlapping points are easier to see. The plot shows that higher studytime categories include many students with medium-to-high G3 scores, but there is still considerable overlap between studytime categories.
This overlap explains why the coefficient is only 0.225039. If studytime strongly separated G3 outcomes, the higher studytime categories would cluster almost entirely at higher G3 values. Instead, students across studytime categories still share many similar grades.
The correct visual interpretation is that there is a positive tendency, not a deterministic pattern. Studytime is associated with G3 in the expected direction, but other factors clearly also influence final grades.
R Chart-by-Chart Interpretation
The R report validates the Python output using a separate workflow and colorful charts. It confirms the same primary pair, the same Tau-c formula, the same top relationships and the same interpretation pattern.
R Chart 1: Colorful Kendall’s Tau-c Heatmap
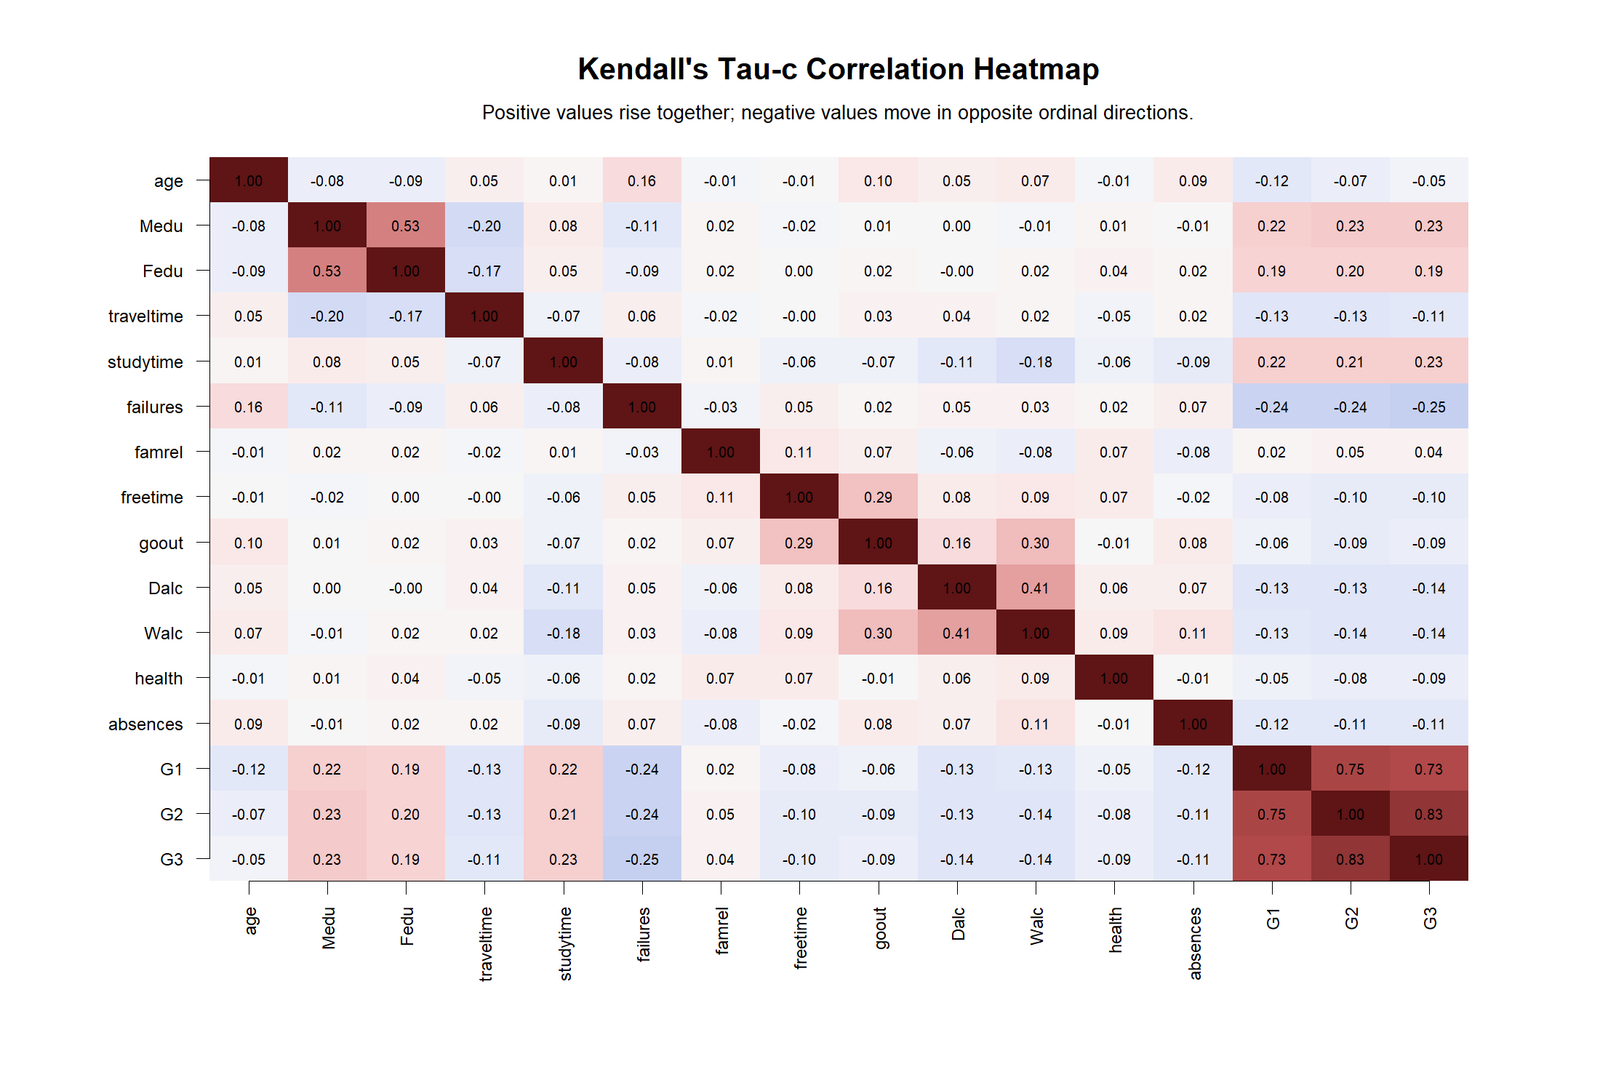
The R heatmap confirms the same matrix pattern as Python. The grade variables form the strongest positive block, and failures has negative associations with the grade variables. This software-to-software agreement strengthens confidence in the result.
The heatmap also helps students understand that Tau-c is not restricted to one pair. A full matrix can reveal which ordinal relationships are strongest, which are weak and which move in opposite directions.
R Chart 2: Colorful Primary Contingency Heatmap
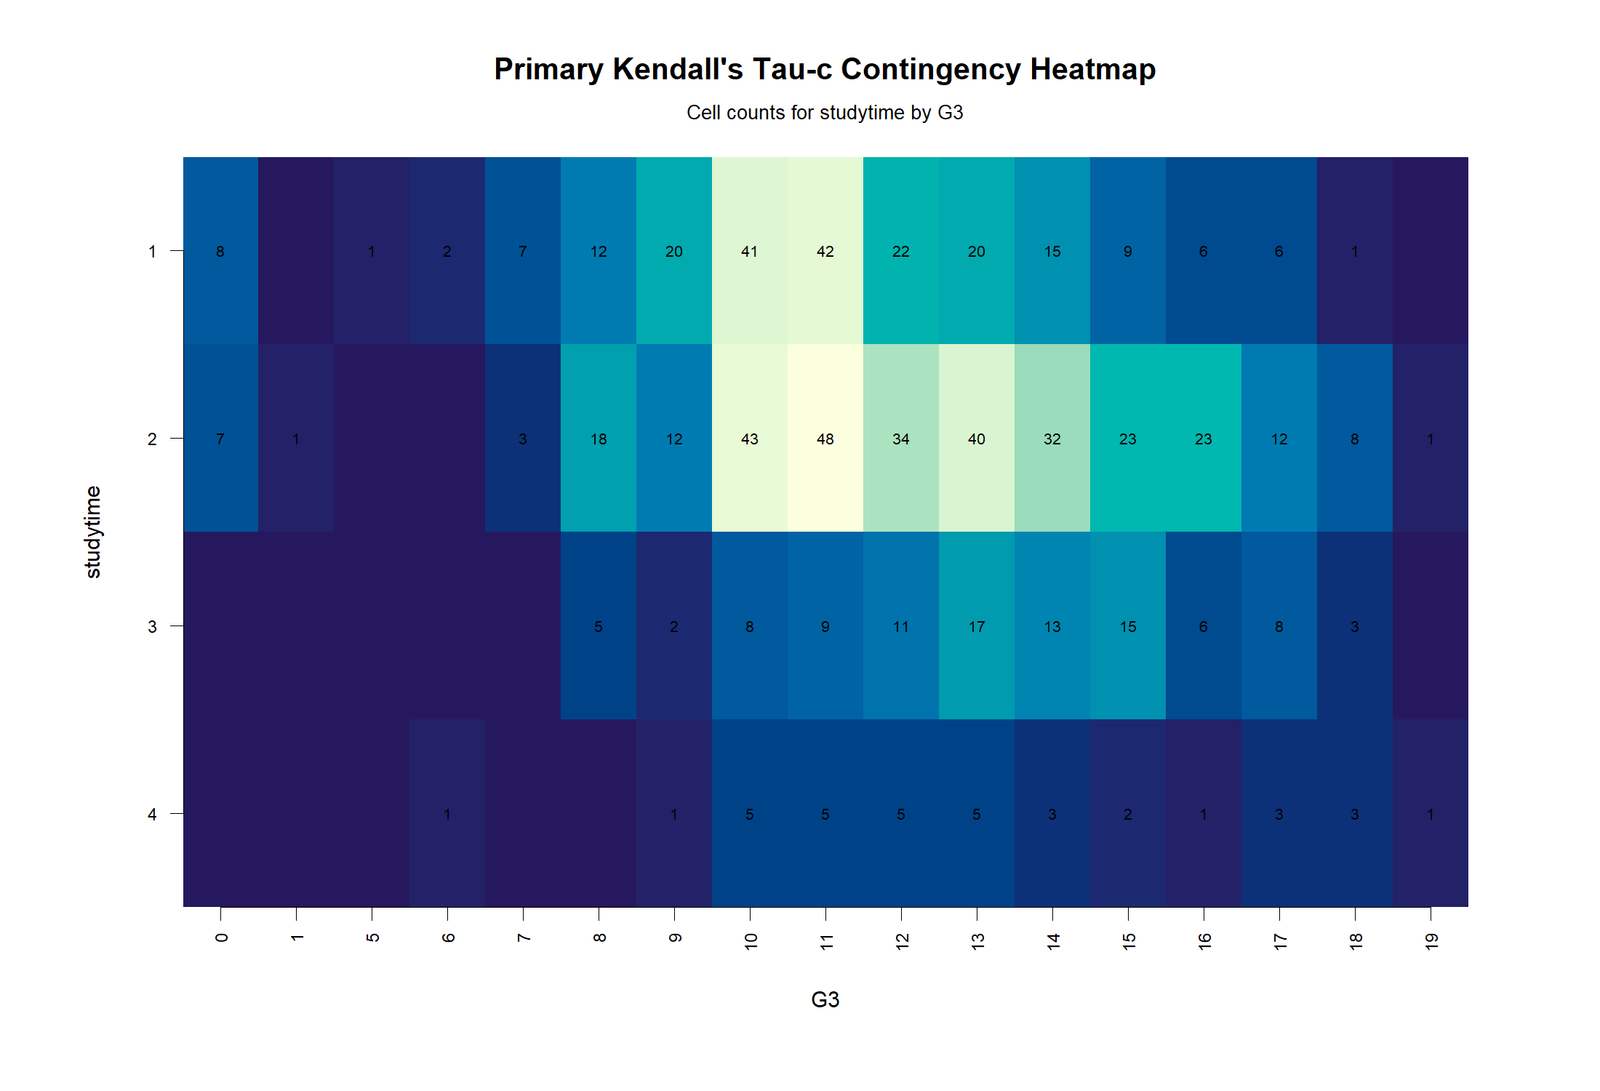
The R contingency heatmap displays the same studytime by G3 count table with a different color style. It confirms that most observations are concentrated in studytime levels 1 and 2, with fewer students in levels 3 and 4.
This chart is important because Tau-c is based on the contingency table, not only on a raw scatterplot. The distribution of counts across ordered cells determines the concordant and discordant pair totals.
R Chart 3: Colorful Top Tau-c Relationships
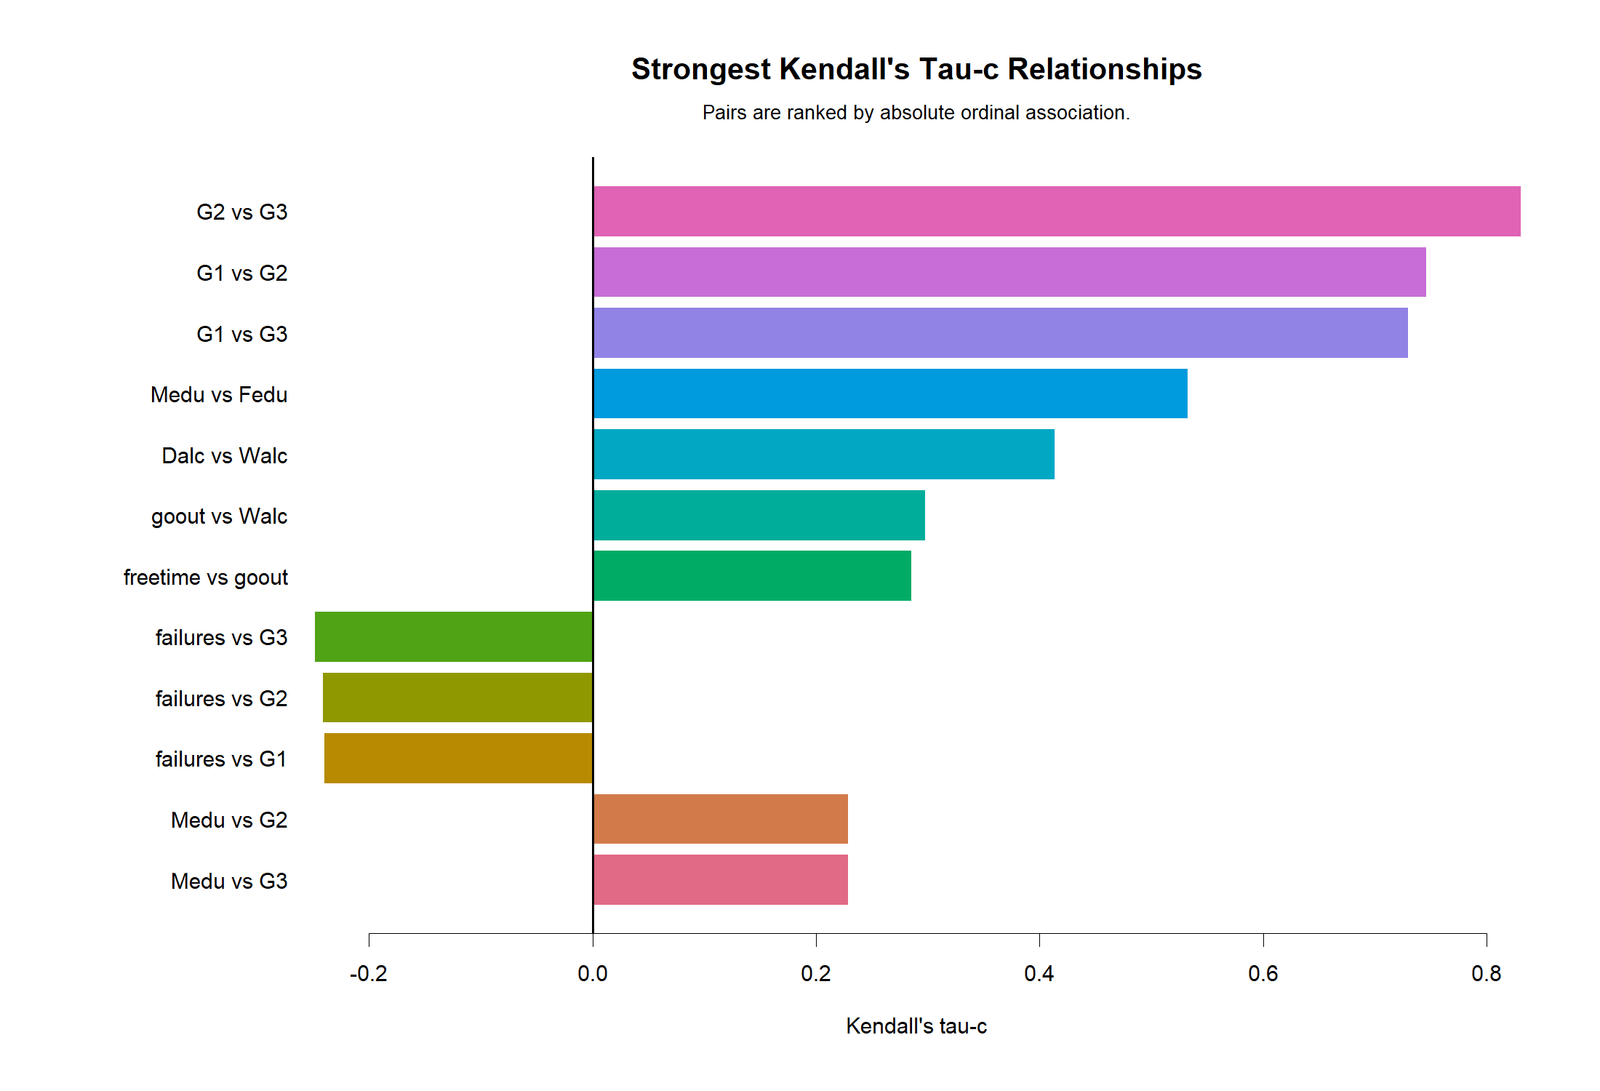
The R top-relationships chart confirms the strongest pairs: G2 by G3, G1 by G2 and G1 by G3. These grade relationships are much stronger than the primary studytime by G3 example.
This chart is useful for writing a balanced report. It allows the article to say that studytime by G3 is significant, while also showing that grade-to-grade consistency is the dominant association pattern in the dataset.
R Chart 4: Colorful Tau-c p-value Context
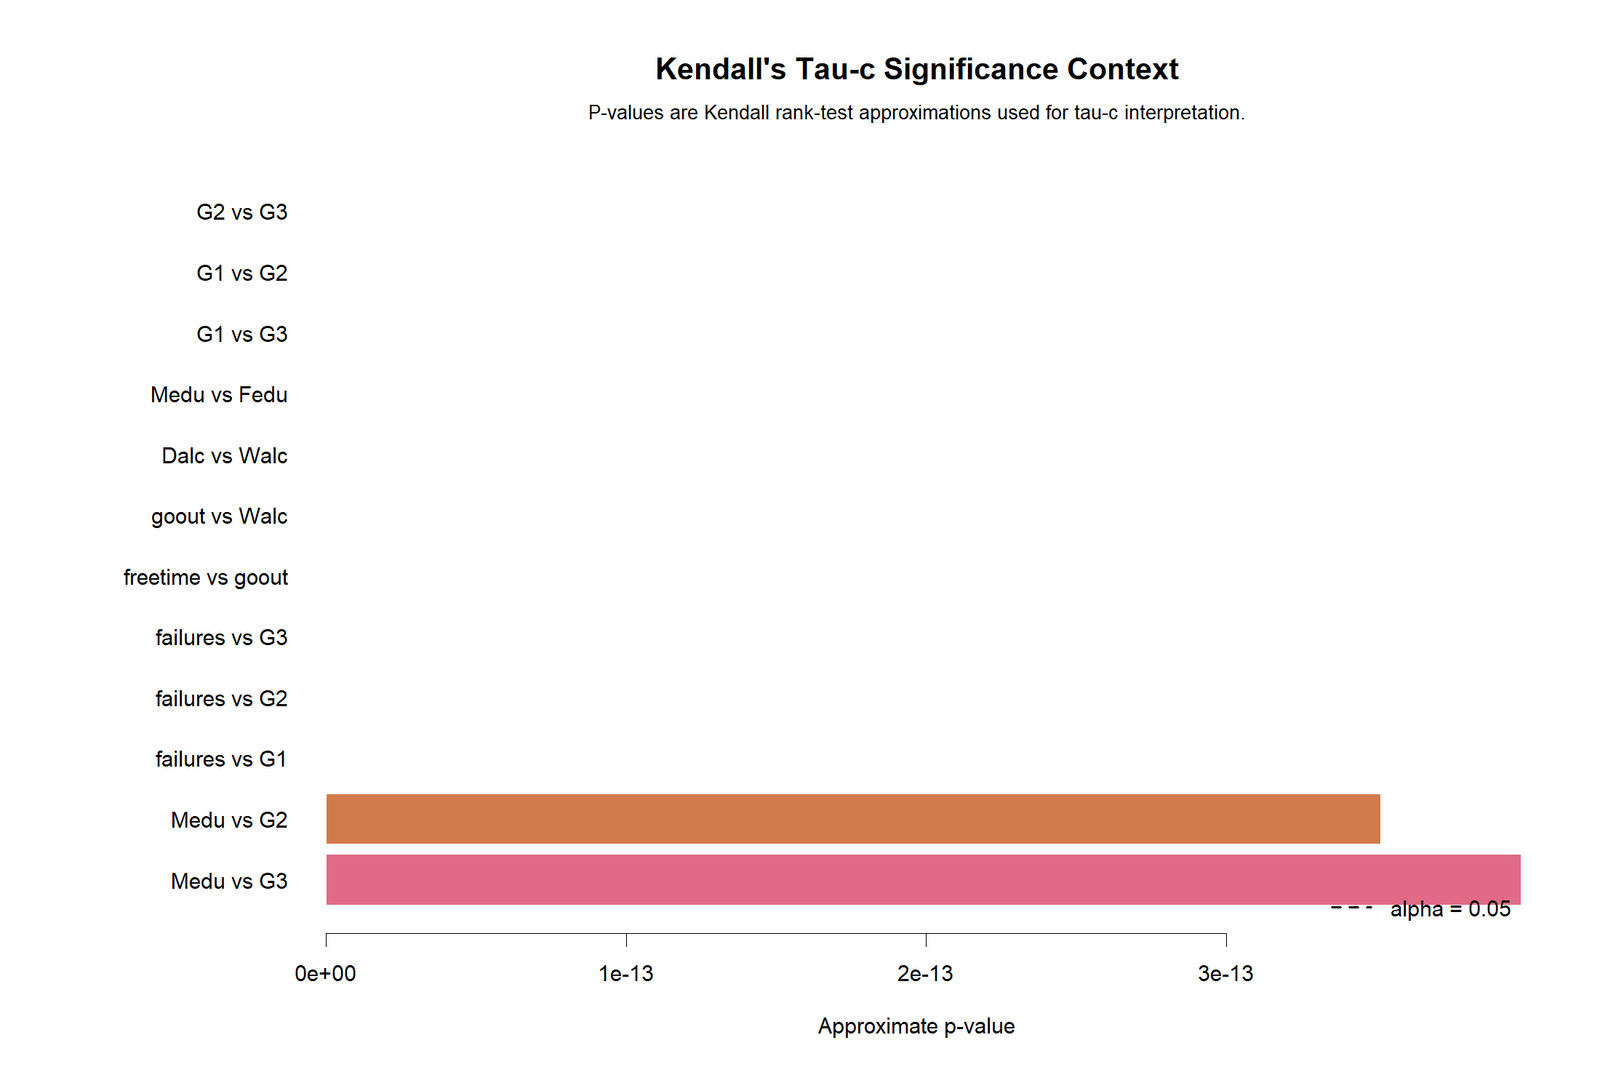
The R p-value context chart confirms that the top relationships are statistically significant. The grade-pair relationships have extremely small p-values, and the primary studytime by G3 pair is also significant.
However, this chart should not be used alone. A p-value does not measure strength. Always combine it with the Tau-c coefficient and the contingency table interpretation.
R Chart 5: Colorful Primary Pair Ordinal Pattern
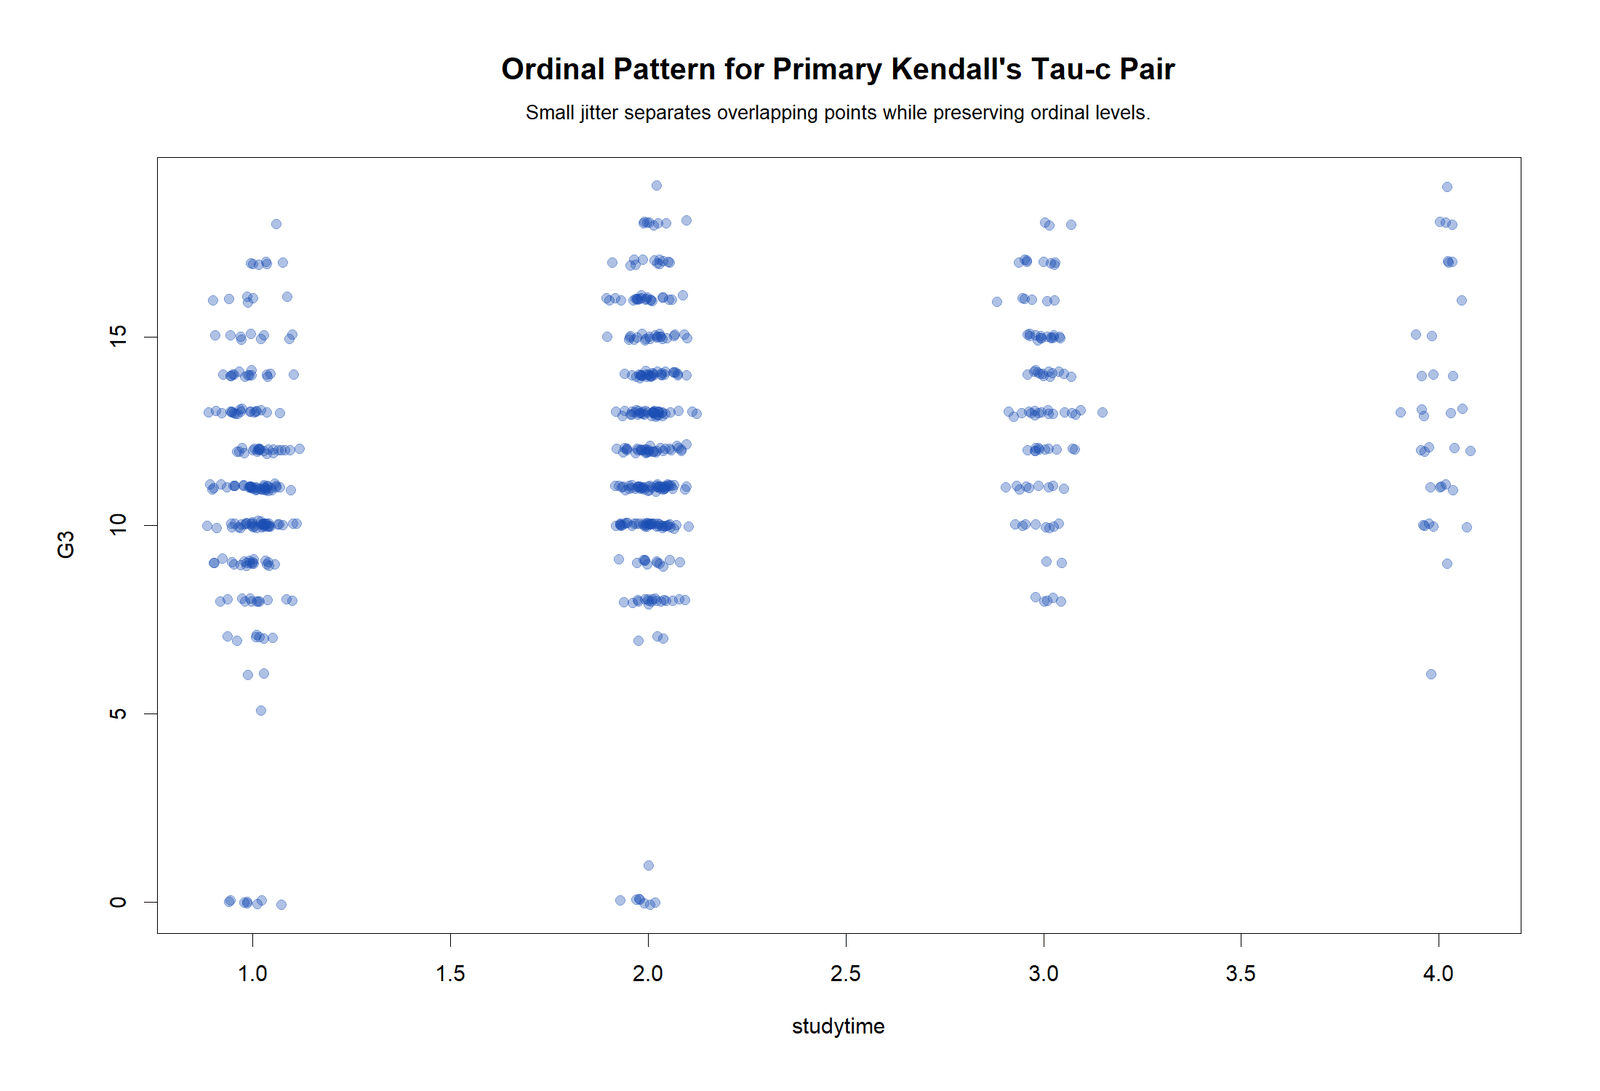
The R ordinal pattern chart confirms the weak positive pattern between studytime and G3. Higher studytime categories show some tendency toward higher final grades, but there is substantial overlap among categories.
This chart is the best visual support for the final wording. It shows why the association is statistically significant but weak: the general direction is positive, yet studytime categories do not sharply separate final-grade outcomes.
Excel Worked File Explanation
The Excel workbook is a fully worked Kendall’s Tau-c analysis file. It includes the raw data, selected variables, primary contingency table, worked Tau-c formula calculation, pairwise Tau-c results, a coefficient heatmap sheet, p-value matrix and top findings. This makes it useful for students who want to understand how Tau-c is calculated from a contingency table instead of only reading software output.
Download the Kendall’s Tau-c Fully Worked Excel File
| Excel Sheet | Purpose | What It Teaches |
|---|---|---|
| README | Explains the project, folder, primary pair and formula. | Shows that the primary pair is studytime by G3 and the formula is Tau-c = [2m(C-D)]/[n²(m-1)]. |
| Raw_Data | Stores the full dataset used in the workbook. | Allows users to verify the source variables and case count. |
| Variables_Selected | Lists all variables included in the Tau-c matrix. | Shows valid N, number of levels, minimum, maximum and variable role. |
| Contingency_Table | Displays the primary studytime by G3 count table. | Shows how the ordinal table is built before calculating Tau-c. |
| Worked_Tau_c | Provides the detailed formula calculation. | Shows concordant and discordant contributions from contingency-table cells. |
| Tau_c_Results | Stores all pairwise Tau-c results. | Allows sorting and filtering of associations. |
| Tau_c_Heatmap | Shows the coefficient matrix. | Helps visualize direction and strength across variables. |
| P_Value_Matrix | Shows approximate p-values. | Provides significance context for pairwise results. |
| Top_Findings | Summarizes key findings and top relationships. | Gives report-ready conclusions for the strongest pairs and primary pair. |
Excel Primary Result
The Excel workbook reports the same primary result: studytime by G3, Kendall’s Tau-c = 0.2250390352, and approximate p-value 2.514568793e-12. It also identifies the strongest pair overall as G2 by G3, with Tau-c = 0.8310255674.
Excel Contingency Table Logic
The workbook builds a contingency table first, then calculates concordant and discordant pair contributions. For each cell, concordant contributions come from cells that are lower-left or upper-right relative to that cell. Discordant contributions come from cells that are upper-left or lower-right relative to that cell. The workbook then divides by 2 because cross-cell pair contributions are counted twice when every cell is evaluated.
Excel teaching value: The workbook is not only a result file. It is a formula demonstration. It shows the cell counts, the pair logic, the formula terms and the final Tau-c coefficient.
Python, R and Excel Workflows
Kendall’s Tau-c can be calculated in different software tools, but the central logic is the same: create an ordered contingency table, count concordant and discordant pairs, identify the smaller table dimension, and apply the Tau-c formula.
| Software | Main Workflow | Best Use |
|---|---|---|
| Python | Use pandas to create ordered contingency tables, loops or array logic to calculate concordant and discordant pairs, and matplotlib for heatmaps and ordinal pattern charts. | Automated chart production, matrix reporting and reproducible blog assets. |
| R | Use table functions for contingency tables, custom Tau-c functions for pair counts, and charting tools for colorful heatmaps and ordinal plots. | Validation, statistical reporting and colorful publication-style visuals. |
| Excel | Use COUNTIFS or pivot-style contingency counts, cell-by-cell formulas for concordant and discordant contributions, and the Tau-c formula. | Manual learning, formula verification and transparent classroom demonstration. |
Python and R are best for full automated matrices. Excel is best for showing learners how the formula works cell by cell. For a blog post, using all three is ideal because it provides reproducibility, validation and teaching value.
Code Blocks and Excel Formulas
Python Code for Kendall’s Tau-c
import pandas as pd
import numpy as np
from scipy.stats import kendalltau

df = pd.read_csv("dataset.csv")

x_var = "studytime"
y_var = "G3"

work = df[[x_var, y_var]].dropna().copy()
work[x_var] = pd.to_numeric(work[x_var], errors="coerce")
work[y_var] = pd.to_numeric(work[y_var], errors="coerce")
work = work.dropna()

# Ordered contingency table
tab = pd.crosstab(work[x_var], work[y_var]).sort_index(axis=0).sort_index(axis=1)

def kendalls_tau_c_from_table(table):
    arr = table.to_numpy()
    r, c = arr.shape
    n = arr.sum()
    m = min(r, c)

    concordant = 0
    discordant = 0

    for i in range(r):
        for j in range(c):
            count = arr[i, j]
            if count == 0:
                continue

            # Concordant cells: lower-right and upper-left
            lower_right = arr[i+1:, j+1:].sum()
            upper_left = arr[:i, :j].sum()

            # Discordant cells: lower-left and upper-right
            lower_left = arr[i+1:, :j].sum()
            upper_right = arr[:i, j+1:].sum()

            concordant += count * (lower_right + upper_left)
            discordant += count * (lower_left + upper_right)

    # Divide by 2 because cross-cell pairs are counted twice
    concordant = concordant / 2
    discordant = discordant / 2

    tau_c = (2 * m * (concordant - discordant)) / (n**2 * (m - 1))
    return tau_c, concordant, discordant, n, m

tau_c, C, D, n, m = kendalls_tau_c_from_table(tab)

# Approximate p-value context using Kendall rank test
tau_context, p_value = kendalltau(work[x_var], work[y_var])

print("Primary pair:", x_var, "by", y_var)
print("N:", n)
print("m:", m)
print("Concordant pairs:", C)
print("Discordant pairs:", D)
print("Kendall's Tau-c:", tau_c)
print("Approximate p-value context:", p_value)
print(tab)
R Code for Kendall’s Tau-c
df <- read.csv("dataset.csv", stringsAsFactors = FALSE)

x_var <- "studytime"
y_var <- "G3"

work <- na.omit(df[, c(x_var, y_var)])
work[[x_var]] <- as.numeric(work[[x_var]])
work[[y_var]] <- as.numeric(work[[y_var]])

tab <- table(work[[x_var]], work[[y_var]])

kendalls_tau_c_from_table <- function(tab){
  arr <- as.matrix(tab)
  r <- nrow(arr)
  c <- ncol(arr)
  n <- sum(arr)
  m <- min(r, c)

  C <- 0
  D <- 0

  for(i in 1:r){
    for(j in 1:c){
      count <- arr[i, j]
      if(count == 0) next

      lower_right <- if(i < r && j < c) sum(arr[(i+1):r, (j+1):c, drop = FALSE]) else 0
      upper_left <- if(i > 1 && j > 1) sum(arr[1:(i-1), 1:(j-1), drop = FALSE]) else 0

      lower_left <- if(i < r && j > 1) sum(arr[(i+1):r, 1:(j-1), drop = FALSE]) else 0
      upper_right <- if(i > 1 && j < c) sum(arr[1:(i-1), (j+1):c, drop = FALSE]) else 0

      C <- C + count * (lower_right + upper_left)
      D <- D + count * (lower_left + upper_right)
    }
  }

  C <- C / 2
  D <- D / 2

  tau_c <- (2 * m * (C - D)) / (n^2 * (m - 1))
  list(tau_c = tau_c, concordant = C, discordant = D, n = n, m = m)
}

result <- kendalls_tau_c_from_table(tab)
print(result)

# Approximate p-value context
test_context <- cor.test(work[[x_var]], work[[y_var]], method = "kendall", exact = FALSE)
print(test_context)
Excel Formula Patterns for Kendall's Tau-c
Primary formula:
tau-c = [2*m*(C-D)] / [n^2*(m-1)]

Where:
C = concordant pairs
D = discordant pairs
n = total valid observations
m = MIN(number_of_row_categories, number_of_column_categories)

Contingency table count:
=COUNTIFS(studytime_range, row_category, G3_range, column_category)

Row total:
=SUM(row_cells)

Column total:
=SUM(column_cells)

Total N:
=SUM(all_contingency_cells)

m:
=MIN(number_of_row_levels, number_of_column_levels)

Cell concordant contribution:
=cell_count*(SUM(lower_right_cells)+SUM(upper_left_cells))

Cell discordant contribution:
=cell_count*(SUM(lower_left_cells)+SUM(upper_right_cells))

Total C:
=SUM(all_concordant_contributions)/2

Total D:
=SUM(all_discordant_contributions)/2

Kendall's Tau-c:
=(2*m*(C-D))/(N^2*(m-1))

Decision:
=IF(p_value<0.05,"Significant ordinal association","Not significant")
Assumptions and Data Checks
Kendall's Tau-c is nonparametric, so it does not require normality in the same way that Pearson correlation does. However, it still has important requirements. The variables must have meaningful order, the observations should be independent, and the coefficient should be interpreted as ordinal association rather than causal effect.
| Check | Why It Matters | Status in This Example |
|---|---|---|
| Ordered categories | Tau-c requires meaningful low-to-high ordering. | studytime and G3 both have ordered values. |
| Rectangular table suitability | Tau-c is useful when row and column category counts differ. | studytime has 4 levels and G3 has 17 observed levels. |
| Independent observations | Each row should represent a separate student/case. | The dataset treats each student as a separate observation. |
| Enough valid data | Sparse tables can make interpretation unstable. | N = 649 provides a large sample, but some high studytime cells are small. |
| Monotonic direction | Tau-c summarizes ordered tendency, not a complex nonlinear pattern. | The ordinal pattern is weak but positive. |
| No causal interpretation | Association does not prove that one variable causes the other. | The result should be described as association only. |
These checks help keep the interpretation accurate. The coefficient is meaningful because both variables are ordered, but the weak size of the coefficient and the overlap in the ordinal pattern mean the result should not be overstated.
How to Report Kendall's Tau-c
A complete Kendall's Tau-c report should include the variables, sample size, row and column categories, coefficient, p-value, direction, strength and a plain-language interpretation. Since Tau-c is often used for ordinal contingency tables, it is also helpful to mention the number of concordant and discordant pairs.
APA-style report: Kendall's Tau-c was calculated to examine the ordinal association between studytime and G3 final grade. The analysis included 649 valid observations. Studytime had 4 ordered levels and G3 had 17 observed ordered grade categories. The association was statistically significant and positive, τc = .225, p < .001. The result indicates a weak positive ordinal association, meaning students in higher studytime categories tended to appear somewhat more often in higher G3 categories.
Expanded reporting wording: The studytime by G3 contingency table produced 79,088 concordant pairs and 43,543 discordant pairs. Because concordant pairs outnumbered discordant pairs, the coefficient was positive. However, the coefficient was only .225, so the practical strength should be described as weak rather than strong.
Matrix-context wording: In the full pairwise Tau-c matrix, the strongest association was G2 by G3, τc = .831, p < .001, indicating a very strong positive ordinal relationship between second-period and final grades. The primary studytime by G3 result was significant but much weaker.
Common Mistakes in Kendall's Tau-c Interpretation
| Mistake | Why It Is a Problem | Better Practice |
|---|---|---|
| Calling Tau-c a Pearson correlation | Tau-c is based on ordinal pair ordering, not raw linear covariance. | Use “ordinal association” or “monotonic association” wording. |
| Ignoring the contingency table | Tau-c is calculated from ordered contingency-table logic. | Show or describe the row and column categories. |
| Reporting only the p-value | The p-value does not show the strength of association. | Report Tau-c and p-value together. |
| Calling a weak significant result strong | Large sample sizes can make weak effects statistically significant. | Use effect-size language based on the coefficient. |
| Using Tau-c for nominal categories | Tau-c requires ordered categories. | Use Cramer's V or contingency coefficient for unordered nominal data. |
| Confusing Tau-b and Tau-c | Tau-b and Tau-c use different denominator corrections. | Choose Tau-c for rectangular ordinal tables and Tau-b for tied paired ranks. |
| Claiming studytime causes higher G3 | Correlation alone does not prove causation. | Say “higher studytime is associated with higher G3 categories.” |
Downloads and Resources
Download R Report PDFR validation report with colorful Kendall's Tau-c charts and matching results.
Download Excel Worked FileFully worked Tau-c workbook with contingency table, formula calculation, matrix and top findings.
Open Python Tau-c HeatmapPairwise ordinal association heatmap.
Open Python Primary Contingency HeatmapStudytime by G3 cell-count heatmap.
Open R Ordinal Pattern ChartColorful studytime by G3 ordinal pattern plot.
External References
For additional learning, check documentation and references for Kendall rank correlation, ordinal association, contingency-table analysis, Python statistical workflows, R correlation workflows and Excel formulas for count tables. When comparing this method with other measures, also review nominal association measures such as Cramer's V and rank measures such as Kendall's Tau-b and Spearman correlation.
FAQs About Kendall's Tau-c
What is Kendall's Tau-c?
Kendall's Tau-c is an ordinal association coefficient used for ordered contingency tables, especially when the table is rectangular or the variables have different numbers of categories.
What was the primary Kendall's Tau-c result in this guide?
The primary result was studytime by G3, with N = 649, Kendall's Tau-c = 0.225039 and approximate p-value = 2.51457e-12. The association is statistically significant and weak positive.
What was the strongest pair overall?
The strongest pair in the full matrix was G2 by G3, with Kendall's Tau-c = 0.831026 and p = 2.113285e-199. This is a very strong positive ordinal association.
How is Kendall's Tau-c calculated?
It is calculated with the formula τc = [2m(C-D)]/[n²(m-1)], where C is concordant pairs, D is discordant pairs, n is sample size and m is the smaller number of row or column categories.
Why use Tau-c instead of Tau-b?
Tau-c is useful for rectangular ordinal contingency tables where the row and column variables have different numbers of categories. Tau-b is more commonly used for tied paired ranks.
Does a significant Tau-c prove causation?
No. A significant Tau-c shows ordinal association, not cause and effect. In this guide, higher studytime is associated with higher G3 categories, but the analysis does not prove that studytime alone causes higher grades.
Can Excel calculate Kendall's Tau-c?
Yes. Excel can calculate Tau-c by building a contingency table, computing concordant and discordant pair contributions, identifying m and applying the Tau-c formula. The downloadable workbook provides a fully worked example.
What wording should I use in a report?
Use wording such as: “Kendall's Tau-c showed a statistically significant weak positive ordinal association between studytime and G3, τc = .225, p < .001, N = 649.”

