
Kuder Richardson Formula 20: 7 Essential Steps, Formula and Worked Example
The Kuder Richardson Formula 20, commonly written as KR-20, estimates the internal consistency of a test composed of dichotomously scored items. This complete guide explains the Kuder Richardson Formula 20 assumptions, formula, item difficulty terms, total-score variance, interpretation, worked example, and reproducible workflows in Python, R, SPSS and Excel.
Internal consistency
Item-specific p × q
649 complete cases
Python + R + SPSS + Excel
The six binary indicators have weak internal consistency.
In this worked Kuder Richardson Formula 20 example, six yes/no items were analyzed for 649 complete cases. The verified coefficient was KR-20 = 0.212649. The total score had a mean of 2.9245, variance of 1.106945, and standard deviation of 1.0521. SPSS reported raw Cronbach’s alpha of .211 and standardized alpha of .229, confirming the same low-reliability conclusion.
What does Kuder Richardson Formula 20 measure?
A binary-item internal-consistency coefficient based on item-specific endorsement variance and total-score variance.
Kuder Richardson Formula 20, commonly shortened to KR-20, measures the internal consistency of a set of dichotomously scored items administered once to one group of respondents. In a knowledge test, 1 usually represents a correct response and 0 an incorrect response. In a checklist or yes/no instrument, 1 may represent endorsement and 0 non-endorsement. The coefficient summarizes how strongly the items work together as components of one proposed total score.
The central reliability question
The central question is whether respondents who obtain a high score on one item also tend to obtain high scores on the other items. When the items share positive covariance, the variance of the summed score becomes large relative to the sum of the separate item variances, and Kuder Richardson Formula 20 rises. When the items are largely unrelated, represent different constructs or contain inconsistent scoring, the coefficient remains low or can become negative.
KR-20 is therefore a property of scores produced by a specific item set in a specific sample. It is not a permanent property of an instrument name. A test may have acceptable Kuder Richardson Formula 20 reliability in one population and weaker reliability in another because item difficulty, score variability and covariance patterns change.
What KR-20 does not prove
A high coefficient does not prove that the test is valid, fair, unidimensional or free from redundant items. A low coefficient does not automatically prove that every item is defective. Reliability is necessary for many score interpretations, but it is only one component of a defensible measurement argument. Content coverage, factor structure, criterion relationships, administration conditions and subgroup functioning remain separate questions.
Kuder Richardson Formula 20 also does not measure agreement between raters, stability across time or equivalence between forms. Those designs require methods such as the intraclass correlation coefficient, Cohen’s Kappa, test-retest reliability or parallel-forms analysis.
The coefficient was developed for heterogeneous binary item difficulties, which is why each item contributes its own piqi term. This item-specific treatment distinguishes Kuder Richardson Formula 20 from the more restrictive KR-21 approximation. It also explains why the coefficient is appropriate for multiple-choice tests scored correct/incorrect, true/false tests, screening checklists and other binary composites when a common total score is substantively justified.
When should you use Kuder Richardson Formula 20?
Use the decision logic below before calculating a reliability coefficient.
Kuder Richardson Formula 20 is appropriate when the data matrix contains respondents in rows, items in columns and exactly two scored outcomes per item. The method is most familiar in educational testing, where each response is coded 1 for correct and 0 for incorrect. It is equally usable for yes/no indicators, pass/fail components and present/absent checklist items, provided that a higher score has a consistent meaning and the items are intended to form one composite.
Strong use case
A 40-item certification examination is scored 0 or 1, all items assess the same defined competency domain, and the total number correct is the reported score. Kuder Richardson Formula 20 directly evaluates the internal consistency of that score.
Conditional use case
A clinical checklist contains yes/no symptoms. KR-20 can be calculated, but only when the symptoms are expected to define one severity dimension. If the checklist intentionally samples unrelated diagnostic categories, a single coefficient may be misleading.
Inappropriate use case
A dataset contains demographic flags, service-use indicators and outcome statuses that are not intended as one scale. Calculating Kuder Richardson Formula 20 is mathematically possible but substantively unnecessary because there is no defensible common total.
Do not use KR-20 for Likert items with three or more ordered categories without first reducing them to two categories, and do not dichotomize merely to make the formula available. Dichotomization discards information and can reduce reliability. For multi-category items, raw Cronbach’s alpha, ordinal alpha, McDonald’s omega or an item-response model may be more appropriate depending on the measurement assumptions.
Do not substitute Kuder Richardson Formula 20 for inter-rater agreement simply because ratings are binary. When two or more raters classify the same cases, the design concerns agreement rather than item homogeneity. The Cohen’s Kappa guide, Fleiss Kappa guide and intraclass correlation guide explain those alternatives.
When those conditions are met, Kuder Richardson Formula 20 provides a transparent classical-test-theory summary. It is especially useful because the calculation can be reproduced from item endorsement proportions and total-score variance, allowing direct verification in Python, R, SPSS and Excel.
Kuder Richardson Formula 20 assumptions: six conditions to check
KR-20 is straightforward to calculate, but its interpretation depends on a coherent measurement design.
Kuder Richardson Formula 20 has simple computational requirements but important interpretive assumptions. The coefficient can always be calculated when binary item columns and positive total-score variance are available, yet the resulting number is meaningful only when the total score represents a coherent construct and the administration design is appropriate.
Computational checks
Measurement checks
Approximate unidimensionality is central. KR-20 can be low when items cover several unrelated domains, as in the worked example, but it can also be deceptively high when a long test contains clusters of redundant items. Factor analysis, residual dependence diagnostics and content review should evaluate whether one total score is defensible.
Tau-equivalence is often associated with coefficient alpha. Strictly, alpha and KR-20 are not universally unbiased reliability estimates when items have different true-score loadings. They are covariance-based coefficients under a classical score model. McDonald’s omega or a latent-variable model may be preferable when item loadings differ substantially. That limitation does not make Kuder Richardson Formula 20 useless; it defines what the coefficient can and cannot claim.
Independent respondents are required for ordinary interpretation. Clustered classrooms, repeated administrations or household sampling can alter standard errors and score relationships. The coefficient itself may still be calculated, but uncertainty and generalization should reflect the sampling design.
Missing data require a stated rule. Listwise deletion uses only respondents with complete data on every item. Pairwise procedures can create different p values and covariance elements from different case sets, undermining the direct formula. Imputation may be justified in some studies but should occur before reliability analysis under a documented model.
Restricted score range can lower Kuder Richardson Formula 20. A highly selected group may answer most items similarly even when the test functions well in a broader population. Conversely, a heterogeneous sample can increase score variance and reliability. Report the target population and do not transfer a coefficient across populations without evidence.
Kuder Richardson Formula 20 reliability model and variables
KR-20 is a measurement coefficient rather than a conventional significance test.
The Kuder Richardson Formula 20 is a descriptive reliability coefficient rather than a null-hypothesis significance test. The useful “hypothesis” is therefore a measurement model: all included binary items should provide positively aligned evidence about one intended score. The section below states that model and connects it to the six variables used in the worked analysis.
Internal-consistency measurement model
Let Xij be the score of person i on binary item j, coded 0 or 1. The total score is the unweighted sum across k items. KR-20 asks how much of the observed total-score variance is supported by covariance among those items after accounting for each item’s Bernoulli variance.
For this analysis, k = 6 and every participant can therefore receive a total from 0 through 6.
Applied variables in this analysis
The variables are all binary, so KR-20 is mathematically appropriate. Their content, however, spans support, services, activities, aspiration and access. That broad conceptual range is an important reason to avoid treating the coefficient as a purely mechanical pass/fail statistic.
Desired measurement pattern
When items measure a shared construct in the same direction, respondents who endorse one item should tend to endorse the others. Positive average covariance increases total-score variance beyond the sum of the separate p × q terms and raises KR-20.
Observed measurement pattern
Approximately .047
.047 to .130
.212649
The observed relationships are weak. The coefficient is therefore low not because of one isolated item, but because the six items share little systematic covariance as a set.
Reliability decision for the worked composite
The correct substantive conclusion is that the six-item sum should not be presented as a dependable unidimensional scale. Deleting one item does not solve the problem: SPSS alpha-if-deleted values remain between .157 and .222. The appropriate response is to revisit the construct definition, decide whether the variables belong in one score, and develop items that deliberately sample the same domain.
Kuder Richardson Formula 20 formula, components and calculation
Every term in the formula has a direct measurement interpretation.
The standard Kuder Richardson Formula 20 equation is:
Here, k is the number of items; pi is the proportion scored 1 on item i; qi = 1 – pi; piqi is the binary item variance under the probability convention; and sX2 is the variance of the respondent total scores.
Why p × q appears
For a variable that can take only 0 and 1, the mean equals the proportion of 1s, p. Its probability variance is p(1-p), written p q. An item with p near .50 has the largest possible binary variance, .25. An item with p near 0 or 1 has little variance because almost everyone receives the same score.
Kuder Richardson Formula 20 retains a separate p q term for every item. That feature allows easy and difficult test items, or uncommon and common endorsements, to contribute their actual variances rather than being forced into a common-difficulty approximation.
Why total-score variance matters
The total-score variance contains both the item variances and the covariances among items. When respondents who score 1 on one item also tend to score 1 on other items, positive covariances increase total-score variance. KR-20 rises because the sum of isolated item variances becomes smaller relative to the variance of the combined score.
When covariance is weak, the total variance is only slightly larger than the sum of item variances. The bracketed part of Kuder Richardson Formula 20 remains small, producing a low coefficient.
This variance identity explains the coefficient. Reliability increases when the item set contains consistent positive covariance, not simply because every item has a large p q value.
The multiplier k/(k-1) adjusts for the number of items. Longer tests often have higher reliability when additional items measure the same construct with similar quality, but adding unrelated items can fail to help or can reduce internal consistency. The Kuder Richardson Formula 20 result must therefore be interpreted with both item count and average association.
Variance conventions require careful documentation. Python and R can calculate total variance with either a population divisor n or a sample divisor n-1. Excel offers VAR.P and VAR.S. SPSS reliability uses covariance calculations based on sample variances. The worked exact KR-20 pipeline uses the verified p q terms and sample total-score variance, producing 0.212649. A fully sample-adjusted alpha calculation produces approximately 0.211125, which SPSS rounds to .211. Both indicate very weak consistency.
Kuder Richardson Formula 20 example: six binary student indicators
A complete calculation using 649 cases and six 0/1 variables.
The complete Kuder Richardson Formula 20 calculation can be reconstructed from the verified item table. For each variable, divide the number of 1 responses by 649 to obtain p. Subtract p from 1 to obtain q. Multiply p by q, sum the six products, calculate each respondent’s total score and then calculate the variance of those totals.
| Item | p | q | p × q | Contribution to Σpq |
|---|---|---|---|---|
| schoolsup | 0.104777 | 0.895223 | 0.093798 | 10.30% |
| famsup | 0.613251 | 0.386749 | 0.237174 | 26.04% |
| paid | 0.060092 | 0.939908 | 0.056481 | 6.20% |
| activities | 0.485362 | 0.514638 | 0.249786 | 27.43% |
| higher | 0.893683 | 0.106317 | 0.095014 | 10.43% |
| internet | 0.767334 | 0.232666 | 0.178532 | 19.60% |
| Total | — | — | 0.910786 | 100% |
Code the items
Convert no to 0 and yes to 1 while preserving one row per respondent.
Find p and q
Calculate each item mean p and q = 1 – p.
Sum p q
Add the six item-specific products to obtain 0.910786.
Form totals
Sum the six scores for every row; totals range from 0 to 6.
Substitute
Use k = 6 and total-score variance = 1.106945.
The final published value can be rounded to KR-20 = .213. Retain additional decimals in reproducibility files so that software comparisons are not obscured by rounding.
The ratio Σpq/sX2 is approximately 0.82279. That means the summed independent binary variances account for most of the total-score variance, leaving comparatively little variance attributable to positive covariance among the six items. The Kuder Richardson Formula 20 multiplier raises the bracketed quantity slightly, but it cannot create reliability when the covariance structure is weak.
Activities and family support contribute the largest p q terms because their p values are nearer .50. Paid classes contributes the smallest p q term because only 39 of 649 respondents are coded yes. These contributions describe item variability, not item quality by themselves. A rare but theoretically important item may have low variance; an item near p = .50 may vary widely yet still correlate poorly with the rest of the test.
Kuder Richardson Formula 20 statistics, results and interpretation
All software outputs reconcile to the same low-reliability conclusion.
The verified Kuder Richardson Formula 20 result ledger contains four primary metrics: KR-20 = 0.21264912139527564, items = 6, cases = 649 and total-score variance = 1.1069451577926155. The Python report, R report and formula-driven Excel workbook agree at full displayed precision. The SPSS output analyzes all 649 cases and reports Cronbach’s alpha = .211 for six items, with standardized alpha = .229.
Primary interpretation
Weak internal consistency
The six variables should not be treated as a dependable one-dimensional scale without a new construct definition, item redesign and independent validation.
SPSS item-total evidence
Corrected item-total correlations are .047 for school support, .112 for family support, .112 for paid classes, .057 for activities, .130 for higher-education intention and .106 for internet access. Every value is low. The highest coefficient, .130, remains far below the frequently used .30 item-screening benchmark.
Alpha if item deleted ranges from .157 to .222. Removing activities produces the largest rounded alpha, .222, but this remains extremely low. No single item deletion repairs the composite.
| Item | Corrected item-total r | Alpha if deleted | Interpretation |
|---|---|---|---|
| schoolsup | 0.047 | 0.211 | Minimal item-rest alignment |
| famsup | 0.112 | 0.160 | Weak positive alignment |
| paid | 0.112 | 0.177 | Weak alignment with restricted endorsement |
| activities | 0.057 | 0.222 | Deletion changes little and remains poor |
| higher | 0.130 | 0.157 | Highest item-rest coefficient, still weak |
| internet | 0.106 | 0.166 | Weak positive alignment |
The average inter-item correlation reported by SPSS is approximately .047, with pairwise correlations ranging from -.030 to .094. Several small correlations are statistically detectable because the sample is large, but statistical significance does not transform them into strong measurement relationships. The p-value and significance guide and the effect size guide explain why magnitude and evidence are different questions.
The complete Kuder Richardson Formula 20 result therefore rests on converging diagnostics: a low coefficient, low item-rest correlations, a low mean inter-item relationship and no useful item-deletion solution. The substantive content reinforces the same conclusion because the six variables describe distinct contexts rather than repeated indicators of one trait.
Kuder Richardson Formula 20 generally increases as internal covariance becomes stronger, but there is no universal cutoff that automatically certifies a test. Rules such as .70 for exploratory group comparisons, .80 for more dependable research scores and .90 for high-stakes individual decisions are common planning references, not natural laws. Required reliability depends on what decisions will be made, how much error is tolerable and whether the score will be combined with other evidence.
| Approximate range | Common descriptive label | Practical reading | Required follow-up |
|---|---|---|---|
| Below 0 | Contradictory scoring or severe heterogeneity | Average covariance is negative | Check coding, keys and construct definition immediately |
| 0.00–0.49 | Very weak | Total score is highly error-prone | Do not use as a dependable scale |
| 0.50–0.69 | Limited | May support early exploratory work only | Review items, dimensionality and score purpose |
| 0.70–0.79 | Often acceptable for group research | May be adequate for low-stakes comparisons | Report uncertainty and supporting validity evidence |
| 0.80–0.89 | Good in many settings | Stronger score precision | Still inspect redundancy and dimensionality |
| 0.90 and above | Very high | May be needed for high-stakes use | Check whether items are overly repetitive |
The worked value of .213 is not borderline. It is far below levels normally considered useful for a reported composite. With six items, some attenuation is expected because short tests have fewer covariance terms, but test length alone does not explain the pattern. Corrected item-total correlations are all weak, and the average inter-item relationship is only about .047. Adding more unrelated indicators would not solve the conceptual problem.
Reliability is purpose dependent
A classroom quiz used for informal feedback may tolerate lower reliability than a licensing examination. A research index used as one descriptive covariate may require less precision than a score used to make decisions about individuals. Report the Kuder Richardson Formula 20 coefficient beside the intended use rather than presenting a bare number.
High is not always better
A coefficient near 1 can indicate a focused and precise test, but it can also indicate redundant items that repeat the same wording or narrow the content domain. Internal consistency should support coverage, not replace it. Review the test blueprint and item content whenever Kuder Richardson Formula 20 is unusually high.
Sampling uncertainty also matters. A coefficient from 649 cases is more stable than the same value from 25 cases, yet a large sample does not make a weak coefficient acceptable. Confidence intervals or bootstrap intervals can quantify precision, especially for smaller samples. The confidence interval guide provides general interpretation principles, although the interval procedure must be chosen specifically for reliability coefficients.
The correct conclusion for this example is that the six-variable total lacks internal-consistency support. The Kuder Richardson Formula 20 result should trigger construct review, not a search for a more flattering rounding rule.
Kuder Richardson Formula 20 in Python: calculation and five charts
A reproducible Python workflow with item proportions, score diagnostics and verified output.
import numpy as np
import pandas as pddf = pd.read_csv("dataset.csv")
items = ["schoolsup_b", "famsup_b", "paid_b",
"activities_b", "higher_b", "internet_b"]
X = df[items].dropna().astype(float)
k = X.shape[1]
p = X.mean(axis=0)
q = 1 - p
total = X.sum(axis=1)
kr20 = (k / (k - 1)) * (1 - (p * q).sum() / total.var(ddof=1))
print(f"n = {len(X)}")
print(f"k = {k}")
print(f"KR-20 = {kr20:.12f}")
The Python report reproduces the exact Kuder Richardson Formula 20 coefficient and supporting tables. The first figure is displayed alone at full width; the remaining figures are paired to preserve the accepted chart-card layout. Every interpretation below uses the verified numerical tables rather than relying only on relative bar heights.
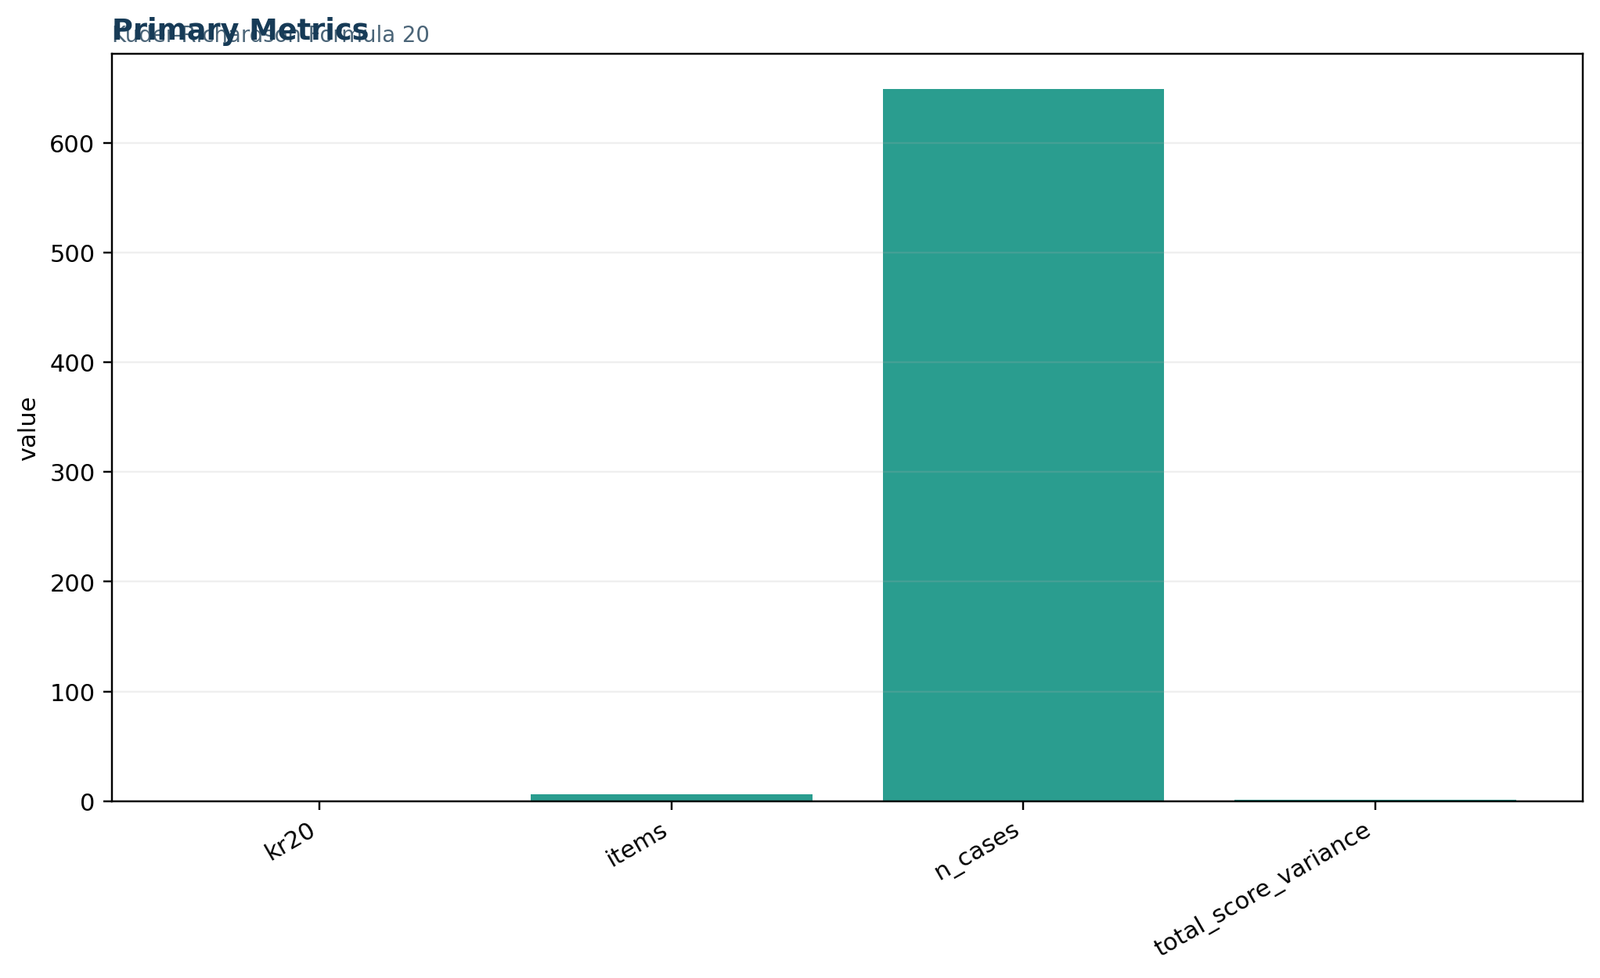
Python chart 1: Primary metrics
The verified Python ledger reports KR-20 = 0.212649, six items, 649 cases and total-score variance = 1.106945. Because the metrics use different units, the chart is a result inventory rather than an effect-size comparison.
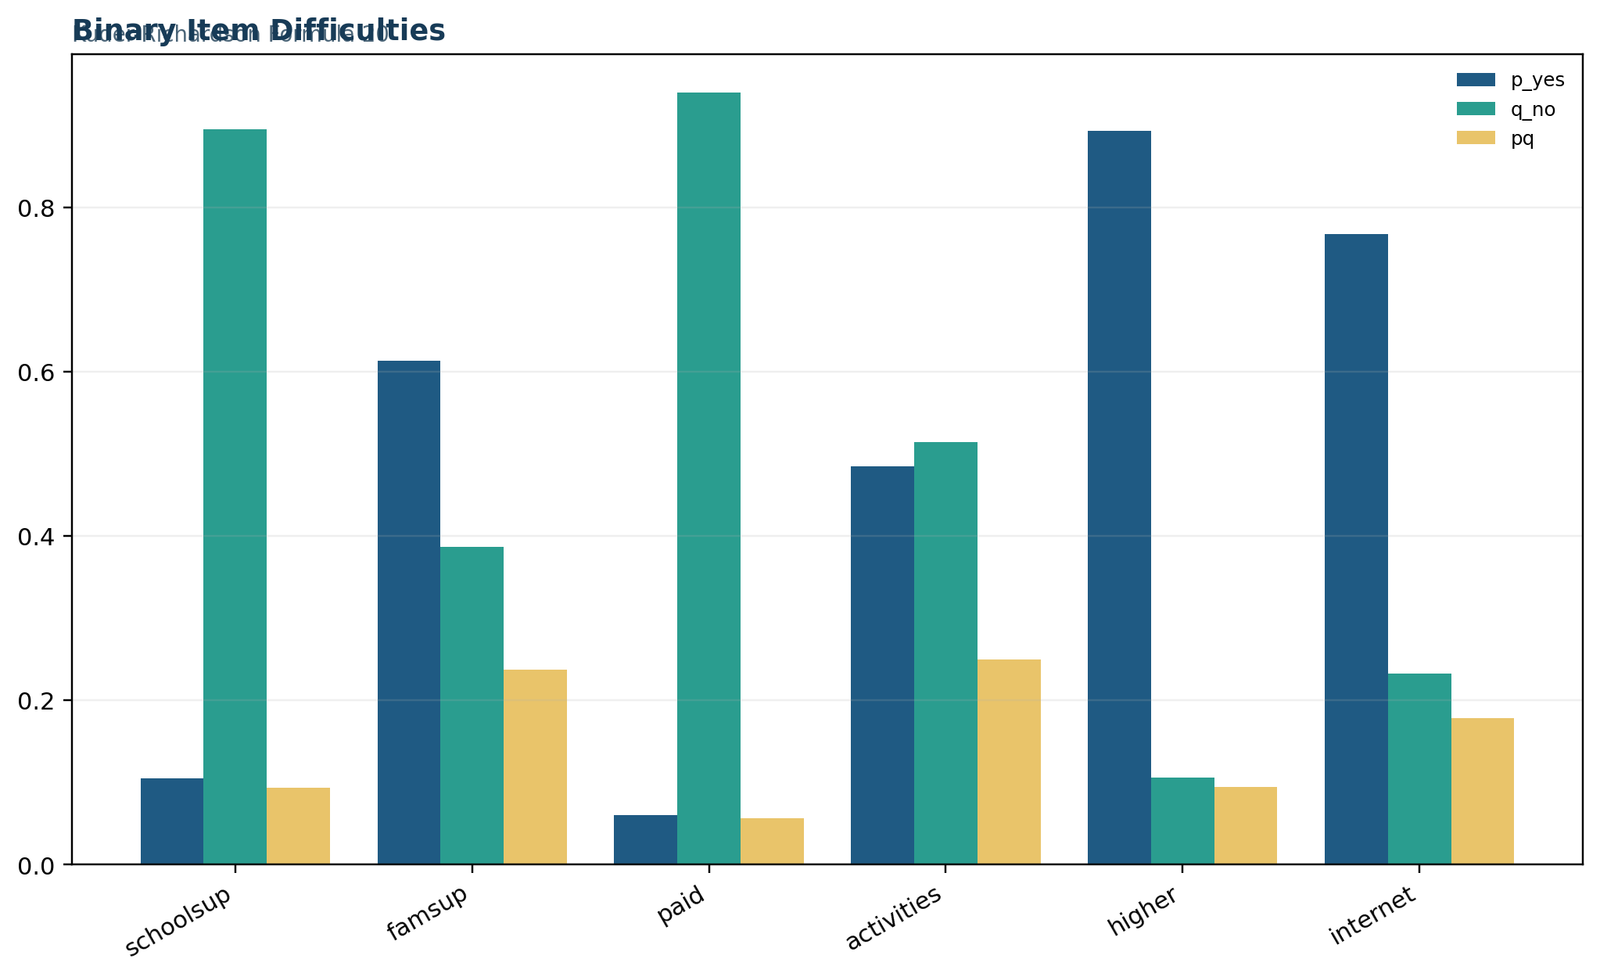
Python chart 2: Binary item difficulties and endorsement proportions
The p values range from 0.060092 for paid classes to 0.893683 for higher-education intention. Activities is closest to p = .50 and therefore has the largest p q value, 0.249786.
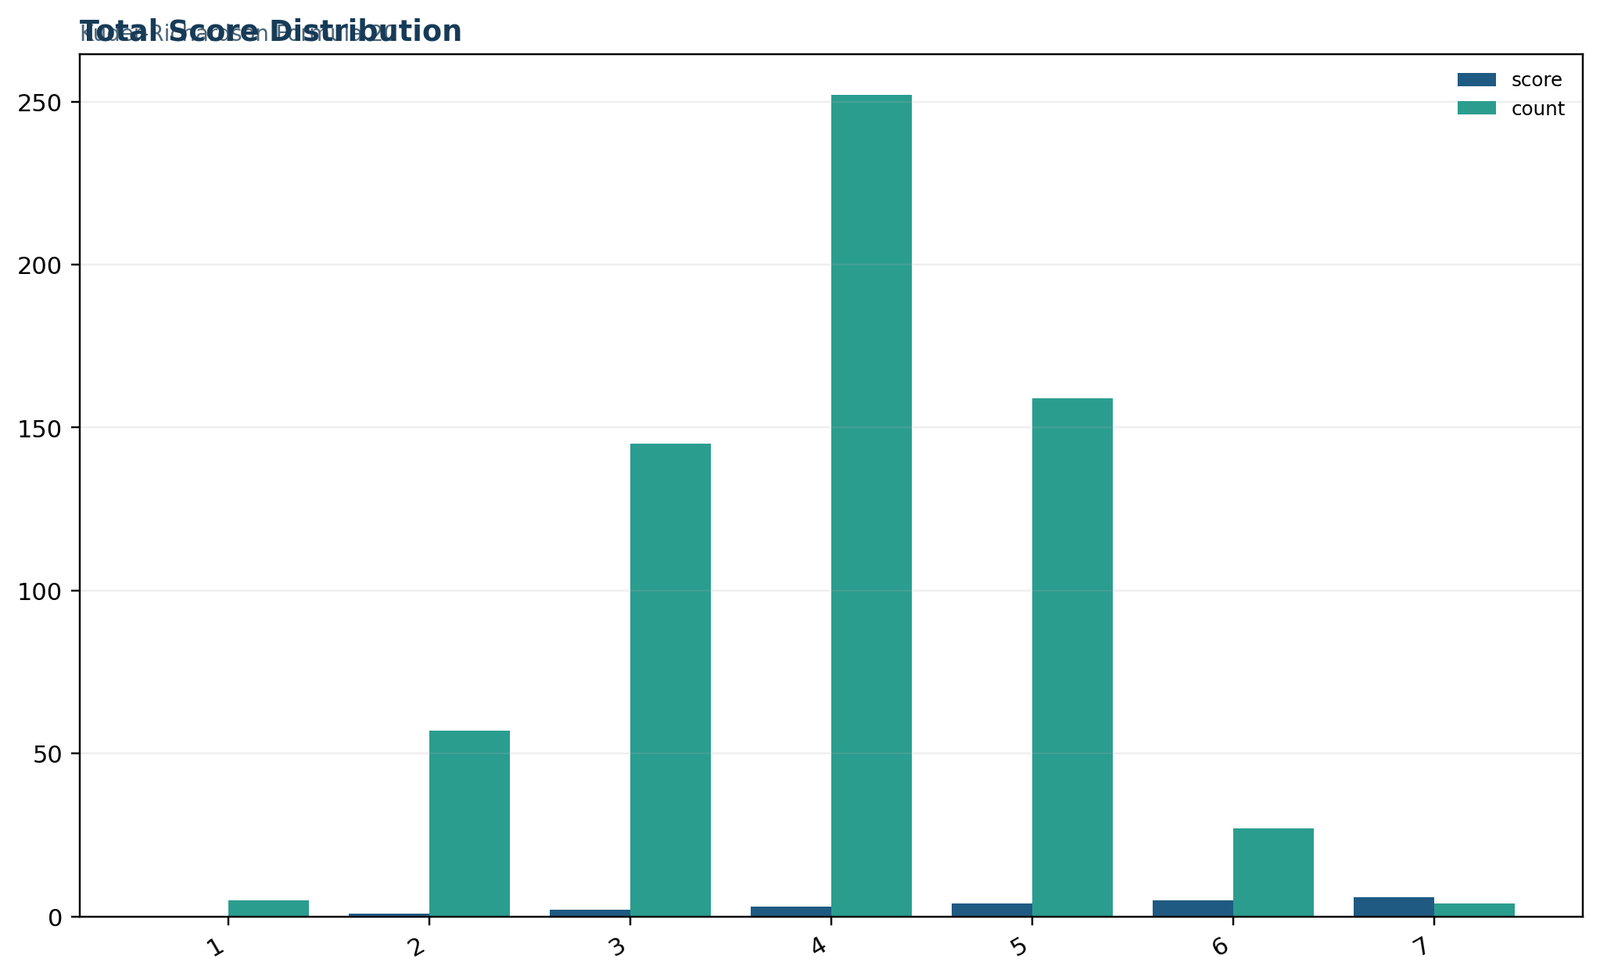
Python chart 3: Total-score distribution
The verified table contains score values 0 through 6 with frequencies 5, 57, 145, 252, 159, 27 and 4. The mode is 3, the mean is 2.9245 and the sample standard deviation is 1.05211.
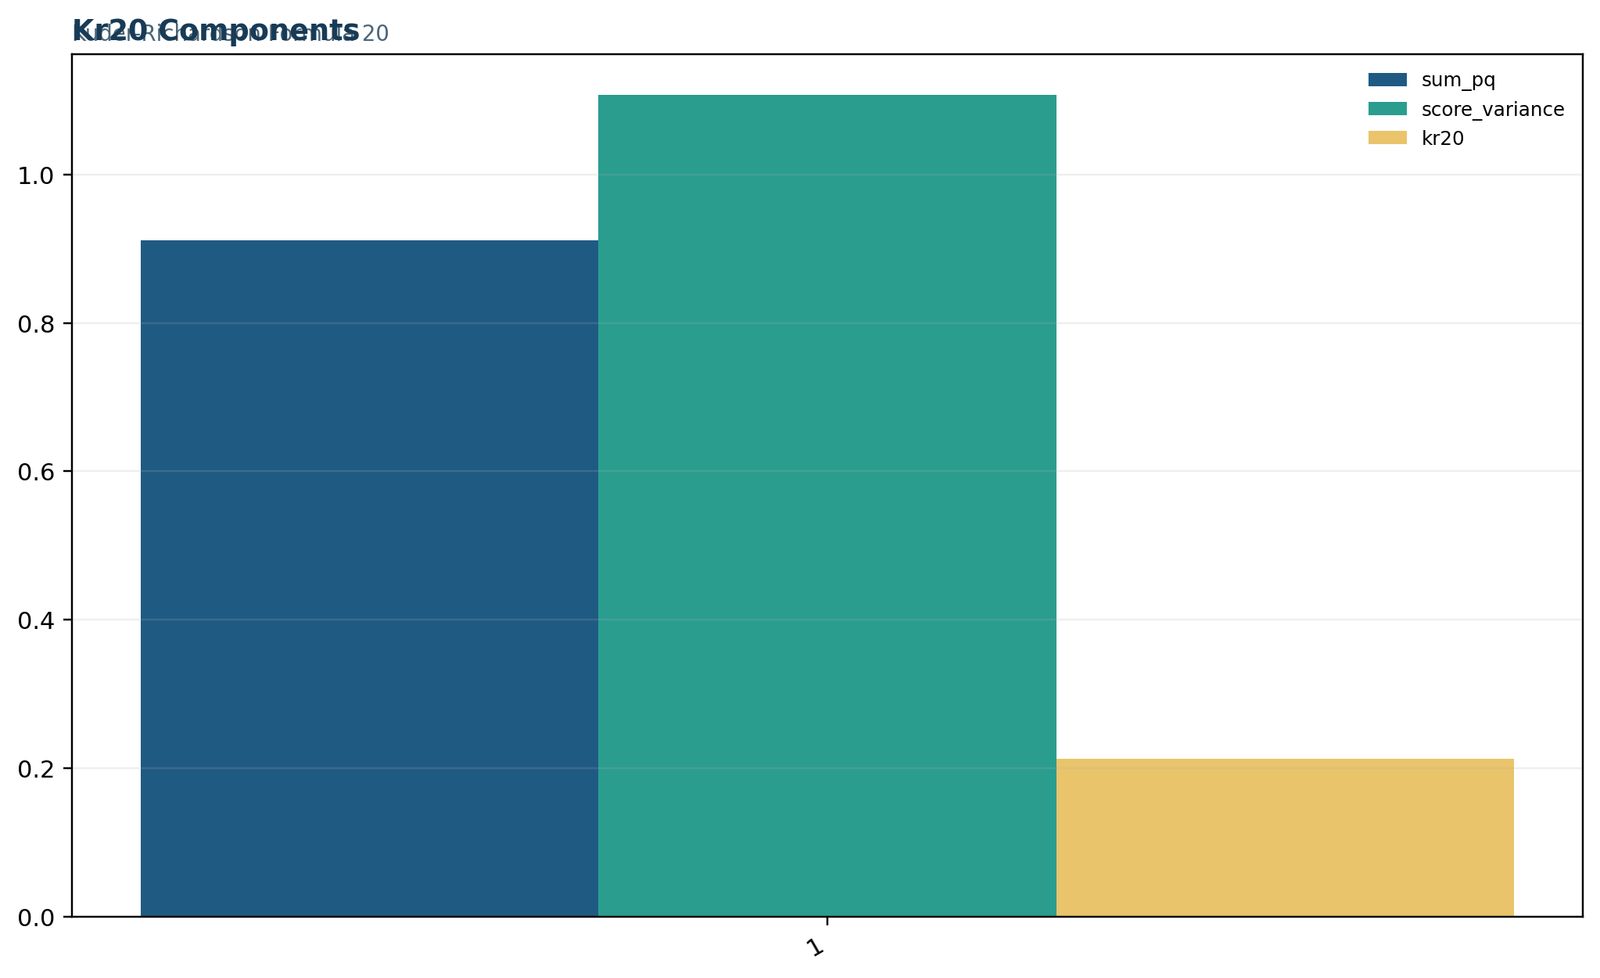
Python chart 4: KR-20 components
The component ledger contains Σp q = 0.910786, total-score variance = 1.106945 and KR-20 = 0.212649. The small difference between item-variance sum and total variance indicates limited shared covariance.
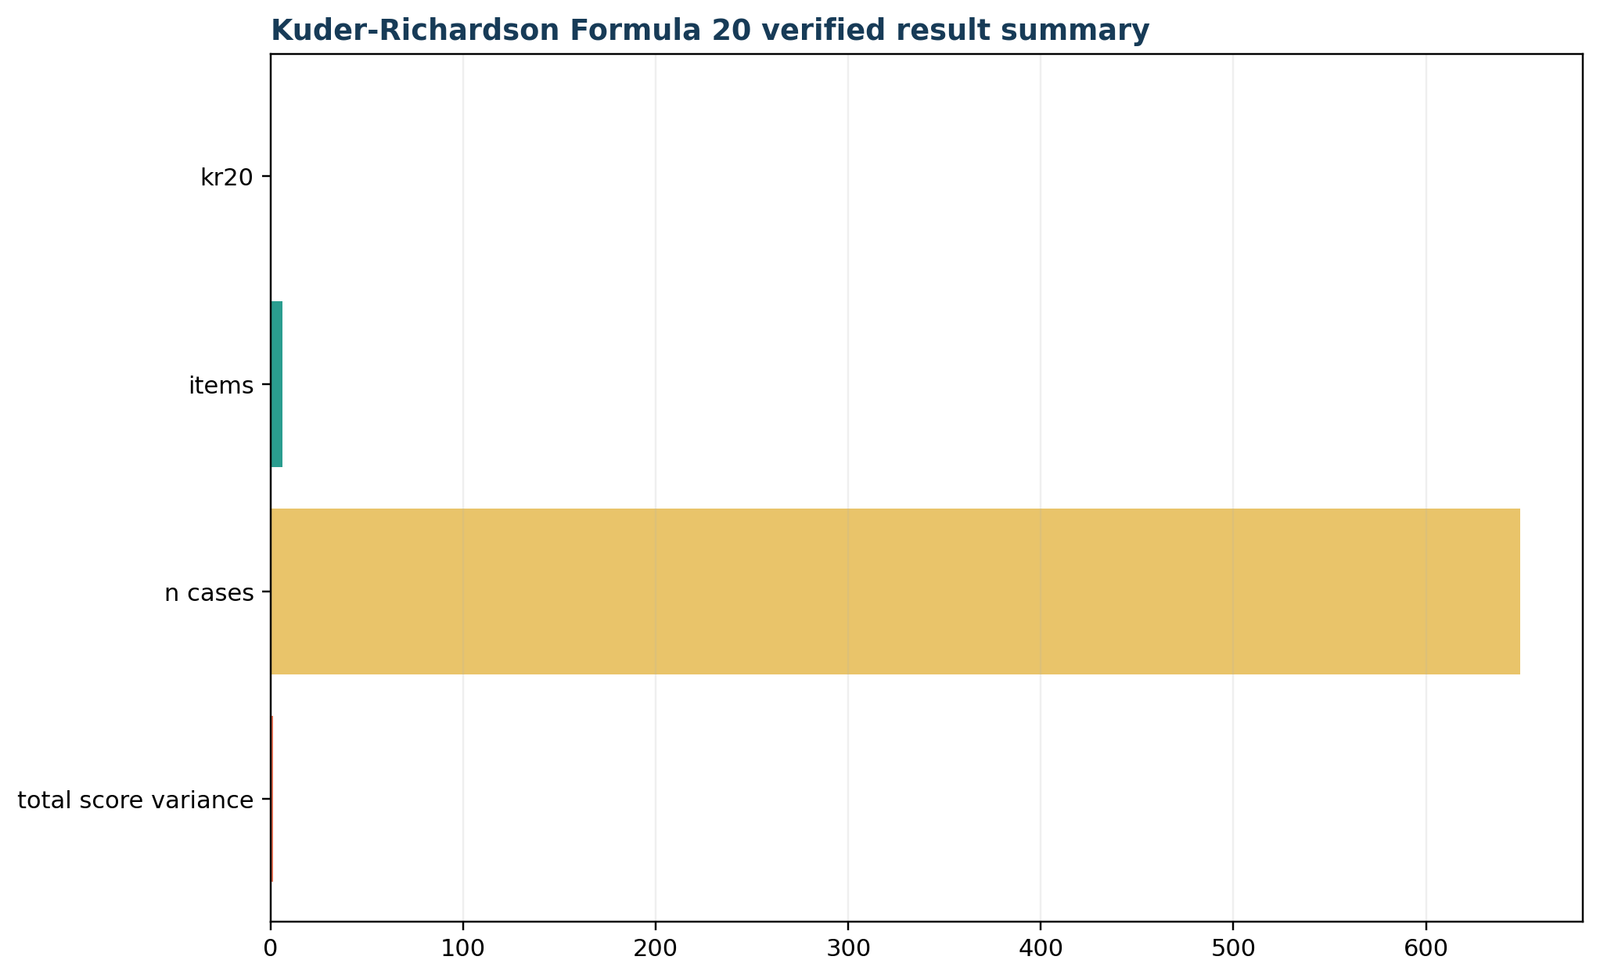
Python chart 5: Verified result summary
The final summary confirms 649 cases, six items, variance = 1.106945 and KR-20 = 0.212649. Read the exact labels because case count, item count, variance and reliability are expressed on different scales.
The primary-metrics figure establishes reproducibility. The item-difficulty figure explains why the p q terms differ. The score-distribution figure verifies the allowable 0-to-6 range. The components figure shows the direct formula inputs, and the final summary provides a compact audit. Together, the charts make the Kuder Richardson Formula 20 analysis traceable from item coding to final interpretation.
Python calculations should retain full precision internally and round only for display. A published coefficient of .213 is sufficient for interpretation, but the downloadable report keeps 0.21264912139527564 so that Excel and R comparisons can be checked without rounding ambiguity.
Kuder Richardson Formula 20 in R: calculation and five charts
The R workflow independently reproduces the coefficient and every principal component.
df <- read.csv("dataset.csv")
items <- c("schoolsup_b", "famsup_b", "paid_b",
"activities_b", "higher_b", "internet_b")
X <- na.omit(df[items])k <- ncol(X)
p <- colMeans(X)
q <- 1 - p
total <- rowSums(X)
kr20 <- (k / (k - 1)) * (1 - sum(p * q) / var(total))
cat("n =", nrow(X), "
")
cat("k =", k, "
")
cat("KR-20 =", format(kr20, digits = 12), "
")
Because all six variables are dichotomous, this direct calculation should agree with raw Cronbach’s alpha apart from rounding and implementation details. Standardized alpha is a different coefficient because it is calculated from standardized item relationships.
The independent R report confirms Kuder Richardson Formula 20 = 0.212649121395276, k = 6, N = 649 and total-score variance = 1.10694515779262. The tiny last-digit differences are ordinary floating-point display differences. The chart sequence follows the same first-wide-then-paired layout so that the Python and R sections can be compared directly.
R chart 1: Primary metrics confirmation
The R analysis independently reproduces the four primary metrics. Agreement with Python and Excel demonstrates that item selection, binary coding and total-score variance are aligned.
R chart 2: Item p, q and p q confirmation
R confirms each item-specific probability term. The unequal p values support using KR-20 rather than an equal-difficulty approximation such as KR-21.
R chart 3: Total-score frequencies confirmation
R reproduces all 649 score totals. The modal total is 3 with 252 cases, followed by 4 with 159 and 2 with 145.
R chart 4: Formula component confirmation
R confirms Σp q = 0.910786 and score variance = 1.106945 before applying the 6/5 correction factor.
R chart 5: Cross-software result summary
The R summary confirms the same substantive decision: KR-20 is approximately .213 and the proposed six-item composite has weak internal consistency.
Independent implementation is important because reliability calculations are sensitive to variance divisors, missing-data rules, transposed matrices and accidental inclusion of non-item columns. Matching Kuder Richardson Formula 20 values across Python and R provides a stronger quality check than reproducing a rounded number in one environment.
The R output also reinforces that coefficient interpretation depends on item content. No software can transform heterogeneous variables into a coherent construct. The role of verification is to establish that the low result is real, after which measurement theory determines the appropriate response.
Kuder Richardson Formula 20 SPSS workflow and output interpretation
For dichotomous items, raw alpha is the SPSS route to the KR-20-equivalent coefficient.
SPSS does not need a separate menu labeled Kuder Richardson Formula 20. For items coded 0 and 1, Analyze → Scale → Reliability Analysis with Model = Alpha applies the same covariance logic. Place only the intended dichotomous item variables in the Items box and request item, scale, correlation and scale-if-item-deleted statistics.
Prepare coding
Recode no to 0 and yes to 1 in new variables.
Open analysis
Select Analyze, Scale and Reliability Analysis.
Add items
Move the six binary variables into the Items box.
Choose output
Request descriptives, inter-item correlations and scale if item deleted.
Interpret jointly
Read alpha with item statistics, covariance and score distribution.
The SPSS Case Processing Summary confirms 649 valid cases and 0 excluded. Reliability Statistics reports raw alpha = .211, standardized alpha = .229 and six items. The Item Statistics table reports means equal to the yes proportions: .10, .61, .06, .49, .89 and .77 after rounding.
The Inter-Item Correlation Matrix contains only small relationships. The mean inter-item correlation is .047, the minimum is -.030 and the maximum is .094. The Item-Total Statistics table shows corrected item-total correlations from .047 to .130 and alpha-if-deleted values from .157 to .222. These tables explain the weak Kuder Richardson Formula 20 result more fully than the Reliability Statistics table alone.
| SPSS output | What to verify | Worked result | Interpretive role |
|---|---|---|---|
| Case Processing Summary | Valid and excluded rows | 649 valid, 0 excluded | Defines the analyzed sample |
| Reliability Statistics | Raw alpha, standardized alpha, item count | .211, .229, 6 | Overall consistency |
| Item Statistics | Means and standard deviations | Means .06 to .89 | Binary endorsement and variance |
| Inter-Item Matrix | Direction and magnitude | -.030 to .094 | Explains weak covariance |
| Item-Total Statistics | Corrected r and alpha if deleted | .047 to .130; .157 to .222 | Locates item-level weakness |
| Scale Statistics | Mean and variance of total | Mean 2.92; variance 1.107 | Checks the formula denominator |
The SPSS output includes a subtitle-length warning because the supplied subtitle exceeds the software’s 60-character limit. That formatting warning does not affect the calculations. For future production syntax, shorten the subtitle while preserving the full analysis title in the public report.
When reporting SPSS results, describe the value as alpha for dichotomous items or the SPSS analogue of KR-20, and state the variance-convention difference if comparing to a manually calculated 0.212649. The practical interpretation remains the same.
Kuder Richardson Formula 20 Excel calculation and worked workbook
A formula-driven worksheet makes every p, q, p × q and total-score term auditable.
The downloadable Excel workbook contains six organized worksheets: Guide, Data_Input, Working, Calculations, Diagnostics and Reporting. It documents the design, stores the original yes/no variables, converts them to binary scores, calculates row totals, reproduces Kuder Richardson Formula 20 and compares the workbook result with the independently verified Python and R values.
| Worksheet | Purpose | Key content | Audit value |
|---|---|---|---|
| Guide | Method documentation | Formula, variables, source rows and workbook map | Defines scope before calculation |
| Data_Input | Raw source variables | 649 rows of six yes/no columns | Preserves original values |
| Working | Binary transformations | Six 0/1 items and row total | Shows row-level lineage |
| Calculations | Formula ledger | k, N, score variance and KR-20 | Reproduces exact result |
| Diagnostics | Assumptions and checks | Item-specific p q, row count and method scope | Prevents generic workbook output |
| Reporting | Cross-software comparison | Workbook and verified reference differences | Confirms numerical agreement |
A transparent manual Excel layout uses one column per item and one row per respondent. Calculate p with AVERAGE over each binary column, q as 1-p and p q as p*q. Sum the six p q cells. Create a total-score column with SUM across the six item cells and calculate its sample variance with VAR.S. Then apply:
Use cell references rather than typed constants so that the Kuder Richardson Formula 20 result updates when data change. Keep the item count in a labeled cell and verify that the total-score range includes exactly the analyzed respondent rows.
The workbook reports 0.21264912139527659, differing from the verified reference by less than 10-15. The total-score variance difference is also at floating-point rounding level. This agreement demonstrates that the workbook formulas are linked correctly rather than containing hard-coded final values.
Excel analysts should avoid using VAR.P in one workbook and VAR.S in another without documentation. They should also avoid blank cells that SUM silently treats as zero when the intended rule is to exclude incomplete cases. Add explicit completeness checks before totals are calculated.
The Kuder Richardson Formula 20 workbook is especially useful for teaching because p, q, p q and total variance remain visible. Software functions are faster, but formula transparency helps reviewers identify why a coefficient differs across platforms.
KR-20 vs KR-21 and Cronbach’s alpha
The coefficients are related, but their assumptions and data requirements differ.
The Kuder Richardson Formula 20, Kuder Richardson Formula 21 and Cronbach’s alpha are related, but they are not interchangeable in every application. The two Kuder–Richardson formulas are designed for dichotomous items, whereas alpha is written for general item scores. KR-20 uses each item’s observed p × q term; KR-21 replaces those item-specific terms with a stronger equal-difficulty assumption.
Kuder Richardson Formula 20 is commonly described as the dichotomous-item form of Cronbach’s alpha. Both statistics compare the sum of item variances with the variance of the total score and apply the same k/(k-1) length adjustment. For a 0/1 item, the variance can be written from p and q, which gives KR-20 its familiar notation.
When every si2 is computed with the same divisor convention as sX2, substituting the binary item variances yields the KR-20 result.
The worked files display a small numerical difference: exact KR-20 = 0.212649, while SPSS reports raw alpha = .211. This difference is caused by finite-sample variance scaling. The exact pipeline uses p q for item variance and VAR.S-style total-score variance. SPSS uses sample covariance conventions for both item and total variance. Multiplying each p q term by n/(n-1) produces an alpha of approximately 0.211125, which rounds to .211.
| Result | Value | Variance convention | Conclusion |
|---|---|---|---|
| Verified KR-20 | 0.212649 | p q item terms with sample total variance | Very weak |
| Finite-sample alpha analogue | 0.211125 | Sample-adjusted item and total variances | Very weak |
| SPSS displayed alpha | 0.211 | Sample covariance matrix, rounded | Very weak |
| SPSS standardized alpha | 0.229 | Correlation matrix | Very weak |
The difference of about .0015 is not substantively important, but the reporting convention should be stated when analysts expect exact cross-software equality. Rounding both values to two decimals gives .21. The independent conclusion is identical: the items do not support a reliable single scale.
The Cronbach’s Alpha guide explains raw versus standardized alpha, item deletion and covariance interpretation in detail. Standardized alpha is higher here because it gives each item equal variance and uses the average inter-item correlation. Even .229 remains far below common reliability targets.
Use Kuder Richardson Formula 20 when the binary p and q formulation is useful for item analysis and test reporting. Use the general alpha formula when items have more than two numerical categories or when the covariance matrix is the natural computational starting point. Neither coefficient should be described as proof that a scale is unidimensional.
The Kuder-Richardson family includes more than one formula. Kuder Richardson Formula 20 uses the observed piqi value for every item. KR-21 uses the mean total score to approximate the sum of item variances and implicitly assumes that items have similar difficulty. Because real tests often contain varied item difficulties, KR-20 is generally preferred when item-level data are available.
KR-20
Requires item-level p values, permits unequal difficulty, and directly reflects the observed binary variance of each item. It is the appropriate choice for this worked dataset because p ranges from .060 to .894.
KR-21
Uses only k, the mean total score M and total-score variance. Its equal-difficulty approximation can be poor when p values differ greatly.
Using k = 6, mean total = 2.9245 and variance = 1.106945 gives an illustrative KR-21 value of approximately -0.4251. The negative approximation is not evidence that the verified Kuder Richardson Formula 20 calculation is wrong. It shows that the equal-difficulty simplification is unsuitable for a set in which the endorsement proportions vary from about .06 to .89 and the covariance structure is weak.
KR-21 is sometimes presented as a quick estimate when only the test mean, variance and item count are available. That convenience does not justify using it when item data exist. Modern software can calculate KR-20 directly, and the item-level output is valuable for identifying extreme difficulties and weak item-total relationships.
Both formulas concern internal consistency within one administration. Neither replaces test-retest reliability, alternate-form reliability or inter-rater agreement. The choice between KR-20 and KR-21 is a choice about the item-variance model, not a choice between different reliability designs.
The worked example is particularly instructive because the item difficulties are visibly unequal. Kuder Richardson Formula 20 preserves that information, while KR-21 compresses it into one mean and produces a misleading result. The comparison should be reported as a methodological lesson rather than as a competition between coefficients.
Kuder Richardson Formula 20 compared with other reliability methods
Choose the method that matches the item scale, score purpose and measurement model.
Selecting a reliability coefficient begins with the score structure and the intended inference. The Kuder Richardson Formula 20 is the natural classical-test-theory coefficient for a unidimensional set of 0/1 items, but alternative methods may be more appropriate for ordinal ratings, continuous items, multidimensional tests, rater agreement, or stability across occasions.
A reliable Python or R workflow should expose the intermediate quantities rather than returning only one coefficient. For Kuder Richardson Formula 20, save the analyzed item names, number of valid rows, p and q values, p q table, total-score frequency table, total-score variance and final coefficient. This audit trail makes coding and denominator differences visible.
Python workflow
Import the data into a rectangular table, select only the six intended item columns and map “yes” to 1 and “no” to 0. Validate that each column’s unique nonmissing values are a subset of (0, 1). Apply the chosen complete-case rule, calculate the column means to obtain p, subtract from 1 for q, multiply p by q and sum the products.
Create a row total, inspect its frequencies and calculate the sample variance with the intended degrees-of-freedom setting. Substitute k, Σp q and the total variance into Kuder Richardson Formula 20. Export full-precision metrics and human-readable rounded values separately.
Python should also check that k is at least 2, that the total variance is positive and that no item is constant. A constant item has p q = 0 and contributes no discrimination.
R workflow
Read the dataset, select the item columns and recode the character categories to numeric 0/1. Confirm the dimensions and complete-case count. Use column means for p, calculate q and p q, then create row sums for the total score.
R’s standard variance function uses the sample divisor n-1. Apply the same documented convention used in the comparison ledger. Calculate Kuder Richardson Formula 20, construct item and score-frequency tables and save the exact result.
When using a package function, verify its source formula and missing-data behavior. Package labels such as KR20 or alpha may use different finite-sample scaling. A manual formula check prevents silent convention changes.
Cross-software agreement should include more than the final coefficient. Confirm k = 6, N = 649, p values, score frequencies and variance = 1.106945. If the coefficient differs, compare the case set first, then the total-score variance divisor, then the item-variance convention. These three checks resolve most discrepancies.
The correlation in Python guide and correlation in R guide provide supporting workflows for the item relationships behind Kuder Richardson Formula 20. The public article avoids exposing long code blocks, while the downloadable reports preserve the reproducible software record.
A browser-based Kuder Richardson Formula 20 calculator should do more than request a coefficient-ready number. The most useful design accepts either raw 0/1 data, item yes/correct counts with a common sample size, or direct p values plus total-score variance. It then calculates q, p q, Σp q, the length correction and the final KR-20 value.
Required inputs
Required outputs
Input validation should reject k below 2, p values outside 0 to 1, negative counts, inconsistent sample sizes and total-score variance less than or equal to zero. When raw data are uploaded, every nonmissing item value should be checked for binary coding. Constant items should be flagged because p q = 0 and they cannot discriminate among respondents.
The calculator should distinguish Kuder Richardson Formula 20 from KR-21 and Cronbach’s alpha. It may offer the SPSS-style sample-adjusted alpha analogue as an additional result, but it should label the variance convention explicitly rather than presenting small differences as contradictions.
For the worked inputs, the calculator should return k = 6, Σp q = 0.9107860618, total-score variance = 1.1069451578 and KR-20 = 0.2126491214. A verification status should compare the recalculated result with the expected reference within a small tolerance.
The live KR-20 Calculator and the broader Statistical Calculators collection provide reusable browser tools. The article and downloadable files remain necessary because a calculator output without item context cannot establish that the proposed score is meaningful.
Diagnostics, item difficulty and common KR-20 mistakes
Use item-level evidence to explain the coefficient and guide defensible revision.
A complete Kuder Richardson Formula 20 analysis goes beyond the final coefficient. Item endorsement, item variance, total-score distribution, item-total relationships, inter-item correlations, item deletion, coding direction and construct coverage all help explain why the coefficient is high or low and whether revision is statistically and substantively justified.
In educational testing, p is the proportion of respondents answering an item correctly. A high p indicates an easy item and a low p indicates a difficult item. In the worked Kuder Richardson Formula 20 example, the variables are yes/no contextual indicators rather than knowledge questions, so p should be interpreted as the proportion endorsing “yes.” The mathematics is identical, but the substantive label changes.
| Item | Yes | No | p | q | p q | Distribution reading |
|---|---|---|---|---|---|---|
| schoolsup | 68 | 581 | .1048 | .8952 | .0938 | Yes is uncommon |
| famsup | 398 | 251 | .6133 | .3867 | .2372 | Moderately balanced |
| paid | 39 | 610 | .0601 | .9399 | .0565 | Yes is very uncommon |
| activities | 315 | 334 | .4854 | .5146 | .2498 | Almost maximally variable |
| higher | 580 | 69 | .8937 | .1063 | .0950 | Yes is very common |
| internet | 498 | 151 | .7673 | .2327 | .1785 | Yes is common |
The largest possible p q value for a binary item is .25 at p = .50. Activities is almost perfectly balanced and contributes .249786. Family support contributes .237174. Paid classes contributes only .056481 because the yes category is rare. Extreme items can still be important, but they have less variance available to covary with the total.
Item difficulty and item discrimination answer different questions. p describes how often the keyed category occurs. A corrected item-total correlation describes whether the item distinguishes respondents with higher and lower scores on the rest of the test. In this example, higher-education intention has a high p of .893683 but the largest corrected item-total correlation, .130, is still weak. Activities has maximal variance but a corrected item-total correlation of only .057. Variability alone does not create internal consistency.
The corrected item-total correlation guide provides the item-rest diagnostic that should accompany Kuder Richardson Formula 20. Frequency tables and item proportions should be checked first, then item-rest relationships, inter-item correlations and alpha if deleted. This sequence prevents a single reliability coefficient from hiding restricted range or miskeyed items.
After recoding the six variables, each respondent receives a total score equal to the number of yes responses. The observed distribution contains all possible scores from 0 through 6. The mean is 2.9245, the sample standard deviation is 1.05211 and the sample variance used in the verified Kuder Richardson Formula 20 calculation is 1.106945.
| Total score | Frequency | Percent | Cumulative percent | Interpretation |
|---|---|---|---|---|
| 0 | 5 | 0.8% | 0.8% | No endorsed conditions |
| 1 | 57 | 8.8% | 9.6% | One endorsed condition |
| 2 | 145 | 22.3% | 31.9% | Two endorsed conditions |
| 3 | 252 | 38.8% | 70.7% | Modal score |
| 4 | 159 | 24.5% | 95.2% | Second most common score |
| 5 | 27 | 4.2% | 99.4% | Five endorsed conditions |
| 6 | 4 | 0.6% | 100.0% | All six endorsed |
The distribution is unimodal and centered near 3. Seventy percent of respondents score 3 or lower, while about 29.3% score 4 or higher. Only nine respondents occupy the two extreme endpoints, which means the total is not dominated by floor or ceiling scores. Nevertheless, the presence of total-score variability does not guarantee reliability. The items can produce a spread of totals even when they represent different domains.
Variance supports calculation
Kuder Richardson Formula 20 requires positive total-score variance. If every respondent had the same total, the denominator would be zero and the coefficient would be undefined. Here, variance = 1.106945 provides a valid denominator.
Shape does not prove a scale
A visually reasonable histogram cannot establish unidimensionality or internal consistency. Distribution shape describes the total score, while KR-20 describes the covariance structure that created it. Both are needed, but they answer different questions.
Analysts should also review score frequency tables for impossible values. With six binary items, every total must be an integer from 0 to 6. Values outside that range indicate coding or summation errors. The descriptive statistics guide, standard deviation guide and variance guide provide supporting explanations.
For the worked data, the total distribution confirms correct range and case count. The low Kuder Richardson Formula 20 value therefore reflects weak item coherence rather than a constant or invalid total-score column.
Component-level audit and common mistakes
The verified component chart compares Σp q = 0.910786, total-score variance = 1.106945 and Kuder Richardson Formula 20 = 0.212649. The important comparison is not the visual height of unrelated units but the ratio of the sum of item variances to the variance of the total. That ratio is approximately 0.82279.
After multiplication by 6/5, the coefficient becomes approximately 0.212649.
The gap between total variance and summed probability variances is about 0.196159 under the displayed convention. That gap reflects the combined covariance contribution in the total-score identity. Because the gap is modest, the six items do not move together strongly enough to support a reliable one-score interpretation.
Item variance
Each p q term measures how much one binary item varies. Items close to p = .50 contribute more variance; extreme items contribute less.
Shared covariance
Positive covariance raises total-score variance beyond the sum of the item variances. This shared movement is the source of internal consistency.
Length adjustment
The k/(k-1) factor corrects for the finite number of items but cannot overcome a weak covariance structure.
The SPSS inter-item matrix confirms the component interpretation. Correlations are generally small: school support with family support = .075; family support with paid classes = .094; activities with internet access = .082; higher-education intention with school support and family support = .085. Several pairs are near zero or slightly negative. Even statistically significant pairs have small effect magnitudes.
The correlation assumptions guide, correlation in Python guide, correlation in R guide and correlation in SPSS guide explain the pairwise relationships behind reliability. For binary variables, Pearson correlation is equivalent to the phi coefficient when both variables use 0/1 coding.
A defensible Kuder Richardson Formula 20 report should therefore include the coefficient, k, N, item proportions, total-score variance and at least one item-level diagnostic. Reporting only .213 would conceal why the coefficient is low.
How to report Kuder Richardson Formula 20 in APA style
Report the coefficient, sample, item count, scoring, software agreement and substantive limitation.
An APA-style reliability statement should identify the score, number of dichotomous items, sample size and coefficient. When the item set is unusual or the result is low, add item-difficulty or endorsement range, total-score variance and the practical consequence. Use the leading-decimal convention commonly applied to coefficients: KR-20 = .213 rather than 0.213.
Concise results sentence
The six-item binary composite demonstrated weak internal consistency, KR-20 = .213, N = 649.
Expanded results paragraph
A Kuder Richardson Formula 20 analysis was conducted for six dichotomously scored indicators using 649 complete records. Item endorsement proportions ranged from .060 to .894, and the total-score variance was 1.107. Internal consistency was weak, KR-20 = .213. Corrected item-total correlations ranged from .047 to .130, and deleting any one item did not produce an acceptable coefficient. Because the indicators represented distinct support, activity, aspiration and access domains, their unweighted sum was not retained as a dependable one-dimensional scale.
If SPSS is the primary software, the report may add: SPSS coefficient alpha for the same binary items was .211, with standardized alpha = .229. When both values are shown, explain that the small difference reflects variance-divisor conventions. Do not imply that one software package failed.
A complete Kuder Richardson Formula 20 report should avoid three common errors. First, do not state that the coefficient proves validity. Second, do not call .213 acceptable merely because all rows were processed successfully. Third, do not delete an item only because alpha if deleted is slightly higher. Here, the maximum deleted-item alpha is approximately .222 and remains poor.
Include in the method
Describe dichotomous coding, selected items, treatment of missing values, software and variance convention. State whether p represents correct responses or yes endorsements.
Include in the results
Report KR-20, k, N, total-score descriptives, item-proportion range and the decision about score use. Add item-total findings when the coefficient is low.
The hypothesis testing guide can help separate coefficient estimation from null-hypothesis language. Reliability is usually interpreted through magnitude and uncertainty rather than a simple significant/non-significant decision. The null hypothesis printed in some workflow reports is a formal statement, but the practical measurement decision should not be reduced to a p-value.
For transparent reporting, preserve the Python, R, SPSS and Excel files used to produce the public result. Reproducibility strengthens the credibility of Kuder Richardson Formula 20 interpretation and enables another analyst to trace every value.
Kuder Richardson Formula 20 PDF, Excel and software downloads
Open the verified Python, R, SPSS and Excel resources used in the worked analysis.
The four downloadable files provide the calculation record behind the public Kuder Richardson Formula 20 interpretation. The Python and R reports contain exact metrics, item tables, total-score frequencies and figures. The SPSS output contains case processing, reliability statistics, item statistics, the inter-item matrix, item-total statistics, scale statistics, frequencies and correlation checks. The Excel workbook preserves the formula-driven calculation and cross-software comparison ledger.
RR PDF reportIndependent R calculation with matching coefficient, variance and case count.Open file →
SPSPSS PDF outputReliability Statistics, item-total diagnostics, frequencies and correlation matrix.Open file →
XLWorked Excel analysisFormula-driven p q terms, total-score variance, diagnostics and reporting ledger.Open file →
Use the files together. The exact coefficient confirms the arithmetic; the item tables explain the result; the SPSS diagnostics show that no single deletion solves the problem; and the workbook enables cell-level auditing. This combined record is more informative than one reliability screenshot.
Related Salar Cafe guides
These internal resources connect Kuder Richardson Formula 20 with the broader reliability workflow. Descriptive pages document the score distribution, correlation pages explain item relationships, alpha and item-total pages provide companion diagnostics, and agreement pages distinguish item consistency from rater reliability.
Kuder Richardson Formula 20 learning resources and related methods
Internal guides for reliability, item analysis and software implementation.
These internal learning resources extend the Kuder Richardson Formula 20 analysis without sending readers away from the site. They cover the closest reliability coefficients, item diagnostics and interpretation concepts needed to build a stronger binary test.
Reliability coefficient guides
Compare KR-20 with Cronbach’s Alpha, McDonald’s Omega, Split-Half Reliability and the Spearman–Brown Formula.
Item-quality diagnostics
Use Item-Total Correlation, Reliability Analysis and Descriptive Statistics to investigate weak covariance, restricted item variance and problematic coding.
Software-specific workflows
Continue with Reliability Analysis in Python, Reliability Analysis in R and Reliability Analysis in SPSS.
Kuder Richardson Formula 20 FAQs
Answers to the practical questions most often missed in short reliability explanations.
These Kuder Richardson Formula 20 FAQs answer the practical questions most often omitted from short reliability summaries: when KR-20 is appropriate, why binary coding matters, how p × q works, why KR-20 and alpha agree for dichotomous items, how KR-21 differs, and what to do when the coefficient is low.
What is Kuder Richardson Formula 20?
Kuder Richardson Formula 20 is an internal-consistency coefficient for a set of dichotomously scored items. It uses each item’s proportion scored 1, its complementary proportion scored 0 and the variance of the total score.
What does KR-20 measure?
It measures how consistently binary items contribute to one proposed total score within one administration. It does not directly measure validity, stability across time or agreement between raters.
What is the Kuder Richardson Formula 20 equation?
KR-20 = k/(k-1)[1 – Σp_iq_i/s_X²], where k is the number of items, p_i is the proportion scored 1, q_i = 1-p_i and s_X² is total-score variance.
What is a good KR-20 value?
Values around .70 are often used as a preliminary reference for low-stakes group research, while higher reliability may be required for important individual decisions. The acceptable value depends on purpose, test length, content and consequences.
How should KR-20 = .213 be interpreted?
A value of .213 indicates very weak internal consistency. In the worked example, the six contextual variables should not be combined as one dependable scale without substantive redevelopment.
Is Kuder Richardson Formula 20 the same as Cronbach’s alpha?
For binary items they express the same covariance logic when the same variance convention is used. Small finite-sample differences can occur when p q terms are combined with sample total variance while software alpha uses sample-adjusted item variances.
Why does SPSS show .211 instead of .212649?
SPSS uses sample covariance conventions and rounds the result. The exact KR-20 pipeline uses p q item terms with sample total variance. The approximately .0015 difference is a variance-divisor convention and does not change the interpretation.
Can Kuder Richardson Formula 20 be negative?
Yes. A negative value means the average covariance structure is contradictory, often because of miskeyed items, reverse scoring that was not applied or a highly heterogeneous item set.
What is the difference between KR-20 and KR-21?
KR-20 uses every item’s actual p q value and allows unequal difficulty. KR-21 estimates item variance from the test mean and assumes similar difficulty, so it is a rougher approximation.
When should KR-21 not be used?
Avoid KR-21 when item-level data are available or when item difficulties vary substantially. In the worked data, p ranges from .060 to .894, making the equal-difficulty approximation unsuitable.
Does Kuder Richardson Formula 20 require normality?
No. The items are binary and the coefficient is variance based. However, sampling uncertainty and downstream inference may require additional assumptions.
Does KR-20 require unidimensionality?
A meaningful one-score interpretation requires at least a dominant common dimension. KR-20 itself does not test unidimensionality, so content review and factor analysis are needed.
Related statistical guides
Continue with the reliability methods and item-analysis concepts most closely connected to KR-20.