
Inter Rater Reliability: 7 Essential Steps, ICC Formula and Worked Example
Inter rater reliability describes how consistently two or more raters, graders, observers, judges, clinicians, or measurement occasions assign scores to the same targets. This complete guide explains the ICC(2,1) two-way random-effects absolute-agreement model, assumptions, ANOVA components, confidence intervals, interpretation, and a verified worked analysis of G1, G2, and G3 scores for 649 targets in Python, R, SPSS, and Excel.
Absolute agreement
Single-rater reliability
649 targets × 3 raters
Python + R + SPSS + Excel
Single-rater absolute agreement was good and statistically different from zero.
The worked inter rater reliability analysis treated G1, G2, and G3 as three randomly selected quantitative graders or scoring occasions applied to the same 649 targets. The two-way random-effects absolute-agreement coefficient was ICC(2,1) = 0.8588468392, with a 95% CI from 0.836 to 0.878. The corresponding test was F(648, 1296) = 20.246, p < .001. This indicates that one randomly selected rater would provide good absolute agreement for these scores.
What does inter rater reliability measure?
A variance-based answer to an agreement question, not a percentage of identical ratings.
Inter rater reliability is the degree to which different raters produce the same or sufficiently similar judgments when they evaluate the same cases under the same scoring rules. A “target” may be a student, patient, interview, product, photograph, written response, behavior episode, medical image, laboratory specimen, or any other unit being rated. A “rater” may be a human judge, an instrument, a scoring occasion, a trained observer, or a measurement procedure that is treated as exchangeable with comparable raters.
Reliability is about reproducibility
When targets genuinely differ, dependable ratings should preserve those differences. A high-scoring target should generally remain high across raters, and a low-scoring target should generally remain low. However, rank ordering alone is not enough for absolute agreement. Two raters can correlate almost perfectly while one consistently assigns scores two points higher. An absolute-agreement inter rater reliability model counts that systematic offset as disagreement.
This distinction is why the Pearson correlation is not a complete substitute for an intraclass correlation coefficient. Correlation measures association between two variables; ICC measures how much observed score variation is attributable to stable target differences under a specified rating design.
Reliability is not validity
Strong inter rater reliability means raters are consistent with one another, not necessarily that they are correct. Several raters can apply the same flawed rubric and agree closely. Validity asks whether the ratings measure the intended construct and support the intended interpretation. Reliability is necessary for many uses of scores because unstable ratings cannot support precise decisions, but reliability alone does not establish accuracy, fairness, or causal meaning.
The distinction also prevents a common reporting error: a large ICC should not be described as proof that the scoring instrument is valid. It indicates reproducibility under the sampled targets, raters, scoring conditions, model definition, and unit of analysis.
Inter rater reliability in psychology, education, health, and qualitative research
In psychology, inter rater reliability may describe agreement on diagnostic ratings, behavior codes, interview categories, symptom severity, or observational scales. In education it may describe agreement among essay graders, performance assessors, classroom observers, or scoring occasions. In health research it may evaluate repeated measurements by clinicians or readers. In qualitative research it can document the dependability of coding decisions, although categorical coding often calls for Cohen’s kappa, weighted kappa, or Fleiss kappa rather than a continuous-score ICC.
The correct statistic follows the measurement scale and design. Continuous or approximately continuous ratings commonly use an intraclass correlation coefficient. Two nominal raters commonly use Cohen’s kappa. More than two nominal raters may use Fleiss kappa. Ordered categories may use weighted kappa. Selecting the statistic before looking at the result protects the analysis from choosing whichever coefficient appears largest.
When should you use inter rater reliability?
Use the decision logic below before selecting an ICC or kappa coefficient.
A formal inter rater reliability study is appropriate when ratings contribute to research variables, diagnoses, grades, eligibility decisions, quality-control classifications, clinical outcomes, audit findings, or machine-learning labels. The analysis is especially important when scoring requires judgment rather than a purely mechanical reading.
Define the target
State exactly what unit is rated and whether each target receives the same number of ratings.
Define the rater population
Decide whether conclusions apply only to named raters or to a wider population of comparable raters.
Choose agreement type
Use absolute agreement when identical scores matter; use consistency only when systematic offsets are acceptable.
Choose the unit
Decide whether decisions use one rating or the mean of several ratings.
Estimate uncertainty
Report the confidence interval, not only the point estimate.
Use ICC when
The outcome is numeric, the same targets are rated repeatedly, and the scientific question concerns reproducibility of individual or averaged scores. ICC is appropriate for interval-like ratings, counts with adequate spread, many-point scales, and measurements where differences between score values are meaningful.
Use kappa when
The outcome is categorical. Cohen’s kappa fits two raters assigning nominal categories; Fleiss kappa extends to multiple raters; weighted kappa recognizes the ordering and distance among categories. These methods answer a different question from continuous-score inter rater reliability.
Use agreement plots when
The practical size and direction of pairwise differences matter. A Bland–Altman plot can reveal bias, changing variability, and limits of agreement that a single ICC may conceal. ICC and agreement plots often complement rather than replace one another.
Examples of questions that require an agreement study
| Applied question | Recommended design focus | Likely statistic |
|---|---|---|
| Would another essay grader assign nearly the same numeric score? | Same essays, multiple exchangeable graders, exact scores matter | Two-way random absolute-agreement ICC |
| Do two clinicians assign the same diagnosis category? | Two raters, nominal outcome | Cohen’s kappa |
| Do several observers use an ordered severity scale similarly? | Multiple raters, ordinal categories | Weighted multi-rater approach or ordinal agreement model |
| Is the mean of three judges dependable? | Average of k ratings is the operational score | Average-measure ICC |
| Do two devices track patients similarly but show a fixed offset? | Agreement and systematic bias both matter | Absolute-agreement ICC plus Bland–Altman analysis |
Inter rater reliability assumptions: conditions to check
The method is model-based and design-dependent, not assumption-free.
The assumptions for inter rater reliability should be evaluated at the design, data, and model levels. A numerically correct ICC can still answer the wrong question if raters are treated as random when they are fixed, if average-measure reliability is reported for a process that uses one rater, or if consistency is reported when exact scores determine decisions.
Design requirements
Data and model conditions
Does inter rater reliability require normality?
Classical ICC inference is derived from an ANOVA model and is most straightforward when model residuals are reasonably well behaved. Exact normality of every rater column is not the central requirement. With a large balanced sample such as 649 targets, the point estimate is generally driven by mean-square components, while the confidence interval and F test rely more directly on distributional assumptions. Severe skew, heavy tails, influential outliers, or a bounded scale concentrated at an endpoint should prompt sensitivity checks, robust alternatives, transformations when meaningful, or bootstrap confidence intervals.
Normality should not be used as an automatic gatekeeper. More important questions are whether the scale is suitable for an ICC, whether raters applied it comparably, and whether variance components represent the intended population. For ordinal categories with only a few levels, a weighted kappa may be more defensible than treating category codes as continuous scores.
Why target heterogeneity matters
Inter rater reliability is a ratio of stable between-target variance to total observed variance under the selected model. If a sample includes very diverse targets, between-target variance can be large and the ICC can rise even when absolute discrepancies are clinically or educationally important. If a sample is highly homogeneous, the ICC can be modest despite small raw differences because there is little target variance to preserve. This is not a mathematical defect; it means reliability must be interpreted for the sampled target population and, when practical tolerances matter, supplemented with absolute-error summaries.
Inter rater reliability hypotheses and ICC model choice
State the target, rater population, agreement definition, and measurement unit before calculating the coefficient.
There is no single universal ICC. A complete inter rater reliability report identifies the model, type, and definition. The worked analysis uses a two-way random-effects, absolute-agreement, single-measure coefficient commonly written as ICC(2,1).
Worked model
Two-way random · absolute · single
Targets and raters are modeled as random effects. A fixed increase or decrease in one rater’s scores is treated as disagreement. Reliability refers to one randomly selected rater.
Three decisions behind the notation
Null and alternative hypotheses
Null hypothesis
H0: the population single-rater absolute-agreement ICC equals zero. Under this null, ratings do not preserve dependable target differences beyond the rater and residual structure represented by the model.
The SPSS procedure tests the coefficient against a specified value of zero. In this example the observed F statistic is much larger than expected under the null, so the null is rejected.
Alternative hypothesis
H1: the population single-rater absolute-agreement ICC is greater than zero. A significant result shows evidence of nonzero reliability, but statistical significance is not the same as acceptable practical reliability.
With 649 targets, even an ICC too small for operational use could be statistically significant. The point estimate and confidence interval therefore carry more practical information than the p-value alone.
Consistency versus absolute agreement
A consistency ICC removes systematic rater-level differences from the definition of error. It can be appropriate when one rater is known to be stricter but relative rankings are the only concern. An absolute-agreement ICC includes those differences as disagreement. In this worked example the rater means are 11.399 for G1, 11.570 for G2, and 11.906 for G3. Because the scientific interpretation treats those columns as interchangeable ratings, the upward mean shift is relevant and the absolute-agreement definition is appropriate.
| Decision | Question answered | Worked choice |
|---|---|---|
| One-way or two-way | Did every target receive the same raters, and should rater effects be modeled? | Two-way |
| Fixed or random raters | Does inference apply only to these raters or to comparable raters? | Random |
| Consistency or agreement | Are systematic score-level differences acceptable? | Absolute agreement |
| Single or average | Will decisions use one rater or the mean of k raters? | Single is primary; average is supplementary |
Inter rater reliability formula: ICC(2,1) and ANOVA components
The two-way random absolute-agreement coefficient combines target, rater, and residual mean squares.
The ICC(2,1) formula expresses inter rater reliability as the proportion of score variation attributable to persistent differences among targets after accounting for residual disagreement and systematic rater effects.
Here MSR is the target or row mean square, MSC is the rater or column mean square, MSE is the residual mean square, k is the number of raters, and n is the number of targets.
Two-way random-effects model
Yij is the rating for target i from rater j; μ is the grand mean; Ti is the target effect; Rj is the rater effect; and Eij contains target-by-rater interaction and residual error.
The model does not assume every disagreement has the same cause. It summarizes the observed structure through variance components. Absolute agreement retains the rater-level component in the denominator because a strict or lenient rater changes the score a target receives.
F test for nonzero reliability
The numerator degrees of freedom are n − 1 = 648. The denominator degrees of freedom are (n − 1)(k − 1) = 1296.
The F test asks whether between-target variation exceeds residual variation. The resulting p-value is smaller than .001. Public reporting should use p < .001 rather than p = 0, even though software may display .000 or the numerical calculation may underflow to zero.
Exact ANOVA components from the worked data
| Source | Sum of squares | df | Mean square | Role in ICC(2,1) |
|---|---|---|---|---|
| Targets (rows) | 15,606.296867 | 648 | 24.083791 | Stable differences among targets |
| Raters (columns) | 86.330765 | 2 | 43.165383 | Systematic scoring-level differences |
| Residual / interaction | 1,541.669235 | 1,296 | 1.189560 | Unexplained disagreement and target-by-rater interaction |
The rater mean square is large relative to the residual mean square, reflecting systematic mean differences across G1, G2, and G3. Because the absolute-agreement formula divides the rater component by the large target count, the adjustment is present but does not overwhelm the substantial target signal.
Average-measure inter rater reliability
Averaging three ratings reduces random disagreement. This is why the reliability of the mean of G1, G2, and G3 is higher than the reliability of one randomly selected rating. Report ICC(2,k) only when the average of k ratings is the score actually used.
Inter rater reliability example: G1, G2, and G3 ratings
A complete 649-target, three-rater worked analysis with exact values.
The worked inter rater reliability dataset contains 649 rows and three numeric rating columns: G1, G2, and G3. Each row is one target, and each column is treated as one rater or scoring occasion. The original educational labels are retained so every software output can be reconciled exactly.
Variables used
| Variable | Role | Scale | Observed range |
|---|---|---|---|
| subject_id | Target identifier | Integer | 1–649 |
| G1 | Rater/scoring occasion 1 | Numeric score | 0–19 |
| G2 | Rater/scoring occasion 2 | Numeric score | 0–19 |
| G3 | Rater/scoring occasion 3 | Numeric score | 0–19 |
Raw descriptive statistics
| Rater | N | Mean | SD | Minimum | Maximum |
|---|---|---|---|---|---|
| G1 | 649 | 11.3991 | 2.7453 | 0 | 19 |
| G2 | 649 | 11.5701 | 2.9136 | 0 | 19 |
| G3 | 649 | 11.9060 | 3.2307 | 0 | 19 |
The rater means increase from G1 to G3, so exact agreement is a stricter criterion than consistency. The mean difference is not enormous relative to the score range, but it is systematic. ICC(2,1) appropriately includes this rater-level shift in the denominator rather than treating it as harmless.
Pairwise associations are high but are not the final answer
All three pairwise Pearson correlations are strong and positive. These correlations show that targets tend to retain their relative positions across scoring occasions. They do not test exact agreement because a fixed shift in all scores leaves a correlation unchanged. The lower single-rater ICC of 0.859 compared with Cronbach’s alpha of 0.951 illustrates why internal consistency and absolute-agreement inter rater reliability should not be treated as synonyms.
Seven-step worked process
Arrange the matrix
Place targets in rows and the same three raters in columns.
Check completeness
Confirm 649 complete rows and no excluded cases.
Set the model
Select two-way random, absolute agreement, single measure.
Compute ANOVA
Obtain target, rater, and residual mean squares.
Calculate and report
Report ICC, CI, F, degrees of freedom, and practical meaning.
Inter rater reliability statistics, results and interpretation
All software outputs reconcile to the same ICC, confidence interval, F test, and practical conclusion.
The primary inter rater reliability result is the single-measure absolute-agreement ICC because the question concerns one randomly selected rater. The average-measure result is reported separately to show the reliability of averaging all three ratings.
Primary verified result
95% CI [0.836, 0.878] · F(648, 1296) = 20.246 · p < .001
The coefficient indicates good single-rater absolute agreement for the sampled targets and rater design. Both confidence limits remain well above zero and within the range commonly described as good, while the interval also shows that the population value is unlikely to be above 0.90 under this design.
Primary result table
| Coefficient | Estimate | 95% CI | F | df1 | df2 | p-value | Meaning |
|---|---|---|---|---|---|---|---|
| ICC(2,1), absolute agreement | 0.858846839 | 0.836–0.878 | 20.245973 | 648 | 1296 | < .001 | Reliability of one randomly selected rater |
| ICC(2,3), average measures | 0.948 | 0.939–0.956 | 20.245973 | 648 | 1296 | < .001 | Reliability of the average of three ratings |
Cross-platform reconciliation
| Platform | Model specification | ICC(2,1) | F statistic | Verification |
|---|---|---|---|---|
| Python | Manual two-way ANOVA mean squares and ICC formula | 0.8588468392 | 20.2459730213 | Pass |
| R | Manual two-way random absolute-agreement calculation | 0.8588468392 | 20.2459730213 | Pass |
| SPSS | RELIABILITY /ICC=MODEL(RANDOM) TYPE(ABSOLUTE) | 0.859 | 20.246 | Pass after display rounding |
| Excel | Auditable sums of squares, mean squares, and direct formula | 0.8588468392 | 20.2459730213 | Pass |
The exact calculations agree to machine precision in Python, R, and Excel. SPSS displays rounded values in the ICC table. Agreement across implementations confirms the row/column orientation, target count, rater count, mean-square decomposition, and absolute-agreement formula.
How to interpret the inter rater reliability result
Point-estimate interpretation
ICC(2,1) = 0.858847 means that the rating design preserves a large share of the modeled score variation as stable differences among targets, while the remaining variation reflects rater-level disagreement and residual error. On commonly used descriptive bands, values from 0.75 to 0.90 are often called good. These bands are conventions rather than universal decision rules.
The value should not be translated mechanically into “85.9% agreement.” ICC is a variance ratio under a model, not the percentage of identical ratings. Nor does it mean that 85.9% of ratings are correct.
Confidence-interval interpretation
The 95% confidence interval from 0.836 to 0.878 shows the precision of the estimated single-rater reliability. The lower bound is especially important for planning. If an application requires reliability of at least 0.80, the interval supports that requirement in this sample. If an application requires at least 0.90, the interval does not support it.
Interpreting the lower bound rather than the point estimate alone guards against overconfidence. Larger and more representative samples improve precision but do not correct a poorly chosen model or unrepresentative raters.
Common descriptive bands for ICC values
| ICC range | Common descriptive label | How to use the label responsibly |
|---|---|---|
| Below 0.50 | Poor | Usually inadequate for individual-level decisions; investigate design, training, and scale limitations. |
| 0.50 to 0.75 | Moderate | May support exploratory or group-level uses but can be insufficient for high-stakes individual decisions. |
| 0.75 to 0.90 | Good | Often acceptable, subject to the lower CI bound, consequences of error, and discipline-specific standards. |
| Above 0.90 | Excellent | Often preferred for high-stakes individual measurement, but still requires validity and bias checks. |
These cutoffs are not laws. A reliability requirement should reflect the decision being made, the cost of disagreement, the number of ratings averaged, and available alternatives. A coefficient of 0.86 may be strong for exploratory observational research and insufficient for a clinical threshold that determines irreversible treatment.
Why average-measure reliability is higher
The average of three ratings smooths idiosyncratic disagreement, producing ICC(2,3) = 0.948. This does not prove that each individual rater is excellent. It means a scoring protocol that always averages three comparable raters is more dependable than one that uses a single rater. If the real-world workflow assigns only one rater, reporting only the average-measure coefficient would materially overstate operational inter rater reliability.
Why Cronbach’s alpha is not the same result
Cronbach’s alpha equals 0.951 for the three columns, and standardized alpha is 0.953. Alpha summarizes internal consistency and is closely related to an average-measure consistency concept under particular assumptions. It does not directly answer whether one randomly selected rater produces the same absolute score as another. The single-measure absolute-agreement ICC of 0.859 is the more relevant primary coefficient for this question. The distinction is explained further in the site’s Cronbach’s alpha guide.
Inter rater reliability in Python: complete calculation and charts
A reproducible two-way random absolute-agreement analysis with five verified graphics.
The Python workflow calculates inter rater reliability directly rather than relying on a black-box coefficient. This makes the target, rater, and residual mean squares auditable and allows exact comparison with R, SPSS, and Excel.
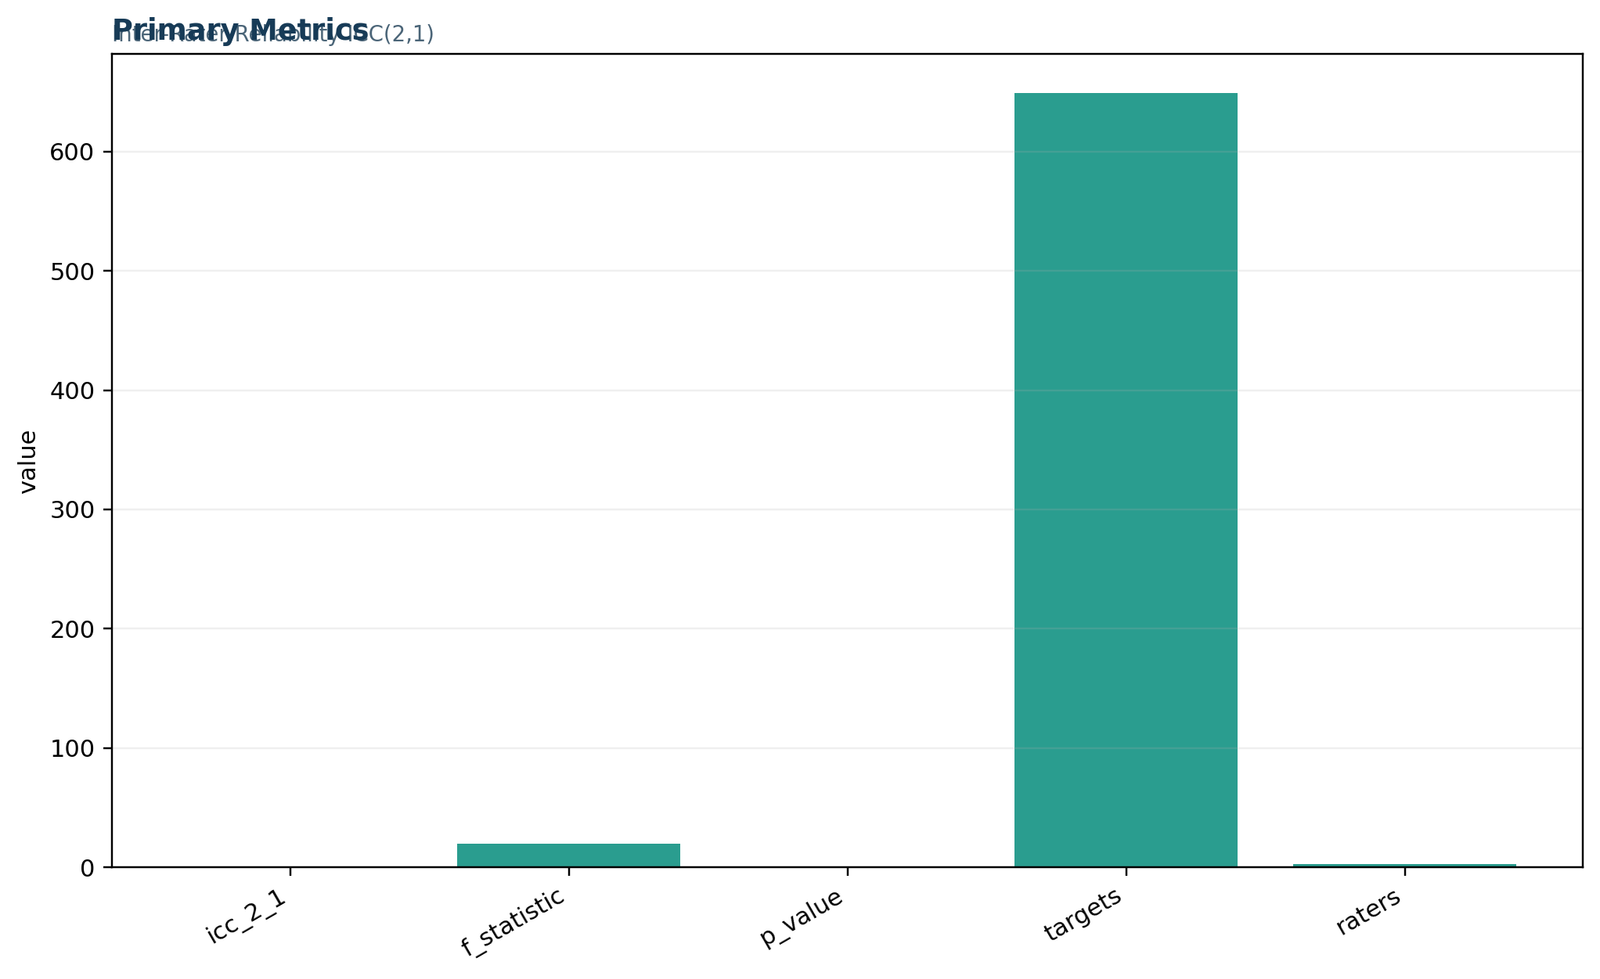
Python chart 1: primary metrics
The chart places the verified ICC, F statistic, p-value representation, target count, and rater count in one summary view.
The most important statistical values are ICC(2,1) = 0.858846839 and F = 20.245973. The count of 649 targets is numerically much larger than the coefficient, so a common vertical scale visually compresses the ICC bar. The chart should therefore be read from its labels rather than by comparing bar heights across quantities that use different units.
The p-value is shown numerically as zero because floating-point evaluation underflows at an extremely small probability. The public statistical conclusion remains p < .001. The chart also confirms the balanced design: 649 targets and three raters.
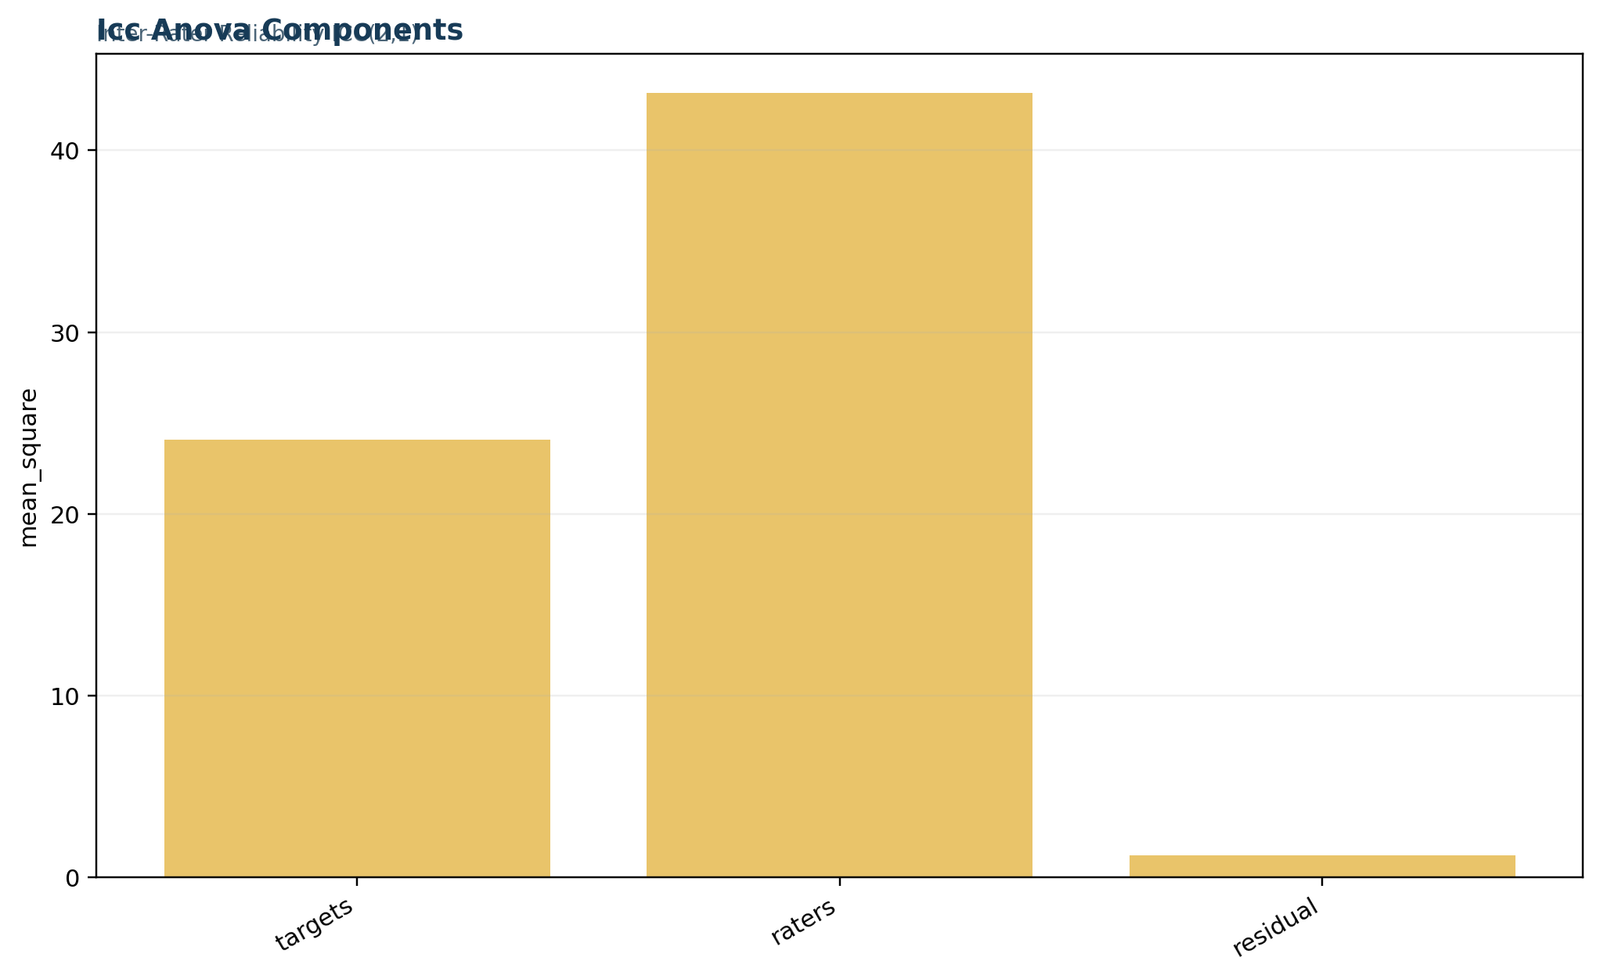
Python chart 2: ICC ANOVA components
Target, rater, and residual mean squares show the variance structure behind ICC(2,1).
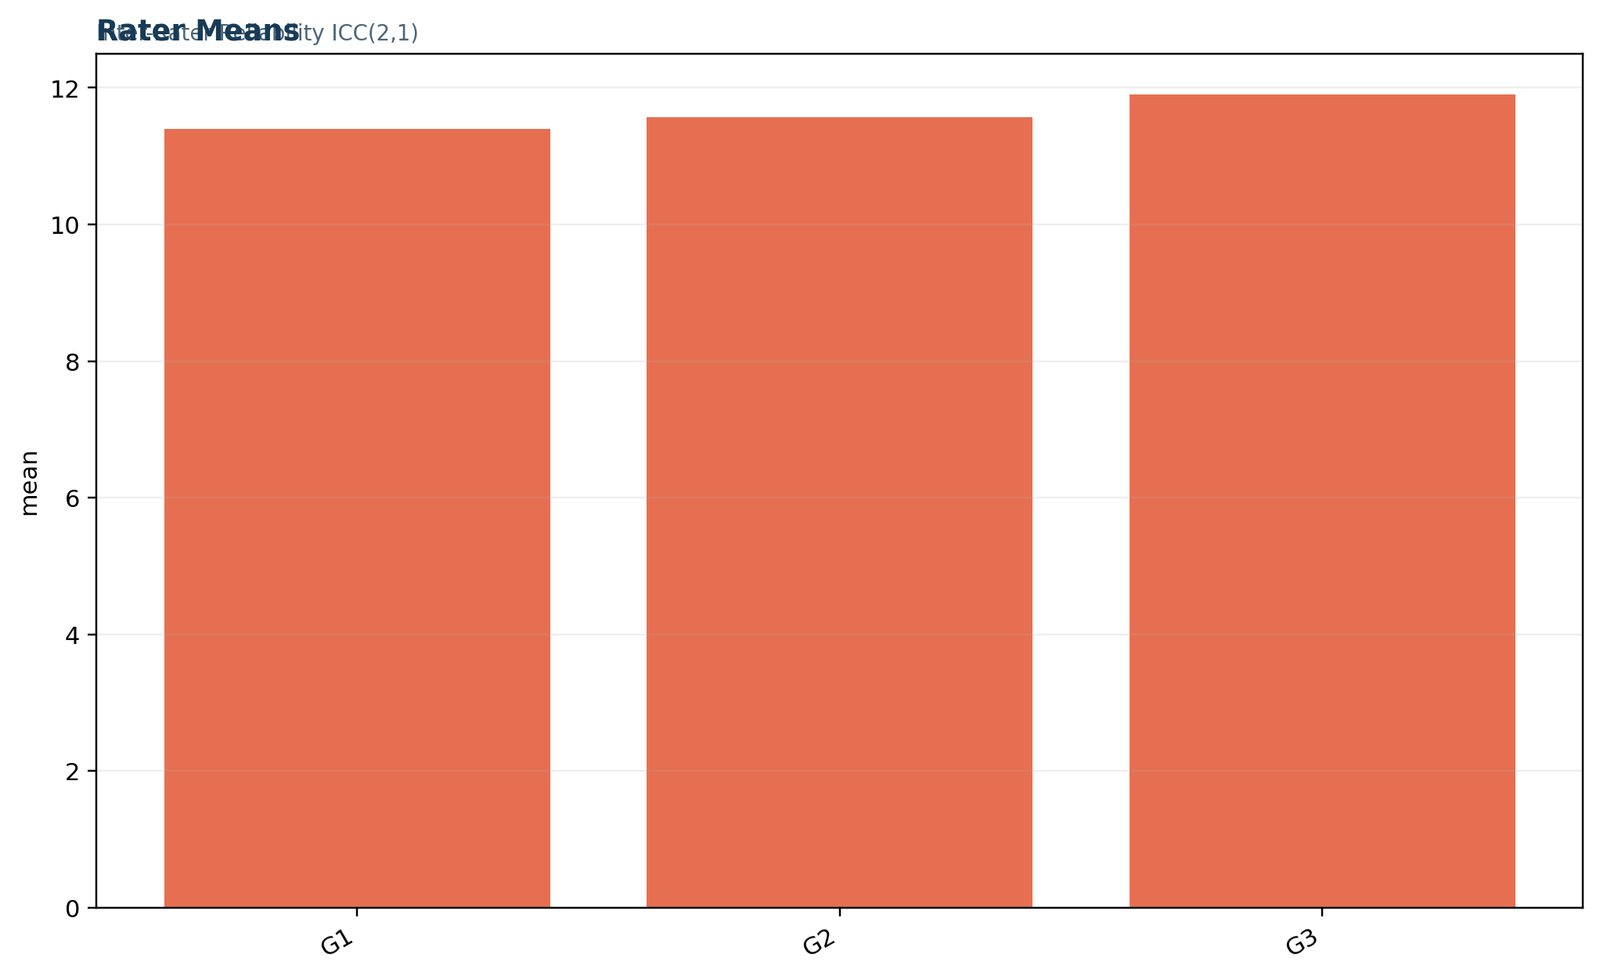
Python chart 3: rater means
Mean scores increase from G1 to G2 and G3, documenting a systematic scoring-level difference.
The ANOVA components are MS targets = 24.083791, MS raters = 43.165383, and MS residual = 1.189560. The small residual mean square relative to the target mean square supports dependable target differentiation. The nontrivial rater mean square shows that the three scoring occasions differ systematically in level, which is why an absolute-agreement model is more demanding than a consistency model.
The rater-means chart provides the direction of that systematic effect. G1 averages 11.3991, G2 averages 11.5701, and G3 averages 11.9060. The difference between G1 and G3 is about 0.507 score units. Absolute-agreement inter rater reliability treats this shift as part of disagreement instead of discarding it.
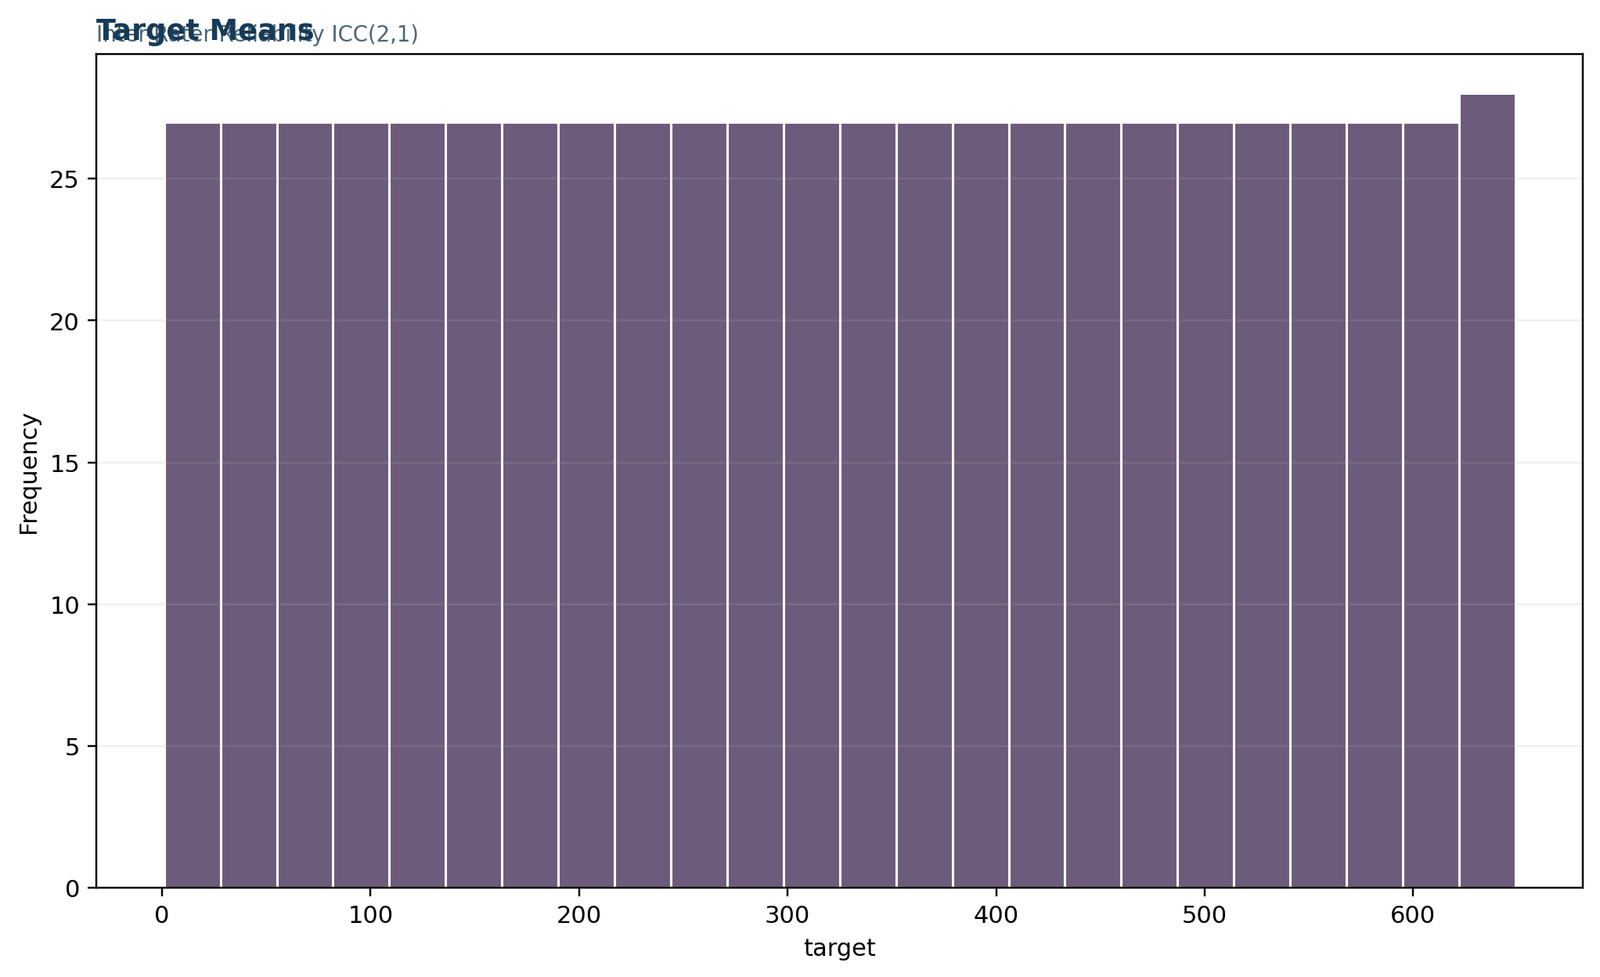
Python chart 4: target coverage and record distribution
The target-index histogram verifies broad, even coverage across the complete set of 649 target records.
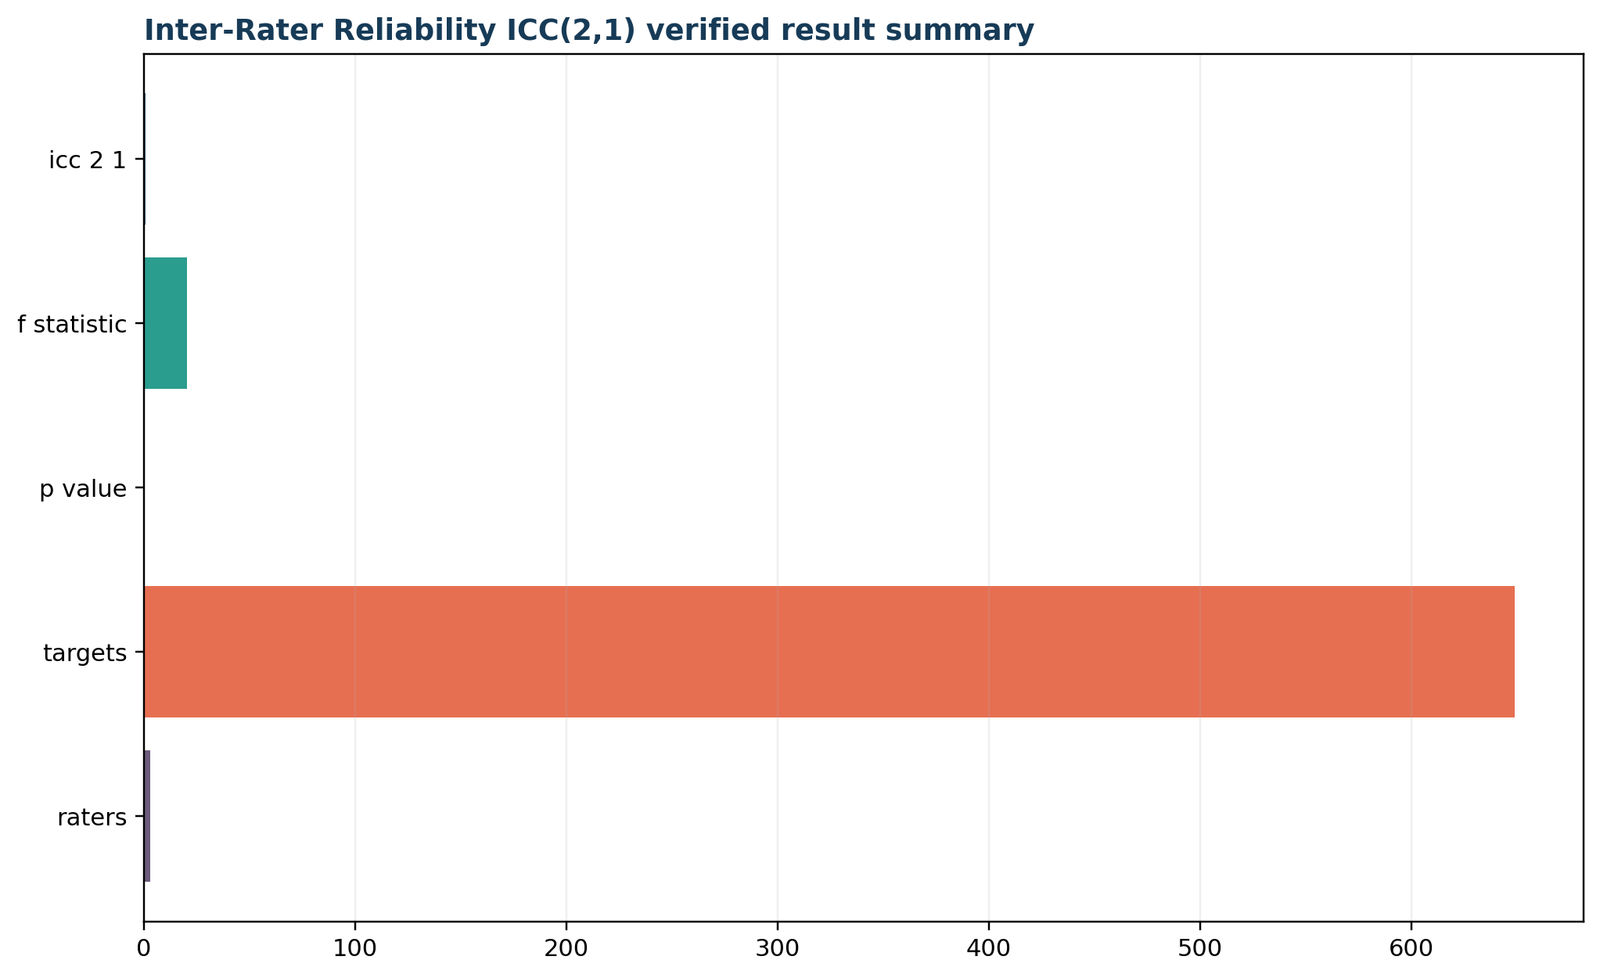
Python chart 5: verified result summary
The horizontal summary repeats the exact metrics used for the cross-software check.
The fourth image is best interpreted as a target-coverage check rather than a distribution of the mean ratings themselves. Its bins contain similar numbers of sequential target identifiers, showing that the full target range is represented in the generated workflow. Substantive score interpretation comes from the rater means, pairwise plots, and ANOVA components.
The verified summary reinforces that Python used 649 targets and three raters and obtained the same ICC and F statistic as the other platforms. Like the first chart, its count scale dominates the coefficient visually, so the printed values are the appropriate basis for interpretation.
Python code for ICC(2,1)
import numpy as np
import pandas as pd
from scipy.stats import fratings = pd.read_csv("dataset.csv")[["G1", "G2", "G3"]].dropna()
Y = ratings.to_numpy(dtype=float)
n, k = Y.shape
grand = Y.mean()
row_means = Y.mean(axis=1)
col_means = Y.mean(axis=0)
ss_rows = k * np.sum((row_means - grand) ** 2)
ss_cols = n * np.sum((col_means - grand) ** 2)
ss_total = np.sum((Y - grand) ** 2)
ss_error = ss_total - ss_rows - ss_cols
ms_rows = ss_rows / (n - 1)
ms_cols = ss_cols / (k - 1)
ms_error = ss_error / ((n - 1) * (k - 1))
icc_2_1 = (ms_rows - ms_error) / (
ms_rows + (k - 1) * ms_error + k * (ms_cols - ms_error) / n
)
f_stat = ms_rows / ms_error
p_value = f.sf(f_stat, n - 1, (n - 1) * (k - 1))
print(f"n={n}, k={k}")
print(f"MSR={ms_rows:.12f}, MSC={ms_cols:.12f}, MSE={ms_error:.12f}")
print(f"ICC(2,1)={icc_2_1:.12f}")
print(f"F={f_stat:.12f}, p={p_value:.6g}")
The direct calculation returns ICC(2,1) = 0.858846839219 and F = 20.245973021325. A production script should also calculate a confidence interval or use a validated reliability package, retain the model specification in the output, and test the matrix orientation before reporting the result.
Inter rater reliability in R: complete calculation and charts
The R workflow reproduces the Python and SPSS values and the same five result graphics.
The R analysis treats raters as random and systematic rater offsets as disagreement. This specification matches the intended ICC(2,1) definition of inter rater reliability, so its coefficient should match the Python, SPSS, and Excel results apart from display rounding.
R chart 1: primary reliability metrics
The primary panel summarizes ICC(2,1), the F ratio, the numerical p-value representation, and the dimensions of the rating matrix.
R confirms ICC(2,1) = 0.858846839 and F = 20.245973 for 649 targets rated in three columns. Because the graphic combines statistics and counts on one scale, the printed labels are more informative than the relative bar heights. The substantive conclusion is good single-rater absolute agreement with strong evidence that the population ICC exceeds zero.
The R report explicitly notes that ICC(2,1) penalizes systematic disagreement among random raters. This is the critical model statement that distinguishes the result from a consistency coefficient.
R chart 2: ANOVA mean-square components
The target, rater, and residual terms reproduce the exact denominator of the absolute-agreement ICC.
R chart 3: mean rating by rater
The plot documents the progressive mean increase across G1, G2, and G3.
The target mean square of 24.0838 is about twenty times the residual mean square of 1.1896, producing the F statistic of 20.246. The rater mean square of 43.1654 is larger than either, but its contribution to ICC(2,1) is scaled by the target count. This pattern shows why the formula must be evaluated rather than interpreting any one ANOVA component in isolation.
The R rater-means chart makes the absolute-agreement issue visible. Ratings rise from G1 through G3. A consistency coefficient would focus on whether targets remain ordered similarly; the chosen absolute-agreement coefficient also asks whether the score levels match.
R chart 4: target coverage
The record-index distribution confirms that all target ranges enter the analysis rather than a truncated subset.
R chart 5: verified result summary
The final panel records the same exact coefficient, test statistic, and matrix dimensions used by the independent checks.
The target coverage image is a workflow diagnostic, not a direct measure of score agreement. It verifies the full 649-row input. The verified summary then provides a compact audit point for matching the R output to Python and Excel.
When R packages are used, model labels can differ. The safest practice is to state the design in words—two-way random effects, absolute agreement, single measure—and verify the package’s documentation rather than relying only on a shorthand label.
R code for ICC(2,1)
dat <- read.csv("dataset.csv", stringsAsFactors = FALSE)
Y <- as.matrix(dat[, c("G1", "G2", "G3")])
Y <- Y[complete.cases(Y), , drop = FALSE]n <- nrow(Y)
k <- ncol(Y)
grand <- mean(Y)
row_means <- rowMeans(Y)
col_means <- colMeans(Y)
ss_rows <- k * sum((row_means - grand)^2)
ss_cols <- n * sum((col_means - grand)^2)
ss_total <- sum((Y - grand)^2)
ss_error <- ss_total - ss_rows - ss_cols
ms_rows <- ss_rows / (n - 1)
ms_cols <- ss_cols / (k - 1)
ms_error <- ss_error / ((n - 1) * (k - 1))
icc_2_1 <- (ms_rows - ms_error) /
(ms_rows + (k - 1) * ms_error + k * (ms_cols - ms_error) / n)
f_stat <- ms_rows / ms_error
p_value <- pf(f_stat, n - 1, (n - 1) * (k - 1), lower.tail = FALSE)
cat(sprintf("ICC(2,1) = %.12f
", icc_2_1))
cat(sprintf("F = %.12f, p = %.6g
", f_stat, p_value))
The R calculation returns the same ICC and F statistic to at least twelve decimal places. This direct approach is useful for auditing; a validated package remains helpful for confidence intervals, unbalanced designs, and alternative ICC definitions.
Inter rater reliability in SPSS: ICC workflow and output
SPSS reports the single- and average-measure coefficients, confidence intervals, and F test.
The SPSS inter rater reliability workflow uses the RELIABILITY procedure with a random-effects ICC model and an absolute-agreement definition. The valid-case table shows 649 included targets and zero exclusions.
SPSS menu path
Choose Analyze → Scale → Reliability Analysis. Move G1, G2, and G3 into the Items box. Open Statistics, request intraclass correlation coefficients, choose a two-way random model, select absolute agreement, request a 95% confidence interval, and retain both single and average measures in the output.
Menu labels vary slightly by SPSS version. The syntax is the clearest permanent record because it preserves the selected model and agreement type.
SPSS output to report
The Intraclass Correlation Coefficient table reports single measures = .859, 95% CI [.836, .878], and average measures = .948, 95% CI [.939, .956]. The F test is 20.246 with 648 and 1296 degrees of freedom, displayed significance .000. Report this as p < .001.
The output also reports alpha = .951 and pairwise correlations from .826 to .919. These values are useful diagnostics but do not replace the selected absolute-agreement ICC.
TITLE 'Inter Rater Reliability ICC Two One'.
SUBTITLE 'Random raters, absolute agreement, single measure'.RELIABILITY
/VARIABLES=G1 G2 G3
/SCALE('Random raters') ALL
/MODEL=ALPHA
/STATISTICS=DESCRIPTIVE SCALE CORR
/SUMMARY=TOTAL
/ICC=MODEL(RANDOM) TYPE(ABSOLUTE) CIN=95 TESTVAL=0.
MEANS TABLES=G1 G2 G3
/CELLS=COUNT MEAN STDDEV MIN MAX.
CORRELATIONS
/VARIABLES=G1 G2 G3
/PRINT=TWOTAIL NOSIG
/MISSING=PAIRWISE.
GRAPH /SCATTERPLOT(MATRIX)=G1 G2 G3.
How to read the SPSS tables
| SPSS table | Key values | Interpretation |
|---|---|---|
| Case Processing Summary | Valid 649; excluded 0 | The ICC uses every target with complete G1, G2, and G3 scores. |
| Reliability Statistics | Alpha .951; standardized .953 | High internal consistency, not the primary absolute-agreement result. |
| Item Statistics | Means 11.40, 11.57, 11.91 | Systematic mean differences are present across raters. |
| Intraclass Correlation Coefficient | Single .859; average .948 | Primary and averaged-score reliability under the selected model. |
| Inter-Item Correlation Matrix | .826 to .919 | Strong association, but exact agreement still requires the ICC. |
| Scatterplot Matrix | Strong positive linear clouds | Targets retain similar ordering, with some spread and low-score clusters. |
The scatterplot matrix visually supports strong association among all three score columns. It does not, by itself, distinguish consistency from absolute agreement. The ICC table supplies that design-specific answer.
Inter rater reliability in Excel: worked ICC calculation
The workbook exposes the targets-by-raters matrix, ANOVA components, formula, diagnostics, and verification ledger.
Excel can calculate inter rater reliability transparently when the rating matrix is balanced and formulas are carefully audited. The downloadable workbook contains Guide, Data_Input, Working, Calculations, Diagnostics, and Reporting sheets.
Workbook structure
Excel outputs
Excel formula pattern
Target mean (row 2):
=AVERAGE(B2:D2)Grand mean:
=AVERAGE(B2:D650)
Target sum of squares:
=3*SUMPRODUCT((E2:E650-$B$654)^2)
Rater sum of squares:
=649*SUMPRODUCT((B655:D655-$B$654)^2)
Residual sum of squares:
=Total_SS-Target_SS-Rater_SS
MS targets:
=Target_SS/(649-1)
MS raters:
=Rater_SS/(3-1)
MS residual:
=Residual_SS/((649-1)*(3-1))
ICC(2,1):
=(MS_Targets-MS_Residual)/(MS_Targets+(3-1)*MS_Residual+3*(MS_Raters-MS_Residual)/649)
F statistic:
=MS_Targets/MS_Residual
P-value:
=F.DIST.RT(F_Statistic,648,1296)
Cell references depend on the workbook layout, but the mathematical sequence should remain visible. Avoid hard-coding verified results into cells that are supposed to calculate them. A reliable workbook should show zero difference between the calculated coefficient and the independent reference.
Excel quality-control checks
Structural checks
Confirm that exactly three rater columns and 649 complete target rows are included. Ensure no header row enters the numeric range, formulas are filled through the final target, and row/column roles are not reversed. The row count should remain constant across every calculation sheet.
Numerical checks
Verify that total sum of squares equals target plus rater plus residual sums of squares within rounding tolerance. Confirm ICC = 0.8588468392 and F = 20.2459730213. Any discrepancy usually signals a range error, a denominator error, or accidental inclusion of missing/text cells.
Inter rater reliability in MATLAB and SAS
Equivalent workflows for readers who use matrix calculations or mixed-model software.
Inter rater reliability can be reproduced in MATLAB or SAS when the targets-by-raters design and ICC definition are kept explicit. The required model is two-way random effects, absolute agreement, single measure. The same 649 × 3 data matrix must produce ICC(2,1) = 0.858846839 when the ANOVA mean squares and formula are implemented correctly. A valid inter rater reliability calculation must preserve that model definition across platforms.
MATLAB matrix workflow
X = readmatrix("ratings.csv"); % rows = targets, columns = raters
[n,k] = size(X);
gm = mean(X,"all");
rowMeans = mean(X,2);
colMeans = mean(X,1);SSR = k * sum((rowMeans-gm).^2);
SSC = n * sum((colMeans-gm).^2);
SSE = sum((X-rowMeans-colMeans+gm).^2,"all");
MSR = SSR/(n-1);
MSC = SSC/(k-1);
MSE = SSE/((n-1)*(k-1));
icc21 = (MSR-MSE) / ...
(MSR+(k-1)*MSE+k*(MSC-MSE)/n);
The calculation should use the complete balanced rating matrix. Verify the output against MS targets = 24.083791, MS raters = 43.165383, and MS residual = 1.189560 before reporting the coefficient.
SAS mixed-model workflow
proc mixed data=ratings method=type3;

class target rater;

model score = / solution;

random target rater;

run;
Arrange the ratings in long form with one row per target–rater score. Extract the target, rater, and residual components or corresponding mean squares, then apply the absolute-agreement single-measure ICC formula. State the model in words because software labels alone can conceal whether systematic rater offsets count as disagreement.
Inter rater reliability compared with related statistics
Agreement, consistency, association, internal consistency, and measurement error answer different questions.
Choosing an inter rater reliability statistic requires matching the coefficient to the scale, number of raters, rater sampling, agreement definition, and intended score. The table below prevents common substitutions that can overstate reliability.
| Statistic or model | Best use | What it captures | Key limitation |
|---|---|---|---|
| ICC(2,1) | One quantitative rating from a random rater | Two-way random absolute agreement | Depends on target heterogeneity and model assumptions |
| ICC(2,k) | Mean of k quantitative ratings from random raters | Reliability of the average score | Overstates operational reliability if only one rater is used |
| ICC(3,1) | Named fixed raters under a two-way mixed design | Reliability limited to those raters; definition may be consistency or agreement | Does not generalize to a wider rater population |
| Cohen’s kappa | Two raters, nominal categories | Chance-corrected categorical agreement | Sensitive to prevalence and marginal distributions |
| Fleiss kappa | Multiple raters, nominal categories | Multi-rater chance-corrected agreement | Not designed for continuous ratings |
| Weighted kappa | Ordered categories | Partial credit for near agreement | Result depends on the weighting scheme |
| Percent agreement | Simple descriptive categorical summary | Observed exact matches | Does not adjust for chance and ignores disagreement severity |
| Pearson correlation | Linear association between two score sets | Rank/linear co-movement | Can be 1.0 despite a fixed score offset |
| Cronbach’s alpha | Internal consistency of a multi-item scale | Shared covariance among items | Not a direct single-rater absolute-agreement coefficient |
| Bland–Altman analysis | Pairwise measurement agreement | Bias and limits of agreement | Does not summarize multi-rater reliability in one ICC |
Inter versus intra rater reliability
Inter rater reliability
Compares different raters evaluating the same targets. It asks whether the measurement process is reproducible across people, devices, judges, or exchangeable scoring occasions. Rater selection and generalization are central design questions.
Intra rater reliability
Compares repeated ratings from the same rater, usually separated by time. It asks whether one rater is stable. Memory effects, learning, fatigue, and genuine target change must be controlled. The same ICC family can be used, but the design and interpretation differ.
Why Pearson correlation can mislead
Imagine Rater B always scores exactly five points higher than Rater A. The Pearson correlation is 1.00 because target ordering is perfectly preserved. Absolute agreement is poor because the score assigned to any target depends on the rater. ICC(2,1) detects this systematic offset through the rater mean square. This is the core reason a correlation coefficient should not be labeled an inter rater reliability coefficient without qualification.
Why the intraclass correlation coefficient has several pages on this site
Readers who need broader model selection can consult the ICC formula and interpretation guide and the concise intraclass correlation coefficient overview. The present article focuses specifically on the random-rater absolute-agreement application to inter rater reliability.
Diagnostics, sensitivity checks and common mistakes
A defensible analysis combines the coefficient with design checks, rater patterns, data inspection, and improvement procedures.
Diagnostics for inter rater reliability should examine the rating matrix before and after computing the ICC. The goal is not to search for reasons to discard an inconvenient result; it is to understand what produces agreement and disagreement.
Rater-level diagnostics
Target-level diagnostics
Worked-data diagnostic findings
| Diagnostic | Observed result | Implication |
|---|---|---|
| Complete cases | 649 of 649; no exclusions | No listwise-deletion change to the target population |
| Rater means | 11.399, 11.570, 11.906 | Small systematic upward shift across scoring occasions |
| Rater SDs | 2.745, 2.914, 3.231 | G3 is somewhat more dispersed |
| Pairwise correlations | .826 to .919 | Strong preservation of target ordering |
| Residual mean square | 1.189560 | Residual disagreement is small relative to target signal |
| Confidence interval | .836 to .878 | Good precision and a lower bound above .80 |
Negative ICC values
An estimated ICC can be negative when residual disagreement exceeds stable between-target variation. A negative estimate does not mean “negative reliability” in a substantive sense. It signals that the observed data provide no evidence of dependable target differentiation under the chosen model, and the process should be investigated. Some software truncates negative values in summaries; transparent reporting should preserve the estimate and explain the model.
Missing and unbalanced ratings
The direct balanced-ANOVA formulas in this article assume every target has all three ratings. Real studies may have different raters per target or missing cells. Deleting incomplete targets can waste information and introduce bias. Mixed-effects models or specialized reliability methods can estimate variance components from unbalanced data, but the estimand and assumptions must be described. A balanced ICC formula should not be applied to a ragged matrix by replacing missing values with zeros or column means.
Range restriction and transportability
If reliability is estimated only among very similar targets, between-target variance shrinks and the ICC can fall. If the sample deliberately includes extreme targets, the ICC can rise. Therefore, inter rater reliability does not transport automatically from one population to another. Report the target characteristics and score distribution so readers can judge whether the reliability estimate applies to their setting.
How to establish and improve inter rater reliability
Clarify the scoring construct
Define what is and is not being judged. Replace broad labels such as “quality” with observable indicators. Specify boundaries, exceptions, units, and the evidence required for each score. A rubric should reduce avoidable discretion without erasing legitimate expert judgment.
Use anchored examples
Provide representative examples at the low, middle, and high ends of the scale, including borderline cases. Explain why each example receives its score. Anchors make abstract score definitions operational and expose disagreements before production scoring begins.
Calibrate raters
Have raters independently score a common pilot set, compare decisions, discuss reasoning, and repeat until the intended rules are applied consistently. Calibration should focus on recurring disagreement patterns rather than forcing consensus on every unusual case.
Standardize conditions
Control the information available to raters, order of materials, scoring interface, time limits, measurement device, and opportunities for discussion. Blinding can prevent raters from being influenced by another score or an expected outcome.
Monitor drift
Agreement can deteriorate after initial training. Insert periodic duplicate cases, review control charts or rolling agreement estimates, and schedule recalibration when systematic offsets appear. Report whether reliability was checked only at baseline or throughout data collection.
Use adjudication correctly
Adjudication can produce a final consensus score, but consensus after discussion is not evidence of independent inter rater reliability. Estimate reliability from the original independent ratings, then describe adjudication as a separate data-resolution step.
Practical improvement workflow
| Observed problem | Likely cause | Corrective action | Diagnostic to repeat |
|---|---|---|---|
| One rater is consistently higher | Different threshold or scale calibration | Review anchors, retrain on score levels, verify units | Rater means and absolute-agreement ICC |
| Disagreement grows for high scores | Heteroscedastic error or unclear upper anchors | Add upper-range examples and inspect difference plots | Bland–Altman plot and residual spread |
| Only borderline cases disagree | Category boundaries are ambiguous | Refine decision rules and document tie-breaking evidence | Case-level disagreement table |
| Agreement declines over time | Rater drift, fatigue, or changing interpretation | Periodic blinded duplicates and recalibration | Reliability by time block |
| ICC is low in a homogeneous sample | Restricted target variance | Sample the intended full target range; add absolute-error metrics | Target variance and limits of agreement |
Adding more raters can improve the reliability of an average, as shown by the increase from single-measure ICC 0.859 to average-measure ICC 0.948. It does not repair systematic bias in every rater. If all raters share the same misconception, averaging can produce a highly reliable but invalid score.
How to report inter rater reliability in APA style
Include the ICC model, agreement definition, measurement unit, confidence interval, F test, and practical interpretation.
An APA-style inter rater reliability statement should allow another analyst to reconstruct the intended coefficient. Reporting only “ICC = .86” is incomplete because multiple ICC models can yield different values from the same matrix.
APA-style worked report
Inter rater reliability was evaluated for G1, G2, and G3 scores across 649 targets using a two-way random-effects, absolute-agreement, single-measure intraclass correlation coefficient. Ratings demonstrated good absolute agreement, ICC(2,1) = .859, 95% CI [.836, .878], F(648, 1296) = 20.25, p < .001. The reliability of the mean of all three ratings was higher, ICC(2,3) = .948, 95% CI [.939, .956]. Mean ratings increased from G1 (M = 11.40, SD = 2.75) to G2 (M = 11.57, SD = 2.91) and G3 (M = 11.91, SD = 3.23), indicating a modest systematic scoring-level difference that was counted as disagreement by the absolute-agreement model.
Minimum reporting checklist
Language to avoid
Do not write “the raters were 85.9% identical,” “85.9% of variance is valid,” or “the scores are accurate because ICC was significant.” Avoid reporting the average-measure coefficient without saying ratings were averaged. Do not call Cronbach’s alpha an inter-rater ICC. Do not use p = .000; write p < .001.
When the rater sample is fixed, do not claim the result generalizes to all raters. When the target sample is narrow, do not assume the coefficient will be the same in a broader population.
Brief reporting versions
| Use case | Suggested wording |
|---|---|
| Methods section | Inter rater reliability was estimated with a two-way random-effects, absolute-agreement, single-measure ICC because the three raters were treated as a sample from a broader rater population and individual ratings were of interest. |
| Results section | Single-rater agreement was good, ICC(2,1) = .859, 95% CI [.836, .878], F(648, 1296) = 20.25, p < .001. |
| Average-score workflow | The mean of three ratings showed excellent reliability, ICC(2,3) = .948, 95% CI [.939, .956]. |
| Limitations section | The worked columns represent sequential scoring occasions rather than independently sampled human raters, so generalization to human-rater behavior is illustrative. |
For related reporting foundations, see the site guides on confidence intervals, p-values, null and alternative hypotheses, and effect size.
Inter rater reliability PDF, Excel and software downloads
Open the exact Python, R, SPSS, and Excel analysis files.
The downloadable inter rater reliability reports and worked Excel workbook allow readers to verify every result. The inter rater reliability audit is strongest when Python, R, SPSS, and Excel use the same 649 targets, three rating columns, two-way random-effects model, absolute-agreement definition, and single-measure primary coefficient.
R reportTwo-way random absolute-agreement calculation and matching result graphics.Open R PDF →
SPSS outputCase processing, descriptives, correlations, ICC confidence intervals, F test, and scatterplot matrix.Open SPSS PDF →
Worked Excel analysisData input, target calculations, mean squares, diagnostics, reporting, and zero-difference cross-checks.Open Excel workbook →
Inter rater reliability verification sources and documentation
Analysis artifacts and internal method guides used to confirm the model, calculations, and interpretation.
This inter rater reliability guide is grounded in the exact analysis outputs rather than an unverified software screenshot. Each inter rater reliability value is traceable to a named artifact. The SPSS output confirms the confidence intervals and F test, the Excel workbook exposes the formula and data ledger, and the site’s ICC guides explain how model, agreement definition, and measurement unit change the reported coefficient.
Verified SPSS output
The SPSS inter rater reliability report documents 649 valid cases, the rating descriptives, inter-item correlations, ICC(2,1) = .859, 95% CI [.836, .878], average-measure ICC = .948, and F(648, 1296) = 20.246.
Worked Excel audit
The worked Excel analysis contains the targets-by-raters data, target means, ANOVA calculations, ICC formula, diagnostics, reporting sheet, and independent zero-difference verification.
Related ICC methodology
Use the internal intraclass correlation coefficient guide and the detailed ICC formula and interpretation guide to compare one-way, two-way, consistency, absolute-agreement, single-measure, and average-measure choices.
Inter rater reliability FAQs
Answers to the questions most often missed in brief reliability explanations.
What is inter rater reliability?
Inter rater reliability is the reproducibility of ratings assigned by different raters to the same targets. It indicates whether another suitably trained rater would produce a similar score or category under the same conditions.
What does inter rater reliability mean in psychology?
In psychology, inter rater reliability describes agreement among observers, coders, interviewers, diagnosticians, or clinicians. It is used for behavior coding, symptom ratings, diagnostic categories, interview scores, and other judgments that may vary across evaluators.
How do you calculate inter rater reliability?
Arrange the same targets in rows and raters in columns, choose a coefficient appropriate for the score scale and design, compute the required agreement statistic, and report a confidence interval. For continuous ratings in a complete two-way design, ICC(2,1) can be calculated from target, rater, and residual ANOVA mean squares.
Which ICC should be used for inter rater reliability?
Use ICC(2,1) when raters are treated as random, exact agreement matters, and one rating is used. Use an average-measure version when the operational score is the mean of several raters. Fixed-rater designs may require a two-way mixed model.
What is a good inter rater reliability score?
Values from 0.75 to 0.90 are often described as good and values above 0.90 as excellent, but requirements depend on the decision, consequences of error, and lower confidence bound. The worked ICC of .859 is good for one rater, with a 95% CI from .836 to .878.
What is an acceptable inter rater reliability?
There is no universal acceptable value. Exploratory research may tolerate moderate reliability, while high-stakes individual decisions often require a coefficient above .90 and a sufficiently high lower confidence bound. The threshold should be justified before analysis.
What is high inter rater reliability?
High inter rater reliability means stable target differences dominate disagreement introduced by raters and residual error. It does not automatically mean the ratings are valid, unbiased, or correct.
What is low inter rater reliability?
Low inter rater reliability means scores depend substantially on which rater performed the assessment. Causes may include an unclear rubric, insufficient training, ambiguous targets, inconsistent conditions, restricted target range, or an unsuitable statistical model.
What is the difference between inter and intra rater reliability?
Inter rater reliability compares different raters. Intra rater reliability evaluates whether the same rater gives stable scores when rating the targets again. The designs address different sources of measurement error.
Is inter rater reliability the same as agreement?
It is a form of agreement analysis, but the exact meaning depends on the coefficient. An absolute-agreement ICC requires score levels to match. A consistency ICC allows systematic rater offsets. Percent agreement and kappa use different definitions for categorical data.
Can Pearson correlation measure inter rater reliability?
Pearson correlation measures linear association, not exact agreement. Two raters can correlate perfectly while one always scores higher. For continuous ratings, an ICC or agreement analysis is usually more appropriate.
Can Cronbach’s alpha be used for inter rater reliability?
Alpha may reflect consistency among columns, but it does not directly estimate single-rater absolute agreement. In this example alpha is .951 while ICC(2,1) is .859. The ICC is the primary result for one random rater and exact agreement.
When should Cohen’s kappa be used?
Use Cohen’s kappa when two raters assign nominal categories to the same targets. Use weighted kappa for ordered categories when near disagreements should receive partial credit.
When should Fleiss kappa be used?
Fleiss kappa is commonly used for nominal ratings from more than two raters. It is not a replacement for an ICC when the ratings are continuous numeric scores.
What is absolute-agreement inter rater reliability?
Absolute-agreement reliability requires raters to assign the same score level. A systematic difference in rater means counts as disagreement. This definition fits grading, clinical measurement, and other settings where the actual score determines the decision.
What is consistency inter rater reliability?
Consistency reliability focuses on whether raters rank targets similarly and ignores a constant strictness or leniency difference. It may be appropriate when scores are later standardized or only relative ordering matters.
Why is average-measure ICC higher than single-measure ICC?
Averaging multiple ratings reduces idiosyncratic error. In the worked example, single-measure ICC is .859 and the reliability of the average of three ratings is .948. Report the average coefficient only when the mean of three ratings is actually used.
What does ICC(2,1) mean?
ICC(2,1) denotes a two-way random-effects, single-measure coefficient. In the absolute-agreement form used here, both targets and raters are random, systematic rater offsets count as disagreement, and reliability refers to one rater.
What does ICC(2,k) mean?
ICC(2,k) estimates the reliability of the mean of k random raters under a two-way random-effects model. In this example k = 3 and the average-measure coefficient is .948.
Can inter rater reliability be negative?
An estimated ICC can be negative when residual disagreement exceeds stable target variation. The result indicates no dependable reliability under the chosen model and should prompt investigation rather than being interpreted as a meaningful negative proportion.
Does inter rater reliability require normal data?
Classical ICC confidence intervals and tests rely on ANOVA assumptions, but exact normality of each rater column is not the only concern. Severe outliers, skew, heteroscedasticity, floor or ceiling effects, and model mismatch should be assessed. Large balanced samples make the point estimate more stable but do not fix design problems.
How many raters are needed?
Two raters can support an inter-rater analysis, but more raters allow the reliability of an average to be evaluated and may better represent the intended rater population. Rater count should follow the operational scoring process and precision requirements.
How many targets are needed?
Required target count depends on expected ICC, desired confidence-interval width, number of raters, and decision threshold. More targets improve precision, but representative target sampling is as important as raw sample size.
How can inter rater reliability be improved?
Clarify the construct and rubric, add anchored examples, train and calibrate raters, standardize conditions, keep ratings independent, monitor drift, and investigate disagreement patterns. Do not inflate reliability by deleting difficult cases without a prespecified rule.
How is inter rater reliability reported?
Report the ICC model, agreement definition, single or average unit, number of targets and raters, coefficient, 95% confidence interval, F statistic, degrees of freedom, p-value, and practical interpretation. Name the exact raters or scoring occasions.
How do I calculate inter rater reliability in SPSS?
Use Analyze → Scale → Reliability Analysis, select the rating variables, request intraclass correlation coefficients, and choose the model, agreement definition, and confidence interval. For this example use a two-way random model, absolute agreement, and single measures.
How do I calculate inter rater reliability in Excel?
Use a balanced targets-by-raters matrix, calculate target, rater, and residual sums of squares and mean squares, then apply the ICC(2,1) formula. Audit ranges carefully and verify the decomposition against an independent implementation.
What did the worked example show?
The worked inter rater reliability analysis found ICC(2,1) = .859, 95% CI [.836, .878], F(648, 1296) = 20.246, p < .001, for 649 targets and three ratings. The average of all three ratings had reliability .948.
Related statistical guides
Continue the inter rater reliability workflow with closely connected agreement, reliability, correlation, and measurement-error methods.