
Parametric vs Nonparametric Tests: Hypotheses, Examples, SPSS, R, Python and Excel Guide
Parametric vs Nonparametric Tests means choosing whether a statistical method should use the original numeric scale, such as means and Pearson correlations, or a rank-based approach, such as Mann-Whitney U, Kruskal-Wallis and Spearman correlation. This Parametric vs Nonparametric Tests guide explains the decision with null and alternative hypotheses, verified SPSS output, Python charts, R charts, Excel steps and detailed interpretation using the G3 final grade example.
Quick Answer: Parametric vs Nonparametric Tests
Parametric vs Nonparametric Tests should be chosen according to the research question, measurement scale, assumptions and distribution shape. Use a parametric test when the dependent variable is numeric, the research question focuses on means or linear relationships, and the assumptions are reasonably acceptable. Use a nonparametric test when the outcome is ordinal, strongly skewed, affected by outliers, or when a rank-based backup is more defensible.
In this worked Parametric vs Nonparametric Tests example, both approaches lead to the same broad conclusion. The t-test and Mann-Whitney U test both show that G3 differs by sex group. ANOVA and Kruskal-Wallis both show that G3 differs across studytime groups. Pearson and Spearman both show a very strong positive relationship between G2 and G3.
Parametric vs Nonparametric Tests Main Result
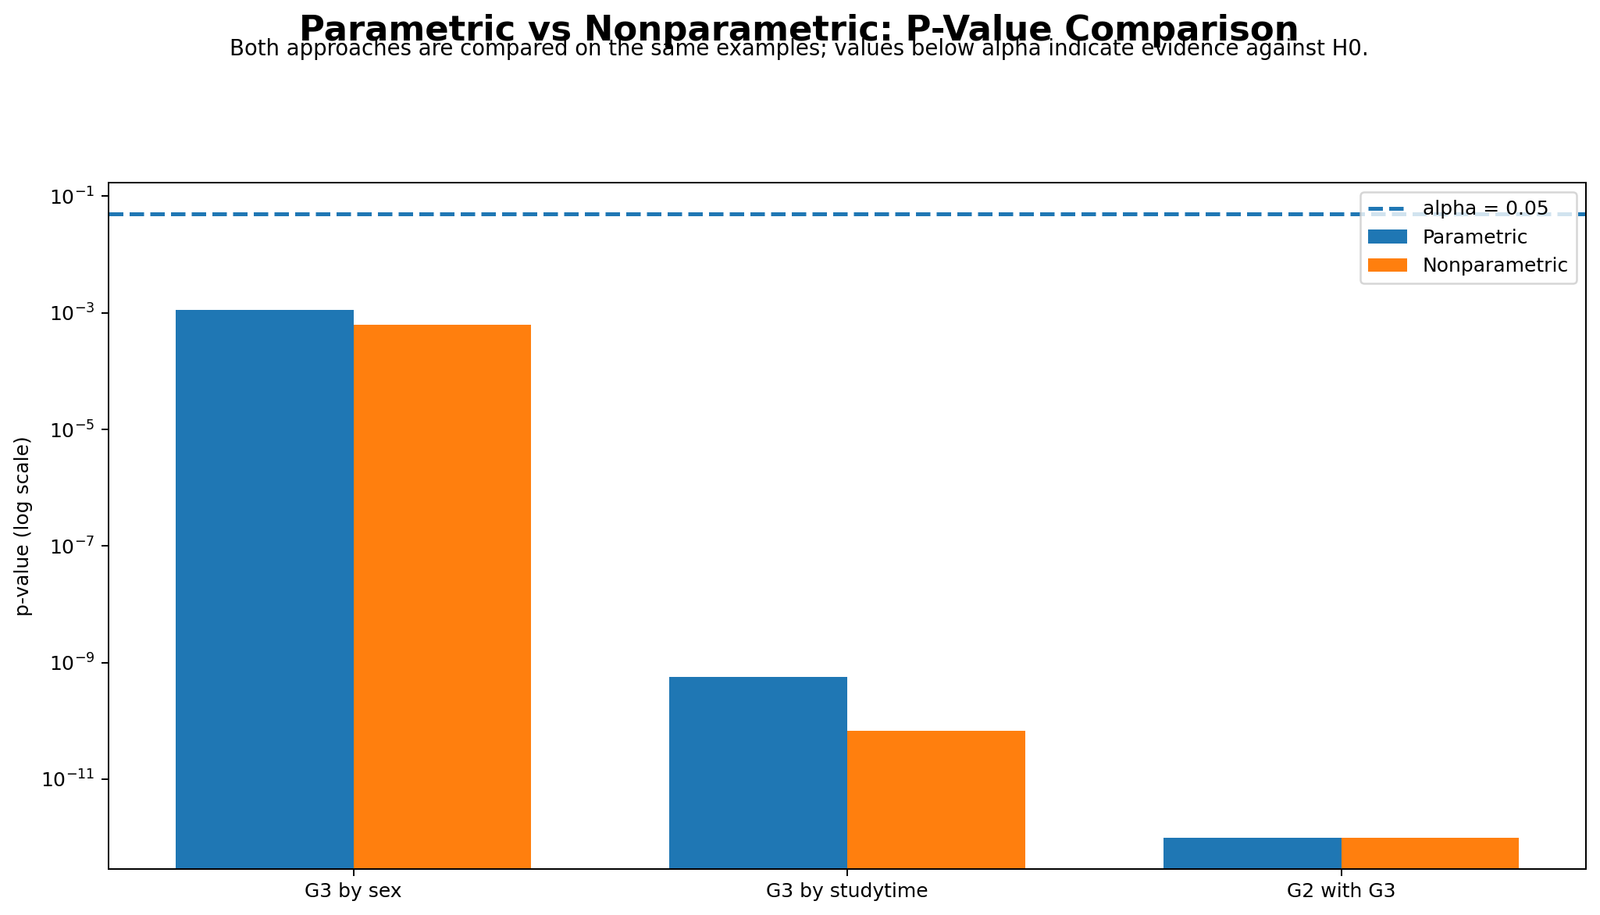
Two-group comparison: t-test p = .001 and Mann-Whitney p = .001, so reject H0.
Studytime comparison: ANOVA p < .001 and Kruskal-Wallis p < .001, so reject H0.
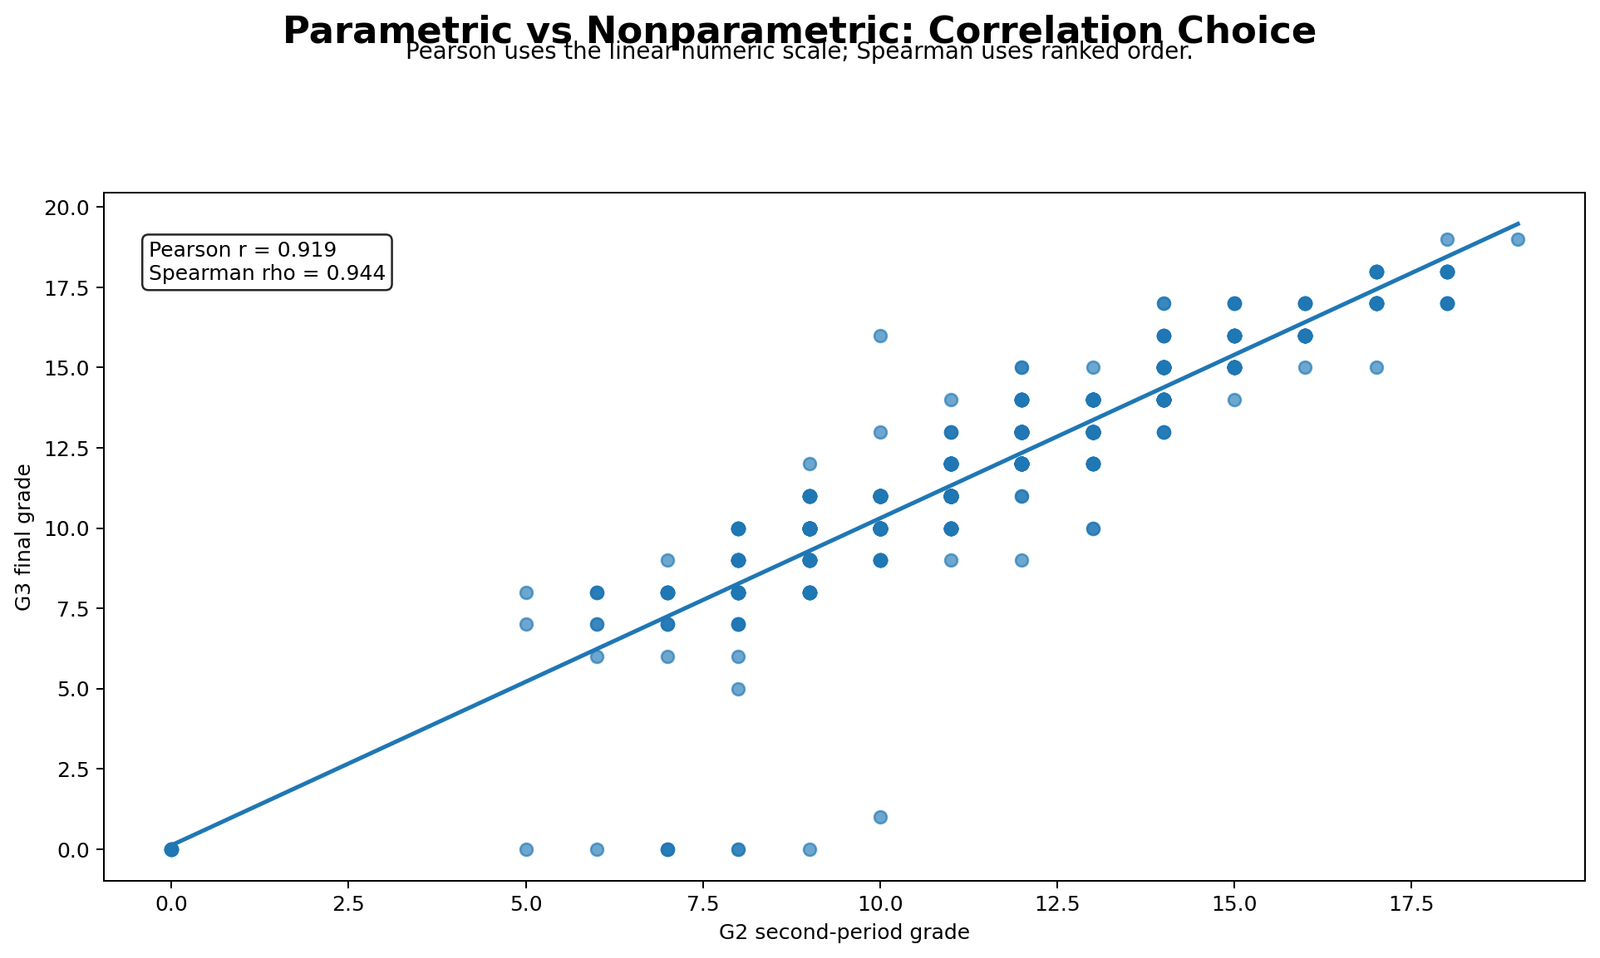
Correlation comparison: Pearson r = .919 and Spearman rho = .944, both p < .001, so reject H0.
Because Parametric vs Nonparametric Tests give matching decisions here, the results are easier to defend in a student report, thesis analysis or practical SPSS interpretation.
Table of Contents
- What Are Parametric vs Nonparametric Tests?
- Null and Alternative Hypotheses in Parametric vs Nonparametric Tests
- Assumptions for Parametric vs Nonparametric Tests
- Dataset and Verified SPSS Results
- Python Chart Interpretation
- R Chart Interpretation
- SPSS Workflow and Output Interpretation
- R, Python and Excel Workflows
- Reporting Parametric vs Nonparametric Tests
- When to Use Parametric vs Nonparametric Tests
- Downloads and Resources
- Related Guides
- FAQs
What Are Parametric vs Nonparametric Tests?
Parametric vs Nonparametric Tests is a basic but important decision in statistics. Parametric tests use the original numeric values and usually test claims about population parameters such as means, mean differences, variances, regression coefficients or Pearson correlations. Common parametric examples include the independent-samples t-test, one-way ANOVA and Pearson correlation.
Nonparametric tests use ranks, order, signs or distribution-free logic. They are useful when the dependent variable is ordinal, the data contain influential outliers, the distribution is strongly non-normal, or the researcher wants a rank-based comparison instead of a mean-based comparison. Common examples include the Mann-Whitney U test, Kruskal-Wallis test and Spearman rank correlation.
The best way to understand Parametric vs Nonparametric Tests is to connect each test with its matching research question. A t-test asks whether two means differ. A Mann-Whitney U test asks whether two rank distributions or central rank tendencies differ. Pearson correlation asks whether two numeric variables have a linear relationship. Spearman correlation asks whether two variables have a monotonic rank relationship.
Important: Nonparametric does not mean “no assumptions.” It means the test generally depends less on strict normal-distribution assumptions than a parametric test. You still need a clear design, independent observations, correct variable roles and a properly written null and alternative hypothesis.
| Research Question | Parametric Test | Nonparametric Alternative | What Changes? |
|---|---|---|---|
| Compare two independent groups on a numeric outcome | Independent-samples t-test or Welch t-test | Mann-Whitney U test | Mean comparison changes to rank/distribution comparison. |
| Compare three or more independent groups | One-way ANOVA | Kruskal-Wallis test | Mean comparison changes to rank comparison across groups. |
| Measure association between two numeric variables | Pearson correlation | Spearman correlation | Linear numeric association changes to monotonic rank association. |
| Outcome is ordinal or rank-based | Usually not first choice | Usually preferred | The analysis follows the ordered nature of the variable. |
Null and Alternative Hypotheses in Parametric vs Nonparametric Tests
A strong Parametric vs Nonparametric Tests guide should not jump directly to p-values. The null hypothesis and alternative hypothesis should be written first. This is important for correct reporting and for SEO because many readers search for phrases such as null hypothesis for Mann-Whitney U test, alternative hypothesis for Kruskal-Wallis test, and Pearson vs Spearman hypothesis.
Parametric vs Nonparametric Tests Hypotheses for G3 by Sex Group
Research question: Does G3 final grade differ between female and male students?
Parametric H0: The population mean G3 score is equal for female and male students.
Parametric H1: The population mean G3 score is not equal for female and male students.
Nonparametric H0: The G3 rank distribution or central rank tendency is the same for female and male students.
Nonparametric H1: The G3 rank distribution or central rank tendency differs between female and male students.
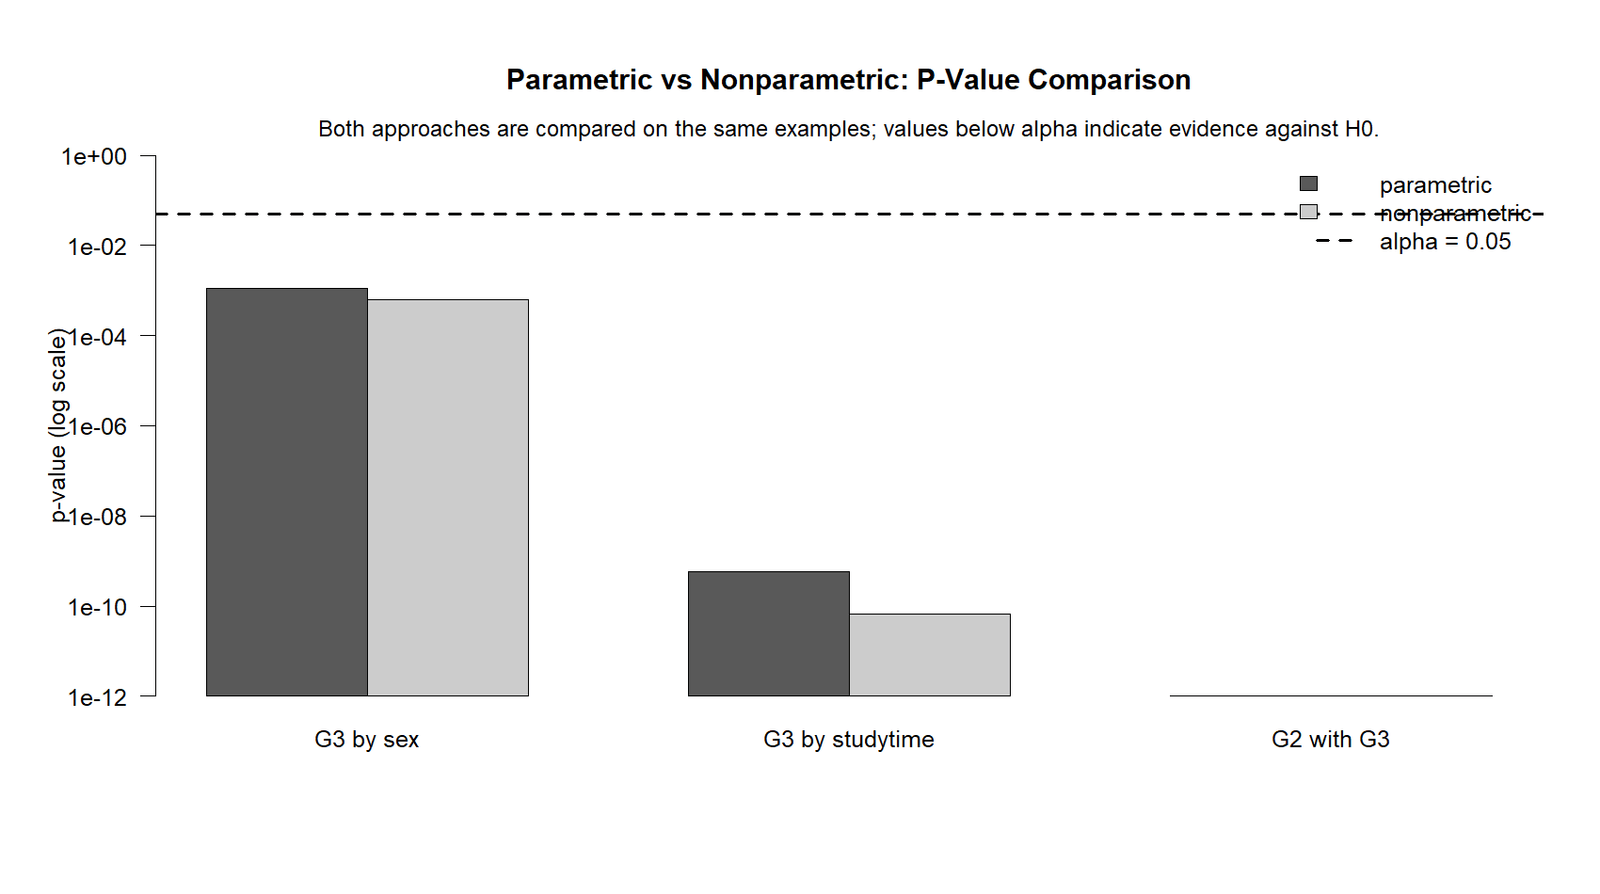
Result decision: The Welch t-test gives p = .001 and the Mann-Whitney U test gives p = .001. Both p-values are below alpha = .05, so reject H0. The Parametric vs Nonparametric Tests result supports a difference in G3 by sex group.
Parametric vs Nonparametric Tests Hypotheses for G3 by Studytime Group
Research question: Does G3 final grade differ across studytime groups?
Parametric H0: All studytime groups have the same population mean G3 score.
Parametric H1: At least one studytime group has a different population mean G3 score.
Nonparametric H0: All studytime groups have the same G3 rank distribution or central rank tendency.
Nonparametric H1: At least one studytime group differs in G3 rank distribution or central rank tendency.
Result decision: ANOVA gives F(3, 645) = 15.876, p < .001, and Kruskal-Wallis gives H(3) = 50.316, p < .001. Both tests reject H0. G3 differs across studytime groups.
Parametric vs Nonparametric Tests Hypotheses for G2 and G3 Correlation
Research question: Are G2 second-period grade and G3 final grade related?
Parametric H0: The population Pearson correlation between G2 and G3 is zero.
Parametric H1: The population Pearson correlation between G2 and G3 is not zero.
Nonparametric H0: The population Spearman rank correlation between G2 and G3 is zero.
Nonparametric H1: The population Spearman rank correlation between G2 and G3 is not zero.
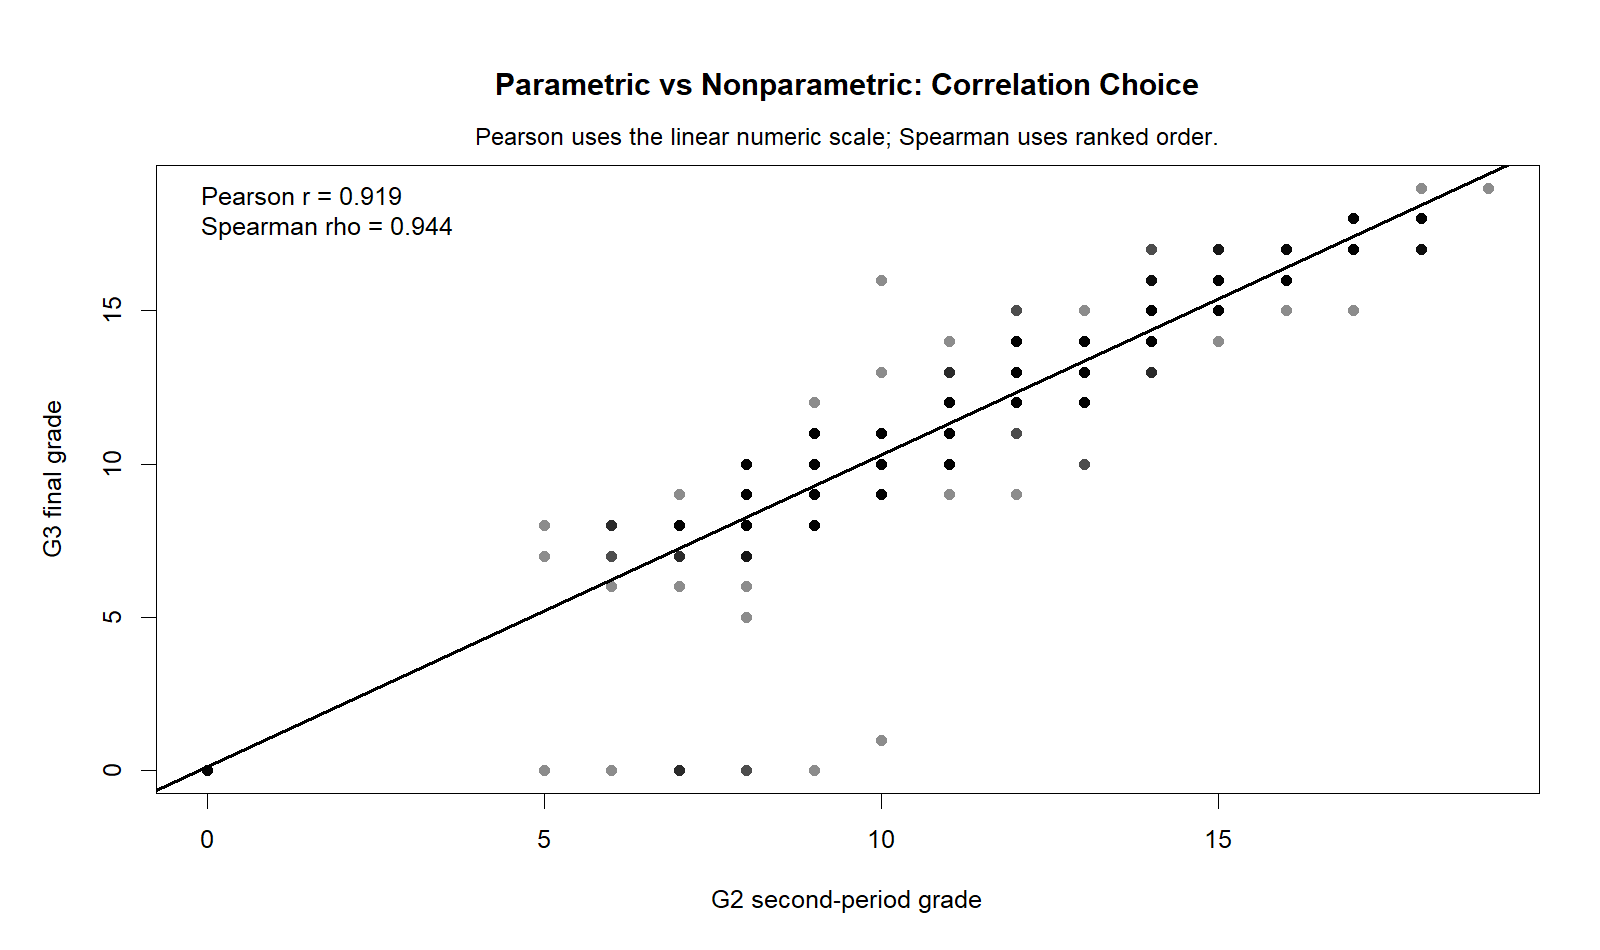
Result decision: Pearson r = .919, p < .001, and Spearman rho = .944, p < .001. Both tests reject H0. G2 and G3 have a very strong positive relationship.
Assumptions for Parametric vs Nonparametric Tests
The choice between parametric and nonparametric testing should come from the research question, variable type, assumptions and shape of the data. A nonparametric test is not automatically better; it is better when the rank-based question is more appropriate or when the parametric assumptions are questionable.
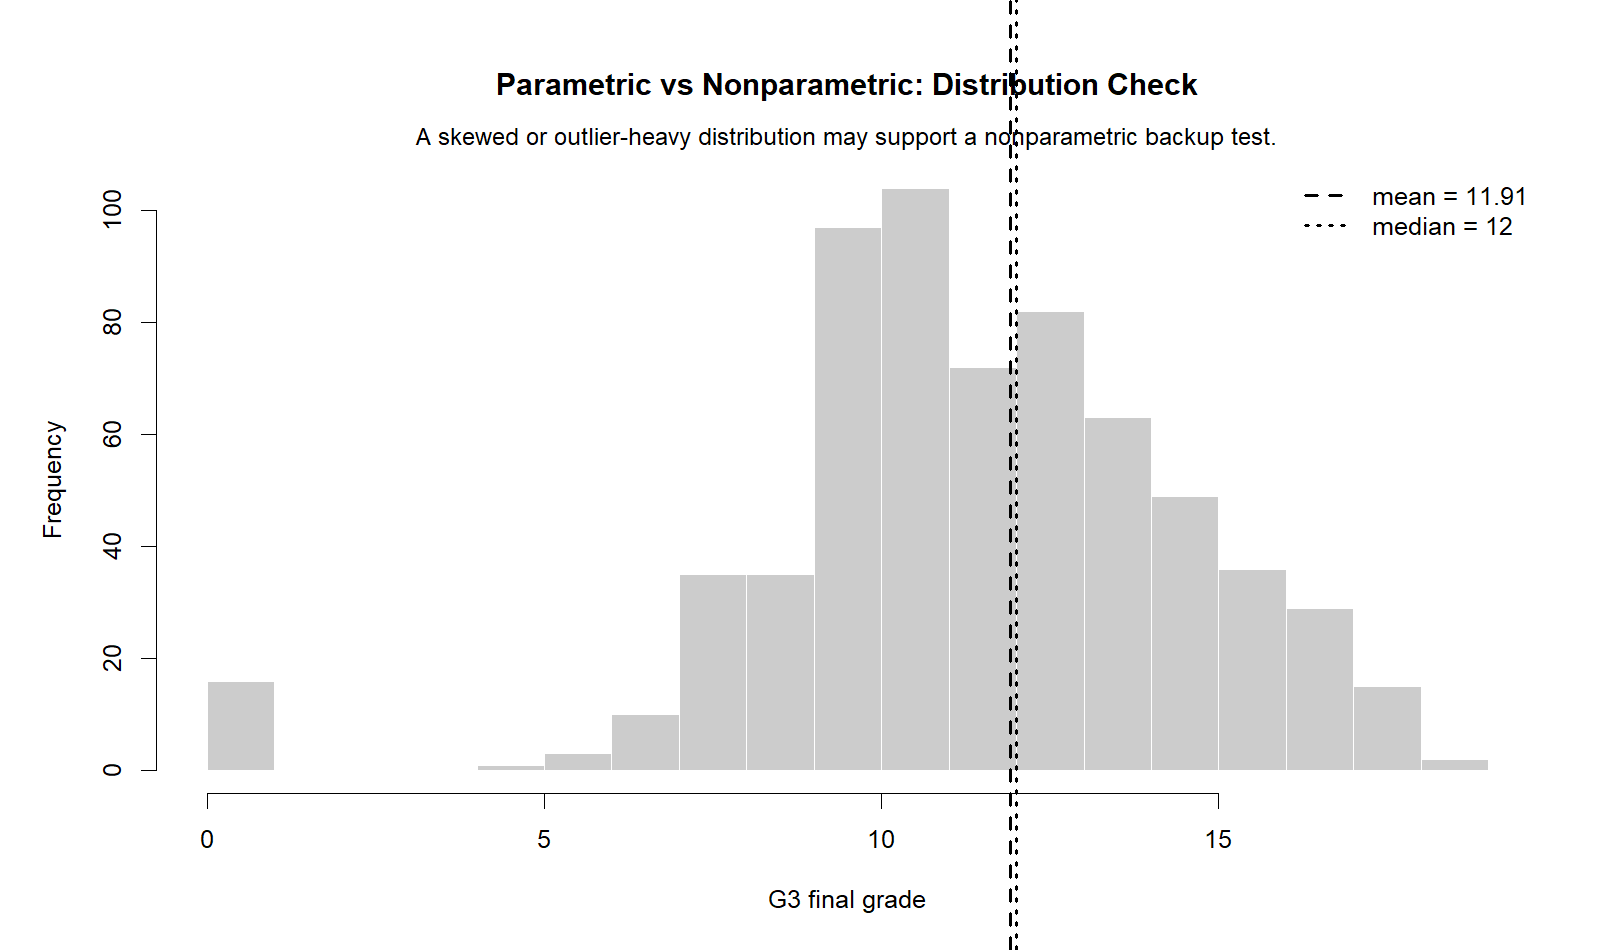
For Parametric vs Nonparametric Tests, the main practical checks are normality, outliers, variance equality, sample size and scale of measurement. A large sample can make parametric tests stable, but a rank-based method may still be better when the variable is ordinal or when extreme values make the mean misleading.
| Check | Why It Matters | Related Internal Guide |
|---|---|---|
| Normal distribution or approximate normality | Parametric tests often rely on normality of errors or sampling distribution, especially with smaller samples. | Q-Q Plot Normality Check, P-P Plot Normality Check, Kolmogorov-Smirnov Test |
| Homogeneity of variance | Two-group and multi-group mean comparisons can be affected by unequal variance. | Levene Test, Brown-Forsythe Test, Cochran C Test |
| Outliers and skewness | Extreme values can affect means, standard deviations and Pearson correlation more than rank-based tests. | Box Plot Interpretation, Five Number Summary, Histogram Interpretation |
| Measurement level | Ordinal outcomes are usually better handled with rank-based or nonparametric methods. | Frequency Distribution, Descriptive Statistics |
| Sample size | Large samples often make parametric tests more stable, but outliers and ordinal scales can still matter. | Central Limit Theorem, Confidence Interval |
In the verified SPSS output, Levene’s test for the sex-group t-test gives p = .950, so there is no strong evidence of unequal variances. Levene’s test for the studytime ANOVA gives p = .400 based on the mean, so the equal-variance assumption is also not strongly rejected there. The nonparametric tests are still useful because they confirm whether the result is robust when ranks are used instead of raw numeric values.
Dataset and Verified SPSS Results for Parametric vs Nonparametric Tests
This Parametric vs Nonparametric Tests analysis uses the student performance dataset with 649 valid cases. The main outcome variable is G3 final grade. The examples compare G3 by sex group, compare G3 across studytime groups, and examine the relationship between G2 and G3.
Descriptive Statistics
| Variable | N | Minimum | Maximum | Mean | Standard Deviation | Role in the Post |
|---|---|---|---|---|---|---|
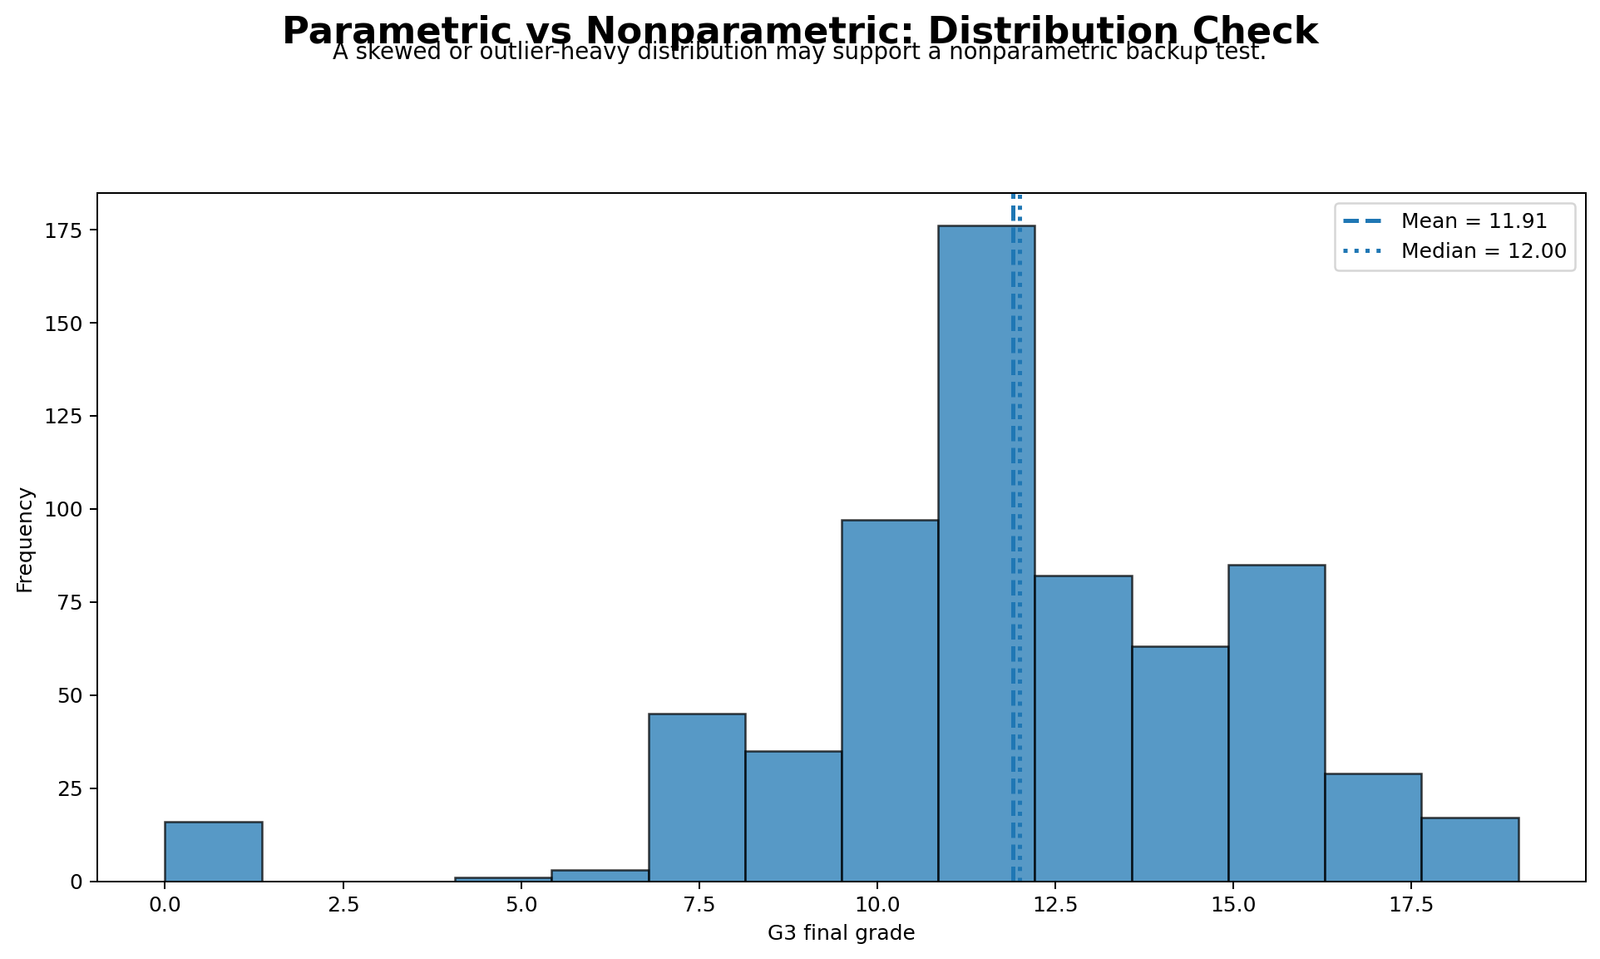
| G3 final grade | 649 | 0 | 19 | 11.91 | 3.231 | Main dependent variable |
| G2 second-period grade | 649 | 0 | 19 | 11.57 | 2.914 | Correlation predictor/example variable |
| Studytime | 649 | 1 | 4 | 1.93 | 0.830 | Multi-group comparison variable |
Sex Group Comparison Results
| Group | N | Mean G3 | Standard Deviation | Standard Error | Interpretation |
|---|---|---|---|---|---|
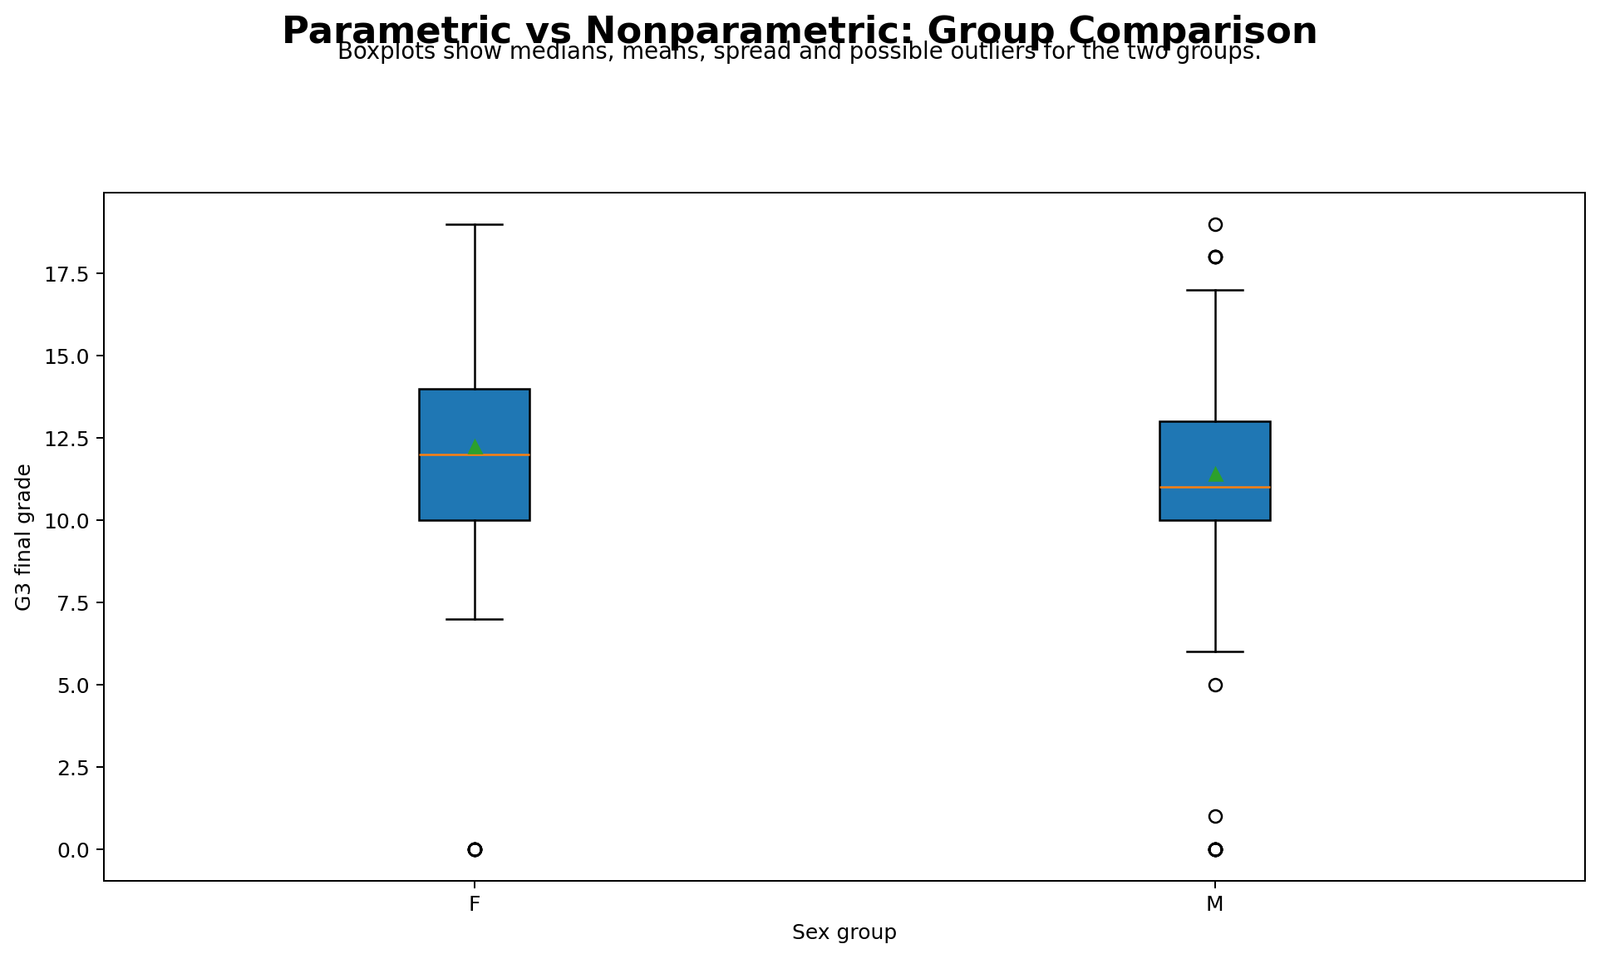
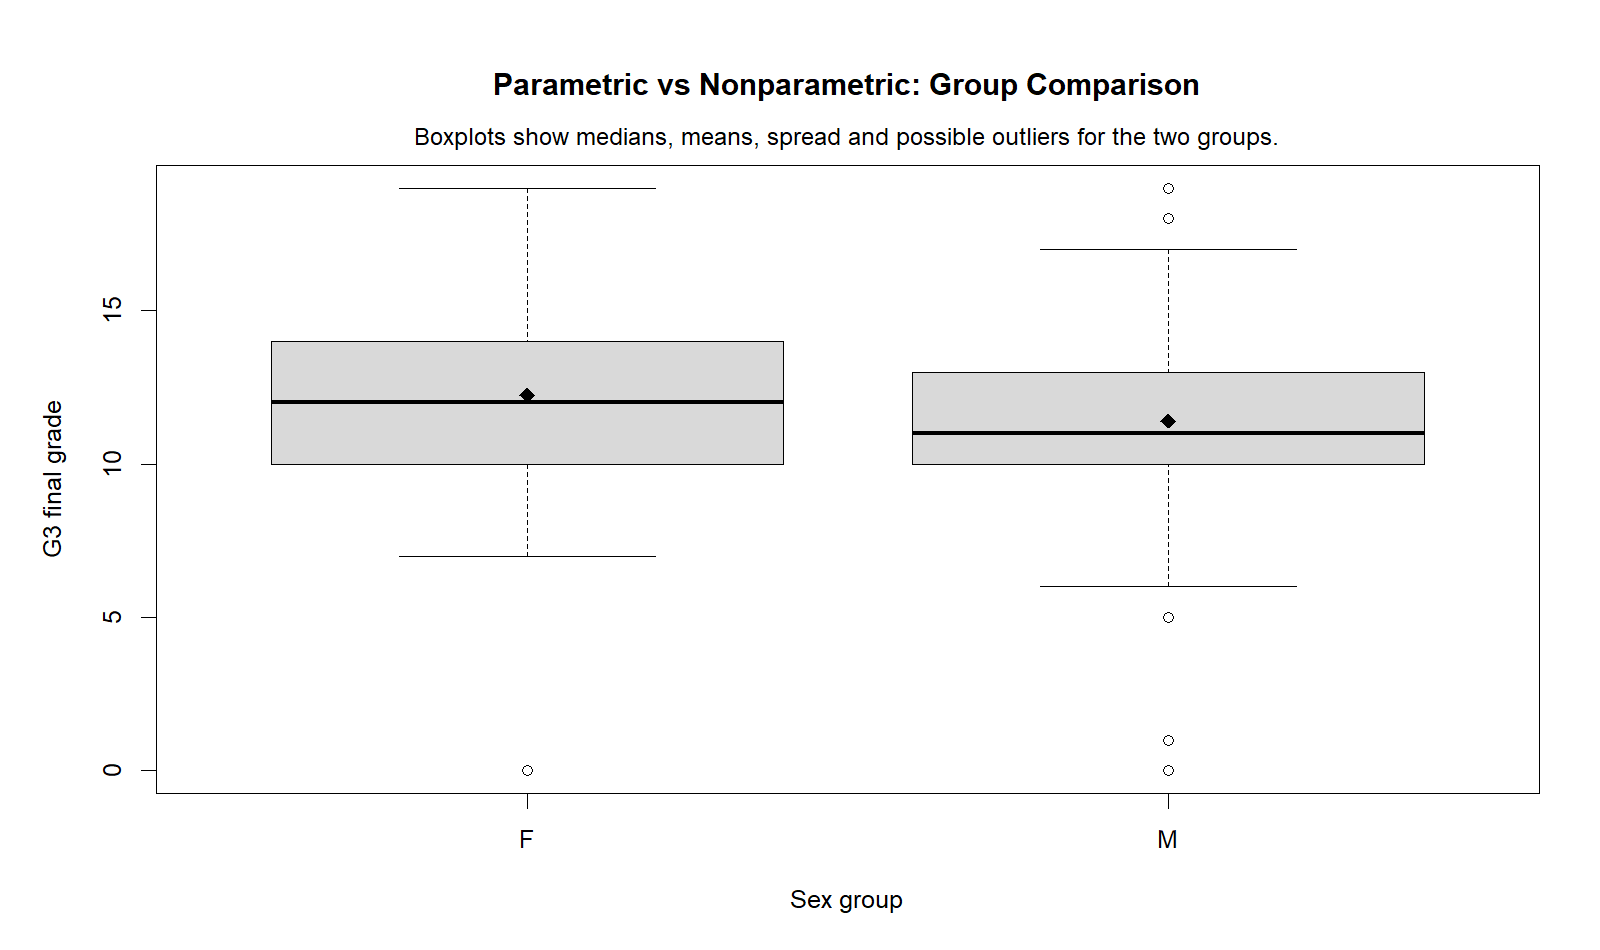
| Female | 383 | 12.25 | 3.124 | .160 | Higher mean G3 than the male group. |
| Male | 266 | 11.41 | 3.321 | .204 | Lower mean G3 than the female group. |
| Test | Statistic | p-value | Null Hypothesis Decision | Meaning |
|---|---|---|---|---|
| Levene’s test | F = .004 | .950 | Do not reject equal variances | No strong evidence that group variances differ. |
| Welch independent-samples t-test | t = 3.275, df = 547.439 | .001 | Reject H0 | Mean G3 differs by sex group. |
| Mann-Whitney U test | U = 42961.50, z = -3.418 | .001 | Reject H0 | G3 rank tendency differs by sex group. |
Studytime Group Comparison Results
| Studytime Group | N | Mean G3 | 95% CI Lower | 95% CI Upper | Interpretation |
|---|---|---|---|---|---|
| 1 | 212 | 10.84 | 10.41 | 11.28 | Lowest mean G3 among studytime groups. |
| 2 | 305 | 12.09 | 11.73 | 12.46 | Higher than studytime group 1. |
| 3 | 97 | 13.23 | 12.72 | 13.73 | Highest mean G3 in the table. |
| 4 | 35 | 13.06 | 12.01 | 14.10 | High mean but smaller group size. |
| Test | Statistic | p-value | Null Hypothesis Decision | Meaning |
|---|---|---|---|---|
| Levene’s test based on mean | F = .986 | .400 | Do not reject equal variances | No strong evidence of unequal variance across studytime groups. |
| One-way ANOVA | F(3, 645) = 15.876 | < .001 | Reject H0 | At least one studytime group mean differs. |
| Kruskal-Wallis test | H(3) = 50.316 | < .001 | Reject H0 | At least one studytime group rank distribution differs. |
Correlation Results
| Correlation Method | Coefficient | p-value | Null Hypothesis Decision | Interpretation |
|---|---|---|---|---|
| Pearson correlation | r = .919 | < .001 | Reject H0 | Very strong positive linear relationship between G2 and G3. |
| Spearman correlation | rho = .944 | < .001 | Reject H0 | Very strong positive rank-order relationship between G2 and G3. |
Python Chart Interpretation for Parametric vs Nonparametric Tests
The Python charts below explain the Parametric vs Nonparametric Tests selection logic visually. They show distribution shape, group spread, p-value comparison and the choice between Pearson and Spearman correlation. Each chart should be read with the hypothesis and SPSS result, not separately.
R Chart Interpretation for Parametric vs Nonparametric Tests
The R charts repeat the same Parametric vs Nonparametric Tests logic using a second software workflow. This helps confirm that the interpretation is based on the data and test results, not on one plotting system.
SPSS Workflow for Parametric vs Nonparametric Tests
The SPSS output for this Parametric vs Nonparametric Tests guide includes descriptive statistics, frequency tables, boxplots, independent-samples t-test, Mann-Whitney U test, one-way ANOVA, Kruskal-Wallis test, Pearson correlation and Spearman correlation.
Open the Parametric vs Nonparametric SPSS Output PDF
SPSS Menu Steps
| Analysis | SPSS Menu Path | Purpose |
|---|---|---|
| Independent-samples t-test | Analyze > Compare Means > Independent-Samples T Test | Parametric comparison of female and male G3 means. |
| Mann-Whitney U test | Analyze > Nonparametric Tests > Legacy Dialogs > 2 Independent Samples | Nonparametric rank-based comparison of female and male G3. |
| One-way ANOVA | Analyze > Compare Means > One-Way ANOVA | Parametric comparison of G3 means across studytime groups. |
| Kruskal-Wallis test | Analyze > Nonparametric Tests > Legacy Dialogs > K Independent Samples | Nonparametric rank-based comparison across studytime groups. |
| Pearson and Spearman correlation | Analyze > Correlate > Bivariate | Compare numeric linear correlation and rank-order correlation. |
SPSS Syntax
* Parametric vs Nonparametric Tests - SPSS Syntax.

TITLE "Parametric vs Nonparametric Tests for G3".

DESCRIPTIVES VARIABLES=G3 G2 studytime
  /STATISTICS=MEAN STDDEV MIN MAX.

FREQUENCIES VARIABLES=sex studytime
  /ORDER=ANALYSIS.

* Parametric two-group comparison: H0 means are equal.
T-TEST GROUPS=sexgrp(1 2)
  /MISSING=ANALYSIS
  /VARIABLES=G3
  /CRITERIA=CI(.95).

* Nonparametric two-group comparison: H0 rank distributions are equal.
NPAR TESTS
  /M-W=G3 BY sexgrp(1 2)
  /MISSING ANALYSIS.

* Parametric multi-group comparison: H0 all group means are equal.
ONEWAY G3 BY studytime
  /STATISTICS DESCRIPTIVES HOMOGENEITY
  /MISSING ANALYSIS.

* Nonparametric multi-group comparison: H0 group rank distributions are equal.
NPAR TESTS
  /K-W=G3 BY studytime(1 4)
  /MISSING ANALYSIS.

* Parametric correlation: H0 Pearson correlation is zero.
CORRELATIONS
  /VARIABLES=G2 G3
  /PRINT=TWOTAIL NOSIG
  /MISSING=PAIRWISE.

* Nonparametric correlation: H0 Spearman correlation is zero.
NONPAR CORR
  /VARIABLES=G2 G3
  /PRINT=SPEARMAN TWOTAIL
  /MISSING=PAIRWISE.

OUTPUT EXPORT
  /CONTENTS EXPORT=VISIBLE
  /PDF DOCUMENTFILE="Parametric-vs-Nonparametric-SPSS-Output.pdf".
R, Python and Excel Workflows for Parametric vs Nonparametric Tests
Python Workflow for Parametric vs Nonparametric Tests
import pandas as pd
from scipy import stats

df = pd.read_csv("dataset.csv")

df["G3"] = pd.to_numeric(df["G3"], errors="coerce")
df["G2"] = pd.to_numeric(df["G2"], errors="coerce")
df["studytime"] = pd.to_numeric(df["studytime"], errors="coerce")

female = df.loc[df["sex"] == "F", "G3"].dropna()
male = df.loc[df["sex"] == "M", "G3"].dropna()

# H0: mean G3 is equal for female and male students
# H1: mean G3 differs for female and male students
welch_test = stats.ttest_ind(female, male, equal_var=False)

# H0: G3 rank distribution is equal for female and male students
# H1: G3 rank distribution differs for female and male students
mann_whitney = stats.mannwhitneyu(female, male, alternative="two-sided")

groups = [group["G3"].dropna().to_numpy() for _, group in df.groupby("studytime")]

# H0: all studytime group means are equal
# H1: at least one studytime group mean differs
anova_result = stats.f_oneway(*groups)

# H0: all studytime rank distributions are equal
# H1: at least one studytime rank distribution differs
kruskal_result = stats.kruskal(*groups)

pair = df[["G2", "G3"]].dropna()

# H0: Pearson correlation is zero
# H1: Pearson correlation is not zero
pearson_result = stats.pearsonr(pair["G2"], pair["G3"])

# H0: Spearman correlation is zero
# H1: Spearman correlation is not zero
spearman_result = stats.spearmanr(pair["G2"], pair["G3"])

print("Welch t-test:", welch_test)
print("Mann-Whitney U:", mann_whitney)
print("ANOVA:", anova_result)
print("Kruskal-Wallis:", kruskal_result)
print("Pearson:", pearson_result)
print("Spearman:", spearman_result)
R Workflow for Parametric vs Nonparametric Tests
# R: Parametric vs Nonparametric Tests

df <- read.csv("dataset.csv")

# Parametric H0: female and male population means are equal
# Parametric H1: female and male population means differ
t.test(G3 ~ sex, data = df)

# Nonparametric H0: female and male rank distributions are equal
# Nonparametric H1: female and male rank distributions differ
wilcox.test(G3 ~ sex, data = df)

# Parametric H0: all studytime means are equal
# Parametric H1: at least one studytime mean differs
anova_model <- aov(G3 ~ factor(studytime), data = df)
summary(anova_model)

# Nonparametric H0: all studytime rank distributions are equal
# Nonparametric H1: at least one studytime rank distribution differs
kruskal.test(G3 ~ factor(studytime), data = df)

# Parametric H0: Pearson correlation is zero
cor.test(df$G2, df$G3, method = "pearson")

# Nonparametric H0: Spearman rank correlation is zero
cor.test(df$G2, df$G3, method = "spearman")
Excel Workflow for Parametric vs Nonparametric Tests
Excel can run basic parametric tests directly, but nonparametric tests usually require ranking or an add-in. For Parametric vs Nonparametric Tests in Excel, the safest method is to compute the parametric result first, then build rank columns for the nonparametric comparison.
| Task | Excel Method | Formula or Tool | Note |
|---|---|---|---|
| Two-group parametric comparison | Data Analysis ToolPak | t-Test: Two-Sample Assuming Unequal Variances | Useful for Welch-style mean comparison. |
| Mann-Whitney U style comparison | Rank all G3 values and compare rank sums | =RANK.AVG(value, all_values, 1) | Manual setup required; check ties carefully. |
| ANOVA | Data Analysis ToolPak | ANOVA: Single Factor | Parametric comparison across studytime groups. |
| Kruskal-Wallis style comparison | Rank G3 values, then compare rank sums by group | Manual H statistic calculation | Best done in R, Python or SPSS for accuracy. |
| Pearson correlation | Built-in formula | =CORREL(G2_range,G3_range) | Measures linear numeric association. |
| Spearman correlation | Rank both variables, then correlate ranks | =CORREL(rank_G2_range,rank_G3_range) | Measures monotonic rank association. |
Reporting Parametric vs Nonparametric Tests
A good report should include the test name, the null and alternative hypotheses, the statistic, degrees of freedom where relevant, p-value, direction of the effect and the final decision. SPSS may display very small p-values as .000, but in written Parametric vs Nonparametric Tests reports use p < .001.
Parametric vs Nonparametric Tests Report for G3 by Sex Group
Report: The null hypothesis stated that female and male students have equal population mean G3 scores. The alternative hypothesis stated that the population means differ. A Welch independent-samples t-test showed a significant difference in G3 by sex group, t(547.44) = 3.28, p = .001. Female students had a higher mean G3 score (M = 12.25, SD = 3.12) than male students (M = 11.41, SD = 3.32). Therefore, the null hypothesis was rejected. A Mann-Whitney U test reached the same decision, U = 42961.50, z = -3.42, p = .001.
Parametric vs Nonparametric Tests Report for G3 by Studytime
Report: The null hypothesis stated that all studytime groups have equal population mean G3 scores. The alternative hypothesis stated that at least one group mean differs. A one-way ANOVA showed that G3 differed across studytime groups, F(3, 645) = 15.88, p < .001. Therefore, the null hypothesis was rejected. A Kruskal-Wallis test also rejected the rank-based null hypothesis, H(3) = 50.32, p < .001.
Parametric vs Nonparametric Tests Report for G2 and G3 Correlation
Report: The null hypothesis stated that the population correlation between G2 and G3 is zero. The alternative hypothesis stated that the correlation is not zero. Pearson correlation showed a very strong positive linear association, r = .919, p < .001. Spearman correlation also showed a very strong positive rank-order association, rho = .944, p < .001. Therefore, the null hypothesis was rejected for both the parametric and nonparametric correlation tests.
After reporting significance, include practical interpretation. For example, the group difference by sex is statistically significant, but readers should still consider the size of the difference. For effect-size reporting, see the effect size guide. For confidence interval interpretation, see the confidence interval guide.
When to Use Parametric vs Nonparametric Tests
Parametric vs Nonparametric Tests should not be selected only by p-value. The method should match the variable type, research question and assumptions. In this example, both methods agree, which strengthens the final interpretation.
| Use Parametric Tests When | Use Nonparametric Tests When |
|---|---|
| The dependent variable is numeric and the mean is meaningful. | The dependent variable is ordinal, ranked or not safely treated as interval-level. |
| The research question is about mean differences. | The research question can be answered by comparing ranks or distributional tendency. |
| The sample size is large enough and assumptions are reasonably acceptable. | The distribution is strongly skewed, heavy-tailed or outlier-heavy. |
| You need confidence intervals for mean differences. | You need a robust backup where the mean may be misleading. |
| Pearson linear correlation matches the relationship. | Spearman monotonic rank association better matches the relationship. |
Do not choose Parametric vs Nonparametric Tests only because one gives a smaller p-value. The method should match the variable type, research question, assumptions and reporting purpose. In this example, both parametric and nonparametric methods agree, which strengthens the result.
Downloads and Resources for Parametric vs Nonparametric Tests
The SPSS output PDF includes the descriptive statistics, frequency tables, boxplots, t-test, Mann-Whitney U test, ANOVA, Kruskal-Wallis test, Pearson correlation and Spearman correlation used in this Parametric vs Nonparametric Tests guide.
External References
FAQs About Parametric vs Nonparametric Tests
What are Parametric vs Nonparametric Tests?
Parametric vs Nonparametric Tests are two families of statistical methods. Parametric tests use numeric values directly and usually test means, variances or Pearson correlations. Nonparametric tests often use ranks or distribution-free methods and are useful for ordinal, skewed or outlier-heavy data.
What is the null hypothesis for Parametric vs Nonparametric Tests?
The null hypothesis depends on the test. For a t-test, it usually says the population means are equal. For ANOVA, it says all group means are equal. For Pearson correlation, it says the population correlation is zero. For Mann-Whitney U, Kruskal-Wallis and Spearman correlation, the null hypothesis is usually written in terms of equal rank distributions or zero rank correlation.
When should I use Mann-Whitney U instead of a t-test?
Use Mann-Whitney U when the outcome is ordinal, the distribution is strongly non-normal, outliers strongly affect the mean, or a rank-based comparison is more appropriate than a mean comparison.
When should I use Kruskal-Wallis instead of ANOVA?
Use Kruskal-Wallis when comparing three or more independent groups and the assumptions for ANOVA are doubtful, especially when the dependent variable is ordinal or strongly affected by skewness and outliers.
Should I use Pearson or Spearman correlation?
Use Pearson correlation for linear numeric relationships. Use Spearman correlation for monotonic rank relationships, ordinal data, or cases where outliers may distort Pearson correlation.
Did Parametric vs Nonparametric Tests agree in this example?
Yes. The t-test and Mann-Whitney U test both rejected H0 for G3 by sex group. ANOVA and Kruskal-Wallis both rejected H0 for G3 by studytime group. Pearson and Spearman both rejected H0 for the relationship between G2 and G3.
How should SPSS p-values shown as .000 be reported?
Do not report p = .000. SPSS displays .000 when the p-value is very small. In a report, write p < .001.

