
Cochran Mantel Haenszel Test: Formula, Example, Interpretation, Python, R, SPSS, SAS and Excel Guide
The Cochran Mantel Haenszel Test evaluates association after controlling for a categorical stratification variable. This worked guide uses the ordinal row-mean-scores version to compare female and male final-grade distributions while controlling for school, with exact calculations from 649 students, twelve chart interpretations, software workflows, APA reporting templates and verified downloads.
Cochran Mantel Haenszel Test Model Overview
The Cochran Mantel Haenszel Test is a family of stratified chi-square procedures. It asks whether two categorical variables remain associated after data are divided into meaningful strata such as schools, age groups, centres, study sites or risk categories. Unlike a single unadjusted chi-square test of independence, the analysis preserves the stratification variable and combines evidence across its levels.
This article uses the row-mean-scores member of the family. The row variable is sex with two groups, the ordered column variable is the G3 final-grade band scored 1 through 4, and school is the stratification variable. The procedure compares the observed male ordinal-score total with the score total expected under conditional independence inside each school. It then combines the two observed-minus-expected differences and their variances.
The Exact Research Question
After controlling for school, does the ordered distribution of final-grade bands differ between female and male students? The Cochran Mantel Haenszel Test answers this conditional question without pooling GP and MS as though they were one undifferentiated population.
Why “Cochran–Mantel–Haenszel” Can Mean Different Statistics
The phrase Cochran Mantel Haenszel Test is often used as though it identifies one statistic. In practice, it can refer to a 2 × 2 × K common-odds-ratio test, a correlation statistic, a row-mean-scores statistic or a general-association statistic. The table shape, measurement scale and selected score system determine which member is appropriate. This distinction prevents the common error of reporting a Mantel–Haenszel odds ratio for an outcome with four categories.
Quick Answer: Cochran Mantel Haenszel Test Result
The Cochran Mantel Haenszel Test compares sex with a four-level ordered final-grade variable while stratifying by school. Grade bands receive scores 1, 2, 3 and 4. The male score total is below its null expectation in GP and MS, producing a statistically significant one-degree-of-freedom row-mean-scores test.
Statistical Decision
- Procedure: ordinal row-mean-scores Cochran Mantel Haenszel Test
- Degrees of freedom: 1
- Decision at α = .05: reject H0
- Decision at α = .01: reject H0
- Evidence: strong conditional ordinal association
Substantive Meaning
- GP male score difference: −22.0780.
- MS male score difference: −12.1681.
- Both strata point in the same direction.
- GP male-minus-female mean-score difference: −0.2119.
- MS male-minus-female mean-score difference: −0.2354.
Table of Contents
- What the test means
- Research question and hypotheses
- When to use the procedure
- CMH statistic variants
- Variables and grade-band coding
- Formula and manual calculation
- Observed and expected tables
- Complete statistical results
- Assumptions and diagnostics
- Comparison with related methods
- Calculator workflow
- Python chart stories
- Paired R chart interpretations
- Software workflows
- Expandable code
- APA reporting
- Common mistakes
- Practice questions
- Downloads
- Related guides
- Frequently asked questions
- Conclusion
What Is the Cochran Mantel Haenszel Test?
The Cochran Mantel Haenszel Test is a stratified procedure for categorical data. “Stratified” means the observations are organised into subgroups defined before analysis. The method calculates association information within each stratum and then combines that information, so the final result is adjusted for the stratifying factor.
Suppose a simple cross-tabulation indicates that sex and final-grade category are associated. That overall pattern might reflect a true within-school difference, a difference in the mix of students attending each school, or both. The Cochran Mantel Haenszel Test separates those possibilities by retaining school as a control variable rather than discarding it.
Conditional Independence
The null hypothesis is often described as conditional independence. Sex and the ordered grade band are conditionally independent given school when, inside each school stratum, the grade-band distribution does not systematically shift between female and male students. Conditional independence is more specific than the marginal independence tested after all strata are collapsed.
Why Scores Are Used
The four grade bands have a natural order: low, medium, high and very high. The row-mean-scores Cochran Mantel Haenszel Test assigns scores 1 through 4, preserving order and concentrating the test into one degree of freedom. A general-association test would treat the categories as nominal and use more degrees of freedom. The score-based version is therefore targeted to a monotonic ordinal shift.
What the Test Does Not Establish
A significant Cochran Mantel Haenszel Test does not prove that sex causes grade differences, that every individual follows the group pattern, or that school is the only confounder. It demonstrates a conditional association under the chosen scoring and stratification scheme. Causal claims require a design that addresses selection, confounding and measurement, as discussed in the guides to sampling methods and sampling bias.
Research Question, Hypotheses and Data Design
Research Question
After controlling for school, is the ordinal G3 grade-band distribution the same for female and male students?
Null and Alternative Hypotheses
| Component | Statement | Meaning |
|---|---|---|
| Null hypothesis | H0: no conditional ordinal association | Within every school stratum, the expected male score total equals the score total implied by the fixed margins. |
| Alternative hypothesis | H1: a conditional ordinal association exists | The male and female distributions differ in ordered location after school is controlled. |
| Directional interpretation | Signed z < 0 for male-minus-female coding | Male score totals fall below their null expectations, indicating relatively lower ordered grades. |
Why the Hypotheses Must Be Prespecified
The score order and group direction should be selected before viewing the result. Changing from female-minus-male to male-minus-female changes the sign of z but not the two-sided p-value. Changing the grade scores can change the statistic itself. The distinction between planned and data-driven choices is part of responsible null and alternative hypothesis formulation and reduces the risk of selective reporting.
When to Use the Cochran Mantel Haenszel Test
Use It When
- There is a categorical exposure or grouping variable.
- There is a categorical response variable.
- A third categorical variable defines meaningful strata.
- Observations are independent within and between strata.
- The goal is an adjusted categorical association test.
- The score-based version is chosen because the response is ordinal.
- The score order is meaningful and specified in advance.
- A compact one-degree-of-freedom trend or location test is scientifically relevant.
Choose Another Method When
- Observations are paired, repeated or clustered beyond the stated strata.
- Many covariates require simultaneous adjustment.
- The outcome is continuous and should remain continuous.
- The response order is arbitrary or disputed.
- Strata contain too little information for an asymptotic test.
- The effect varies sharply across strata and one combined statistic is misleading.
- Prediction, interaction modelling or individual risk estimation is the main goal.
- Survey weights or complex design features require specialised variance estimation.
Decision Flow
If no, start with a standard chi-square test.
If yes, consider row mean scores rather than general association.
If yes, a common-odds-ratio CMH analysis may also be relevant.
The Cochran Mantel Haenszel Test is especially useful when a simple pooled table may be confounded. It is not a universal substitute for regression; it is a focused stratified test that works best when the number of strata and table dimensions remain interpretable.
Cochran Mantel Haenszel Test Variants and Their Meanings
Choosing the correct CMH statistic is part of the analysis, not a cosmetic software option. The same three-way table can support different null hypotheses depending on whether the row and column variables are nominal or ordinal.
Treats row and column categories as nominal and tests any conditional association.
Uses ordered column scores and compares mean scores across nominal rows. This is the current analysis.
Uses scores for both variables and tests conditional linear association between scores.
Designed for collections of 2 × 2 tables and estimates a pooled conditional odds ratio.
| Variant | Typical table | Degrees of freedom | Primary question | Current example? |
|---|---|---|---|---|
| General association | R × C × K | (R−1)(C−1) | Is any conditional association present? | Not primary |
| Row mean scores | R × ordered C × K | R−1; equals 1 when R=2 | Do row groups differ in ordered column location? | Yes |
| Correlation | ordered R × ordered C × K | 1 | Are the scored variables conditionally correlated? | No; sex is nominal |
| Common odds ratio | 2 × 2 × K | 1 | Is the common conditional odds ratio equal to 1? | No; outcome has four levels |
Why the Common Odds Ratio Is Not Reported
A pooled odds ratio requires binary row and column variables. Here the G3 outcome has four ordered categories. Collapsing it to pass/fail would answer a different question and discard information. If a project genuinely uses several 2 × 2 strata, the common-odds-ratio result should be paired with the Breslow–Day test to assess whether stratum-specific odds ratios are sufficiently homogeneous.
Variables, Coding and Data Dictionary
| Variable | Role | Coding | Valid N | Meaning |
|---|---|---|---|---|
| school | Stratification variable | GP or MS | 649 | Defines the two conditional tables. |
| sex | Row/group variable | F = female; M = male | 649 | Compares two independent groups within each school. |
| G3 | Original quantitative variable | Final grade from 0 to 19 | 649 | Source used to create the ordered outcome. |
| grade score | Ordered response | 1 = below 10; 2 = 10–13; 3 = 14–16; 4 = 17+ | 649 | Supplies the scores used by the row-mean-scores statistic. |
Why the Grade Bands Must Be Transparent
The Cochran Mantel Haenszel Test uses the assigned numeric scores, so the cut points and scores belong in the public method description. Readers should be able to reproduce the category conversion. A frequency and relative-frequency table should also be inspected before testing to ensure that no coding error has created empty or implausible categories.
Excel grade-score formula
=IF(C5<10,1,IF(C5<=13,2,IF(C5<=16,3,4)))
Maps the original G3 score to the four ordered levels.
Direction convention
Male is the focal row for score totals; female is the comparison row.
Negative z therefore means the male score distribution is shifted downward.
Sample Composition
| School | Female | Male | Total | Share of full sample |
|---|---|---|---|---|
| GP | 237 | 186 | 423 | 65.18% |
| MS | 146 | 80 | 226 | 34.82% |
| Total | 383 | 266 | 649 | 100.00% |
Cochran Mantel Haenszel Test Formula and Manual Calculation
The row-mean-scores Cochran Mantel Haenszel Test builds one score total and one null variance for each stratum. The worked calculation uses male as the focal row and column scores 1, 2, 3 and 4.
Notation
| Symbol | Definition |
|---|---|
| h | Stratum index: GP or MS. |
| nFh, nMh | Female and male totals in stratum h. |
| nhj | Total number in grade category j within stratum h. |
| sj | Prespecified score for grade category j. |
| Th | Observed male score total in stratum h. |
| Eh | Expected male score total under conditional independence. |
| Vh | Fixed-margin variance of the male score total. |
Step 1: Observed Male Score Total
GP: 1(23) + 2(108) + 3(44) + 4(11) = 415. MS: 1(27) + 2(43) + 3(8) + 4(2) = 145.
Step 2: Overall Mean Score Within Each Stratum
GP mean score = 2.3498818. MS mean score = 1.9646018. The lower MS mean reflects a different overall school profile, which is why school should not be ignored.
Step 3: Expected Male Score Total
GP expected male score = 186 × 2.3498818 = 437.0780142. MS expected male score = 80 × 1.9646018 = 157.1681416.
Step 4: Observed Minus Expected
GP D = 415 − 437.0780142 = −22.0780142. MS D = 145 − 157.1681416 = −12.1681416. The combined difference is −34.2461558.
Step 5: Fixed-Margin Variance
GP variance = 56.3582377. MS variance = 34.8486212. Their sum is 91.2068589.
Step 6: Combined CMH Statistic
Step 7: Signed Standard-Normal Score
The squared z equals the one-degree-of-freedom CMH statistic. The two-sided chi-square probability is p = 0.0003359187. This is far below .05 and .01.
Observed Tables, Expected Counts and Ordinal Profiles
GP School: Observed Counts
| Sex | Low <10 | Medium 10–13 | High 14–16 | Very high 17+ | Total |
|---|---|---|---|---|---|
| Female | 9 | 137 | 68 | 23 | 237 |
| Male | 23 | 108 | 44 | 11 | 186 |
| Total | 32 | 245 | 112 | 34 | 423 |
GP School: Row Percentages
| Sex | Low | Medium | High | Very high |
|---|---|---|---|---|
| Female | 3.80% | 57.81% | 28.69% | 9.70% |
| Male | 12.37% | 58.06% | 23.66% | 5.91% |
Within GP, the male low-grade share is more than three times the female low-grade share. Female students have higher percentages in the high and very-high bands. The male mean score is 2.2312 compared with 2.4430 for females.
MS School: Observed Counts
| Sex | Low <10 | Medium 10–13 | High 14–16 | Very high 17+ | Total |
|---|---|---|---|---|---|
| Female | 41 | 67 | 28 | 10 | 146 |
| Male | 27 | 43 | 8 | 2 | 80 |
| Total | 68 | 110 | 36 | 12 | 226 |
MS School: Row Percentages
| Sex | Low | Medium | High | Very high |
|---|---|---|---|---|
| Female | 28.08% | 45.89% | 19.18% | 6.85% |
| Male | 33.75% | 53.75% | 10.00% | 2.50% |
Within MS, males again have more mass in the two lower bands and less mass in the two upper bands. The male mean score is 1.8125 compared with 2.0479 for females. The direction therefore agrees with GP even though the school-wide grade profiles differ greatly.
Expected Counts Under Conditional Independence
| School | Sex | Low | Medium | High | Very high |
|---|---|---|---|---|---|
| GP | Female | 17.929 | 137.270 | 62.752 | 19.050 |
| GP | Male | 14.071 | 107.730 | 49.248 | 14.950 |
| MS | Female | 43.929 | 71.062 | 23.257 | 7.752 |
| MS | Male | 24.071 | 38.938 | 12.743 | 4.248 |
For a refresher on how joint counts become row, column and total percentages, see two-way tables and relative frequencies.
Complete Cochran Mantel Haenszel Test Results
One degree of freedom
Male-minus-female direction
Two-sided asymptotic
Observed minus expected male total
Observed minus expected male total
Score-test signal, not an odds ratio
Primary Result Table
| Test | Statistic | df | P-value | Decision |
|---|---|---|---|---|
| Row-mean-scores Cochran Mantel Haenszel Test | 12.8586731 | 1 | 0.0003359187 | Reject conditional-independence null |
Stratum Score Components
| School | N | Observed male score | Expected male score | Difference | Variance |
|---|---|---|---|---|---|
| GP | 423 | 415.000 | 437.078 | −22.078 | 56.3582 |
| MS | 226 | 145.000 | 157.168 | −12.168 | 34.8486 |
| Combined | 649 | — | — | −34.246 | 91.2069 |
Mean-Score Differences
| School | Female mean | Male mean | Male − female |
|---|---|---|---|
| GP | 2.4430 | 2.2312 | −0.2119 |
| MS | 2.0479 | 1.8125 | −0.2354 |
| Pooled descriptive | 2.2924 | 2.1053 | −0.1872 |
The similar negative differences in GP and MS make the combined direction easy to interpret. The test does not estimate a causal effect or a common odds ratio. It establishes that the ordered grade profiles differ after stratifying by school.
Comparison Statistics from SPSS Crosstabs
| Table | Pearson χ² | df | P | Linear-by-linear χ² | P |
|---|---|---|---|---|---|
| GP | 12.975 | 3 | .005 | 8.649 | .003 |
| MS | 5.782 | 3 | .123 | 4.249 | .039 |
| Collapsed total | 8.886 | 3 | .031 | 8.869 | .003 |
The school-specific Pearson tests do not tell the same story because they use three degrees of freedom and evaluate any shape difference. The row-mean-scores Cochran Mantel Haenszel Test targets a consistent ordered shift and combines it across schools. This is an example of why the scientific question should determine the statistic rather than selecting whichever p-value is smallest.
Cochran Mantel Haenszel Test Assumptions and Diagnostic Checks
The Cochran Mantel Haenszel Test is robust only when its design assumptions match the data. These conditions differ from the familiar expected-count checklist used for a single Pearson table, although cell sparsity still matters for the asymptotic approximation.
Each student contributes to one sex category, one grade band and one school stratum.
GP and MS are separate groups; no student appears in both.
Scores 1–4 follow increasing grade achievement.
Cut points and scores are not selected after seeing the result.
Both strata contain female and male observations across several bands.
Both strata have negative score deviations, so the combined direction is not masking a reversal.
Expected-Count Review
The GP table has no expected count below 5. The MS table has one expected cell below 5, with a minimum expected count of approximately 4.25. This does not automatically invalidate the score test, but it should be disclosed. For many small or sparse strata, consider exact conditional methods, permutation procedures or a model suited to sparse ordinal outcomes. The broader chi-square assumptions guide explains why expected-count rules are diagnostic rather than ritual.
Homogeneity Is Variant-Specific
The current row-mean-scores analysis does not estimate a common odds ratio, so the Breslow–Day homogeneity-of-odds-ratios assumption is not its primary condition. When the analysis is 2 × 2 × K and a pooled odds ratio is reported, however, heterogeneity must be examined rather than assumed.
Sensitivity to Scores and Cut Points
Scores 1–4 imply equal spacing between adjacent grade bands. A sensitivity analysis can compare table scores with rank or ridit scores. Results that change sharply under plausible scoring systems should be reported cautiously. It is also useful to analyse original G3 as a quantitative outcome when that scale remains scientifically defensible.
Independence Versus Clustering
School is treated as a fixed stratifier, not as a random cluster with many school-level units. With many schools, repeated observations or class-level dependence, a multilevel or generalised estimating approach may be preferable. The generalized linear model framework offers model-based extensions.
Cochran Mantel Haenszel Test Versus Related Tests
| Method | Controls strata? | Uses order? | Typical output | Best use |
|---|---|---|---|---|
| Row-mean-scores Cochran Mantel Haenszel Test | Yes | Yes, for column outcome | 1-df score statistic and signed z | Consistent ordinal shift across strata |
| Pearson chi-square independence | No in a collapsed table | No | R×C chi-square | Unadjusted nominal association |
| Chi-square homogeneity | No unless run separately | No | Distribution equality test | Compare categorical distributions across populations |
| CMH common odds ratio | Yes | Binary only | Pooled OR and test | Collections of 2×2 tables |
| Breslow–Day test | Yes | Binary only | Odds-ratio heterogeneity test | Check common-OR assumption |
| Ordinal logistic regression | Yes, through covariates | Yes | Adjusted odds ratios and predictions | Multiple covariates, interactions and modelling |
| Binary logistic regression | Yes, through covariates | Only after dichotomising | Adjusted binary odds ratios | Genuinely binary outcomes |
| Fisher exact test | Usually one table | No | Exact probability | Small nominal tables |
Versus a Chi-Square Test of Independence
A standard chi-square test of independence can be run on the collapsed sex-by-grade table, but it ignores school. Separate tests within schools do not provide one adjusted conclusion. The Cochran Mantel Haenszel Test combines within-stratum information while retaining the control structure.
Versus a Test for Homogeneity
A chi-square test of homogeneity asks whether categorical distributions are equal across independently sampled populations. The mathematics may resemble independence testing, but the sampling interpretation differs. The Cochran Mantel Haenszel Test adds a stratification layer and can exploit order.
Versus Ordinal Logistic Regression
Ordinal logistic regression can include school, sex, interactions and additional covariates, and it estimates adjusted odds ratios under a proportional-odds assumption. The Cochran Mantel Haenszel Test is simpler and less model-dependent but does not provide individual predictions or a full coefficient model.
Versus Binary Exact Tests
Barnard’s exact test, Boschloo’s test and the binomial test answer binary questions. They are not substitutes for a four-category stratified ordinal analysis unless the research question genuinely justifies binary recoding.
Cochran Mantel Haenszel Test Calculator: Step-by-Step Workflow
A trustworthy Cochran Mantel Haenszel Test calculator must identify which CMH statistic it computes. Entering a 2 × 4 × 2 table into a calculator designed only for 2 × 2 × K odds ratios will return the wrong analysis or reject the table.
Required Inputs
| Input | Worked value | Purpose |
|---|---|---|
| Strata | GP and MS | Keeps school-specific margins separate. |
| Row groups | Female and male | Defines the two distributions being compared. |
| Ordered categories | Low, medium, high, very high | Defines the outcome order. |
| Scores | 1, 2, 3, 4 | Converts categories to ordinal score totals. |
| Alternative | Two-sided | Tests any upward or downward shift. |
| Alpha | 0.05 | Decision threshold chosen before testing. |
Calculation Checklist
- Enter the eight GP counts and eight MS counts.
- Confirm female and male totals of 383 and 266.
- Confirm stratum totals of 423 and 226.
- Assign grade scores 1–4 in increasing order.
- Calculate male observed score totals of 415 and 145.
- Calculate expected male score totals of 437.0780 and 157.1681.
- Calculate variance components of 56.3582 and 34.8486.
- Combine differences and variances to obtain CMH = 12.8587.
- Use one chi-square degree of freedom to obtain p = 0.0003359.
- Retain the negative signed z to explain direction.
The general chi-square calculator is useful for ordinary tables, but this score-based stratified calculation requires the dedicated formulas shown above.
Python Cochran Mantel Haenszel Test Chart Interpretations
The six Python figures translate the score-test calculation into observed totals, expected totals, deviations, variances, stratum tables and the final inferential result. Every chart should be read with the exact values rather than as decoration.
Python Chart 1: Cochran Mantel Haenszel Test — Observed and Expected Male Ordinal Scores
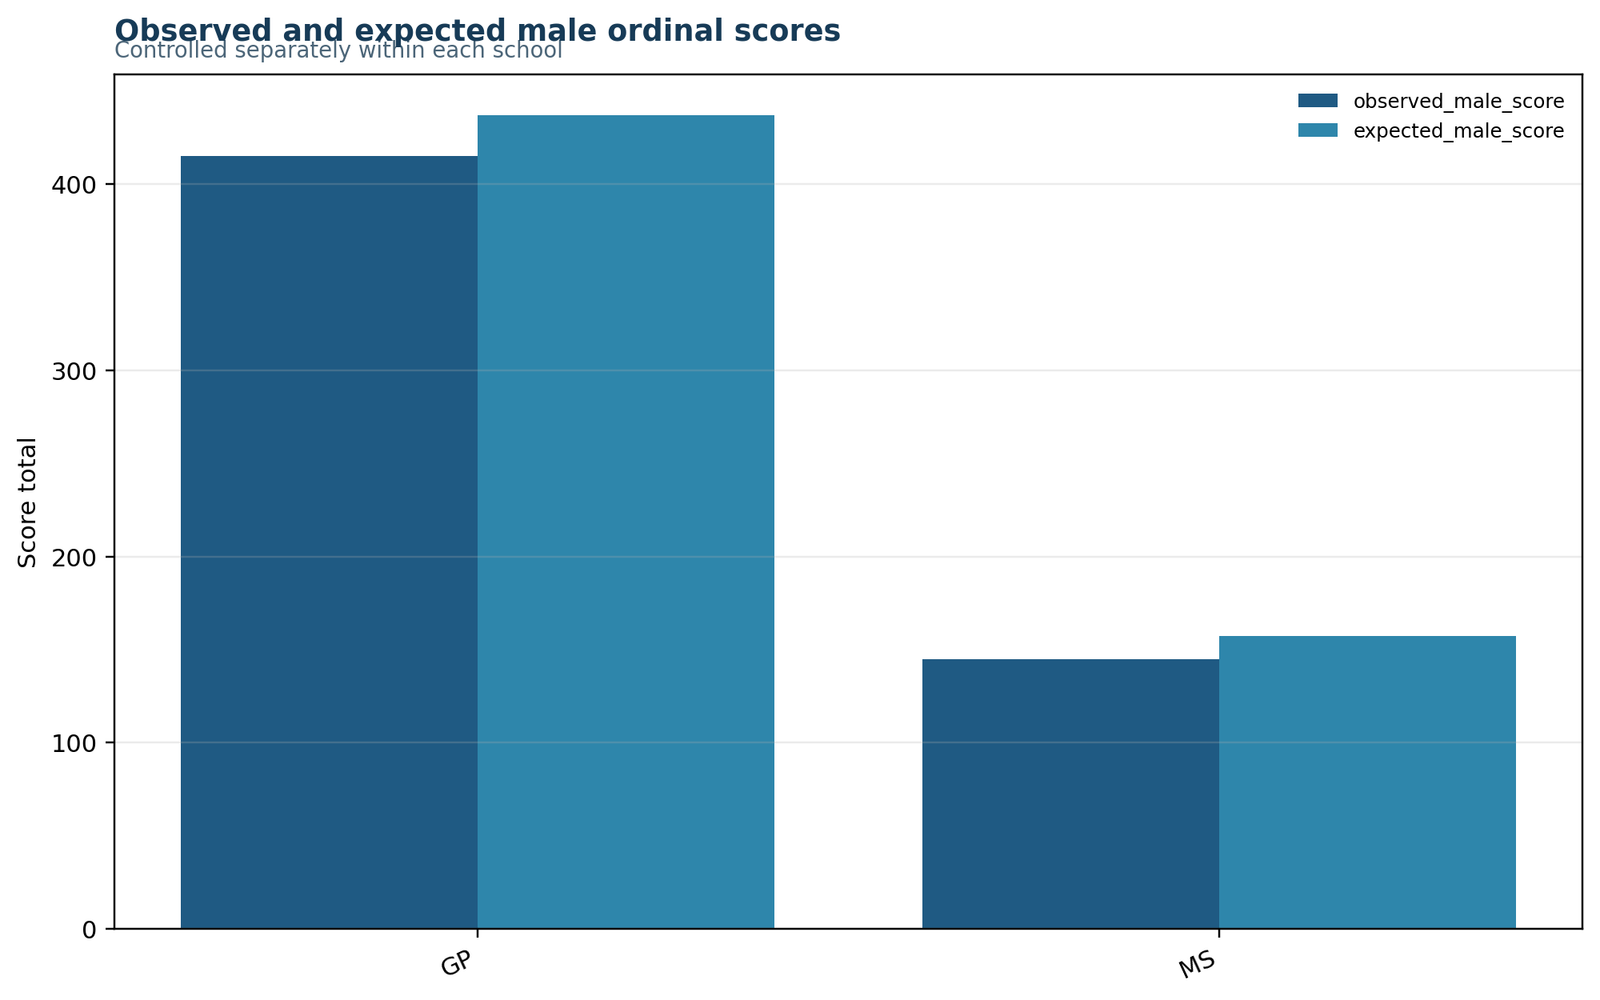
In both schools, the observed bar is below the expected bar. The gap is larger in GP because GP has more students and a larger information contribution.
GP: observed 415 versus expected 437.078. MS: observed 145 versus expected 157.168.
The male ordinal score total is lower than expected under conditional independence in each stratum. This consistent direction drives the negative signed z.
A combined result is credible because the two school-specific deviations do not cancel one another.
Python Chart 2: Cochran Mantel Haenszel Test — Score Deviations by School
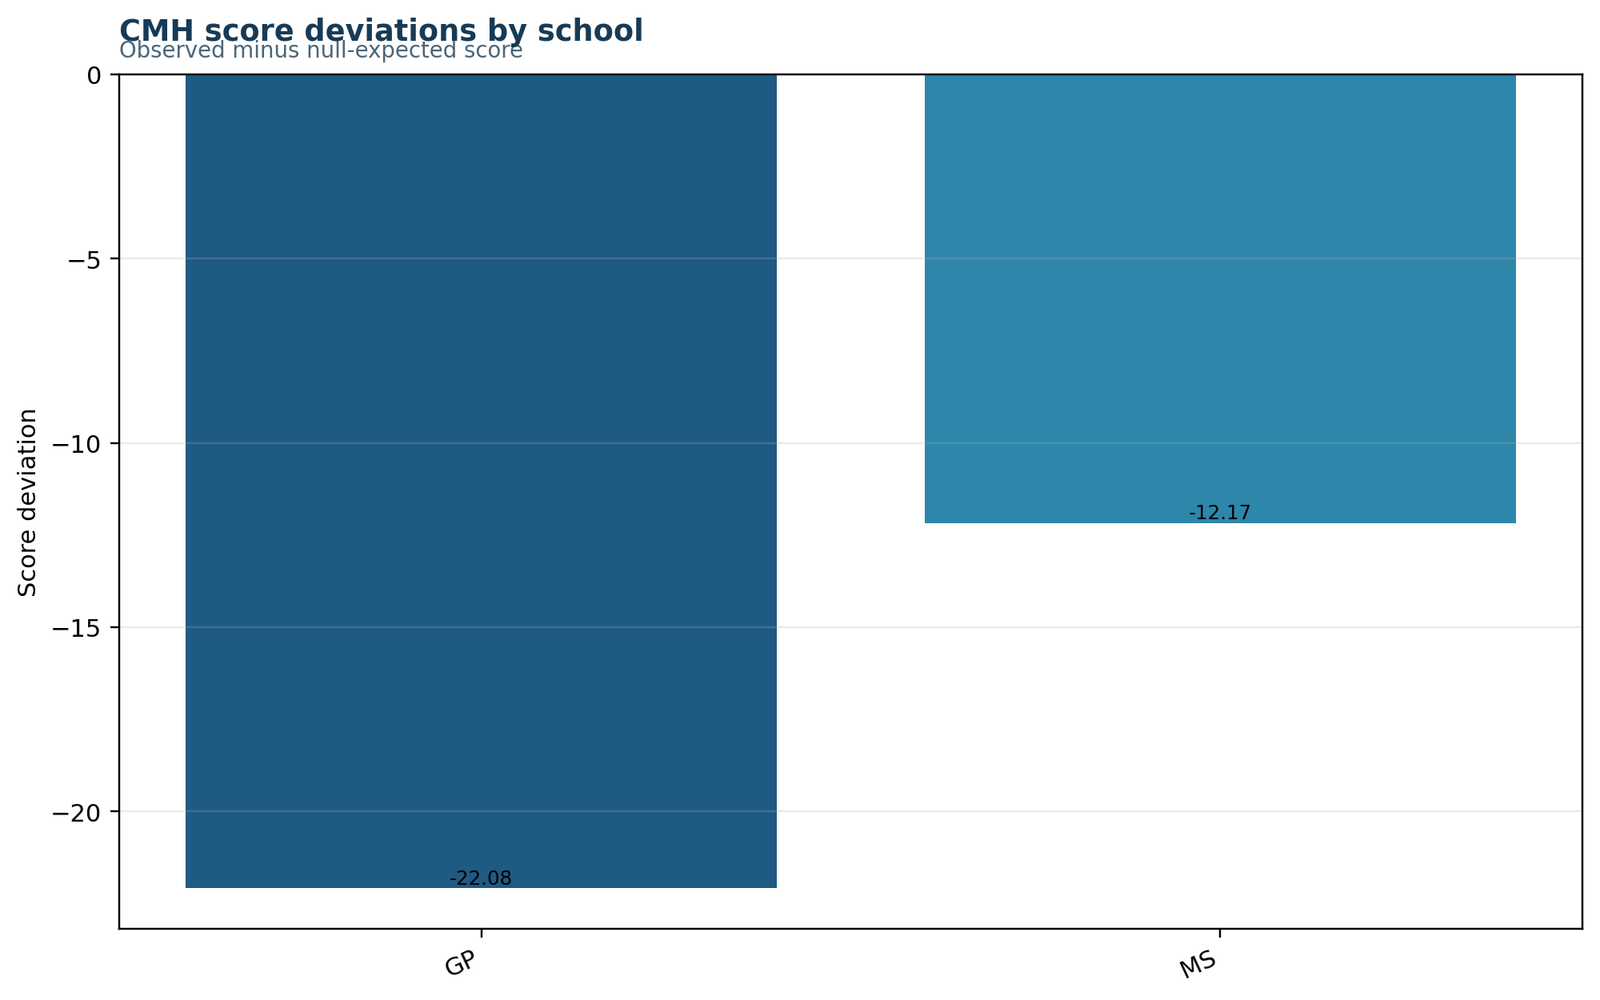
Both bars extend below zero. GP has a deviation near −22.08 and MS has a deviation near −12.17.
Combined deviation: −34.2462. GP share: 64.47% of the absolute combined difference. MS share: 35.53%.
Negative values mean the male group accumulated fewer high-category score points than expected from the fixed margins.
The sign communicates direction, while the square of the combined standardized deviation produces the chi-square statistic.
Python Chart 3: Cochran Mantel Haenszel Test — Variance Contributions
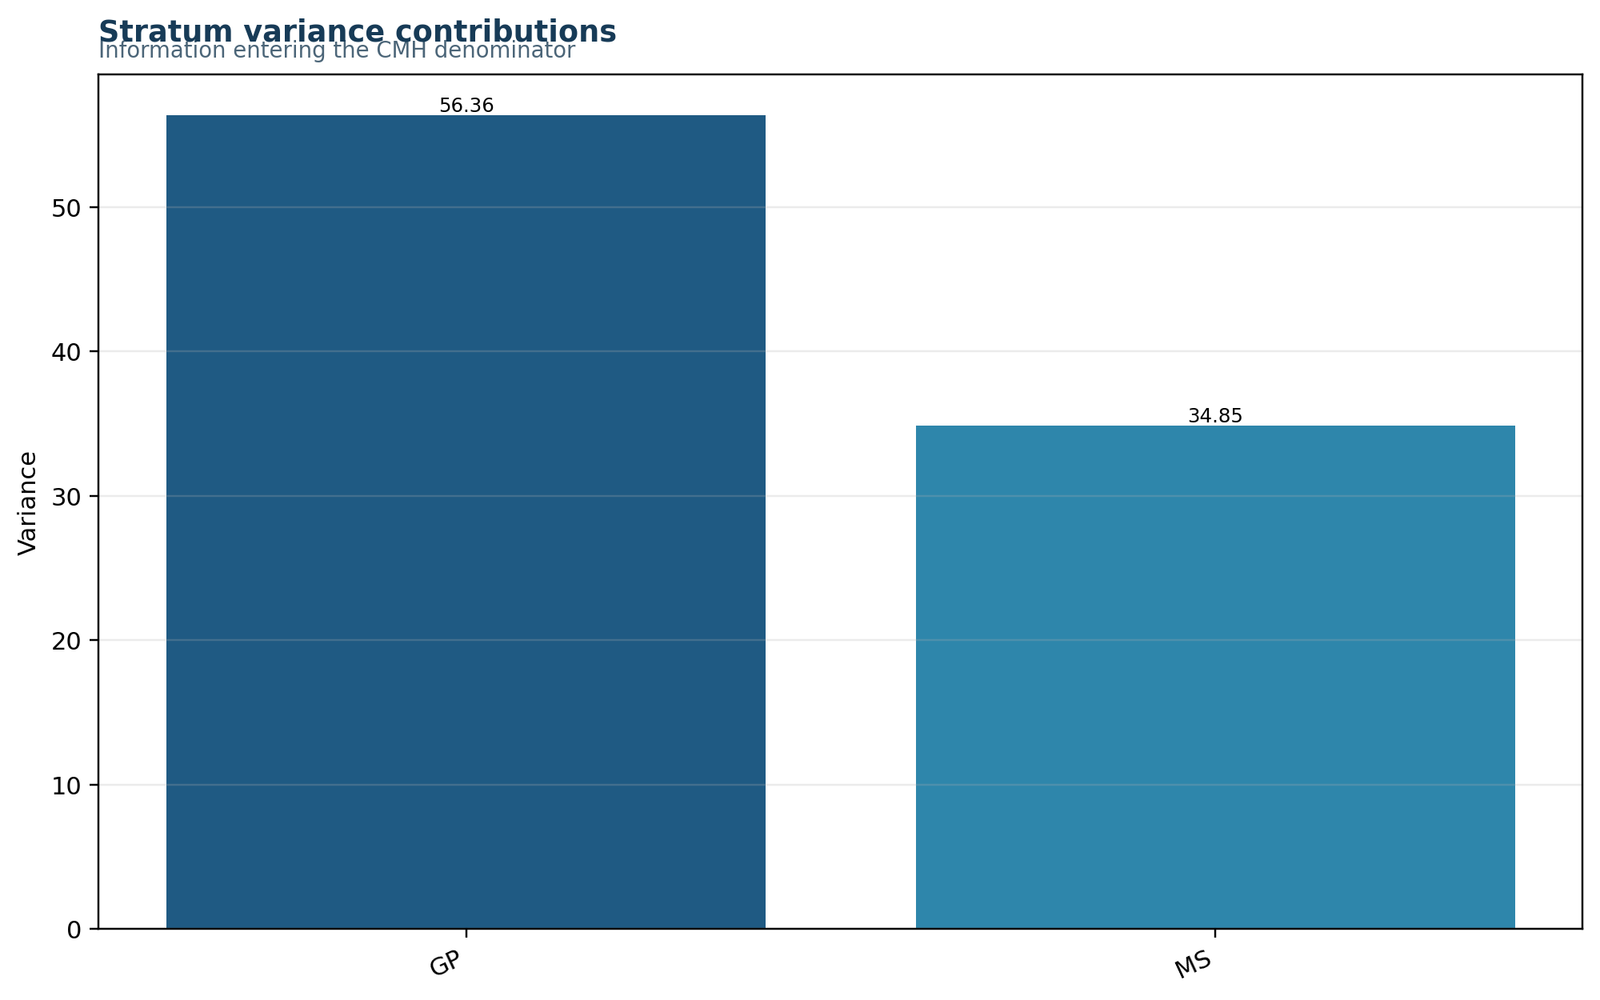
GP contributes more variance information than MS, consistent with its larger sample and category distribution.
GP variance: 56.3582. MS variance: 34.8486. Total: 91.2069.
Variance prevents a large raw score difference from being interpreted without considering its expected sampling fluctuation.
The final statistic is not a simple sum of school chi-square values; it standardizes the combined score difference by combined variance.
Python Chart 4: Cochran Mantel Haenszel Test — GP Ordinal Grade Table
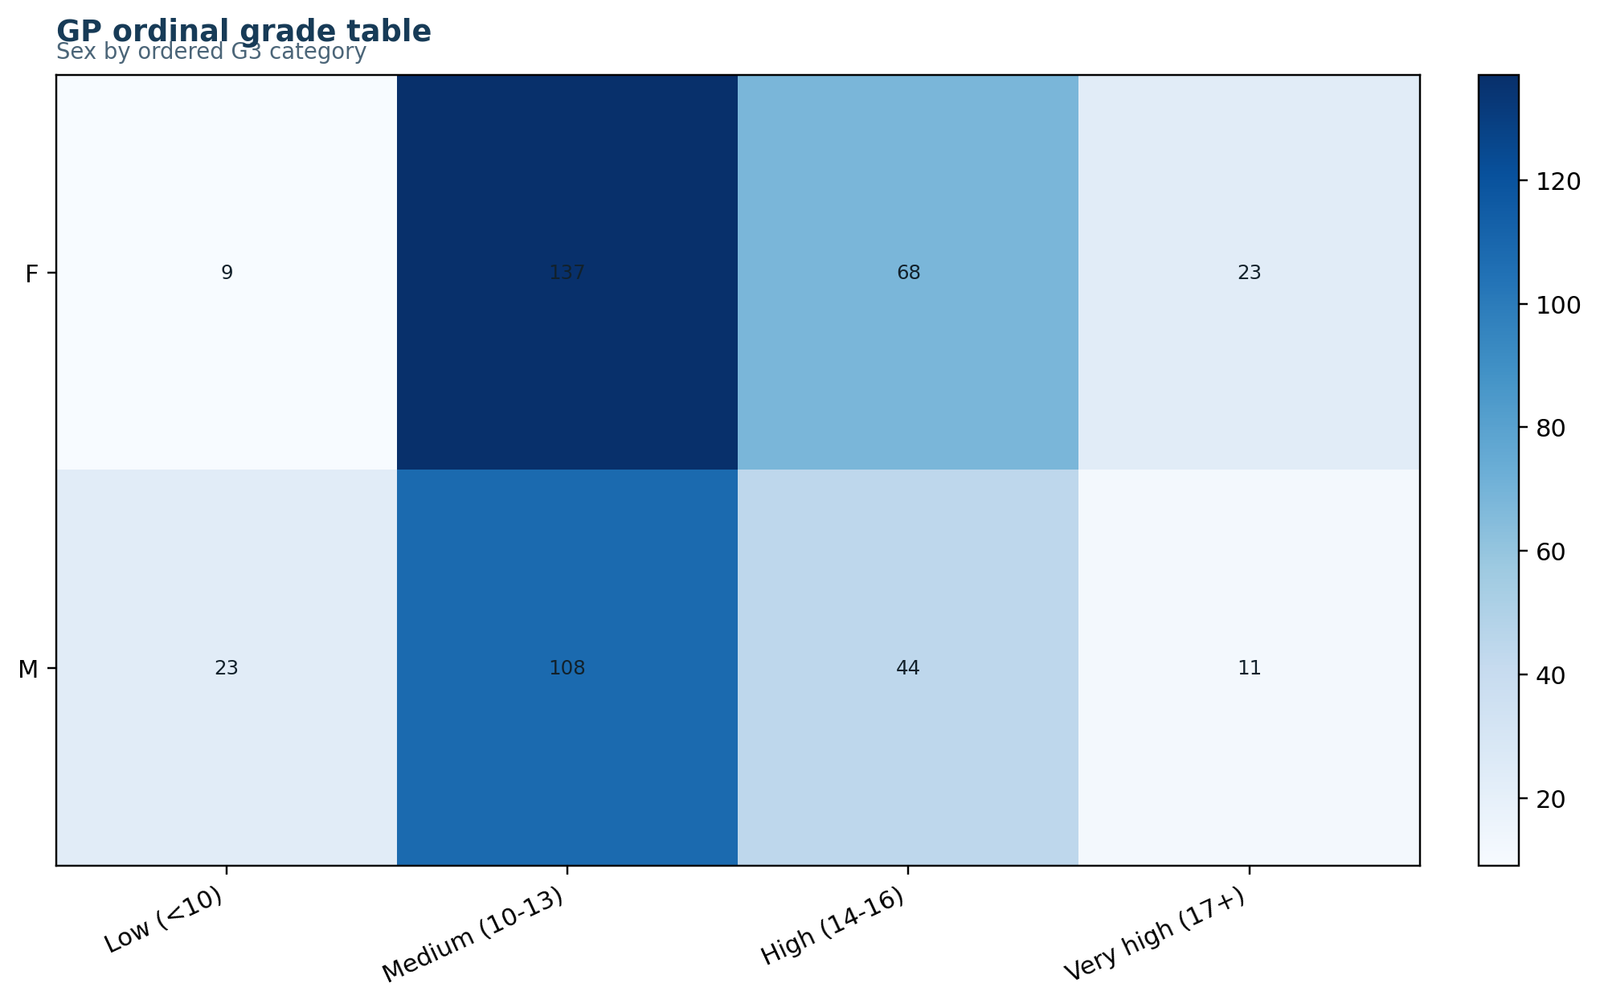
Female and male patterns differ primarily at the low end and, to a lesser extent, in high and very-high categories.
Female: 9, 137, 68, 23. Male: 23, 108, 44, 11. Female n = 237; male n = 186.
Raw counts must be read with denominators. The low-grade percentages are 3.80% for females and 12.37% for males.
The GP table contributes a clear downward male shift and the larger of the two variance components.
Python Chart 5: Cochran Mantel Haenszel Test — MS Ordinal Grade Table
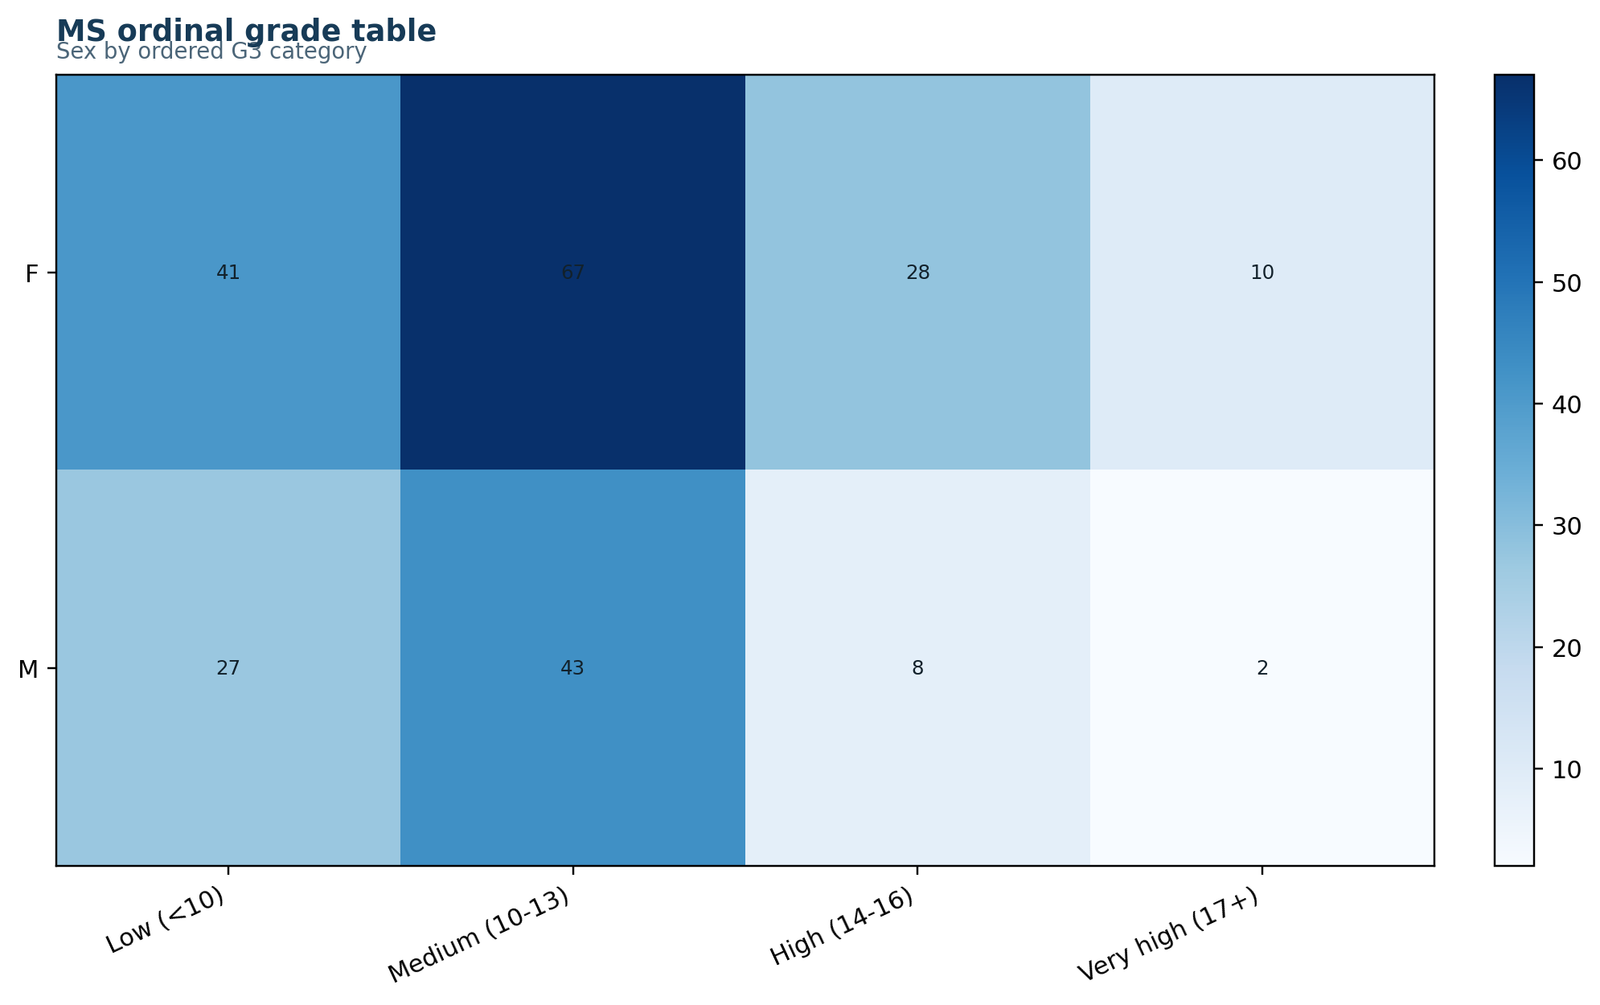
Within MS, males remain more concentrated in low and medium categories and less represented in high and very-high categories.
Female: 41, 67, 28, 10. Male: 27, 43, 8, 2. Female n = 146; male n = 80.
The male mean score is 1.8125 versus 2.0479 for females, a difference of −0.2354 score units.
A pooled table could confuse school composition with within-school sex differences. Stratification separates those sources.
Python Chart 6: Cochran Mantel Haenszel Test — Result Summary
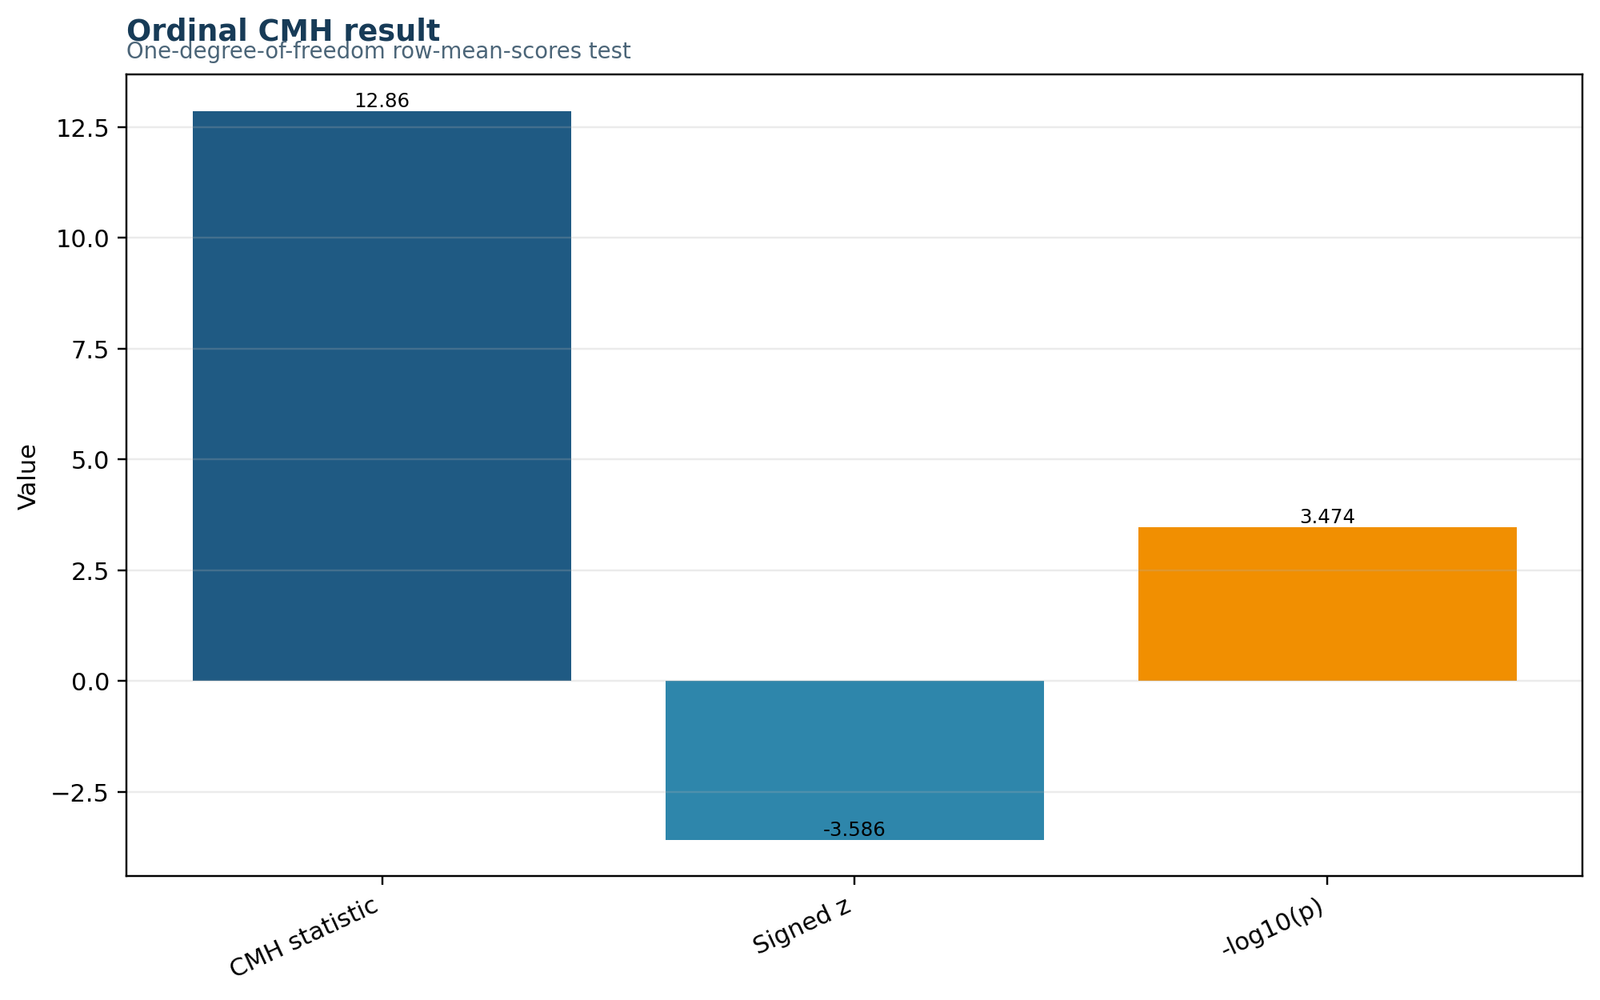
The CMH bar reaches 12.86, signed z is −3.586 and −log10(p) is approximately 3.474.
CMH: 12.8587. z: −3.5859. p: 0.0003359.
The chi-square statistic is nonnegative because it squares the standardized difference. Direction is preserved separately by z.
Reporting both values avoids the common error of trying to infer direction from chi-square alone.
R Cochran Mantel Haenszel Test Charts in Paired Rows
The R figures are arranged in three pairs. Each pair places a computational component beside the diagnostic needed to interpret it. This layout keeps the Cochran Mantel Haenszel Test narrative horizontal on desktop and collapses cleanly on mobile.
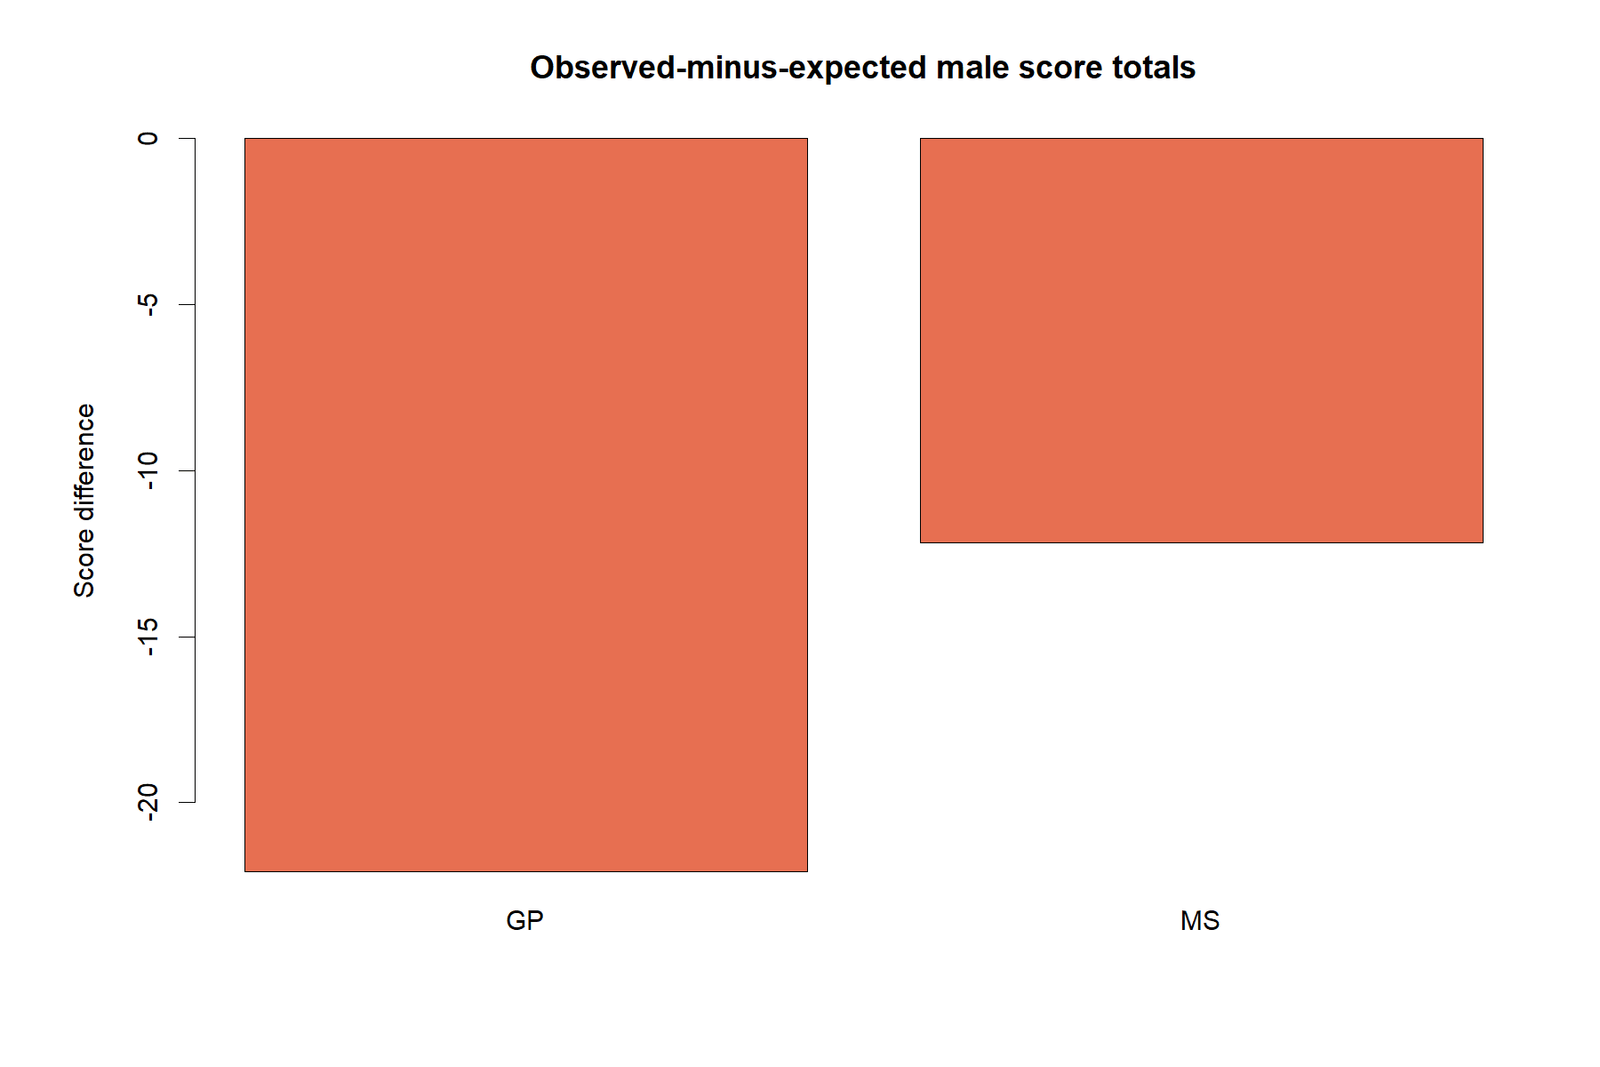
Cochran Mantel Haenszel Test Score Difference
Both score differences are below zero: −22.0780 in GP and −12.1681 in MS. The matching signs support one combined directional statement rather than a result driven by cancellation.
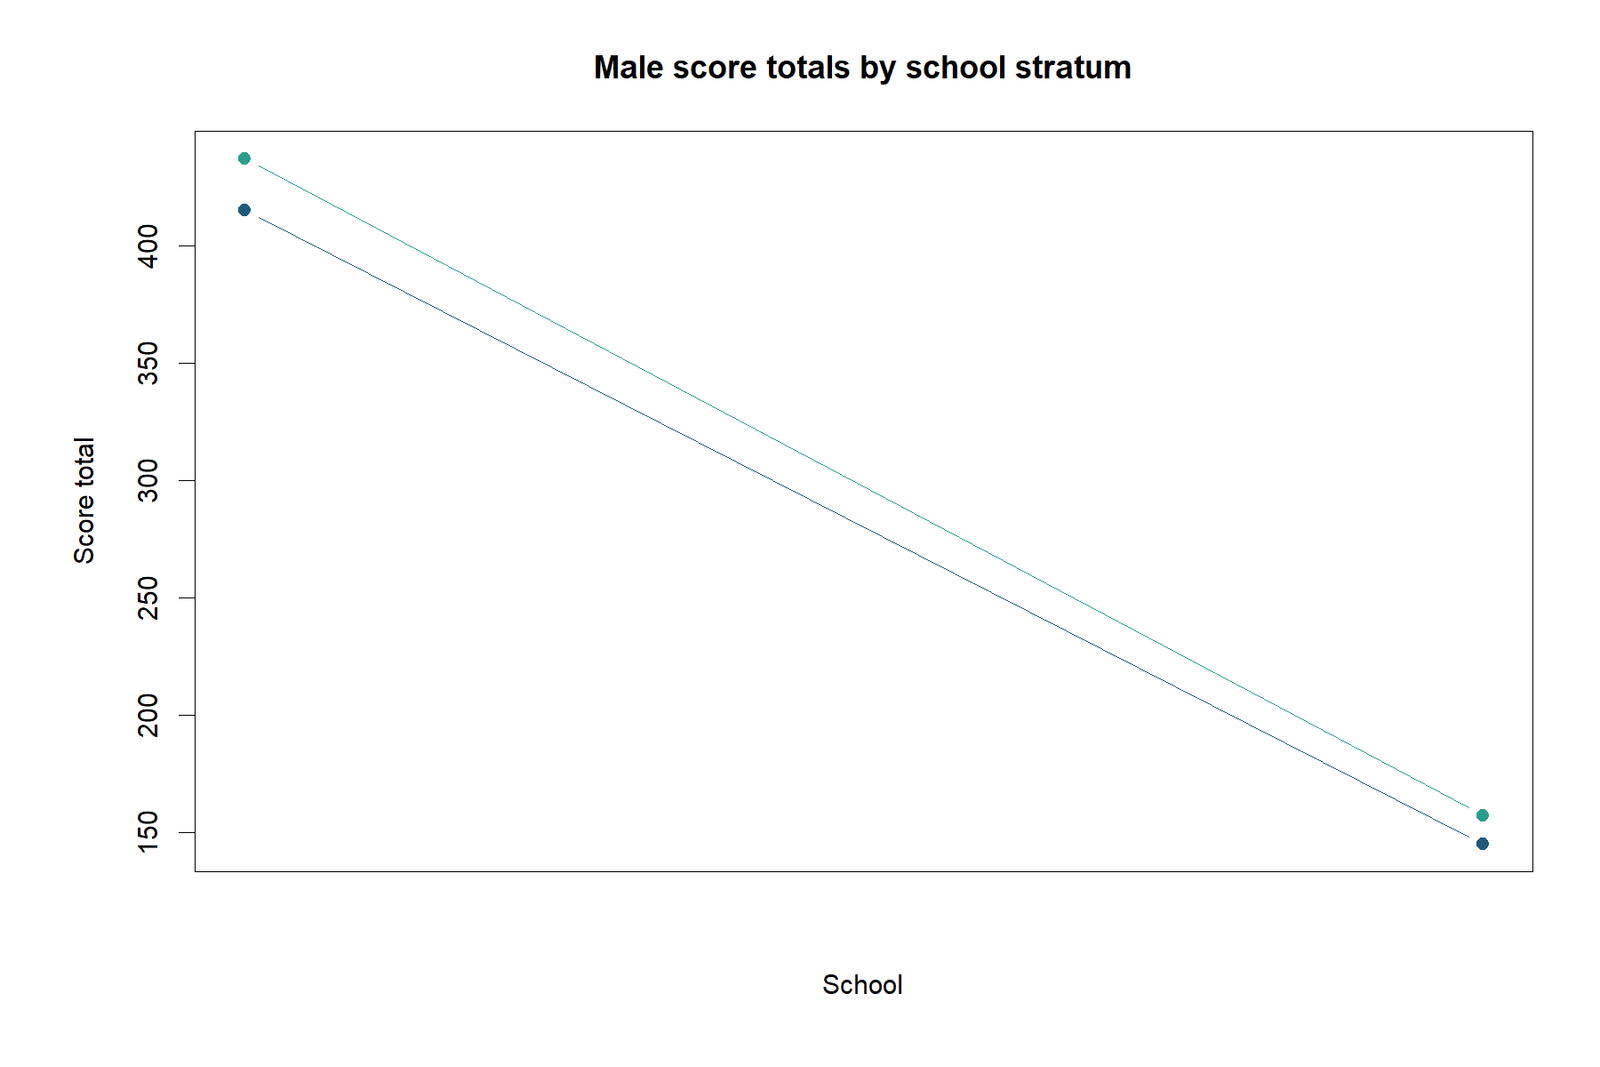
Cochran Mantel Haenszel Test Observed Versus Expected
The observed series stays below the expected series in both schools. The absolute levels differ because GP is larger and has a higher overall grade-score profile.
Cochran Mantel Haenszel Test Variance by Stratum
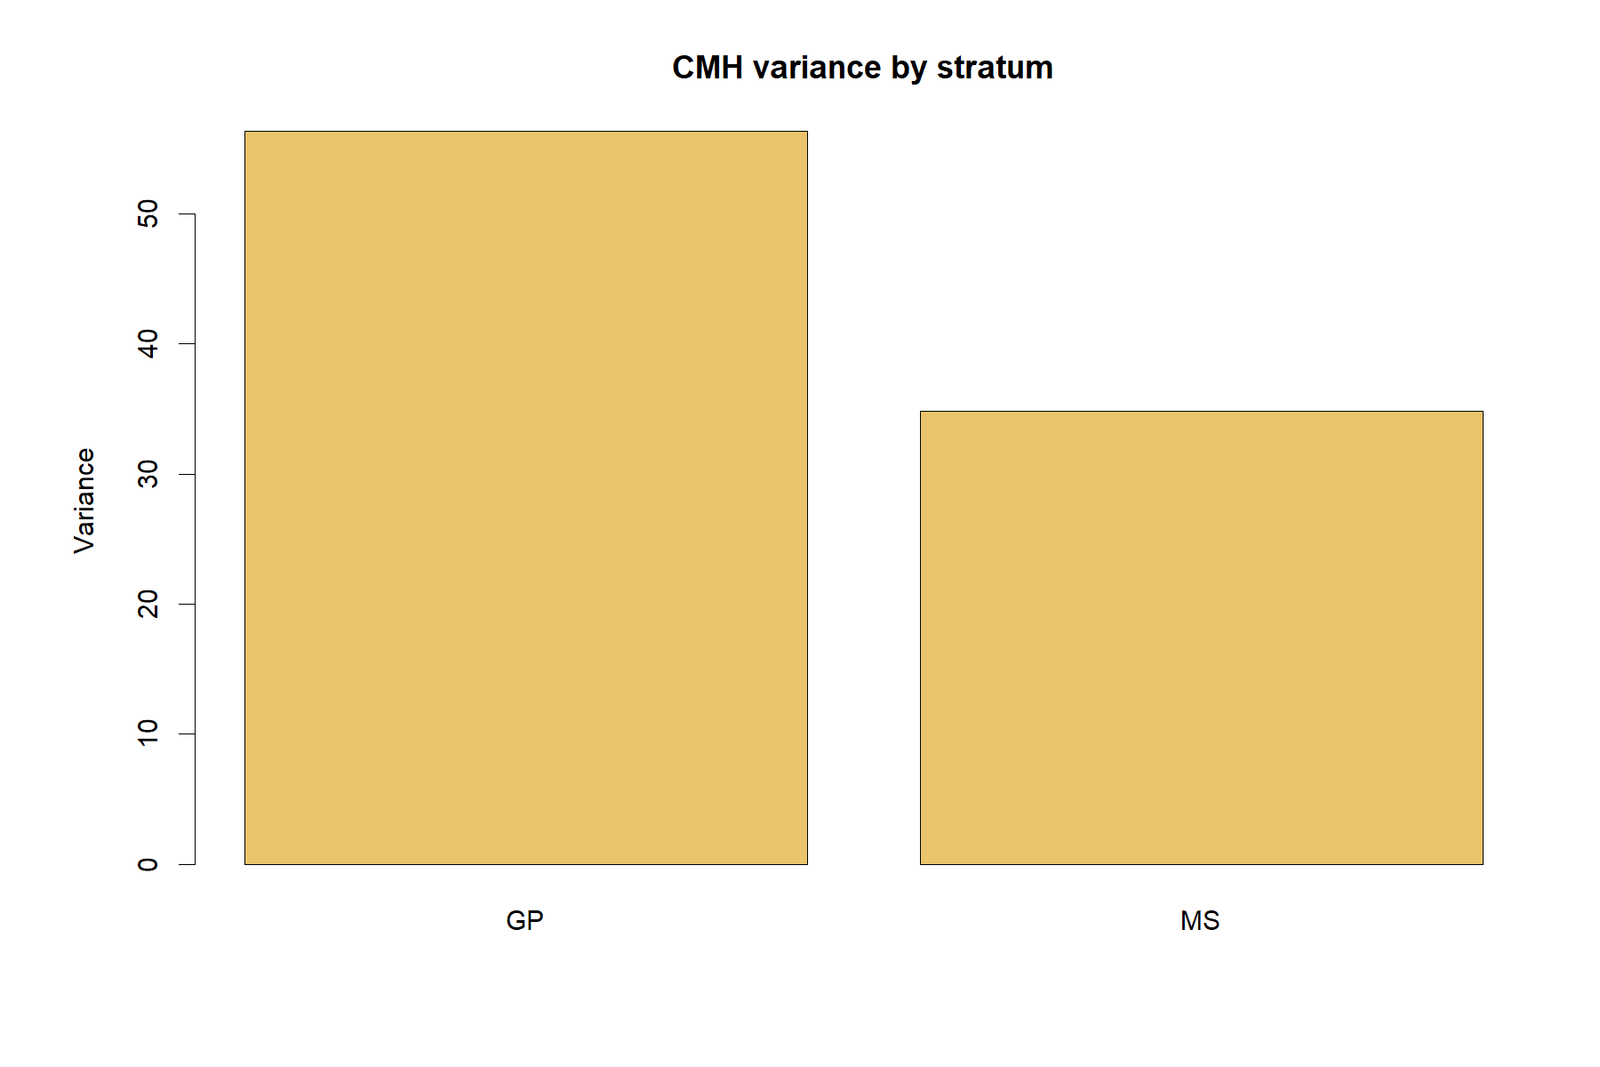
GP contributes 56.3582 variance units and MS contributes 34.8486. The denominator sums these values before the score deviation is standardized.
Cochran Mantel Haenszel Test Stratum Size
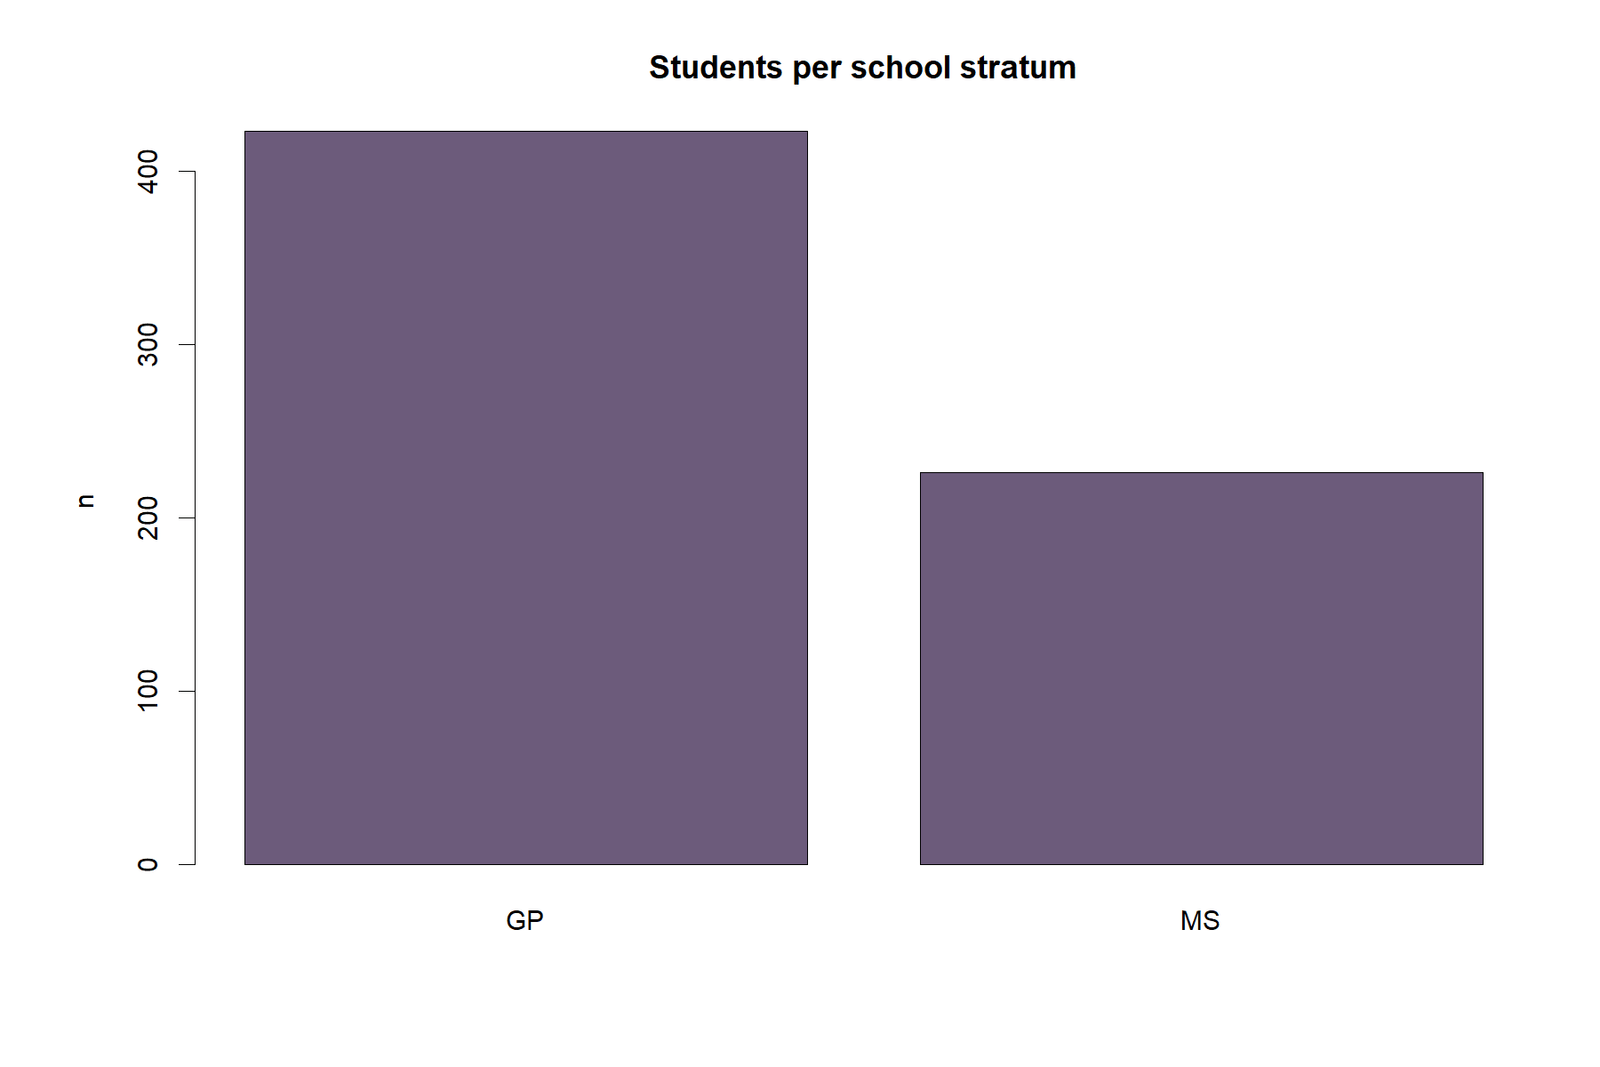
GP contains about 65.18% of the sample and MS about 34.82%. Larger size contributes information, but variance also depends on row margins and the distribution across score categories.
Cochran Mantel Haenszel Test Signed Standard-Normal Score
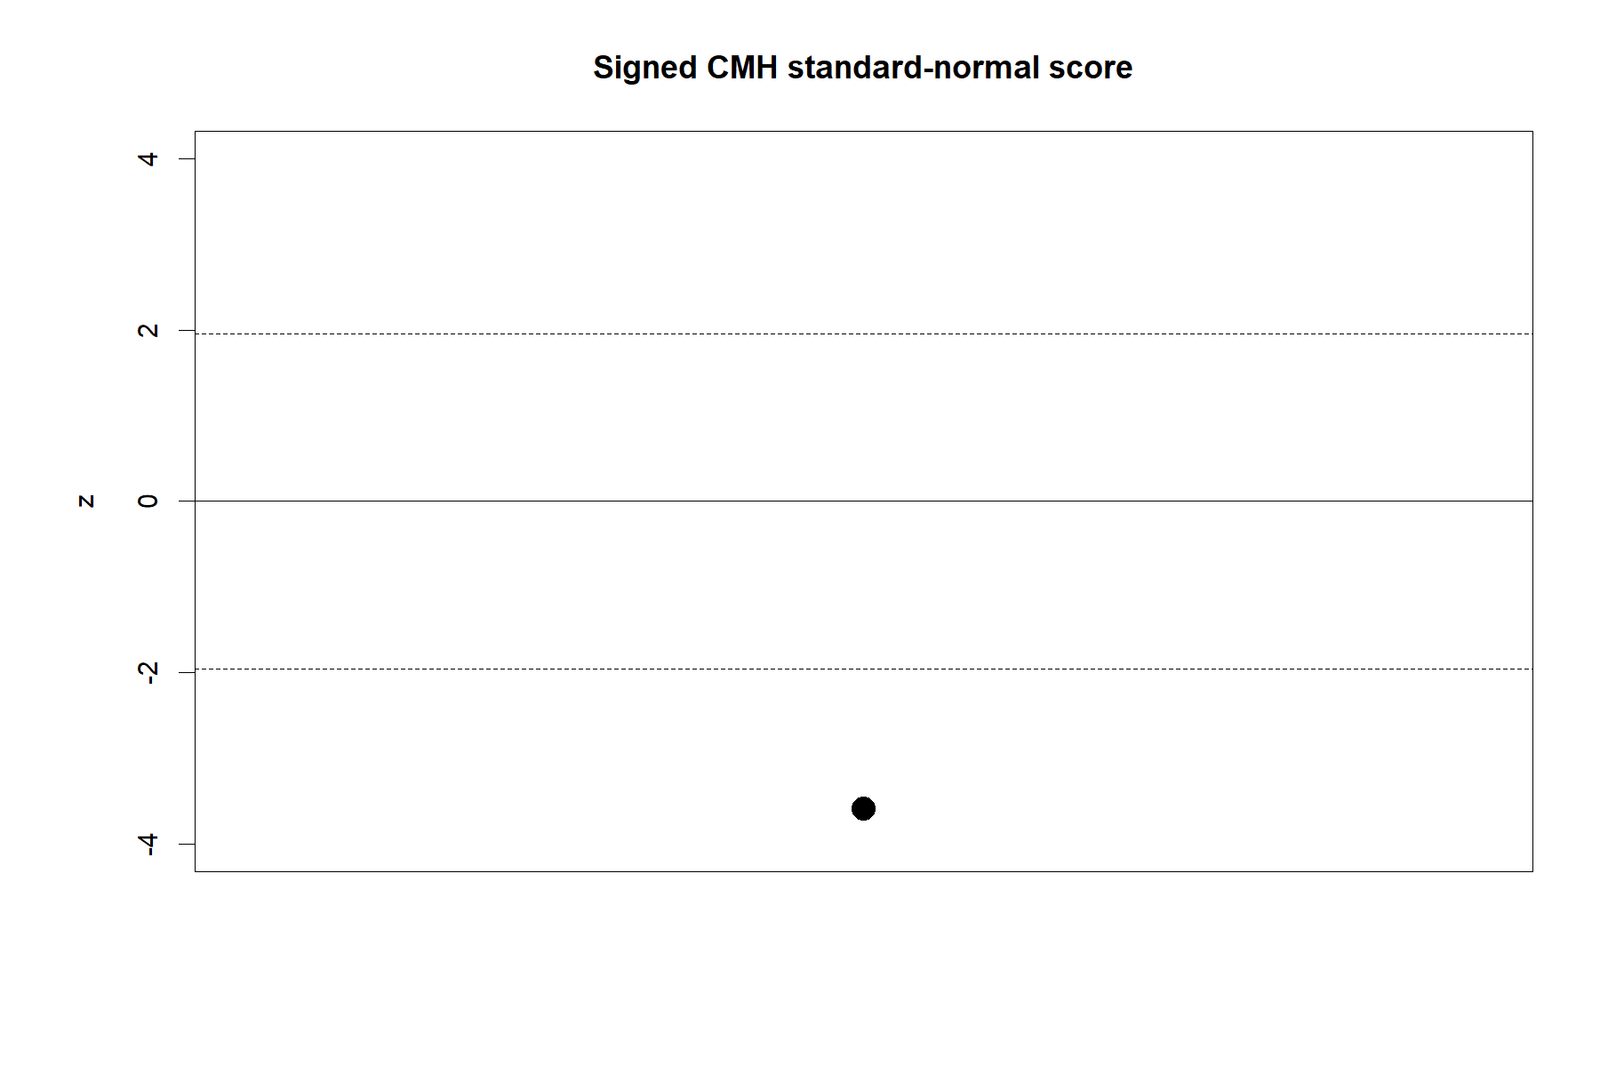
The point at −3.5859 lies well below −1.96, visually confirming a two-sided p-value below .05. Its negative location indicates a downward male score shift under the chosen coding.
Cochran Mantel Haenszel Test Result Summary
The summary reproduces the same three values as Python and Excel. The transformed p-value bar is a visualization aid; formal reporting should use the original p-value.
Cochran Mantel Haenszel Test in Python, R, SPSS, SAS and Excel
Cochran Mantel Haenszel Test in Python
Use a transparent custom implementation for the row-mean-scores statistic. Common StratifiedTable routines are aimed at collections of 2 × 2 tables and therefore do not reproduce this 2 × 4 × 2 score analysis.
- Read
school,sexandG3. - Create grade scores 1–4.
- Build one 2 × 4 table per school.
- Calculate score totals, expectations and variances.
- Cross-check z² against CMH.
See categorical data analysis in Python for broader table workflows.
Cochran Mantel Haenszel Test in R
Base R can reproduce the formula directly. The general mantelhaen.test() function can analyse higher-dimensional tables, but its generalized statistic is not automatically the same one-degree-of-freedom row-mean-scores test. Explicit scoring avoids ambiguity.
- Use an ordered factor for grade bands.
- Keep school as the stratum index.
- Declare numeric scores explicitly.
- Use
pchisq(cmh, 1, lower.tail=FALSE). - Retain the signed z separately.
Related workflows appear in categorical data analysis in R.
Cochran Mantel Haenszel Test in SPSS
CROSSTABS with /STATISTICS=CMH CHISQ produces the stratified tables and associated statistics. For a four-category response, the common-odds-ratio table is correctly unavailable. The supplied output also includes a validated integrated calculation of the row-mean-scores result.
- Code sex as 0/1 and grade band as 1–4.
- Use school as the layer variable.
- Request counts, row percentages and expected counts.
- Do not mislabel the Pearson or linear-by-linear value as the combined CMH score statistic.
- Export the full SPSS output.
Cochran Mantel Haenszel Test in SAS
PROC FREQ is particularly well suited to generalized CMH statistics. With school first in the table request, sex as the row variable and numeric grade score as the column variable, the CMH option reports the row-mean-scores statistic.
- Preserve grade values 1–4.
- Confirm ordering with
ORDER=DATAif needed. - Request CMH and cross-tabulations.
- Use exact options when design and computation justify them.
- Capture ODS tables for reproducibility.
Cochran Mantel Haenszel Test in Excel
The worked workbook contains formula-driven Data Input, Observed Tables, Calculations, Diagnostics and Reporting sheets. Excel is useful because every score component remains visible.
- Derive grade score with nested IF.
- Use COUNTIFS for observed counts.
- Calculate expected score totals from margins.
- Sum variance components.
- Use
CHISQ.DIST.RTfor the one-df p-value.
Cochran Mantel Haenszel Test in Stata and Minitab
Before using a menu or command labelled Mantel–Haenszel, verify whether it supports a generalized ordinal row-mean-scores statistic or only 2 × 2 strata. A model-based ordinal logistic regression is often the clearer route when multiple covariates are needed.
- Check table dimension support.
- Confirm score type and category order.
- Do not report a binary odds ratio for a four-level response.
- Compare output with the manual target values.
Expandable Cochran Mantel Haenszel Test Code
The following code blocks reproduce the worked values. They intentionally calculate the ordinal row-mean-scores statistic instead of calling a 2 × 2 common-odds-ratio routine.
Python code
import math
import pandas as pd
from scipy.stats import chi2

df = pd.read_csv("dataset.csv")
df["grade_score"] = pd.cut(
    df["G3"], bins=[-math.inf, 9, 13, 16, math.inf], labels=[1, 2, 3, 4]
).astype(int)

scores = [1, 2, 3, 4]
sum_difference = 0.0
sum_variance = 0.0
components = []

for school, d in df.groupby("school", sort=True):
    tab = pd.crosstab(d["sex"], d["grade_score"]).reindex(
        index=["F", "M"], columns=scores, fill_value=0
    )
    female = tab.loc["F"].to_numpy(float)
    male = tab.loc["M"].to_numpy(float)
    nf, nm = female.sum(), male.sum()
    n = nf + nm
    totals = female + male
    mean_score = (totals * scores).sum() / n
    observed_male = (male * scores).sum()
    expected_male = nm * mean_score
    ss = (totals * (pd.Series(scores).to_numpy() - mean_score) ** 2).sum()
    variance = (nf * nm / (n * (n - 1))) * ss
    difference = observed_male - expected_male
    sum_difference += difference
    sum_variance += variance
    components.append([school, n, observed_male, expected_male, difference, variance])

z = sum_difference / math.sqrt(sum_variance)
cmh = z ** 2
p_value = chi2.sf(cmh, df=1)

print(components)
print(f"CMH={cmh:.12f}, z={z:.12f}, p={p_value:.12g}")
R code
dat <- read.csv("dataset.csv", stringsAsFactors = FALSE)
dat$grade_score <- ifelse(dat$G3 < 10, 1,
                    ifelse(dat$G3 <= 13, 2,
                    ifelse(dat$G3 <= 16, 3, 4)))

scores <- 1:4
sum_diff <- 0
sum_var <- 0
components <- list()

for (school in sort(unique(dat$school))) {
  d <- dat[dat$school == school, ]
  tab <- table(factor(d$sex, levels=c("F","M")),
               factor(d$grade_score, levels=1:4))
  female <- as.numeric(tab["F", ])
  male <- as.numeric(tab["M", ])
  nf <- sum(female); nm <- sum(male); n <- nf + nm
  totals <- female + male
  mean_score <- sum(totals * scores) / n
  observed_male <- sum(male * scores)
  expected_male <- nm * mean_score
  ss <- sum(totals * (scores - mean_score)^2)
  variance <- (nf * nm / (n * (n - 1))) * ss
  difference <- observed_male - expected_male
  sum_diff <- sum_diff + difference
  sum_var <- sum_var + variance
  components[[school]] <- c(n=n, observed=observed_male,
                            expected=expected_male, difference=difference,
                            variance=variance)
}

z <- sum_diff / sqrt(sum_var)
cmh <- z^2
p_value <- pchisq(cmh, df=1, lower.tail=FALSE)
print(components)
cat(sprintf("CMH=%.12f, z=%.12f, p=%.12g\n", cmh, z, p_value))
SPSS syntax
DATASET CLOSE ALL.
OUTPUT CLOSE ALL.
GET DATA /TYPE=TXT
  /FILE='dataset.csv'
  /DELCASE=LINE /DELIMITERS="," /ARRANGEMENT=DELIMITED
  /FIRSTCASE=2 /IMPORTCASE=ALL.

* Recode strings to numeric variables as appropriate for your imported schema.
RECODE sex ('F'=0) ('M'=1) INTO sex_bin.
RECODE school ('GP'=1) ('MS'=2) INTO school_n.
COMPUTE grade3 = 1.
IF (G3 >= 10 AND G3 <= 13) grade3 = 2.
IF (G3 >= 14 AND G3 <= 16) grade3 = 3.
IF (G3 >= 17) grade3 = 4.
VALUE LABELS sex_bin 0 'Female' 1 'Male'
 /school_n 1 'GP' 2 'MS'
 /grade3 1 'Low below 10' 2 'Medium 10-13' 3 'High 14-16' 4 'Very high 17+'.
EXECUTE.

CROSSTABS
 /TABLES=sex_bin BY grade3 BY school_n
 /FORMAT=AVALUE TABLES
 /STATISTICS=CMH CHISQ
 /CELLS=COUNT ROW COLUMN EXPECTED
 /COUNT ROUND CELL.
The supplied SPSS PDF includes the complete tested import and integrated cross-check workflow.
SAS PROC FREQ pattern
data cmh_counts;
  length school $2 sex $1;
  input school $ sex $ grade3 count;
  datalines;
GP F 1 9
GP F 2 137
GP F 3 68
GP F 4 23
GP M 1 23
GP M 2 108
GP M 3 44
GP M 4 11
MS F 1 41
MS F 2 67
MS F 3 28
MS F 4 10
MS M 1 27
MS M 2 43
MS M 3 8
MS M 4 2
;
run;

proc freq data=cmh_counts order=data;
  tables school*sex*grade3 / cmh scores=table;
  weight count;
run;
For row-level data, omit the WEIGHT statement. For aggregated counts, provide a frequency variable.
Excel formula pattern
Grade score: =IF(C5<10,1,IF(C5<=13,2,IF(C5<=16,3,4)))
Observed cell: =COUNTIFS(Data_Input!$B:$B,$A5,Data_Input!$A:$A,B$4,Data_Input!$D:$D,C$4)
Stratum mean score: =SUMPRODUCT(CategoryTotals,Scores)/StratumN
Expected male score: =MaleN*StratumMeanScore
Difference: =ObservedMaleScore-ExpectedMaleScore
CMH statistic: =(SUM(Differences)^2)/SUM(Variances)
P-value: =CHISQ.DIST.RT(CMH_Cell,1)
Signed z: =SUM(Differences)/SQRT(SUM(Variances))How to Interpret and Report the Cochran Mantel Haenszel Test
APA-Style Worked Report
A row-mean-scores Cochran Mantel Haenszel Test examined whether the ordered final-grade distribution differed by sex after controlling for school. The conditional ordinal association was statistically significant, χ²(1, N = 649) = 12.86, p < .001. The signed standardized score was negative, z = −3.59, indicating that male students had lower ordinal grade scores than expected under conditional independence. The observed-minus-expected male score totals were −22.08 in GP and −12.17 in MS, so both strata showed the same direction.
Result With Additional Descriptive Context
Within GP, mean grade-band scores were 2.44 for females and 2.23 for males; within MS, they were 2.05 and 1.81, respectively. Thus, the significant Cochran Mantel Haenszel Test reflected a consistent male shift toward lower grade bands rather than a result confined to one school.
Reusable Reporting Templates
Significant Two-Sided Result
Significant
A row-mean-scores Cochran Mantel Haenszel Test assessed the association between group variable and ordered outcome, controlling for stratifier.
The conditional association was significant, χ²(df, N = N) = CMH, p = p.
The signed z of z indicated that focal group had relatively lower/higher ordinal scores.
Non-Significant Result
Not significant
The Cochran Mantel Haenszel Test did not provide sufficient evidence of a conditional ordinal association, χ²(df, N = N) = CMH, p = p.
The null hypothesis was not rejected; this does not prove that the stratified distributions are identical.
Directional Result
Direction stated
Use a directional alternative only when it was specified before examining the data.
The signed standardized score was z, consistent with the prespecified upward/downward shift.
What to Include in a Complete Report
- The exact CMH variant and score system.
- The row, column and stratification variables.
- Observed counts or row percentages by stratum.
- CMH statistic, df, p-value and signed z.
- Direction convention and stratum-specific score differences.
- Any sparse-cell or scoring sensitivity note.
- A clear distinction between statistical association and causation.
A p-value should be accompanied by magnitude and context. The general effect-size guide explains why statistical significance alone is not a practical conclusion.
Common Cochran Mantel Haenszel Test Mistakes and Corrections
| Mistake | Why it is wrong | Correction |
|---|---|---|
| Using a 2×2×K calculator for a 2×4×K table | It computes a common odds ratio rather than the row-mean-scores statistic. | Use generalized CMH scoring or the explicit formula. |
| Ignoring category order | The one-df test depends on ordered scores. | Declare bands and scores before analysis. |
| Collapsing schools immediately | Marginal association can mix within-school effects with school composition. | Inspect and retain the strata. |
| Reporting χ² without signed z | Chi-square cannot show direction because it is squared. | Report signed z and stratum deviations. |
| Calling the result an odds ratio | No common OR exists for the four-category outcome in this analysis. | Describe an ordinal score shift. |
| Treating SPSS linear-by-linear values as the combined CMH statistic | Those values are reported separately for individual or collapsed tables. | Use the verified row-mean formula result. |
| Choosing scores after seeing p | This inflates analysis flexibility. | Prespecify scores and run sensitivity checks transparently. |
| Assuming significance proves causation | The data are observational and may contain other confounders. | Use association language. |
| Ignoring small expected cells | Sparse information can weaken asymptotic accuracy. | Report diagnostics and consider exact/model alternatives. |
| Reporting only the pooled table | The reason for CMH is adjustment by strata. | Show school-specific counts and profiles. |
Threshold Thinking
The result is well below .05, but good reporting still avoids the word “proven.” A formal decision controls long-run error rates; it does not remove uncertainty or design limitations. Review Type I and Type II errors and statistical power when planning a new stratified study.
Cochran Mantel Haenszel Test Practice Questions
Use these questions to test whether the table design, score statistic and interpretation are understood rather than memorised.
Practice 1: A study compares treatment response across three hospitals using 2×2 tables. Which CMH variant is most natural?
Answer: The common-odds-ratio CMH procedure, provided a common conditional odds ratio is meaningful and heterogeneity is checked.
Practice 2: Why is the current test one degree of freedom although grade has four categories?
Answer: Because the ordered categories are compressed into one prespecified score contrast, and there are two row groups.
Practice 3: What does a negative signed z mean here?
Answer: With male as the focal row and scores increasing with grade, males have lower score totals than expected under conditional independence.
Practice 4: Does p = .000336 mean the probability that H0 is true is .000336?
Answer: No. It is the probability, under H0 and the test assumptions, of a statistic at least as extreme as observed.
Practice 5: Why not report a Mantel–Haenszel common odds ratio?
Answer: The response has four ordered categories rather than two binary levels.
Practice 6: What is the combined observed-minus-expected score difference?
Answer: −22.0780142 + −12.1681416 = −34.2461558.
Practice 7: What is the combined variance?
Answer: 56.3582377 + 34.8486212 = 91.2068589.
Practice 8: How does signed z connect to CMH?
Answer: CMH = z², so (−3.5858992)² = 12.8586731.
Practice 9: What feature supports a common directional interpretation?
Answer: Both school strata have negative observed-minus-expected male score totals.
Practice 10: What should be checked if a result changes under scores 1–4 versus ridit scores?
Answer: The scientific meaning of spacing between categories and the sensitivity of the conclusion to scoring.
Practice 11: When is ordinal logistic regression preferable?
Answer: When several covariates, interactions, estimates or predictions are required and model assumptions are acceptable.
Practice 12: What is the most important coding statement?
Answer: State the grade cut points, scores, focal group and direction convention.
Cochran Mantel Haenszel Test Reports and Worked Files
Each download reproduces the same variables, grade-band coding and primary result. The links include the download attribute so browsers can save the file instead of opening an embedded viewer when supported.
R PDF ReportVerified seven-page R report with six figures.
SPSS PDF OutputFull crosstabs, diagnostics, chart and integrated score-test cross-check.
Worked Excel AnalysisFormula-driven data, tables, calculations, diagnostics and reporting sheets.
Cochran Mantel Haenszel Test Frequently Asked Questions
What is the Cochran Mantel Haenszel Test?
It is a family of stratified chi-square procedures that tests categorical association while controlling for one or more categorical strata.
What is the Cochran Mantel Haenszel Test null hypothesis?
The current null states that sex and the ordered G3 grade band are conditionally independent within school strata.
When should I use the Cochran Mantel Haenszel Test?
Use it when categorical association must be adjusted for a meaningful stratification variable and the selected CMH variant matches the table scale.
What is the result in this example?
The row-mean-scores result is χ²(1) = 12.8587, p = 0.0003359, with signed z = −3.5859.
Why is the Cochran Mantel Haenszel Test signed z negative?
Male is the focal row, and males have lower observed score totals than expected in both schools.
Is the Cochran Mantel Haenszel Test the same as Mantel–Haenszel odds ratio analysis?
No. The common-odds-ratio analysis is one binary 2×2×K member of a broader CMH family.
Can the Cochran Mantel Haenszel Test outcome have more than two categories?
Yes, generalized CMH procedures can analyse larger tables. The current outcome has four ordered categories.
Why does the Cochran Mantel Haenszel Test use grade scores 1 through 4?
They encode the natural order of grade bands and create a focused one-degree-of-freedom location test.
Does the Cochran Mantel Haenszel Test require all expected counts above 5?
There is no single ritual rule for every generalized CMH design, but sparse cells can affect asymptotic accuracy and must be reviewed.
What is the Cochran Mantel Haenszel Test difference between row mean scores and general association?
Row mean scores exploit order and target an ordinal shift; general association treats categories as nominal and tests any pattern.
Can I use statsmodels StratifiedTable for this Cochran Mantel Haenszel Test example?
Not directly. That class is designed for collections of 2×2 tables, whereas this example is 2×4×2.
Can R mantelhaen.test reproduce this Cochran Mantel Haenszel Test result automatically?
A generalized R test can analyse larger arrays, but explicit row-mean scoring is needed to guarantee the same one-degree-of-freedom statistic.
What does SPSS report for the Cochran Mantel Haenszel Test?
SPSS provides layered crosstabs, Pearson and linear-by-linear statistics, and the supplied workflow adds a validated integrated row-mean-scores calculation.
Should I report an effect size for the Cochran Mantel Haenszel Test?
Report stratum-specific mean-score differences and direction. A chi-square-based standardized signal may be descriptive, but it is not a common odds ratio.
What if Cochran Mantel Haenszel Test stratum-specific directions disagree?
Do not hide the disagreement. Investigate interaction or heterogeneity and consider a model with a group-by-stratum interaction.
Can the Cochran Mantel Haenszel Test prove causation?
No. It adjusts for the stated stratifier but cannot remove all confounding or establish causal direction.
What if I have many covariates beyond the Cochran Mantel Haenszel Test?
Use an ordinal, multinomial or generalized regression model suited to the outcome and study design.
How should the Cochran Mantel Haenszel Test p-value be reported?
Report p = .000336 for precision or p < .001 in APA-style prose, together with χ², df, N and direction.
Cochran Mantel Haenszel Test Conclusion
The Cochran Mantel Haenszel Test is the correct family of methods when categorical association must be evaluated within strata rather than after collapsing them. In this analysis, the ordinal row-mean-scores version compares sex with four ordered G3 grade bands while controlling for school.
The verified result is χ²(1) = 12.858673, p = 0.000335919, with signed z = −3.585899. Male observed score totals fall below their null expectations in GP and MS, and male mean grade-band scores are lower in both strata. The evidence therefore supports a conditional ordinal association, not a common odds ratio and not a causal claim.
A defensible report names the exact CMH variant, explains the score coding, provides stratum-specific counts, reports both chi-square and signed z, checks sparse cells and distinguishes the result from ordinary chi-square independence and model-based alternatives. That combination makes the Cochran Mantel Haenszel Test reproducible, interpretable and aligned with the actual research design.

