
UK-based online statistics and data analysis support for USA, UK, and international clients. No exams, no impersonation, no fabricated data.

Category Guide Hub

Multivariate Analysis

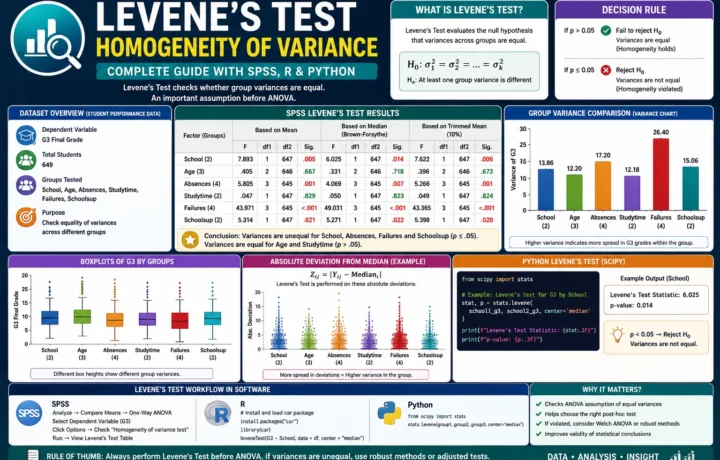
Levene’s Test homogeneity of variance output with SPSS, R, Python, boxplots, variance charts and absolute deviation graphs
Multivariate Analysis

Levene Test: Homogeneity of Variance, Brown-Forsythe Version, R, Python, SPSS and Excel Guide

Learn Levene’s Test with a complete SPSS, R and Python example using student performance data. This guide explains homogeneity of variance, equality of variances, group-level spread, boxplots, absolute deviations and practical reporting.
Read: Levene Test: Homogeneity of Variance, Brown-Forsythe Version, R, Python, SPSS and Excel Guide
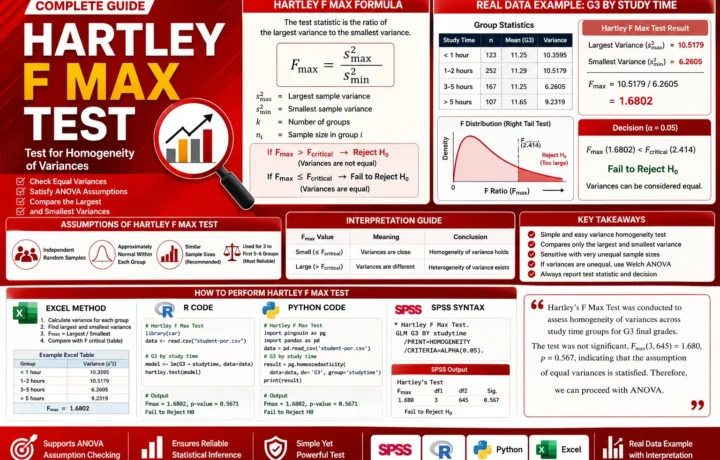
Hartley F Max Test tutorial with variance comparison, Fmax formula, homogeneity of variance interpretation, Excel, R, Python and SPSS workflow
Multivariate Analysis

Hartley F Max Test: Formula, Assumptions, Excel, R, Python, SPSS and Real Data Example

This complete Hartley F Max Test guide explains the formula, assumptions, interpretation, Excel method, R code, Python code, SPSS syntax and a real student performance example using G3 final grades by study time groups.

Read: Hartley F Max Test: Formula, Assumptions, Excel, R, Python, SPSS and Real Data Example

Need help interpreting your data analysis results?

Contact Salar Cafe