
Normality Diagnostics, Distribution Shape, Skewness, Kurtosis and Jarque-Bera
Skewness and Kurtosis Normality Check: Formula, Interpretation, SPSS, Python, R and Excel Guide
Skewness and Kurtosis Normality Check is a practical way to evaluate whether a variable has an approximately normal shape. Skewness checks symmetry, while kurtosis checks peak and tail behavior. This guide explains skewness and kurtosis with verified SPSS output, Python charts, R validation charts, Jarque-Bera p-values, z statistics, Excel workflow, APA reporting wording, common mistakes, and downloadable resources.
Quick Answer: Skewness and Kurtosis Normality Check Result
The verified SPSS output checks five numeric variables: G3, G2, G1, age, and absences. All variables have N = 649. The most normal-looking variable by skewness and kurtosis is G1, with skewness = -0.003 and kurtosis = 0.037. The strongest non-normal variable is absences, with skewness = 2.021 and kurtosis = 5.781, showing a strong right-skewed and heavy-tailed distribution.
Hypothesis-style interpretation: The normality null hypothesis says the variable follows a normal distribution. The alternative says it does not. SPSS normality tests reject normality for all five variables at p < .001. However, skewness and kurtosis show different practical severity across variables. G1 is very close to symmetric and mesokurtic, while absences is clearly non-normal. Therefore, the practical conclusion is not just “all are non-normal”; the better conclusion is that normality departure is strongest for absences and weakest for G1.
Final interpretation: Skewness and kurtosis show that G1 has the best approximate normal shape, age is mildly positively skewed, G2 and G3 are negatively skewed with heavier tails, and absences is strongly right-skewed and leptokurtic. Formal SPSS normality tests reject normality for all variables, but practical interpretation should focus on the magnitude of skewness, kurtosis, z statistics, Q-Q plots, and the purpose of the analysis.
Important note: In large samples such as N = 649, normality tests can become significant even when shape departure is small. That is why the Skewness and Kurtosis Normality Check should be interpreted together with histograms, Q-Q plots, p-values, and practical thresholds instead of relying on one number only.
Table of Contents
- What Is Skewness and Kurtosis Normality Check?
- Skewness, Kurtosis and Z Statistic Formulas
- Null and Alternative Hypothesis for Normality
- Dataset and Variables Used
- Verified SPSS Output Interpretation
- Python Chart-by-Chart Interpretation
- R Chart-by-Chart Validation
- SPSS, R, Python and Excel Workflows
- Code Blocks for Skewness and Kurtosis Normality Check
- APA Reporting Wording
- Common Mistakes
- When to Use Skewness and Kurtosis Normality Check
- Downloads and Resources
- Related Guides
- FAQs
What Is Skewness and Kurtosis Normality Check?
Skewness and Kurtosis Normality Check evaluates distribution shape. Skewness measures whether the distribution is symmetric or pulled toward one tail. Kurtosis measures whether the distribution has normal, heavy, or light tail/peak behavior. Together, they help identify whether a variable is close to a normal distribution or whether it has shape problems that may affect statistical tests.
Skewness is about asymmetry. A skewness value near zero suggests symmetry. A positive skewness value means the right tail is longer or heavier. A negative skewness value means the left tail is longer or heavier. In the verified output, absences has strong positive skewness, while G3 and G2 have negative skewness.
Kurtosis is about tail weight and peak behavior. In SPSS-style excess kurtosis interpretation, a value near zero is similar to a normal distribution. Positive kurtosis suggests heavier tails and a sharper peak, while negative kurtosis suggests lighter tails or a flatter shape. In this output, absences kurtosis = 5.781 and G3 kurtosis = 2.712, so both show heavier-than-normal tail behavior, especially absences.
Practical meaning: Skewness and kurtosis should not replace visual checks. Use them with histograms, Q-Q plots, P-P plots, Kolmogorov-Smirnov tests, Shapiro-Wilk tests, and sample-size awareness.
Skewness, Kurtosis and Z Statistic Formulas
Skewness and kurtosis are usually calculated by software, but their interpretation depends on comparing the statistic to zero and, when needed, dividing by its standard error.
In the verified SPSS output, the skewness standard error is .096 and the kurtosis standard error is .192 for each full-sample variable. A common large-sample rule is that z values beyond approximately ±1.96 indicate statistically noticeable departure at the .05 level. However, with a large sample, small shape differences can become statistically noticeable, so practical magnitude still matters.
| Shape Measure | Near-Normal Meaning | Positive Value | Negative Value |
|---|---|---|---|
| Skewness | Near 0 means approximate symmetry. | Right-skewed distribution. | Left-skewed distribution. |
| Kurtosis | Near 0 means mesokurtic / normal-like tails. | Leptokurtic: heavier tails or sharper peak. | Platykurtic: lighter tails or flatter shape. |
| Jarque-Bera | Non-significant p-value supports normality. | Significant when skewness/kurtosis jointly depart from normality. | Not interpreted by sign; interpreted by p-value. |
Formula caution: Skewness and kurtosis z statistics are sensitive to sample size. With N = 649, even moderate departures can become statistically clear. Use z values as evidence, but do not ignore plots and practical shape.
Null and Alternative Hypothesis for Normality
The Skewness and Kurtosis Normality Check can be stated as a normality hypothesis. The null hypothesis says the variable is normally distributed. The alternative hypothesis says the variable departs from normality because of skewness, kurtosis, tail behavior, or another shape issue.
| Statement | Hypothesis | Meaning in This Output |
|---|---|---|
| Normality null hypothesis | H0: the variable follows a normal distribution | Skewness and kurtosis are close enough to normal expectation. |
| Normality alternative hypothesis | H1: the variable does not follow a normal distribution | The variable has meaningful skewness, kurtosis, or other shape departure. |
| Formal decision rule | Reject H0 if p < .05 | SPSS K-S and Shapiro-Wilk p-values are below .001 for the listed variables. |
| Shape decision rule | Review skewness, kurtosis and z statistics | Absences is most non-normal; G1 is closest to normal shape. |
Hypothesis-style decision: The formal normality tests reject normality for all five variables. However, shape interpretation shows that the severity differs. G1 is practically closest to normal shape, while absences shows the strongest violation through positive skewness and high kurtosis.
Interpretation nuance: A significant normality test does not automatically mean the variable is unusable. It means the distribution is not perfectly normal under the test. For many analyses, the decision should also consider sample size, robustness, group sizes, residual normality, transformations, and the actual model being used.
Dataset and Variables Used
The worked example uses student performance variables. The full-sample normality check includes G3, G2, G1, age, and absences. SPSS also provides a group-level shape comparison for G3 by sex.
| Variable | N | Mean | Standard Deviation | Skewness | Kurtosis | Shape Meaning |
|---|---|---|---|---|---|---|
| G3 | 649 | 11.91 | 3.231 | -.913 | 2.712 | Negative skew with heavy tails. |
| G2 | 649 | 11.57 | 2.914 | -.360 | 1.662 | Mild negative skew with positive kurtosis. |
| G1 | 649 | 11.40 | 2.745 | -.003 | .037 | Closest to symmetric and normal-like shape. |
| age | 649 | 16.74 | 1.218 | .417 | .072 | Mild positive skew with near-normal kurtosis. |
| absences | 649 | 3.66 | 4.641 | 2.021 | 5.781 | Strong right skew and heavy tails. |
Before interpreting normality, it is helpful to review descriptive statistics, frequency distribution, histogram interpretation, box plot interpretation, and five-number summary.
Verified SPSS Output Interpretation
The SPSS output provides descriptive statistics, skewness, kurtosis, Kolmogorov-Smirnov normality tests, Shapiro-Wilk normality tests, histograms, Q-Q plots, detrended Q-Q plots, and group-level shape statistics for G3 by sex.
SPSS Descriptive Shape Statistics
| Variable | Skewness | SE Skewness | Skewness z | Kurtosis | SE Kurtosis | Kurtosis z | Shape Decision |
|---|---|---|---|---|---|---|---|
| G3 | -.913 | .096 | -9.51 | 2.712 | .192 | 14.13 | Non-normal shape; negative skew and heavy tails. |
| G2 | -.360 | .096 | -3.75 | 1.662 | .192 | 8.66 | Mild-to-moderate non-normality. |
| G1 | -.003 | .096 | -0.03 | .037 | .192 | 0.19 | Closest to normal by skewness and kurtosis. |
| age | .417 | .096 | 4.34 | .072 | .192 | 0.38 | Mild positive skew; kurtosis near normal. |
| absences | 2.021 | .096 | 21.05 | 5.781 | .192 | 30.11 | Strong right skew and heavy-tailed shape. |
SPSS Normality Test Results
| Variable | Kolmogorov-Smirnov | Shapiro-Wilk | Formal Decision | Practical Shape Note |
|---|---|---|---|---|
| G3 | D = .124, df = 649, p < .001 | W = .926, df = 649, p < .001 | Reject normality. | Negatively skewed with high kurtosis. |
| G2 | D = .088, df = 649, p < .001 | W = .962, df = 649, p < .001 | Reject normality. | Mild negative skew and positive kurtosis. |
| G1 | D = .086, df = 649, p < .001 | W = .986, df = 649, p < .001 | Reject normality formally. | Best practical shape among selected variables. |
| age | D = .175, df = 649, p < .001 | W = .916, df = 649, p < .001 | Reject normality. | Mild positive skew and age-range discreteness. |
| absences | D = .215, df = 649, p < .001 | W = .772, df = 649, p < .001 | Reject normality strongly. | Most non-normal variable in the set. |
SPSS Group Shape Comparison for G3 by Sex
| Group | N | Mean | SD | Skewness | Kurtosis | Shapiro-Wilk | Interpretation |
|---|---|---|---|---|---|---|---|
| Female | 383 | 12.25 | 3.124 | -.857 | 2.683 | W = .934, p < .001 | Negative skew and positive kurtosis; non-normal by formal test. |
| Male | 266 | 11.41 | 3.321 | -.980 | 2.803 | W = .913, p < .001 | Slightly stronger negative skew and positive kurtosis than female group. |
SPSS interpretation summary: SPSS rejects normality for all selected variables, but skewness and kurtosis show different practical patterns. G1 is the closest to normal shape, age has mild positive skew, G2 and G3 have negative skew with positive kurtosis, and absences has the most serious non-normal shape.
Python Chart-by-Chart Interpretation
The Python charts show the Skewness and Kurtosis Normality Check visually. They include a distribution with normal curve, skewness ranking, kurtosis ranking, shape map, Jarque-Bera p-values, skewness/kurtosis z statistics, and group shape comparison.
Python Chart 1: Distribution with Normal Curve
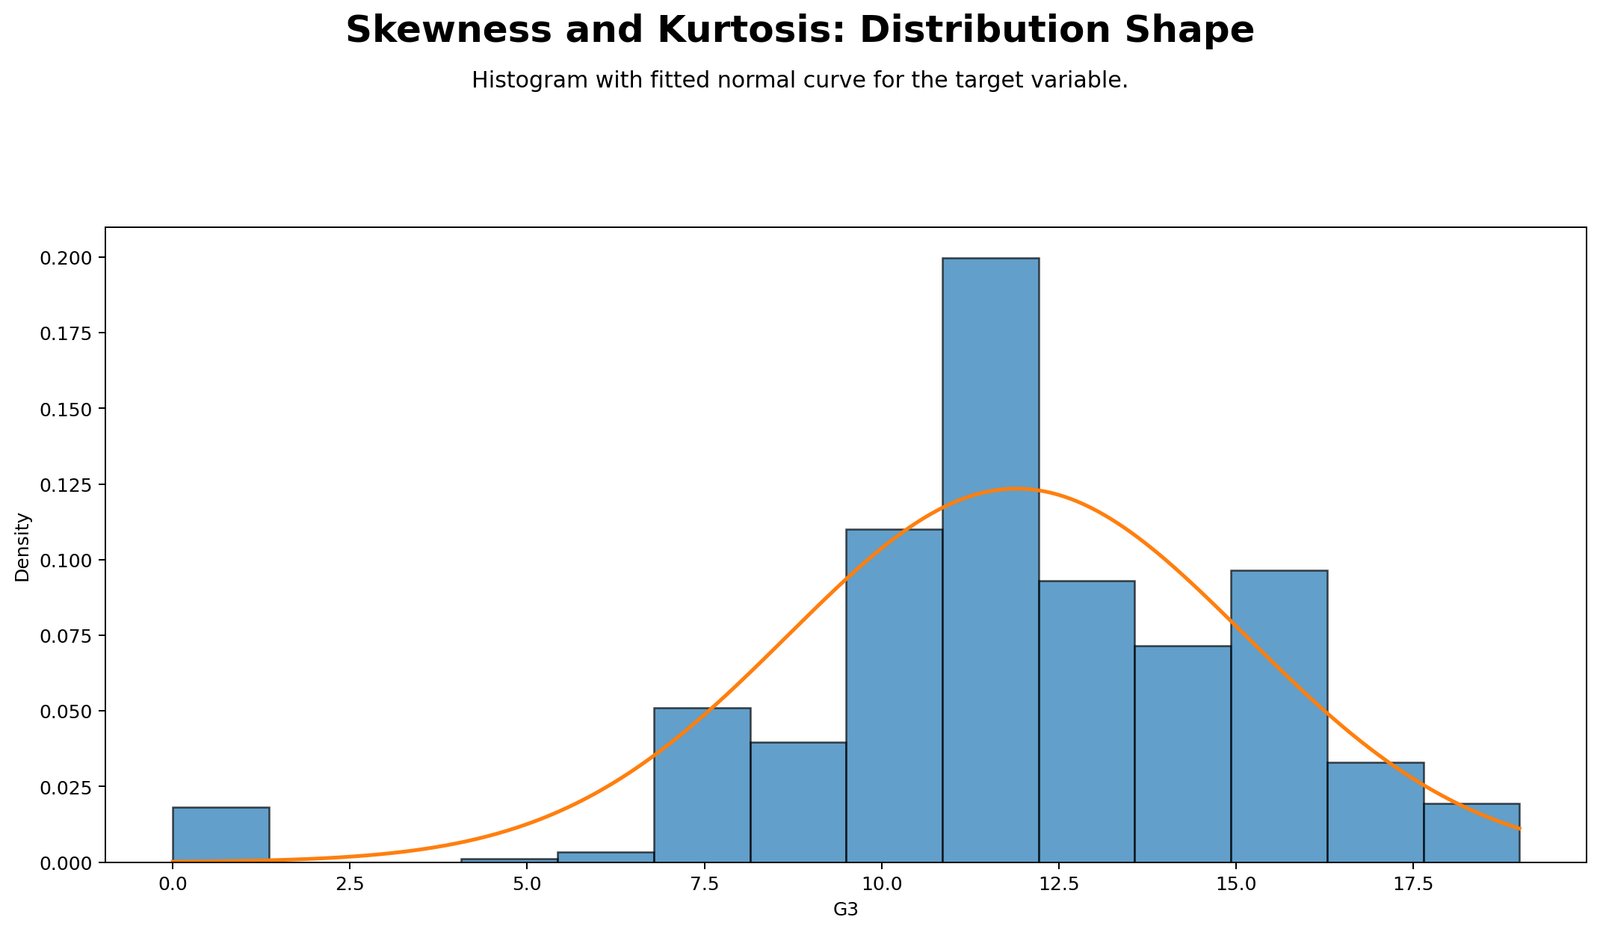
This chart compares the observed variable distribution with a theoretical normal curve. The normal curve helps show whether the data are symmetric, bell-shaped, and tail-balanced. When the bars follow the curve closely, the variable is closer to normal. When the bars depart from the curve, skewness or kurtosis may be present.
For the student performance variables, G3 shows negative skewness and positive kurtosis. This means the distribution is pulled toward the left tail and has heavier tail behavior than a perfect normal distribution. The distribution chart should be read with the SPSS values: G3 skewness = -.913 and G3 kurtosis = 2.712.
Python Chart 2: Skewness Across Variables
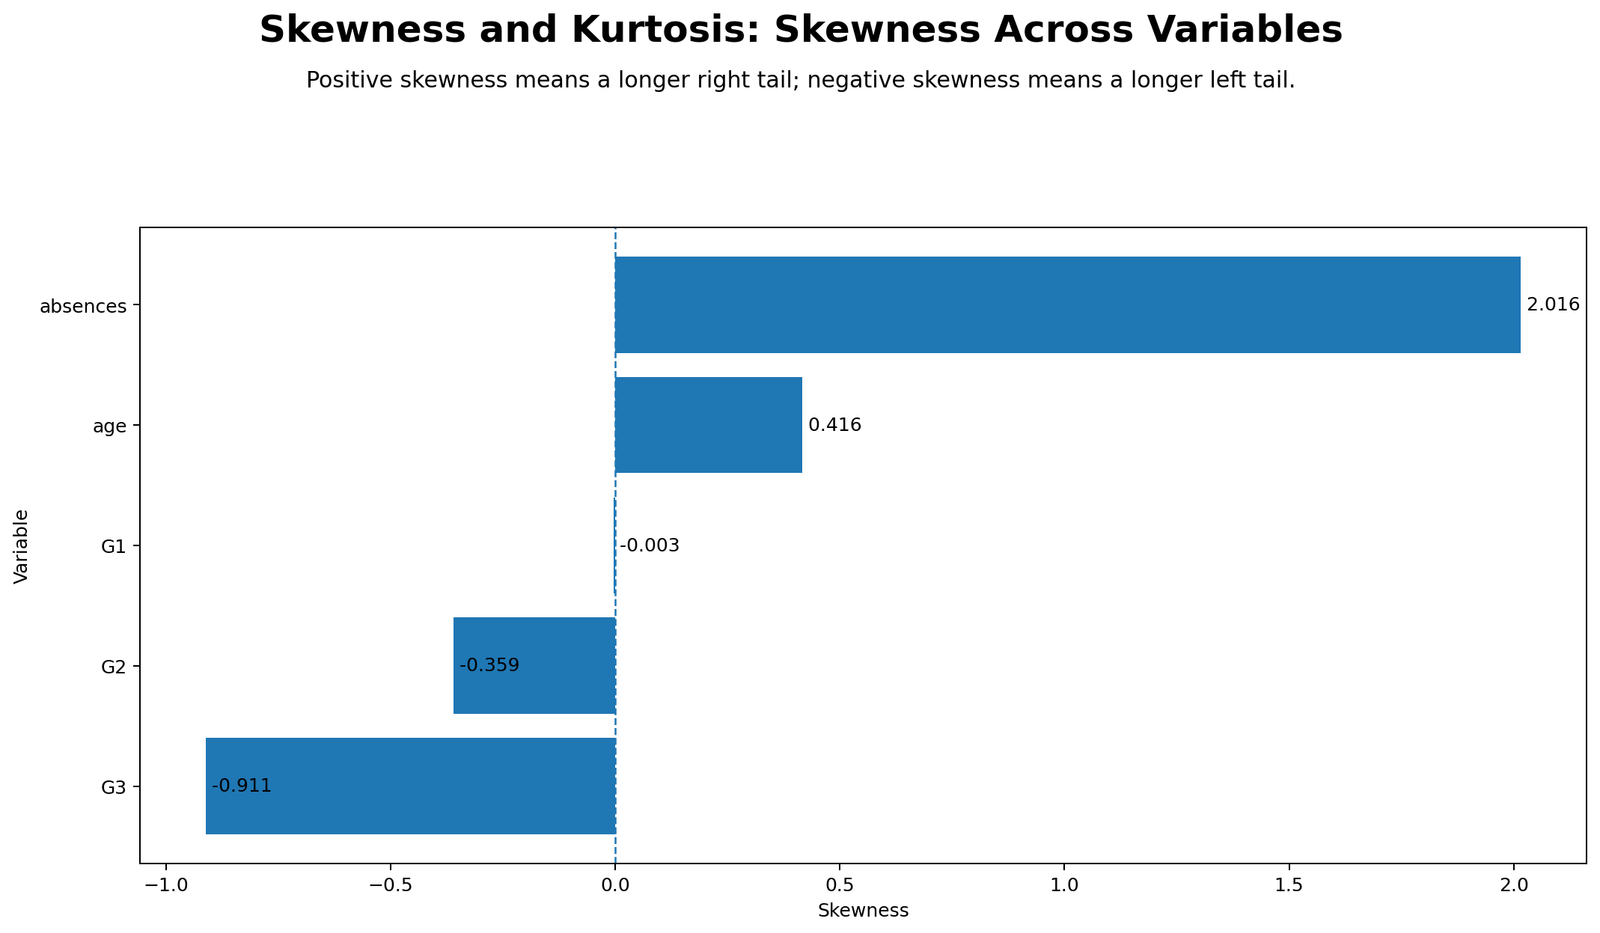
This chart ranks the variables by skewness. Absences has the largest positive skewness at 2.021, meaning most values are low but a smaller number extend far to the right. Age has mild positive skewness at .417. G3 and G2 have negative skewness, meaning their longer tail is toward lower scores. G1 has skewness almost exactly zero at -.003, making it the closest to symmetric by skewness.
The chart is useful because normality is not only about p-values. It shows which variables have practical shape issues. Absences is the clear transformation candidate, while G1 does not need skewness correction based on shape alone.
Python Chart 3: Kurtosis Across Variables
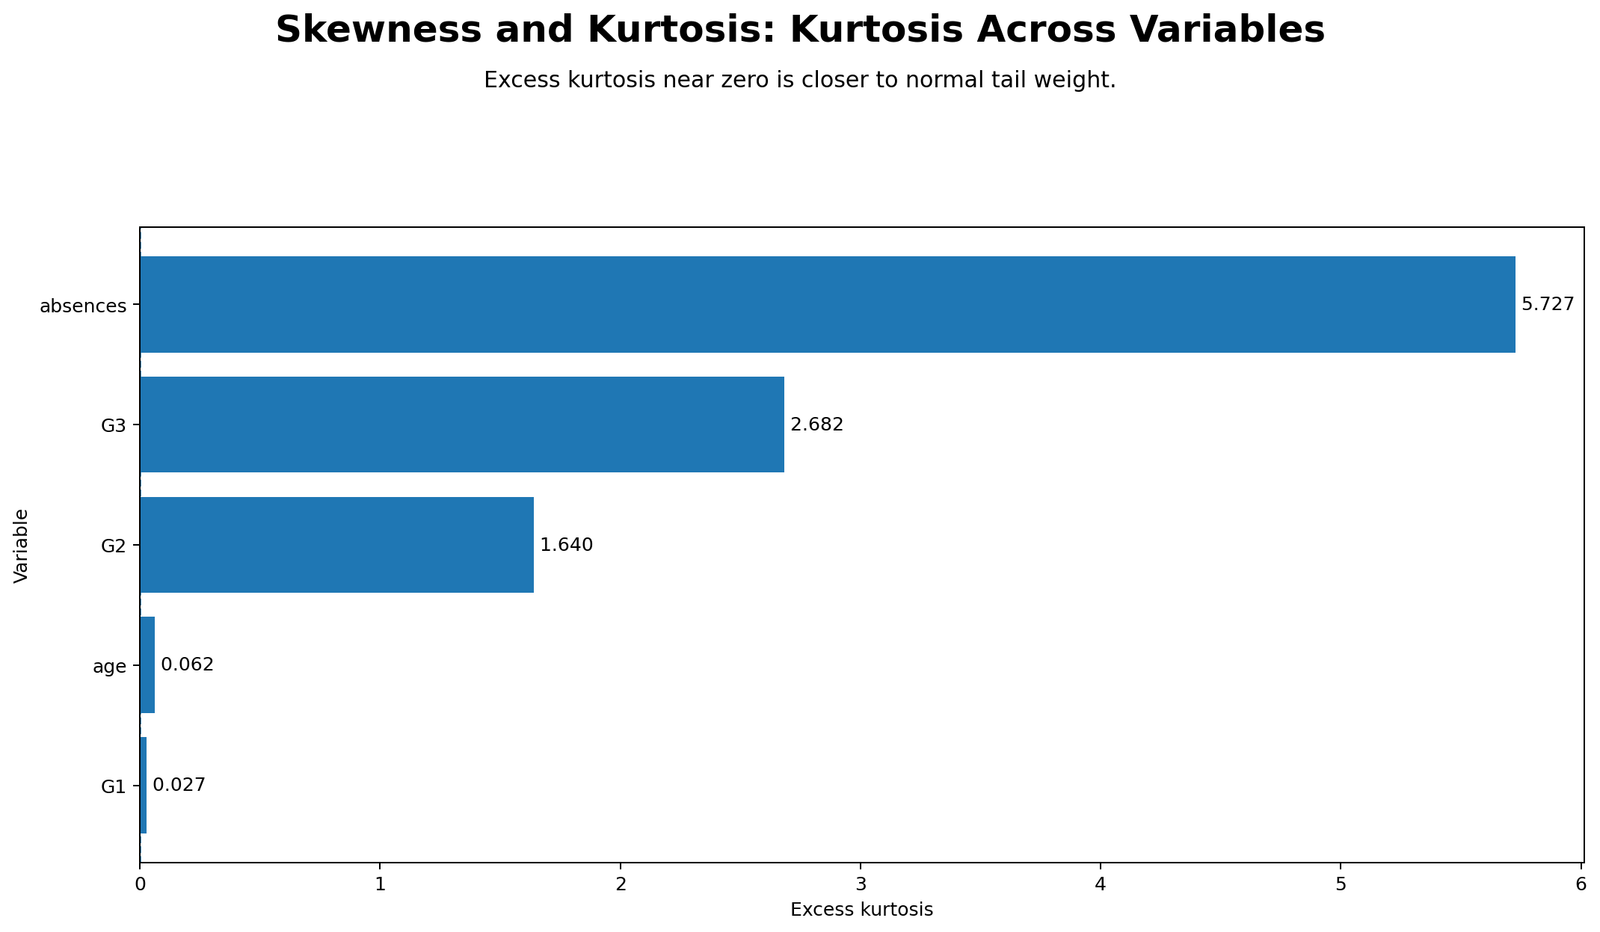
This chart compares tail and peak behavior. Absences has the highest kurtosis at 5.781, indicating heavy-tail behavior and strong departure from normality. G3 also has high positive kurtosis at 2.712, while G2 has 1.662. G1 and age are much closer to zero, meaning they are closer to normal-like tail behavior.
The kurtosis chart is important because a variable can have low skewness but still have non-normal tails. In this output, G1 has both skewness and kurtosis near zero, while absences has both skewness and kurtosis far from zero. That makes the contrast very clear.
Python Chart 4: Skewness-Kurtosis Shape Map
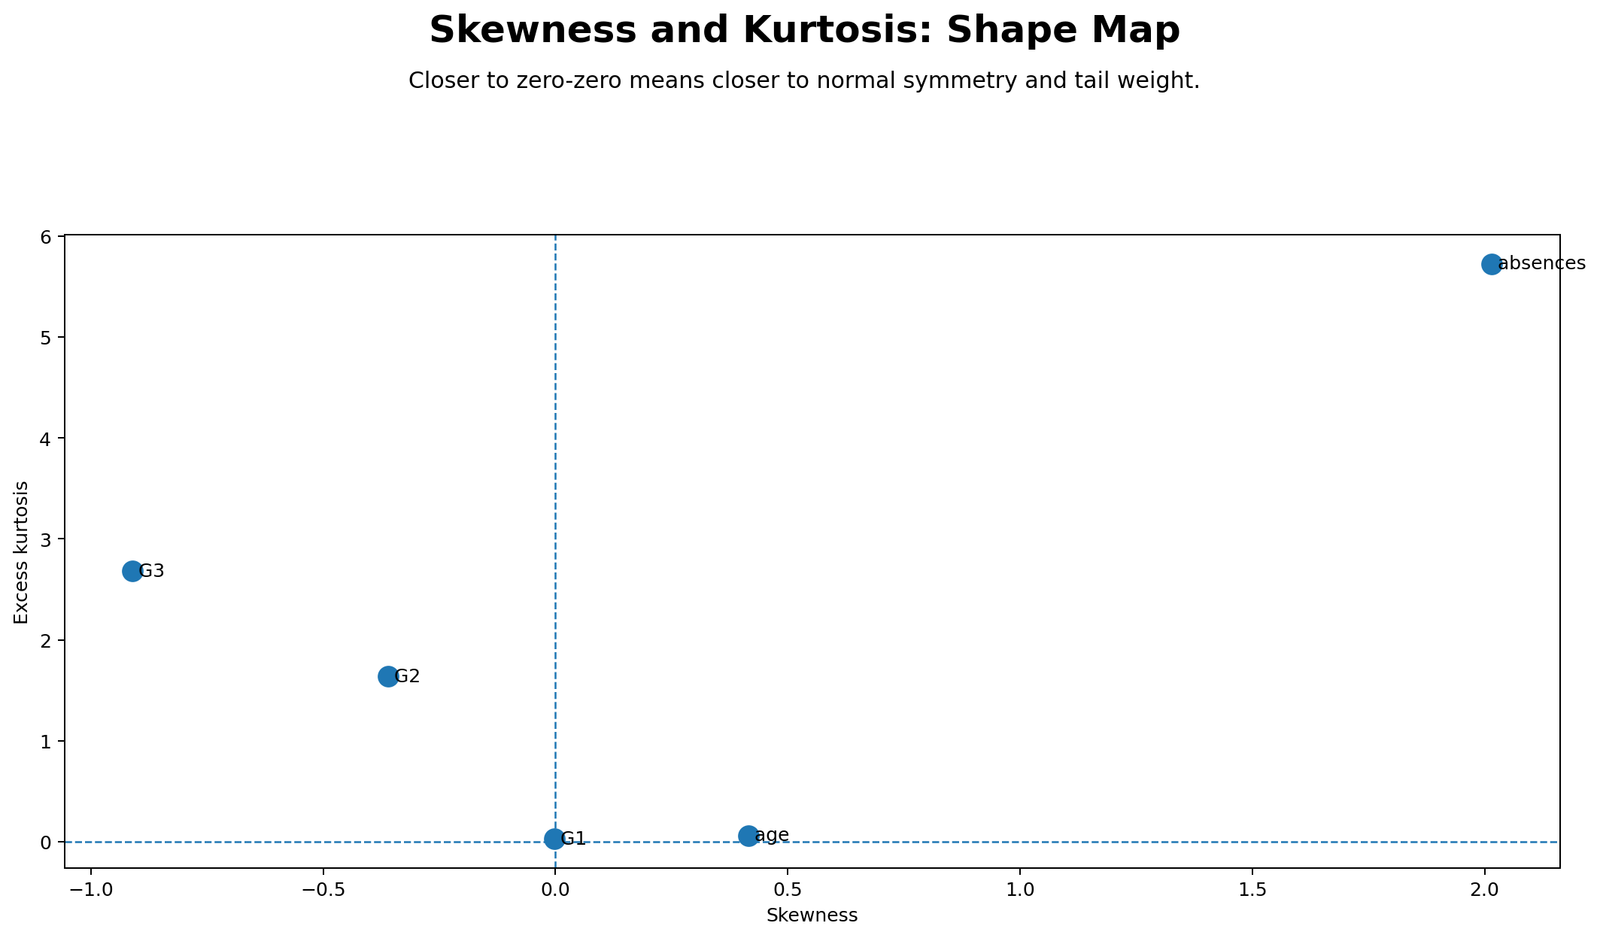
The shape map combines skewness and kurtosis in one chart. Variables near the origin are closer to normal shape. Variables far from the origin have stronger shape problems. G1 appears close to the normal-shape region because its skewness and kurtosis are nearly zero. Absences appears far from the origin because both skewness and kurtosis are large and positive.
This chart is one of the best summary visuals because it prevents one-sided interpretation. A variable may look acceptable on skewness but not on kurtosis, or the reverse. The shape map shows both dimensions together and identifies the strongest normality concern immediately.
Python Chart 5: Jarque-Bera p-values
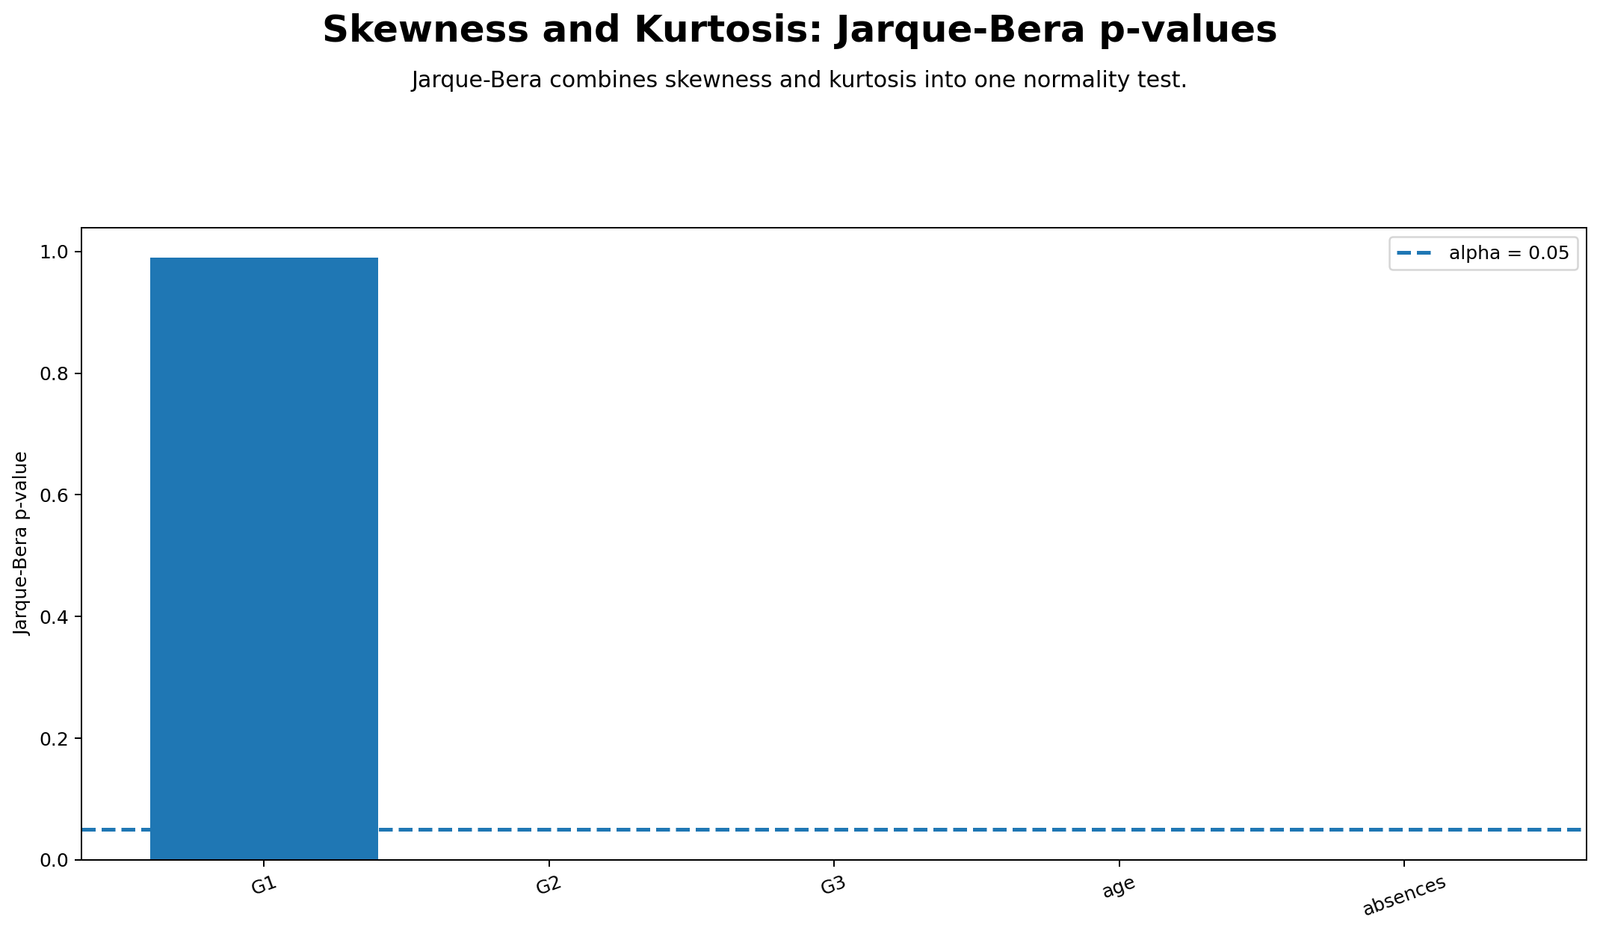
The Jarque-Bera test checks normality using skewness and kurtosis together. A small p-value indicates that the variable departs from normality in terms of symmetry, tail behavior, or both. The chart helps readers see which variables fail a combined shape-based normality test.
Because the SPSS Kolmogorov-Smirnov and Shapiro-Wilk tests reject normality for all listed variables, the Jarque-Bera chart should be interpreted as another shape-focused confirmation. The practical ranking still matters: absences has the strongest shape problem, while G1 has the mildest skewness-kurtosis departure.
Python Chart 6: Skewness and Kurtosis Z Statistics
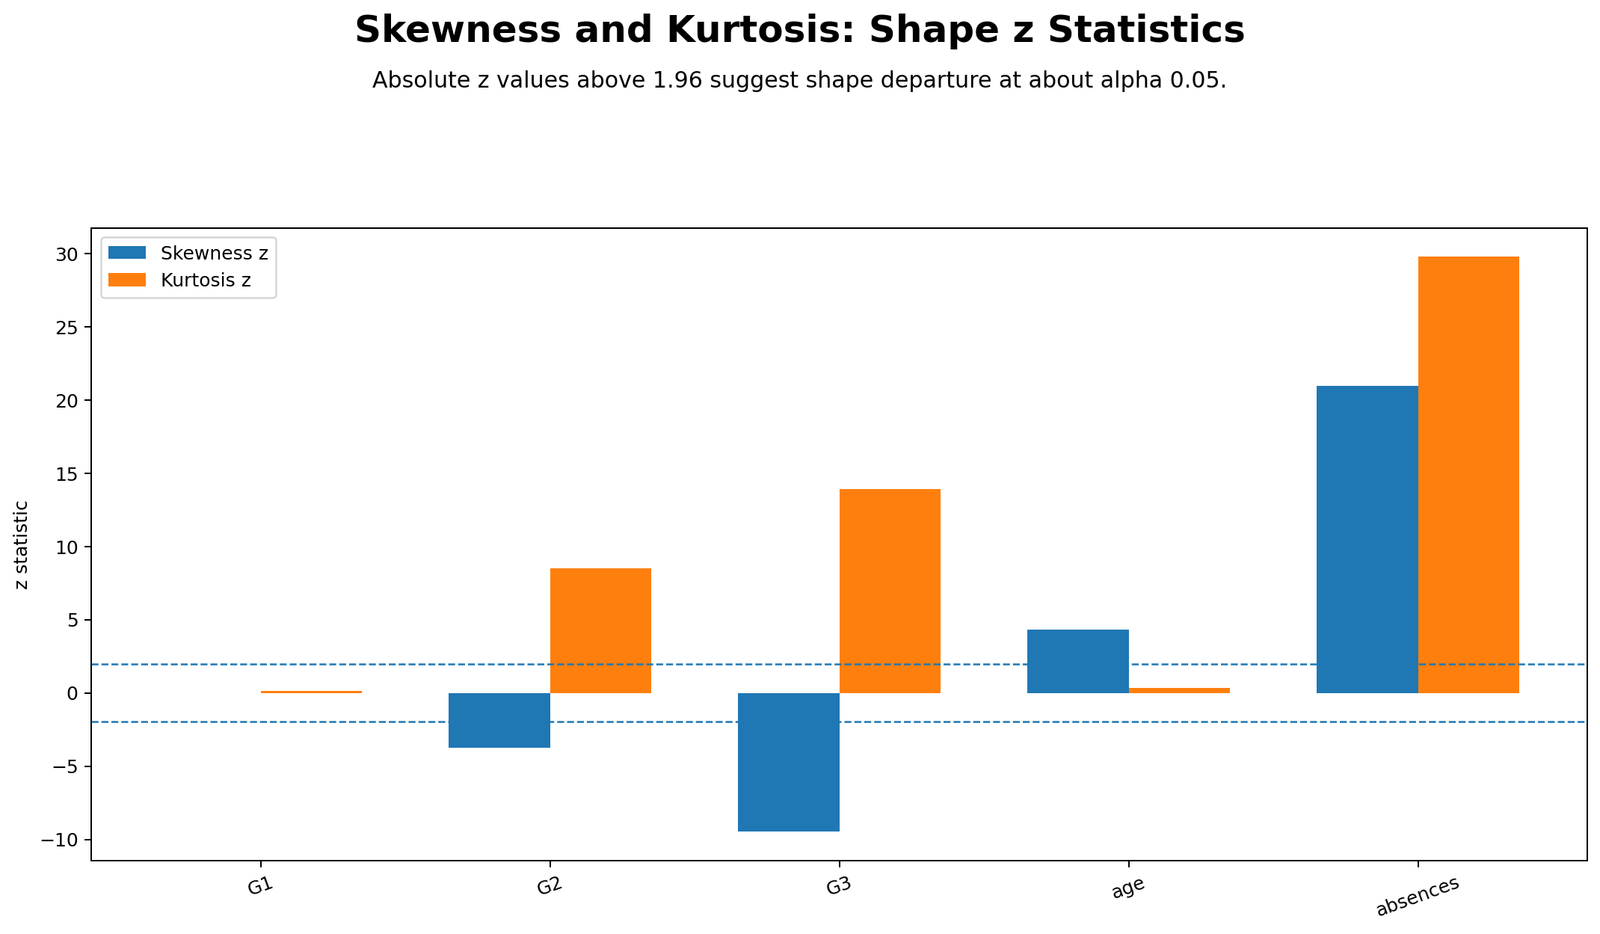
This chart converts skewness and kurtosis values into z statistics by dividing each statistic by its standard error. For the full sample, the skewness standard error is .096 and the kurtosis standard error is .192. This gives very large z values for variables such as absences and G3. For example, absences has skewness z around 21.05 and kurtosis z around 30.11. G3 has skewness z around -9.51 and kurtosis z around 14.13.
The z-statistic chart explains why formal tests reject normality. With N = 649, the standard errors are small, so departures from zero can become very clear. G1 has z values close to zero, which supports its practical closeness to normal shape.
Python Chart 7: Group Shape Comparison
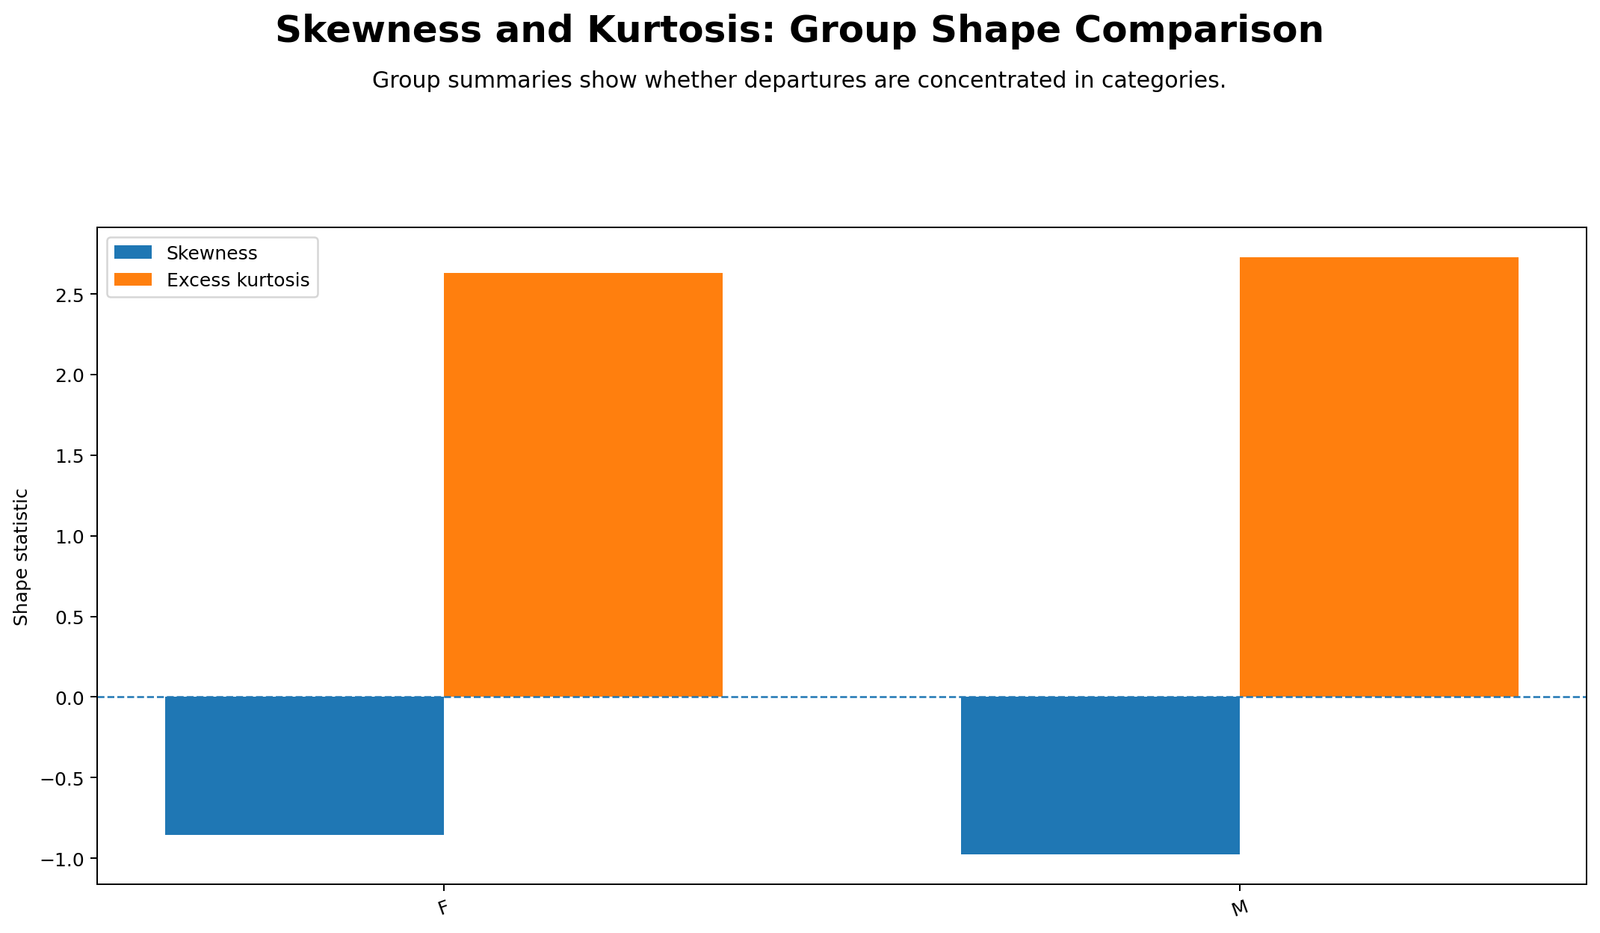
This chart compares the shape of G3 separately for female and male groups. SPSS shows that female students have G3 skewness = -.857 and kurtosis = 2.683, while male students have G3 skewness = -.980 and kurtosis = 2.803. Both groups show negative skew and positive kurtosis, and formal normality tests reject normality for both groups.
The group chart is useful because normality assumptions often apply within groups, not only in the total sample. Here, both groups have similar non-normal shape patterns, with the male group slightly more negatively skewed and slightly more kurtotic.
R Chart-by-Chart Validation
The R charts validate the same Skewness and Kurtosis Normality Check using a separate software environment. The R figures confirm the distribution shape, skewness ranking, kurtosis ranking, shape map, Jarque-Bera p-values, z statistics and group shape comparison.
R Chart 1: Distribution with Normal Curve
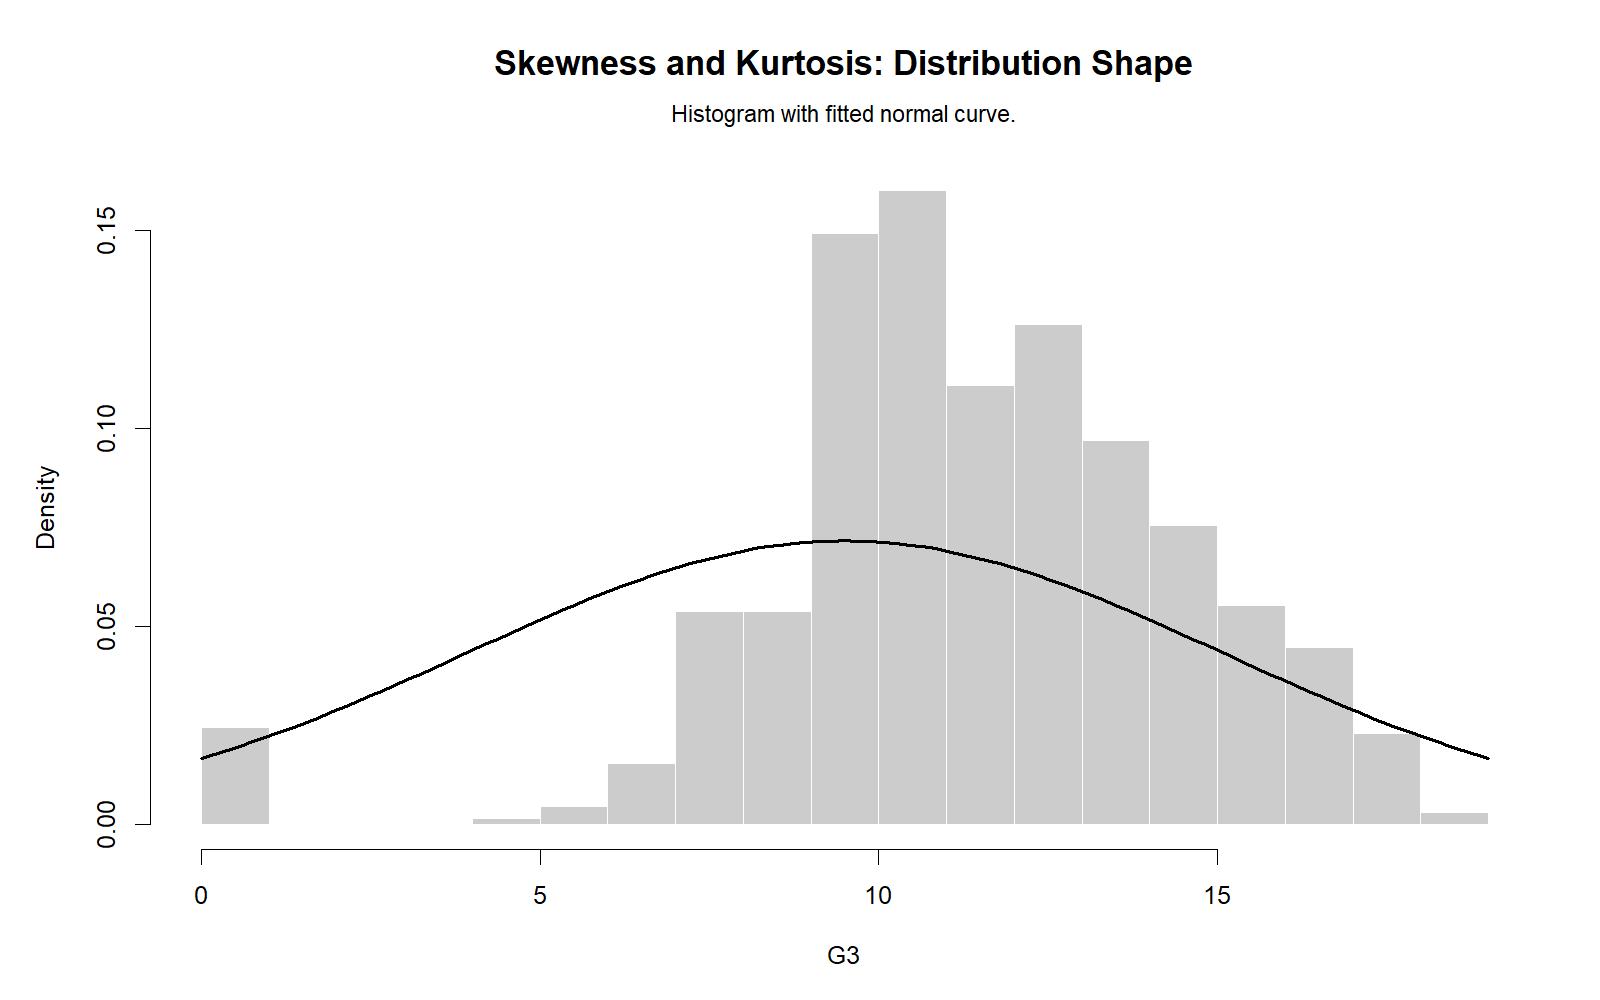
The R distribution chart confirms the Python visual interpretation. The observed distribution does not perfectly follow the theoretical normal curve, especially where skewness and tail behavior are present. This agrees with the SPSS normality output.
R Chart 2: Skewness Across Variables
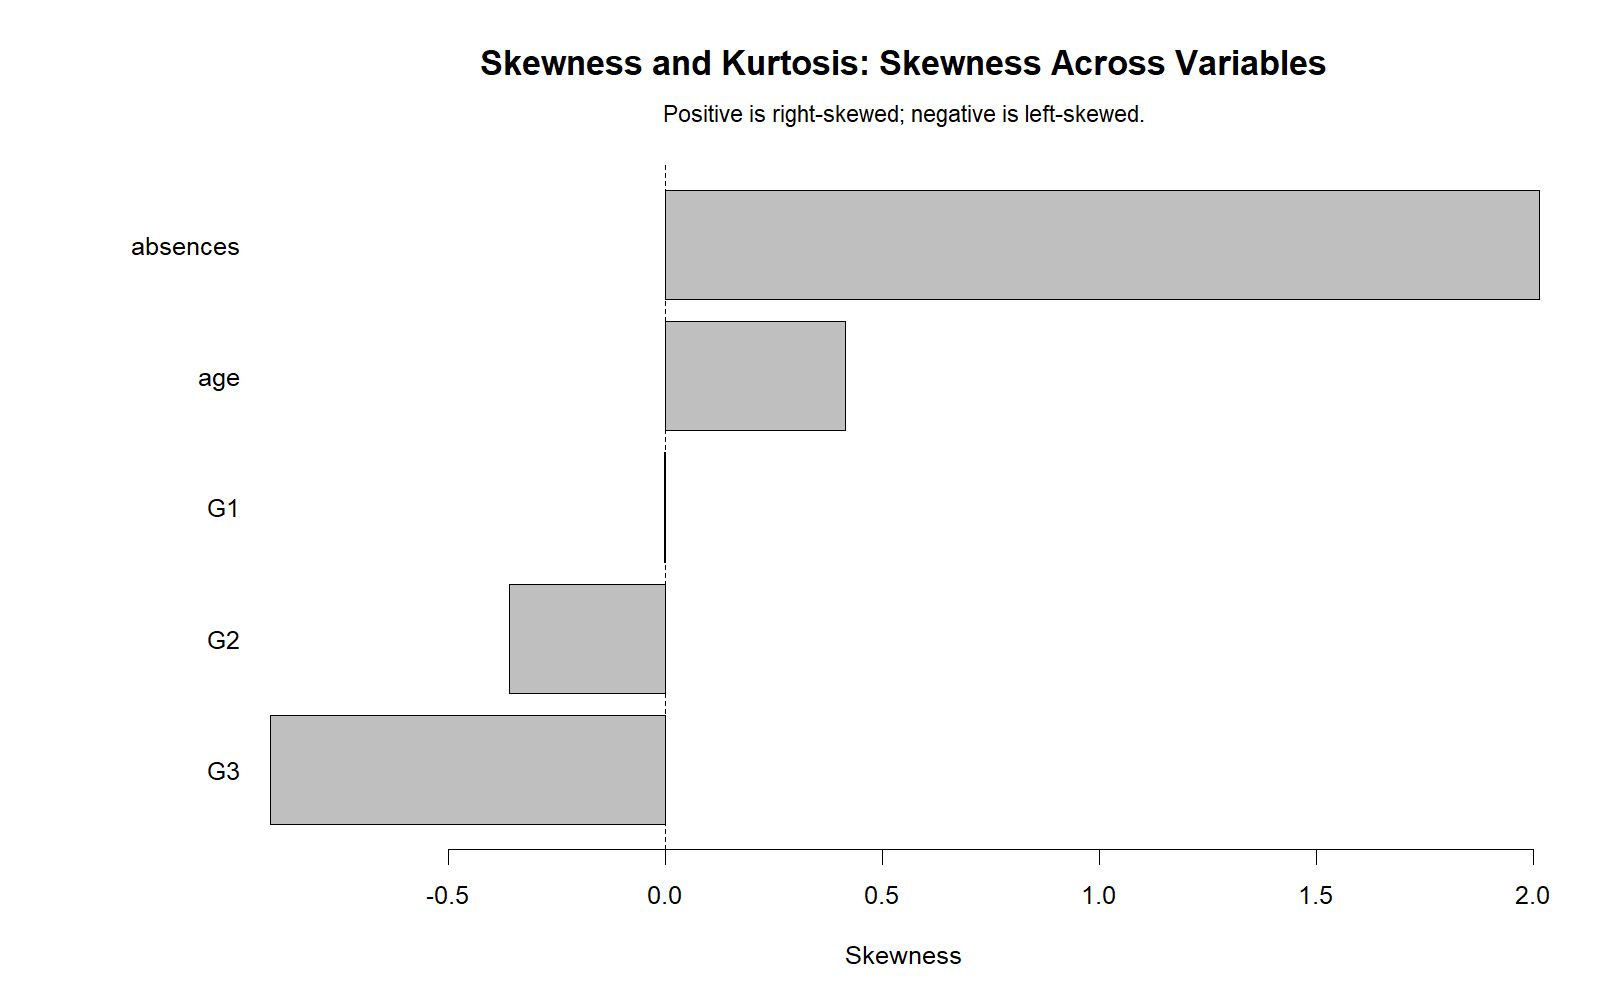
The R skewness chart validates the Python ranking. Absences is strongly positively skewed, age is mildly positively skewed, G3 and G2 are negatively skewed, and G1 is nearly symmetric.
R Chart 3: Kurtosis Across Variables
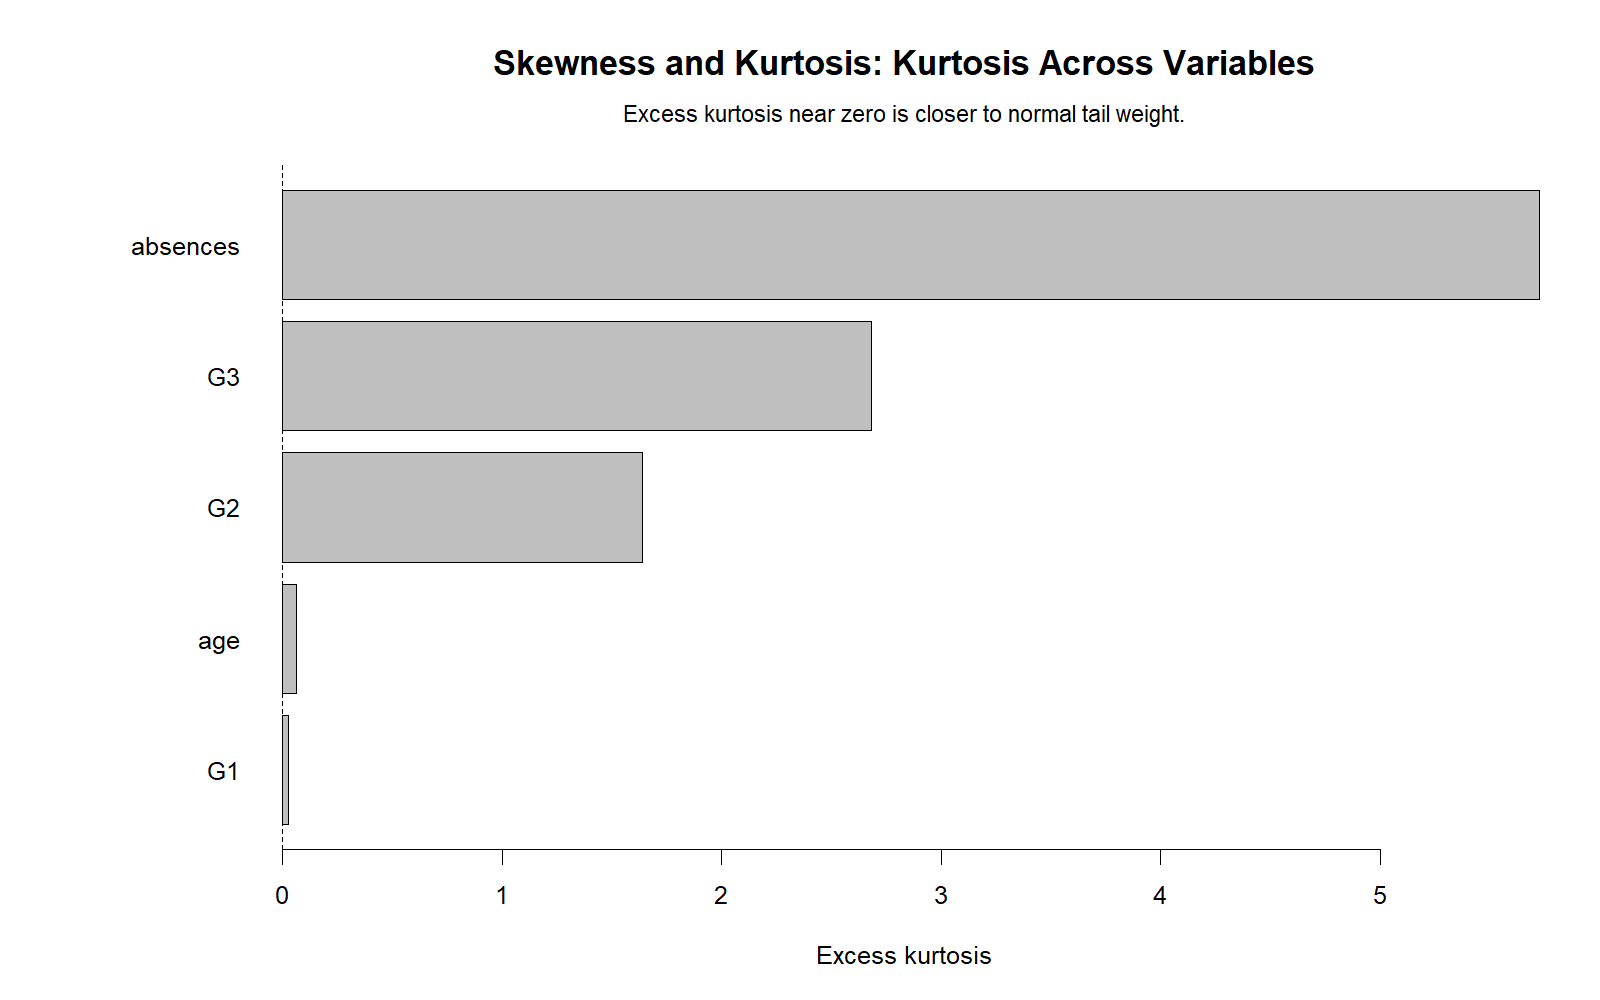
The R kurtosis chart confirms that absences has the strongest heavy-tail behavior, followed by G3 and G2. G1 and age remain close to zero on kurtosis, making them more normal-like in tail behavior.
R Chart 4: Skewness-Kurtosis Shape Map
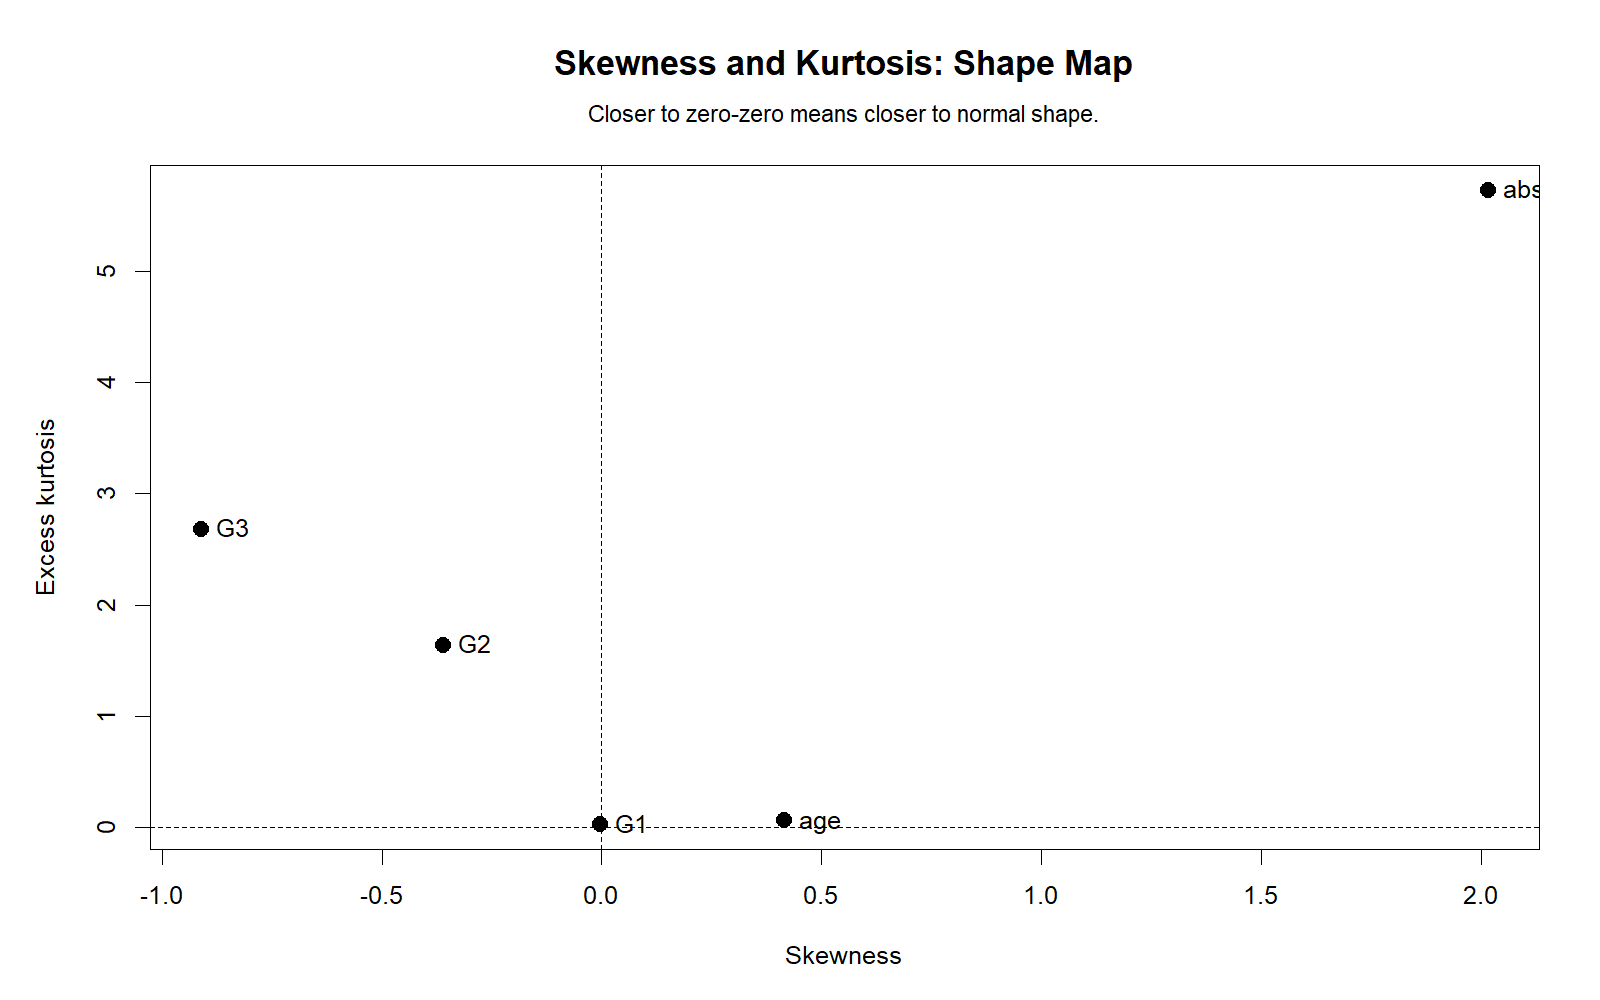
The R shape map confirms the practical conclusion that G1 is closest to normal shape and absences is farthest away. The chart is especially useful for explaining normality departure in two dimensions rather than one.
R Chart 5: Jarque-Bera p-values
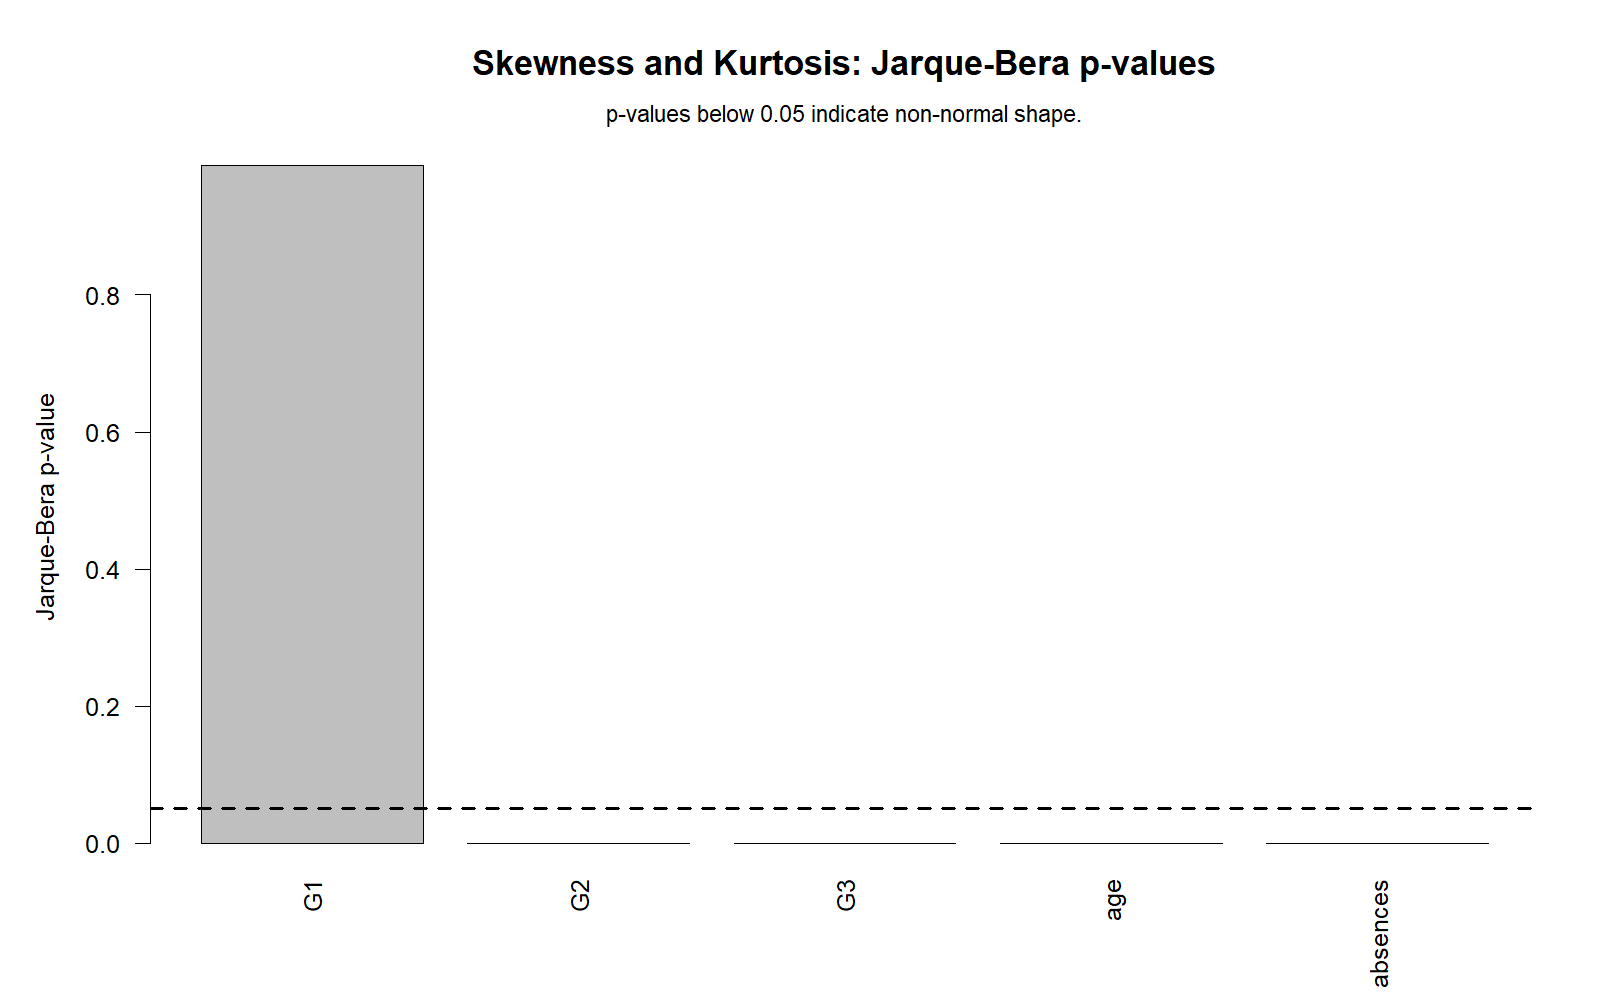
The R Jarque-Bera p-value chart validates the Python shape-based test. Because Jarque-Bera uses skewness and kurtosis together, it is a direct statistical companion to the shape map. Small p-values indicate departure from normality.
R Chart 6: Skewness and Kurtosis Z Statistics
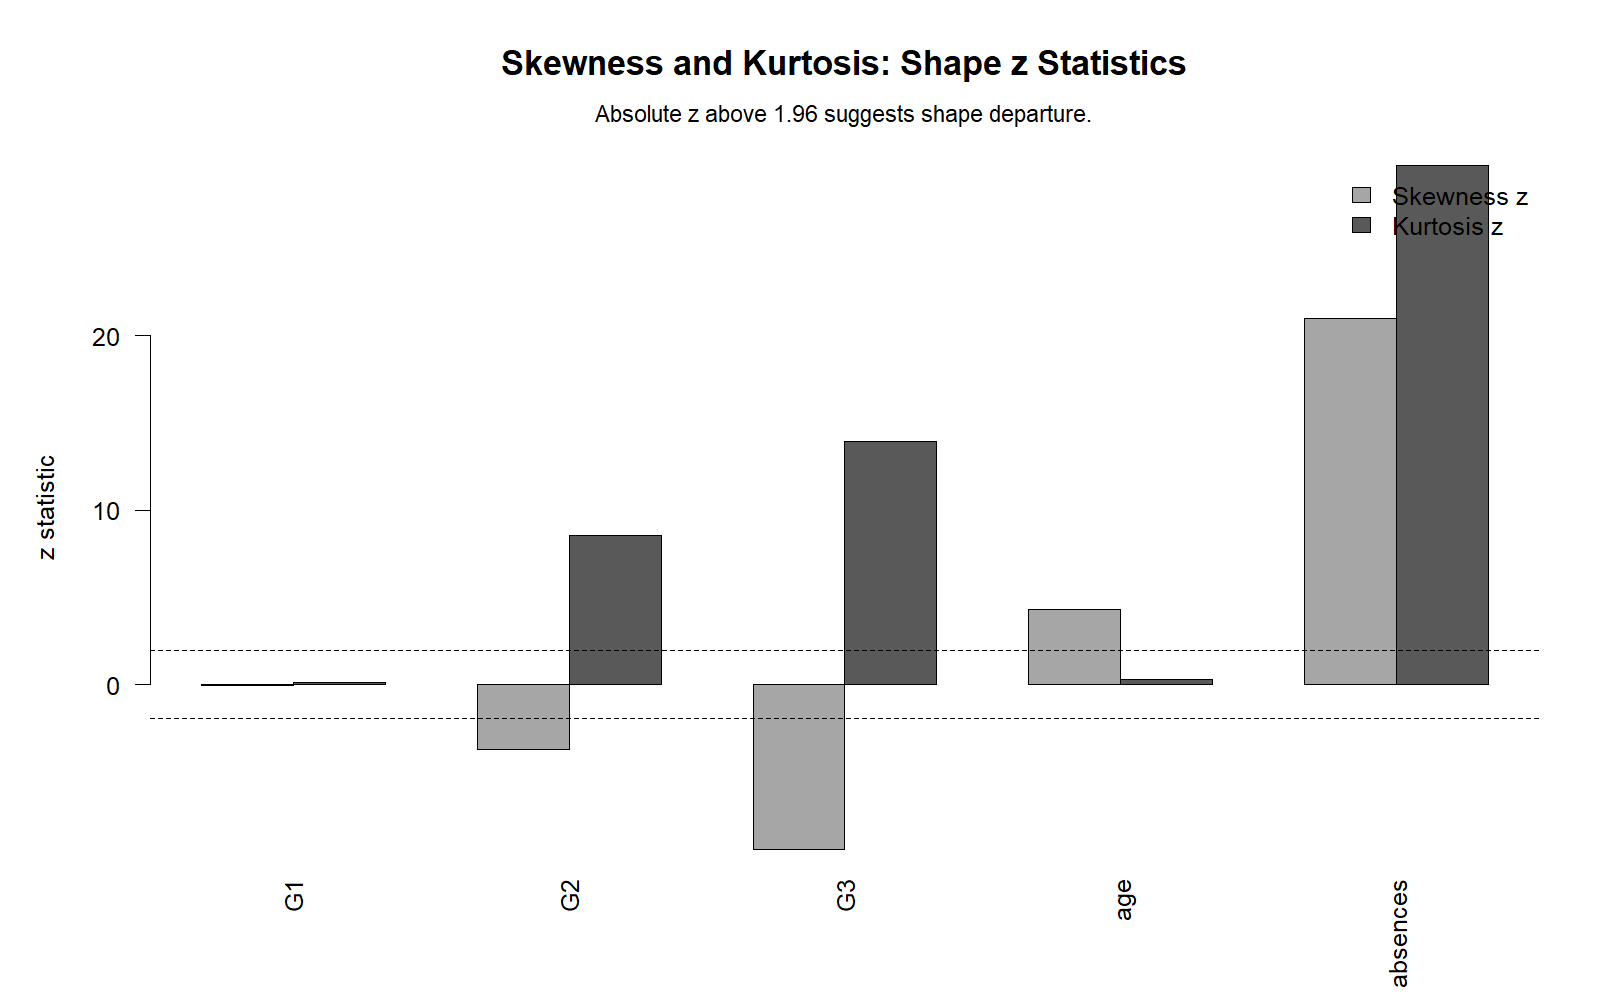
The R z-statistics chart confirms which variables have statistically large departures from normal shape. Absences has the strongest skewness and kurtosis z statistics, while G1 remains closest to zero.
R Chart 7: Group Shape Comparison
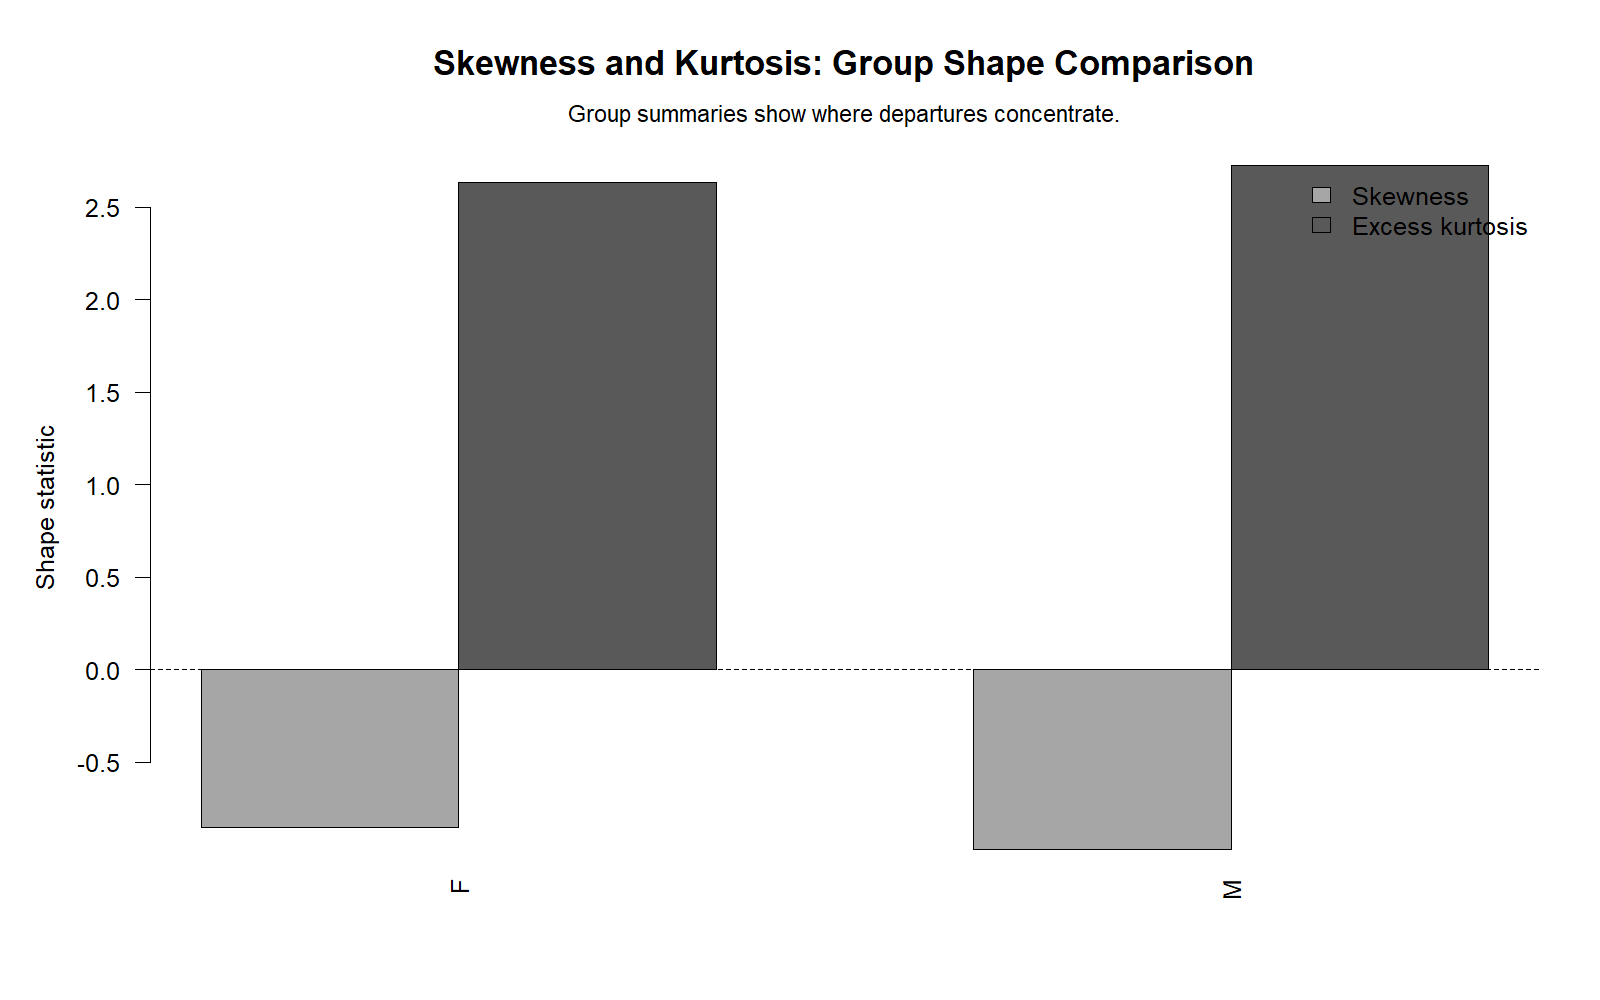
The R group shape comparison validates the Python and SPSS group interpretation. Female and male G3 distributions both show negative skew and positive kurtosis. This means normality concerns are visible within groups as well as in the full sample.
SPSS, R, Python and Excel Workflows for Skewness and Kurtosis Normality Check
The same normality workflow can be reproduced in SPSS, R, Python and Excel. The key steps are to calculate skewness, calculate kurtosis, divide by standard errors if z statistics are needed, inspect plots, and then combine all evidence into a practical normality decision.
SPSS Workflow
| Step | SPSS Menu or Syntax | Purpose |
|---|---|---|
| Open dataset | File > Open > Data | Load the SPSS-ready dataset. |
| Run Descriptives | Analyze > Descriptive Statistics > Descriptives | Get mean, SD, skewness and kurtosis. |
| Run Explore | Analyze > Descriptive Statistics > Explore | Get normality tests, histograms, Q-Q plots and group shape output. |
| Read skewness | Descriptives table | Check symmetry and direction of tail. |
| Read kurtosis | Descriptives table | Check tail/peak behavior. |
| Export output | File > Export or OUTPUT EXPORT | Save SPSS output PDF. |
R Workflow
| Step | R Action | Purpose |
|---|---|---|
| Read data | read.csv() | Load the dataset. |
| Calculate skewness | moments::skewness() | Measure symmetry. |
| Calculate kurtosis | moments::kurtosis() - 3 | Get excess kurtosis comparable to SPSS-style output. |
| Run Jarque-Bera | tseries::jarque.bera.test() | Test normality using skewness and kurtosis together. |
| Make plots | hist(), qqnorm(), qqline() | Check distribution visually. |
Python Workflow
| Step | Python Action | Purpose |
|---|---|---|
| Read data | pandas.read_csv() | Load the dataset into a DataFrame. |
| Calculate skewness | scipy.stats.skew() | Measure direction and size of asymmetry. |
| Calculate kurtosis | scipy.stats.kurtosis(..., fisher=True) | Measure excess kurtosis. |
| Run Jarque-Bera | scipy.stats.jarque_bera() | Test joint skewness-kurtosis normality. |
| Create plots | matplotlib | Generate WordPress-ready charts. |
Excel Workflow
| Excel Task | Formula or Tool | Purpose |
|---|---|---|
| Skewness | =SKEW(A2:A650) | Calculate skewness for a variable. |
| Kurtosis | =KURT(A2:A650) | Calculate excess kurtosis. |
| Skewness standard error | =SQRT(6/N) | Approximate SE for skewness. |
| Kurtosis standard error | =SQRT(24/N) | Approximate SE for kurtosis. |
| Skewness z | =Skewness/SE_Skewness | Check statistical size of skewness. |
| Kurtosis z | =Kurtosis/SE_Kurtosis | Check statistical size of kurtosis. |
Code Blocks for Skewness and Kurtosis Normality Check
SPSS Syntax for Skewness and Kurtosis Normality Check
* Skewness and Kurtosis Normality Check in SPSS.
* Variables: G3 G2 G1 age absences.

TITLE "Skewness and Kurtosis Normality Check".

DESCRIPTIVES VARIABLES=G3 G2 G1 age absences
  /STATISTICS=MEAN STDDEV MIN MAX SKEWNESS KURTOSIS.

EXAMINE VARIABLES=G3 G2 G1 age absences
  /PLOT BOXPLOT HISTOGRAM NPPLOT
  /COMPARE GROUPS
  /STATISTICS DESCRIPTIVES
  /CINTERVAL 95
  /MISSING LISTWISE
  /NOTOTAL.

EXAMINE VARIABLES=G3 BY sex
  /PLOT BOXPLOT HISTOGRAM NPPLOT
  /COMPARE GROUPS
  /STATISTICS DESCRIPTIVES
  /CINTERVAL 95
  /MISSING LISTWISE
  /NOTOTAL.

OUTPUT EXPORT
  /CONTENTS EXPORT=VISIBLE
  /PDF DOCUMENTFILE="Skewness-and-Kurtosis-Normality-Check-SPSS-Output.pdf".
Python Code for Skewness and Kurtosis Normality Check
import pandas as pd
import numpy as np
from scipy import stats

df = pd.read_csv("dataset.csv")

variables = ["G3", "G2", "G1", "age", "absences"]

rows = []
for var in variables:
    x = pd.to_numeric(df[var], errors="coerce").dropna()
    n = len(x)

    skew_value = stats.skew(x, bias=False)
    kurt_value = stats.kurtosis(x, fisher=True, bias=False)

    se_skew = np.sqrt(6 / n)
    se_kurt = np.sqrt(24 / n)

    skew_z = skew_value / se_skew
    kurt_z = kurt_value / se_kurt

    jb_stat, jb_p = stats.jarque_bera(x)
    shapiro_stat, shapiro_p = stats.shapiro(x)

    rows.append({
        "variable": var,
        "n": n,
        "mean": x.mean(),
        "std": x.std(ddof=1),
        "skewness": skew_value,
        "kurtosis": kurt_value,
        "skewness_z": skew_z,
        "kurtosis_z": kurt_z,
        "jarque_bera_stat": jb_stat,
        "jarque_bera_p": jb_p,
        "shapiro_wilk_stat": shapiro_stat,
        "shapiro_wilk_p": shapiro_p
    })

summary = pd.DataFrame(rows)
print(summary)

# Simple interpretation rule
summary["shape_flag"] = np.where(
    (summary["skewness"].abs() <= 0.5) & (summary["kurtosis"].abs() <= 1),
    "Close to normal shape",
    "Review shape"
)

print(summary[["variable", "skewness", "kurtosis", "shape_flag"]])
R Code for Skewness and Kurtosis Normality Check
# Skewness and Kurtosis Normality Check in R

df <- read.csv("dataset.csv")

variables <- c("G3", "G2", "G1", "age", "absences")

# install.packages(c("moments", "tseries"))
library(moments)
library(tseries)

rows <- list()

for(v in variables){
  x <- as.numeric(df[[v]])
  x <- x[!is.na(x)]
  n <- length(x)

  skew_value <- skewness(x)
  kurt_value <- kurtosis(x) - 3

  se_skew <- sqrt(6 / n)
  se_kurt <- sqrt(24 / n)

  skew_z <- skew_value / se_skew
  kurt_z <- kurt_value / se_kurt

  jb <- jarque.bera.test(x)

  rows[[v]] <- data.frame(
    variable = v,
    n = n,
    mean = mean(x),
    sd = sd(x),
    skewness = skew_value,
    kurtosis = kurt_value,
    skewness_z = skew_z,
    kurtosis_z = kurt_z,
    jarque_bera_p = jb$p.value
  )
}

summary_table <- do.call(rbind, rows)
print(summary_table)
Excel Formulas for Skewness and Kurtosis Normality Check
Assume a variable is in A2:A650.

Sample size:
=COUNT(A2:A650)

Mean:
=AVERAGE(A2:A650)

Standard deviation:
=STDEV.S(A2:A650)

Skewness:
=SKEW(A2:A650)

Kurtosis:
=KURT(A2:A650)

Approximate standard error of skewness:
=SQRT(6/COUNT(A2:A650))

Approximate standard error of kurtosis:
=SQRT(24/COUNT(A2:A650))

Skewness z statistic:
=SKEW(A2:A650)/SQRT(6/COUNT(A2:A650))

Kurtosis z statistic:
=KURT(A2:A650)/SQRT(24/COUNT(A2:A650))

Simple interpretation:
Skewness near 0 = symmetric.
Positive skewness = right-skewed.
Negative skewness = left-skewed.
Kurtosis near 0 = normal-like tails.
Positive kurtosis = heavy tails.
Negative kurtosis = flatter/lighter tails.
APA Reporting Wording for Skewness and Kurtosis Normality Check
When reporting skewness and kurtosis, include the key statistics, normality tests, and practical interpretation. Do not simply say “normal” or “not normal” without explaining which variables have the strongest shape concerns.
APA-Style Full-Sample Report
Normality was evaluated using skewness, kurtosis, Kolmogorov-Smirnov tests, Shapiro-Wilk tests, histograms, and Q-Q plots. SPSS normality tests were significant for all selected variables, p < .001. However, skewness and kurtosis indicated different degrees of departure. G1 was closest to normal shape, skewness = -0.003, kurtosis = 0.037. Absences showed the strongest departure, skewness = 2.021, kurtosis = 5.781, indicating a strongly right-skewed and heavy-tailed distribution.
APA-Style Group Shape Report
G3 normality was also checked by sex group. Female students had G3 skewness = -0.857 and kurtosis = 2.683, while male students had G3 skewness = -0.980 and kurtosis = 2.803. Shapiro-Wilk tests were significant for both female students, W = .934, p < .001, and male students, W = .913, p < .001. Therefore, both groups showed non-normal G3 distributions with negative skewness and positive kurtosis.
Student-Friendly Report Example
The skewness and kurtosis results showed that the variables differed in normality shape. G1 was closest to normal because its skewness and kurtosis were near zero. Absences was the most non-normal because it had strong positive skewness and high kurtosis. Formal normality tests rejected normality for all variables, but the practical severity was much greater for absences than for G1.
Common Mistakes in Skewness and Kurtosis Normality Check
| Mistake | Why It Is a Problem | Correct Practice |
|---|---|---|
| Using p-values only | Large samples can make small departures significant. | Use skewness, kurtosis, plots and practical context. |
| Ignoring kurtosis | A variable can be symmetric but still have abnormal tails. | Check both skewness and kurtosis. |
| Ignoring skewness direction | Positive and negative skew have different meanings. | Report whether the tail is right or left. |
| Calling all variables equally non-normal | Normality departure has degrees of severity. | Rank variables by practical shape departure. |
| Confusing raw kurtosis with excess kurtosis | Some software subtracts 3 and some does not. | State whether excess kurtosis is used. |
| Skipping visual checks | Numbers do not show the full distribution pattern. | Use histograms, Q-Q plots and boxplots. |
Key reminder: Skewness and kurtosis are shape diagnostics. They support normality interpretation, but they should not be used alone as the final assumption decision.
When to Use Skewness and Kurtosis Normality Check
Use Skewness and Kurtosis Normality Check when you need a numeric summary of distribution shape. It is especially useful before parametric tests, regression modeling, correlation analysis, ANOVA, transformation decisions, and normality reporting.
| Use Case | Why It Helps | Example from This Guide |
|---|---|---|
| Checking normality before tests | Identifies asymmetry and tail problems. | Absences is strongly non-normal. |
| Choosing transformations | Shows which variable needs shape correction. | Absences may need square root or another transformation. |
| Comparing variables | Ranks variables by shape severity. | G1 is closest to normal; absences is farthest. |
| Group assumption checks | Normality often matters within groups. | G3 is non-normal for both female and male groups. |
| APA reporting | Provides concise numeric evidence. | Report skewness, kurtosis, Shapiro-Wilk and practical interpretation. |
For related normality and transformation topics, use Q-Q plot normality check, P-P plot normality check, standard normal distribution, square root transformation, and reciprocal transformation.
Downloads and Resources for Skewness and Kurtosis Normality Check
The resources below include the SPSS output PDF, Python charts, and R validation charts used in this guide.
Download SPSS Output PDF
Verified SPSS output for skewness, kurtosis, normality tests, histograms, Q-Q plots and group shape comparison.
Copy Skewness and Kurtosis Code
Use the SPSS, Python, R and Excel code blocks to reproduce the normality workflow.
Python Chart 2: Skewness Across Variables
Visual comparison of skewness values across variables.
Python Chart 4: Shape Map
Combined skewness and kurtosis map for normality interpretation.
FAQs About Skewness and Kurtosis Normality Check
What is Skewness and Kurtosis Normality Check?
It is a distribution shape check that uses skewness to measure symmetry and kurtosis to measure peak or tail behavior. Together, they help evaluate whether a variable is approximately normal.
What is skewness?
Skewness measures asymmetry. Positive skewness means the right tail is longer or heavier. Negative skewness means the left tail is longer or heavier.
What is kurtosis?
Kurtosis measures tail and peak behavior. In excess kurtosis form, zero is normal-like, positive values suggest heavier tails, and negative values suggest flatter or lighter-tailed shape.
Which variable was closest to normal in this example?
G1 was closest to normal shape because its skewness was -0.003 and its kurtosis was 0.037.
Which variable was most non-normal in this example?
Absences was the most non-normal variable because its skewness was 2.021 and its kurtosis was 5.781.
Did SPSS normality tests reject normality?
Yes. Kolmogorov-Smirnov and Shapiro-Wilk tests were significant at p < .001 for the selected variables.
Why can G1 look close to normal but still have p < .001?
With a large sample such as N = 649, formal normality tests can detect small departures from normality. That is why practical shape statistics and plots should also be considered.
What is a skewness z statistic?
It is skewness divided by its standard error. It helps judge whether skewness is statistically noticeable.
What is a kurtosis z statistic?
It is kurtosis divided by its standard error. It helps judge whether kurtosis is statistically noticeable.
What is the Jarque-Bera test?
The Jarque-Bera test is a normality test based on skewness and kurtosis together. A small p-value suggests departure from normality.
How do I calculate skewness and kurtosis in Excel?
Use =SKEW(range) for skewness and =KURT(range) for excess kurtosis.
Should I transform a variable with high skewness and kurtosis?
Sometimes. A strongly skewed variable such as absences may benefit from square root transformation, log transformation, or another method, but the decision should depend on the variable type and analysis purpose.

