“`html
Variance Assumption Testing and Homogeneity of Variance
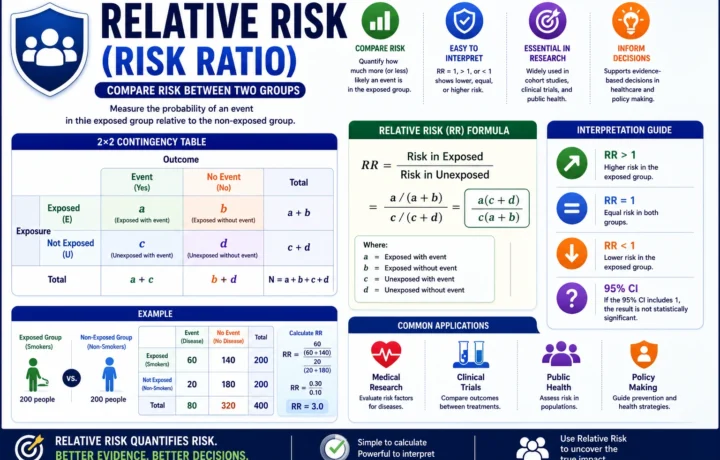
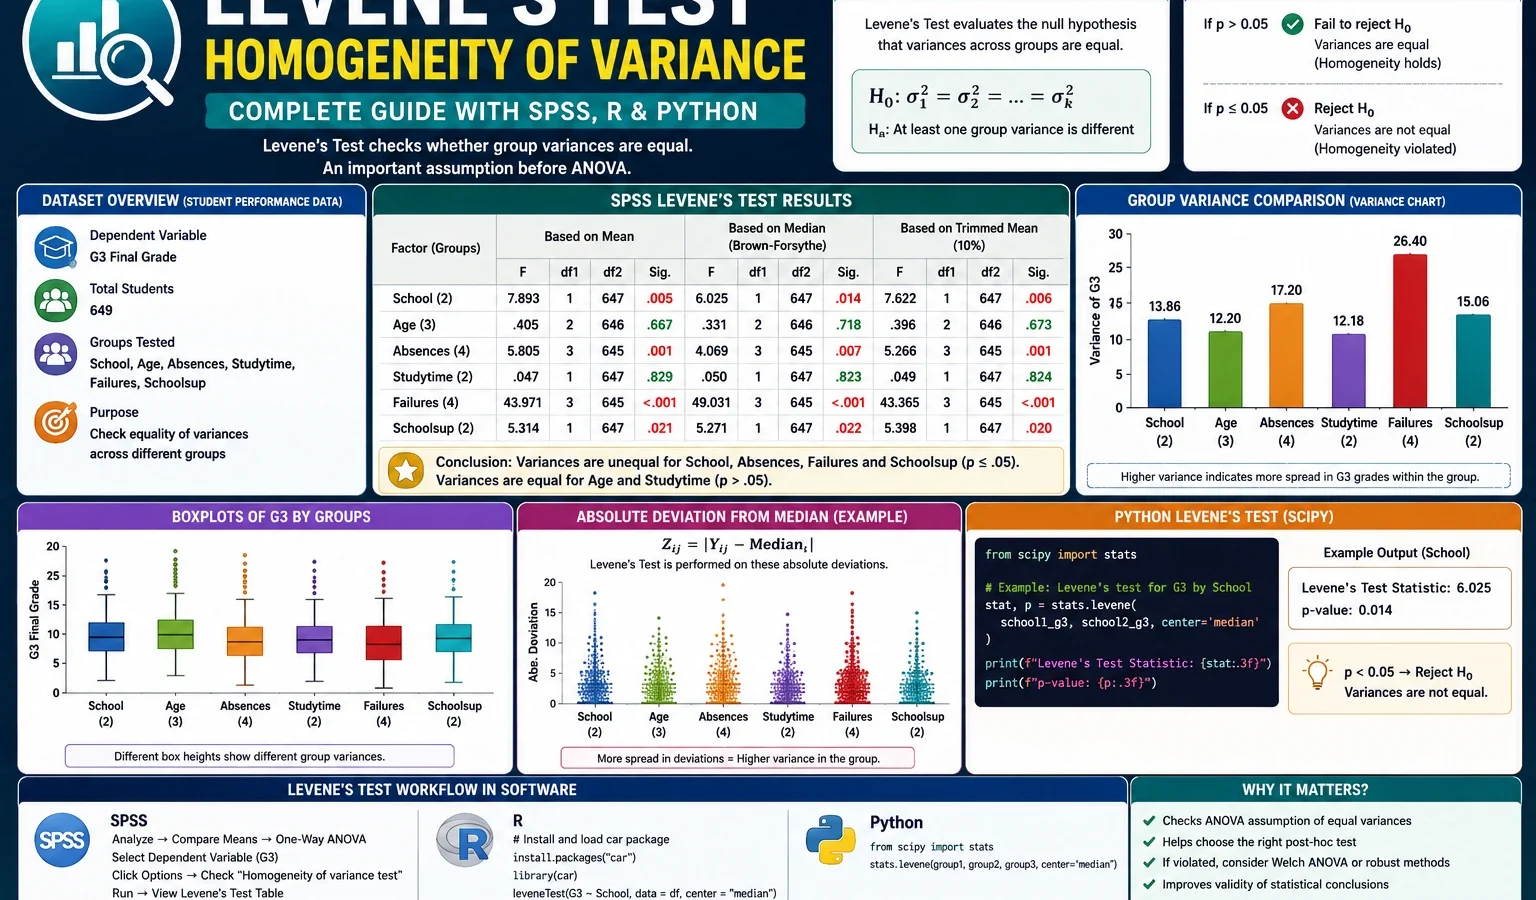
Levene Test is a statistical test used to check whether two or more groups have equal variance. This complete guide explains the Levene Test formula, null hypothesis, p-value interpretation, Brown-Forsythe median version, SPSS output, R workflow, Python charts, Excel checking method and verified results from the student-por.csv dataset using G3 final grade as the main outcome variable.
Google AdSense top placement reserved here
Quick Answer: Levene Test Result
A Levene Test was applied to the G3 final grade variable in the Portuguese student performance dataset. The analysis checked whether G3 grade variance was equal across student groups such as school, sex, age group, studytime group, failures group, absences group, school support and romantic relationship status.
Final result: The Levene Test showed unequal G3 variance across school, age group, absences group and school support. It did not show strong evidence of unequal variance across sex, studytime group or failures group. The romantic relationship grouping was borderline and should be reported carefully.
Important reporting note: Levene Test is not a test of mean difference. It is a test of variance difference. A group variable may strongly affect average G3 scores but still have a non-significant Levene Test result. The failures group in this example is the clearest proof of that point.
What Is the Levene Test?
The Levene Test, also called Levene’s Test, is a test for homogeneity of variance. Homogeneity of variance means that the spread of a dependent variable is similar across groups. In practical data analysis, this assumption is important before using ordinary one-way ANOVA, factorial ANOVA, independent-samples t-tests and many general linear model comparisons.
For example, suppose a researcher compares final grades between two schools. A mean comparison tells us whether one school has a higher average grade. The Levene Test tells us whether the grade spread is similar in both schools. One school may have a compact cluster of grades, while another school may contain both very low and very high grades. That difference in spread is exactly what Levene Test is designed to detect.
The test is commonly used before:
- one-way ANOVA,
- independent-samples t-test,
- factorial ANOVA,
- general linear model comparisons,
- educational group comparisons,
- clinical group comparisons,
- survey data analysis,
- experimental treatment comparisons.
Practical note: A significant Levene Test does not automatically destroy the analysis. It tells the researcher that the equal-variance assumption is questionable. In that situation, a Welch t-test, Welch ANOVA, Brown-Forsythe robust ANOVA or heteroscedasticity-aware method may be safer than a strict equal-variance procedure.
If you are building a complete assumption-testing workflow, you may also need the Brown-Forsythe Test for robust variance comparison, the Hartley F Max Test for variance-ratio checking, the Cochran C Test for largest-variance detection, the Goldfeld-Quandt Test for regression heteroscedasticity, the DAgostino Pearson Test for normality and the Kolmogorov Smirnov Test for distribution comparison.
Levene Test Formula
The Levene Test works by converting the original values into absolute deviations from a group center. Then it runs an ANOVA-like comparison on those absolute deviation values. If the average deviations differ across groups, the variances are not homogeneous.
For observation Yij in group j, the transformed absolute deviation is:
Zij = |Yij - Yj.center|Here, Yij is the original value, such as a student’s G3 final grade. Yj.center is the group center. Zij is the absolute distance of that observation from its group center.
After calculating absolute deviations, the test compares the mean absolute deviations across groups. If one group has much larger deviations from its own center, that group has more spread, and the Levene Test may become significant.
| Version | Group center used | Best use | Meaning in this post |
|---|---|---|---|
| Mean-based Levene Test | Group mean | Common standard output and basic assumption checking. | Used in the SPSS homogeneity table summary. |
| Median-based Levene Test | Group median | More robust when data are skewed or contain outliers. | Equivalent to the Brown-Forsythe style interpretation. |
| Trimmed-mean Levene Test | Trimmed group mean | Useful when extreme values should be partially reduced. | Useful as a supporting check in SPSS. |
The median-centered version is often called the Brown-Forsythe Test. It is more robust when the dependent variable is not perfectly normal or when groups contain outliers. Since G3 is a bounded grade score with low values, zero values and uneven group sizes, the median-centered version is a useful supporting interpretation.
Levene Test Null Hypothesis and Alternative Hypothesis
The Levene Test has a simple null hypothesis and alternative hypothesis.
| Hypothesis | Meaning | Applied to this example |
|---|---|---|
| H0 | The group variances are equal. | G3 final-grade variance is the same across the grouping variable being tested. |
| H1 | At least one group variance is different. | At least one school, age group, absence group or support group has a different G3 spread. |
The usual decision rule is: if the Levene Test p-value is below .05, reject the equal-variance assumption. If the p-value is greater than or equal to .05, do not reject the equal-variance assumption. However, this decision should always be read with group variances, boxplots, sample sizes and context.
Google AdSense middle placement reserved here
Dataset and Levene Test Model Used
This worked example uses the student-por.csv student performance dataset. The dependent variable is G3 final grade. The purpose is to test whether G3 variance remains equal across several student-level grouping variables.
| Item | Verified value or role | Explanation |
|---|---|---|
| Rows used | 649 | Total valid student observations used in the Levene Test workflow. |
| Dependent variable | G3 | Final grade whose variance is tested across groups. |
| Main grouping variables | school, sex, age_group, studytime_group, failures_group, absences_group, schoolsup, romantic | Student categories used to test whether final-grade spread changes across groups. |
| Main test | Levene Test | Tests homogeneity of variance. |
| Robust interpretation | Brown-Forsythe median-centered version | Uses absolute deviations from group medians. |
| Software used | SPSS, R, Python and Excel workflow | SPSS output verifies the table results; R and Python generate reproducible charts; Excel explains the manual logic. |
External dataset source: UCI Machine Learning Repository: Student Performance dataset.
Verified Levene Test Results in SPSS, R and Python
The cleaned file contains 649 valid G3 cases. The G3 final grade has mean 11.91, standard deviation 3.231 and variance 10.437. The variable ranges from low final grades to high passing grades, which makes variance checking important before using equal-variance methods.
G3 Descriptive Statistics
| Statistic | Verified value | Interpretation |
|---|---|---|
| N | 649 | The cleaned dataset contains 649 valid final-grade cases. |
| Mean | 11.91 | The average final grade is slightly below 12. |
| Standard deviation | 3.231 | G3 usually varies by about 3.23 grade points around the mean. |
| Variance | 10.437 | This is the overall variance before splitting by groups. |
Main SPSS Levene Test Summary
| Grouping variable | Levene statistic based on mean | df1 | df2 | Sig. | Decision | Practical interpretation |
|---|---|---|---|---|---|---|
| School | 13.232 | 1 | 647 | .000 | Significant | G3 variance differs between school GP and school MS. |
| Sex | 0.004 | 1 | 647 | .950 | Not significant | Female and male grade spreads are similar. |
| Age group | 18.897 | 1 | 647 | .000 | Significant | Older students show much wider final-grade spread. |
| Studytime group | 1.857 | 1 | 647 | .173 | Not significant | Studytime groups do not show strong variance inequality. |
| Failures group | 0.120 | 1 | 647 | .729 | Not significant | Failure history affects mean grades more than variance in this test. |
| Absences group | 6.676 | 3 | 645 | .000 | Significant | G3 variance differs across absence categories. |
| School support | 10.499 | 1 | 647 | .001 | Significant | Students without school support have wider G3 variance. |
| Romantic relationship | 3.868 | 1 | 647 | .050 | Borderline | Possible variance difference, but the result should not be overstated. |
Brown-Forsythe Median-Centered Summary
The median-centered Levene Test, commonly interpreted as the Brown-Forsythe version, gave the same main story. The strongest unequal-variance evidence appeared for age group, followed by school, absences group, school support and romantic relationship. Studytime group did not cross the .05 threshold.
| Grouping variable | F statistic | df | p-value | Decision | Interpretation |
|---|---|---|---|---|---|
| age_group | 18.150 | 1, 647 | 0.000023 | Significant | Strongest median-centered evidence of unequal G3 variance. |
| school | 12.706 | 1, 647 | 0.000391 | Significant | School GP and school MS have clearly different grade spreads. |
| absences_group | 6.128 | 3, 645 | 0.000411 | Significant | Grade variance changes across absence bands. |
| schoolsup | 10.983 | 1, 647 | 0.000971 | Significant | School support status is linked with unequal G3 spread. |
| romantic | 3.935 | 1, 647 | 0.047711 | Weakly significant | Borderline variance difference; interpret cautiously. |
| studytime_group | 1.814 | 1, 647 | 0.178494 | Not significant | No strong median-centered variance violation for studytime group. |
Group Descriptive Statistics Behind the Main Results
| Grouping variable | Important group pattern | Why Levene Test reacts |
|---|---|---|
| School | School GP: mean 12.58, SD 2.626; School MS: mean 10.65, SD 3.834. | MS has a much wider spread than GP, so equal variance is not supported. |
| Age group | Younger students have variance 7.961; older students have variance 16.469. | Older students are more heterogeneous in final-grade outcomes. |
| Absences group | No absences group has variance 16.583; low and moderate absence groups have smaller variances. | Variance is not equal across absence bands; the no-absence group is widest. |
| School support | No support group variance 10.996; school support group variance 5.309. | Supported students are more compact, while unsupported students are more spread out. |
| Failures group | Mean difference is large, but variance difference is not statistically significant. | Levene Test separates mean difference from variance difference. |
Levene Test Charts and Interpretation
1. G1, G2 and G3 P-Value Comparison

This chart places the G3 result in context by comparing variance-test patterns across G1, G2 and G3. The main post focuses on G3 because it is the final grade, but earlier grades can behave differently. A good assumption-checking workflow does not assume that the variance result for one grade variable automatically applies to all grade variables.
2. G3 Variance by School

The school variance chart directly explains the significant Levene Test result. School GP has a tighter grade distribution, while school MS has a much wider spread. This means school MS is not only lower in average performance; it is also less consistent in final-grade outcomes.
3. G3 Boxplot by School

The boxplot confirms the same pattern visually. School GP is more compact, while school MS shows wider dispersion and stronger lower-end spread. If a researcher compares GP and MS using a mean test, the unequal-variance issue should be considered.
4. Absolute Deviation by School

This chart is closest to the actual Levene Test logic. The test converts grades into distances from group centers. If one school has larger absolute deviations, it has more spread. School MS shows the larger deviation pattern, which explains the significant p-value.
5. Case-Level Deviations by School

The case-deviation chart shows that the school effect is not created by one row only. Many observations in the wider-spread school sit farther from their school-specific center. This supports a genuine group-level variance interpretation.
6. G3 Variance by Age Group

The age-group result is the strongest variance signal in the analysis. Older students have much higher grade variance than younger students. This may happen because older students include more repeated, delayed or academically mixed cases. The Levene Test does not prove the reason, but it clearly detects unequal grade spread.
7. G3 Boxplot by Age Group

The boxplot shows that the older age group is not merely different in average grade. It is more variable. Some older students perform reasonably well, while others have much lower final grades. This wider spread explains why equal variance is not supported for age group.
8. Absolute Deviation by Age Group

The absolute-deviation chart shows the mechanism behind the age-group result. The older group has larger distances from its own center, so the Levene Test detects variance heterogeneity. This is why age group should be treated carefully in any G3 comparison.
9. Case-Level Deviations by Age Group

This chart is useful because it shows individual cases rather than only group summaries. The wider spread in the older group is not just a table artifact. It is visible at the case level.
10. G3 Variance by Absences Group

The absences-group result is significant, but it should be interpreted carefully. A beginner might assume that the high-absence group must have the highest variance. The chart shows a more interesting result: the no-absence group has the largest observed variance. This means the correct conclusion is variance inequality across absence groups, not a simple claim that more absence always creates more spread.
11. G3 Boxplot by Absences Group

The boxplot explains why the no-absence group can have high variance. Some students with no recorded absences still have low final grades, while others perform very well. That combination creates wide spread. The high-absence group is much smaller, so its observed variance should be interpreted cautiously.
12. Absolute Deviation by Absences Group

The absolute-deviation chart confirms that the absence groups differ in how far individual grades sit from their own group centers. Since Levene Test is built on these deviations, this chart directly supports the significant result.
13. Case-Level Deviations by Absences Group

This chart prevents a misleading causal reading. Levene Test detects unequal variance, but it does not prove that absence category causes the variance pattern. It shows the distribution of distances within each absence group.
14. G3 Variance by Sex

The sex comparison is a useful non-significant example. Although male and female students may differ slightly in average G3, the variance difference is not strong. SPSS reports p = .950, meaning the equal-variance assumption is not rejected for sex.
15. G3 Boxplot by Sex

The sex boxplot supports the non-significant Levene Test result. The spread pattern is broadly similar, so the article should not claim unequal variance for sex.
16. G3 Variance by Studytime Group

The studytime group result teaches the difference between descriptive variance and inferential significance. The higher studytime group may look somewhat less variable, but the Levene Test p-value is above .05. Therefore, the correct report is that equal variance was not rejected for studytime group.
17. G3 Boxplot by Studytime Group

The boxplot suggests that higher studytime students may have better grade outcomes, but the Levene Test focuses on spread. Since the variance difference is not statistically strong, the article should not report a formal variance violation for studytime group.
18. G3 Variance by Failures Group

The failures group is the best teaching example in the whole post. Students with previous failures generally have much lower mean G3 scores. However, Levene Test is not significant for failures group. This proves that mean difference and variance difference are different statistical questions.
19. G3 Boxplot by Failures Group

This chart shows a clear location shift: students with previous failures tend to score lower. But the spread around each group center is not different enough for a significant Levene Test. A good report should separate those two findings.
20. G3 F-Statistic Comparison

The F-statistic chart ranks the grouping variables by variance-test strength. Age group and school stand out clearly. Absences group and school support also show important unequal-variance patterns. Sex, studytime group and failures group remain low.
21. G3 P-Value Strength Chart

The p-value strength chart separates the significant and non-significant results visually. School, age group, absences group and school support provide clear evidence against equal variance. Romantic relationship is borderline. Sex, studytime group and failures group do not provide strong evidence of unequal variance.
22. Top Group Variance by Age Group

The top-group variance chart isolates age group because it is one of the strongest drivers of unequal variance in G3. This chart supports the conclusion that age-based comparisons should consider unequal-variance methods.
23. Top Group Absolute Deviation by Age Group

This chart explains why the age-group Levene Test is strong. Older-student scores more often sit far from the group center. That larger absolute-deviation pattern produces the significant test result.
Python Validation Charts for Levene Test
The Python workflow produced matching validation charts. These charts are useful because they confirm that the Levene Test interpretation is reproducible through code and not limited to SPSS output only.
The Python p-value chart confirms the same ranking: age group, school, absences group and school support are the most important unequal-variance results. It also confirms that studytime and failures should not be described as significant variance violations.
The Python F-statistic comparison validates the SPSS and R-style interpretation. It shows that age group has the strongest variance-separation signal, while sex and failures remain weak variance-test comparisons.
The Python school chart confirms that school MS is more variable than school GP. This is the practical reason the school-based Levene Test is significant.
The Python age-group chart confirms that older students have a much wider G3 spread. This is why age group remains the strongest variance result across the workflow.
The Python absences chart confirms the same non-obvious result: the no-absence group has the largest observed variance. This is why chart-based explanation is necessary.
The Python school boxplot supports the unequal-variance result and makes the group spread difference easier for readers to understand.
The Python age-group boxplot confirms wider dispersion among older students. This is one of the strongest practical findings in the post.
The Python absences boxplot confirms that the variance pattern is not a simple linear absence story. The no-absence group contains a wide range of outcomes.
How to Run the Levene Test in SPSS, R, Python and Excel
Levene Test in SPSS
SPSS can run the Levene Test through GLM, One-Way ANOVA and independent-samples t-test procedures. In this workflow, GLM was used because it reports homogeneity-of-variance tables clearly for each grouping variable.
* Levene Test in SPSS using GLM.
* Example: G3 final grade by school.

GET DATA
 /TYPE=TXT
 /FILE='D:\low kda score priority basis posts\first post\Levenes Test\student_por_levenes_test_clean.csv'
 /ENCODING='UTF8'
 /DELCASE=LINE
 /DELIMITERS=","
 /QUALIFIER='"'
 /ARRANGEMENT=DELIMITED
 /FIRSTCASE=2
 /VARIABLES=
 case_id F8.0
 school A8
 sex A8
 age F8.0
 studytime F8.0
 failures F8.0
 schoolsup A8
 romantic A8
 absences F8.0
 G1 F8.0
 G2 F8.0
 G3 F8.0.
CACHE.
EXECUTE.

RECODE school ("GP"=1) ("MS"=2) INTO school_n.
VARIABLE LABELS school_n "School".
VALUE LABELS school_n 1 "School GP" 2 "School MS".
EXECUTE.

GLM G3 BY school_n
 /PRINT=DESCRIPTIVE HOMOGENEITY
 /DESIGN=school_n.
In SPSS output, read the Levene’s Test of Equality of Error Variances table. If the Sig. value is below .05, the equal-variance assumption is not supported for that grouping variable.
Levene Test in R
In R, the car package provides a convenient leveneTest() function. The median-centered version is useful when the data are not perfectly normal.
install.packages("car")
library(car)

# Mean-centered Levene Test
leveneTest(G3 ~ school, data = student_data, center = mean)

# Median-centered Brown-Forsythe version
leveneTest(G3 ~ school, data = student_data, center = median)

# More examples
leveneTest(G3 ~ age_group, data = student_data, center = median)
leveneTest(G3 ~ absences_group, data = student_data, center = median)
leveneTest(G3 ~ schoolsup, data = student_data, center = median)
R is useful for reproducible testing and quick comparison across many grouping variables. It is also good for producing clean summary tables for a blog post or research report.
Levene Test in Python
In Python, use scipy.stats.levene(). The argument center="median" gives the Brown-Forsythe style version.
import pandas as pd
from scipy import stats

df = pd.read_csv("student_por_levenes_test_clean.csv")

gp = df.loc[df["school"] == "GP", "G3"].dropna()
ms = df.loc[df["school"] == "MS", "G3"].dropna()

result = stats.levene(gp, ms, center="median")

print("Levene / Brown-Forsythe F statistic:", result.statistic)
print("p-value:", result.pvalue)
For multiple groups such as absences group:
groups = [
    group["G3"].dropna().values
    for name, group in df.groupby("absences_group")
]

result = stats.levene(*groups, center="median")

print("Absences group F statistic:", result.statistic)
print("p-value:", result.pvalue)
Python is especially useful for creating variance charts, boxplots, absolute-deviation charts and p-value strength charts.
Levene Test in Excel
Excel does not have a single built-in button named “Levene Test,” but the logic can be created manually. This is useful for teaching the test.
| Excel step | Action | Example |
|---|---|---|
| Step 1 | Split G3 by group. | Separate G3 scores for school GP and school MS. |
| Step 2 | Calculate each group center. | Use =MEDIAN(range) for the Brown-Forsythe version. |
| Step 3 | Calculate absolute deviation. | =ABS(G3_value - group_median) |
| Step 4 | Run one-way ANOVA on the deviation values. | Use Excel Data Analysis ToolPak. |
| Step 5 | Interpret the ANOVA p-value. | If p < .05, variances are not homogeneous. |
Group median:
=MEDIAN(B2:B424)

Absolute deviation:
=ABS(B2 - group_median_cell)

Final decision:
Use ANOVA: Single Factor on absolute deviations.
How to Report the Levene Test Result
A good report should mention the dependent variable, grouping variable, test statistic, degrees of freedom, p-value and practical conclusion. It should also explain what statistical method will be used after the variance check.
School report sentence: Levene Test indicated unequal G3 variances across schools, F(1, 647) = 13.232, p < .001. School MS showed wider final-grade spread than school GP, so unequal-variance methods should be considered for school-based G3 comparisons.
Age-group report sentence: Levene Test showed unequal G3 variances across age groups, F(1, 647) = 18.897, p < .001. Older students had substantially higher variance than younger students, so the equal-variance assumption was not supported.
Absences-group report sentence: Levene Test showed unequal G3 variances across absence categories, F(3, 645) = 6.676, p < .001. The no-absence group had the largest observed variance, so the result should be interpreted with group-size and distribution differences in mind.
Studytime report sentence: Levene Test did not reject equality of G3 variances across studytime groups, F(1, 647) = 1.857, p = .173. Therefore, the equal-variance assumption was not strongly challenged for this studytime grouping.
When Should You Use the Levene Test?
Use the Levene Test when you want to compare means across two or more independent groups and need to check whether the equal-variance assumption is reasonable. It is especially useful before ANOVA, independent-samples t-tests and general linear model comparisons.
| Situation | Use Levene Test? | Reason |
|---|---|---|
| Comparing G3 grades between two schools | Yes | Checks whether grade variance is equal before school comparison. |
| Comparing grades across absence categories | Yes | Absence groups may have different grade spread. |
| Repeated-measures ANOVA with G1, G2 and G3 | No, not as the main sphericity test | Use Mauchly’s Test and corrections such as Greenhouse-Geisser or Huynh-Feldt. |
| Regression heteroscedasticity | Sometimes, but not the main test | Use regression-specific tests such as Goldfeld-Quandt or Breusch-Pagan. |
| Distribution normality checking | No | Use normality tests such as DAgostino Pearson or Kolmogorov Smirnov. |
Common Mistakes
1. Treating Levene Test as a Mean Test
Levene Test is not a test of average difference. It is a variance test. The failures group in this dataset proves the point: students with previous failures have lower average G3 scores, but the Levene Test does not show significant unequal variance for failures group.
2. Reporting Only the P-Value
A p-value tells whether variance inequality is statistically detectable. It does not tell which group is wider. Always include group variances, boxplots or absolute-deviation charts.
3. Ignoring Group Size
The high-absence group is much smaller than some other groups. Small groups can make variance estimates less stable. Interpret variance charts with group size in mind.
4. Saying Non-Significant Means Exactly Equal
A non-significant Levene Test does not prove that variances are exactly equal. It means there is not enough evidence to reject equality of variances.
5. Deleting Cases Automatically
If Levene Test is significant, do not automatically delete outliers or remove groups. First check plots, data validity and whether a robust method is more appropriate.
Download SPSS Output and Verification Files
The SPSS PDF verifies the clean data import, descriptive statistics, Levene homogeneity tables, Brown-Forsythe median-centered logic and group-level variance interpretation used in this article.
External References for Levene Test and Homogeneity of Variance
This post uses verified SPSS, R and Python outputs together with external statistical references and software documentation. These external resources help readers verify the background of Levene Test, Brown-Forsythe median-centered testing, equality of variances and assumption checking.
FAQs About Levene Test
What does the Levene Test do?
Levene Test checks whether the variances of a dependent variable are equal across two or more groups. It is a homogeneity-of-variance test.
When should I use the Levene Test?
Use it before ANOVA, independent-samples t-tests or group comparisons when you need to check the equal-variance assumption.
What is the null hypothesis of the Levene Test?
The null hypothesis is that the group variances are equal. If the p-value is below .05, the equal-variance assumption is rejected.
What was the main Levene Test result in this example?
G3 variance was unequal across school, age group, absences group and school support. Sex, studytime group and failures group did not show strong evidence of unequal variance.
Which grouping variable had the strongest variance signal?
Age group had the strongest variance signal. Older students showed much wider G3 final-grade spread than younger students.
Was school significant in the Levene Test?
Yes. The school result was significant. School MS had wider G3 variance than school GP.
Was studytime significant in the Levene Test?
No. Studytime group did not show strong evidence of unequal G3 variance in this workflow.
Is Levene Test the same as Brown-Forsythe Test?
Brown-Forsythe is a median-centered version of the Levene Test. It uses absolute deviations from group medians and is more robust when data are skewed or contain outliers.
Can Levene Test be done in SPSS?
Yes. SPSS reports Levene Test through GLM, One-Way ANOVA and independent-samples t-test procedures.
Can Levene Test be done in R?
Yes. R users can run Levene Test with functions such as car::leveneTest().
Can Levene Test be done in Python?
Yes. Python users can run Levene Test with scipy.stats.levene(). Use center=”median” for the Brown-Forsythe version.
Can Levene Test be done in Excel?
Yes, manually. Calculate absolute deviations from group centers and then run one-way ANOVA on those deviation values.
Google AdSense bottom placement reserved here
“`