
Boschloo Test: Formula, Statistic, Calculator, Python, R, SPSS and Excel Guide
Boschloo Test, commonly written as Boschloo's Test, is an unconditional exact procedure for comparing two independent binomial proportions in a 2 × 2 table. This guide explains the Fisher-p ordering statistic, nuisance-parameter maximization, two-sided convention, effect sizes, APA reporting, Python and R charts, SPSS output, Excel formulas and a worked analysis of 649 students.
Boschloo Test Model Overview
Boschloo Test is an exact unconditional test for comparing two independent binary-outcome probabilities. It uses a one-sided Fisher exact p-value to order every possible 2 × 2 table and then maximizes the unconditional tail probability over the common null success probability.
Research Question
Does the probability of G3 ≥ 10 differ between female and male students?
Why the Method Is Unconditional
The female and male sample sizes are fixed, but the combined positive-outcome total is not conditioned upon. Under H0, both groups share an unknown probability π. Boschloo Test finds the largest null rejection probability over possible π values.
Boschloo Test Statistic
The Boschloo Test statistic is a one-sided Fisher exact p-value. For the observed direction, the statistic is 0.0304927910. Smaller Fisher-p values define more extreme tables.
Two-Sided Convention
The primary workflow uses twice the smaller one-sided Boschloo p-value, clipped at 1.
Worked Scenario
Female students have 333 positive and 50 negative outcomes; male students have 216 positive and 50 negative outcomes. The positive proportions are 0.869452 and 0.812030.
Quick Answer: Boschloo Test Result
Test Summary
- Procedure: two-sided Boschloo unconditional exact test
- Selected direction: greater
- One-sided p: 0.025694
- Two-sided p: 0.051387
- Decision: fail to reject H0
Substantive Meaning
- Female proportion: 0.869452
- Male proportion: 0.812030
- Risk difference, M − F: -0.057422
- Risk ratio: 0.933957
- Cramer's V: 0.078222
Table of Contents
- Research question and data design
- When to use Boschloo Test
- How Boschloo's Test works
- Variables and data dictionary
- Complete results
- Boschloo vs Fisher, Barnard and chi-square
- Calculator steps
- Seven Python chart stories
- Five additional R charts
- Assumptions and diagnostics
- Python, R, SPSS and Excel
- Expandable code
- Advanced topics
- APA reporting
- Common mistakes
- Downloads
- Related guides
- FAQs
- Conclusion
Research Question, Hypotheses and Data Design
Null and Alternative Hypotheses
| Hypothesis | Statement | Meaning |
|---|---|---|
| Null | pF = pM | Equal positive-outcome probabilities. |
| Two-sided | pF ≠ pM | Different probabilities in either direction. |
| Directional | pF > pM | Use only when specified before the data are viewed. |
Sampling Design
The fixed binomial sample sizes are 383 and 266. The combined positive total of 549 is not fixed by the test.
Why Direction Must Be Prespecified
The observed proportions suggest a female advantage, but the primary analysis remains two-sided. See Null and Alternative Hypothesis and Type I and Type II Error.
When to Use Boschloo Test
Use It When
- The table is exactly 2 × 2.
- The groups are independent.
- The outcome is binary.
- The group sample sizes are fixed.
- The outcome totals are not fixed.
- An exact unconditional comparison is required.
- Fisher may be unnecessarily conservative.
- Small or unbalanced samples make asymptotic methods unattractive.
Choose Another Method When
- Observations are paired.
- The table is larger than 2 × 2.
- Data are clustered or repeated.
- Covariate adjustment is required.
- The original outcome should stay quantitative.
- Both margins were fixed.
- The question concerns prediction.
- Multiple strata require adjustment.
Boschloo Test Statistic 2x4 Clarification
The phrase boschloo test statistic 2x4 describes a table outside the standard method. Boschloo Test is defined for 2 × 2 tables. A 2 × 4 table requires a larger-table method or a justified recoding.
Independent Versus Paired Data
Boschloo's Test is not a matched-pair test. Repeated observations from the same people require a paired binary procedure.
How Boschloo's Test Works
Calculate a one-sided Fisher p-value.
Vary both success counts while fixing group sizes.
Search the common null probability.
Observed Table
| Group | G3 ≥ 10 | G3 < 10 | Total | Proportion |
|---|---|---|---|---|
| Female | 333 | 50 | 383 | 0.869451697 |
| Male | 216 | 50 | 266 | 0.812030075 |
Observed Fisher-p Statistic
Double-Binomial Sample Space
Female positive counts range from 0 to 383; male positive counts range from 0 to 266. The exact calculation considers 102,528 possible count pairs.
Joint Null Probability
Nuisance Maximization
The greater-direction maximum is 0.0256936226 near π = .590522. The opposite-direction result is 0.9779287416.
Two-Sided Result
Statistic Versus P-Value
The statistic is the observed one-sided Fisher p-value. The final p-value is an unconditional maximum. Reporting them as the same number is incorrect.
Variables and Data Dictionary
| Variable | Role | Coding | N | Counts | Meaning |
|---|---|---|---|---|---|
| sex | Grouping variable | F, M | 649 | 383, 266 | Two independent samples. |
| G3 | Original outcome | 0–19 | 649 | Thresholded | Source of the binary event. |
| G3 ≥ 10 | Positive outcome | 1 | 649 | 549 | Event category. |
| G3 < 10 | Negative outcome | 0 | 649 | 100 | Non-event category. |
Observed, Expected and Residual Values
| Cell | Observed | Expected | Pearson residual | Adjusted residual |
|---|---|---|---|---|
| Female positive | 333 | 323.986133 | 0.500781 | 1.992745 |
| Female negative | 50 | 59.013867 | -1.173368 | -1.992745 |
| Male positive | 216 | 225.013867 | -0.600906 | -1.992745 |
| Male negative | 50 | 40.986133 | 1.407968 | 1.992745 |
Complete Boschloo Test Results
333/383
216/266
Male minus female
Ordering value
Two-sided exact
Small association
Primary Test
| Test | Statistic | P-value | Decision |
|---|---|---|---|
| Two-sided Boschloo Test | 0.0304927910 | 0.0513872452 | Fail to reject H0 |
| Greater component | 0.0304927910 | 0.0256936226 | Directional rejection |
| Less component | 0.9817869178 | 0.9779287416 | Fail to reject |
Effect Estimates
| Measure | Estimate | 95% lower | 95% upper | Meaning |
|---|---|---|---|---|
| Female proportion | 0.869451697 | 0.832010079 | 0.899555769 | Female positive probability. |
| Male proportion | 0.812030075 | 0.760762032 | 0.854414008 | Male positive probability. |
| Risk difference | -0.057421622 | -0.115238335 | 0.000395091 | Male is 5.74 points lower. |
| Risk ratio | 0.933956513 | 0.871133702 | 1.001309864 | Male probability is 93.4% of female probability. |
| Odds ratio | 0.648648649 | 0.422897988 | 0.994909130 | Male success odds are lower. |
| Cramer's V | 0.078222103 | — | — | Small association. |
Interpretation
The two-sided Boschloo Test p-value is .051387, slightly above .05. The equality null is not rejected. The effect estimates nevertheless show a 5.74-point female advantage, with intervals that sit close to their null values.
Why Intervals Can Differ at the Boundary
The displayed risk-difference, risk-ratio and odds-ratio intervals use different approximate scales and are not exact inversions of the Boschloo Test. Small differences near the threshold are therefore possible.
Boschloo Test Versus Fisher, Barnard and Chi-Square
Unconditional exact test ordered by Fisher p-values.
Conditional exact test with fixed margins.
Unconditional test ordered by a score statistic.
Asymptotic test based on observed and expected counts.
Numerical Comparison
| Method | Statistic | P-value | Decision | Role |
|---|---|---|---|---|
| Boschloo Test | 0.030493 | 0.051387 | Fail to reject | Primary exact result |
| Fisher exact | OR = 1.541667 | 0.059797 | Fail to reject | Conditional comparison |
| Barnard exact | 1.992745 | 0.048703 | Reject narrowly | Alternative ordering |
| Pearson chi-square | 3.971035 | 0.046289 | Reject | Asymptotic comparison |
| Yates chi-square | 3.542706 | 0.059808 | Fail to reject | Corrected comparison |
Why Boschloo Is More Powerful Than Fisher
Boschloo Test uses Fisher's p-value as an ordering statistic but calibrates the rejection region unconditionally. This avoids some conservatism caused by conditioning on the observed outcome total.
Boschloo Versus Barnard
Both are unconditional. Boschloo uses Fisher-p ordering; Barnard uses a score or Wald ordering. Different exact orderings can give different borderline decisions.
Why Pearson Rejects
Pearson uses an asymptotic continuous reference and gives p = .0463. Boschloo uses a discrete unconditional calculation and gives p = .0514.
Which Result Is Primary?
Use the method selected from the design and analysis plan. Do not replace a prespecified Boschloo Test after seeing another p-value cross .05.
Boschloo Test Calculator: Step-by-Step Workflow
A Boschloo Test calculator needs the four counts, the two group totals, the alternative, the two-sided convention and a global nuisance search.
Calculator Inputs
| Input | Value |
|---|---|
| Female positive | 333 |
| Female negative | 50 |
| Male positive | 216 |
| Male negative | 50 |
| Alternative | Two-sided |
| Two-sided rule | 2 × smaller one-sided p |
Step 1: Confirm Sample Sizes
The fixed binomial totals are 383 and 266, not the outcome totals.
Step 2: Calculate Fisher Ordering
The observed Fisher-p statistic is 0.0304927910.
Step 3: Enumerate Tables
The sample space contains 102,528 possible positive-count pairs.
Step 4: Build the Nuisance Profile
The greater-direction maximum is 0.0256936226 near π = .590522.
Step 5: Double the Smaller Direction
Step 6: Interpret the Effect
Read the exact p-value with the two proportions, risk difference and confidence intervals.
Seven Python Boschloo Test Chart Stories
The Python figures progress from the four observed cells to standardized proportions, method comparison, nuisance-parameter optimization, relative effects, expected counts and residual diagnostics. Each chart is interpreted with exact numerical values from the 649-case analysis, so the visual section functions as a connected statistical argument rather than as a gallery of images.
Python Chart 1: Boschloo Test — 2 × 2 Contingency Heatmap
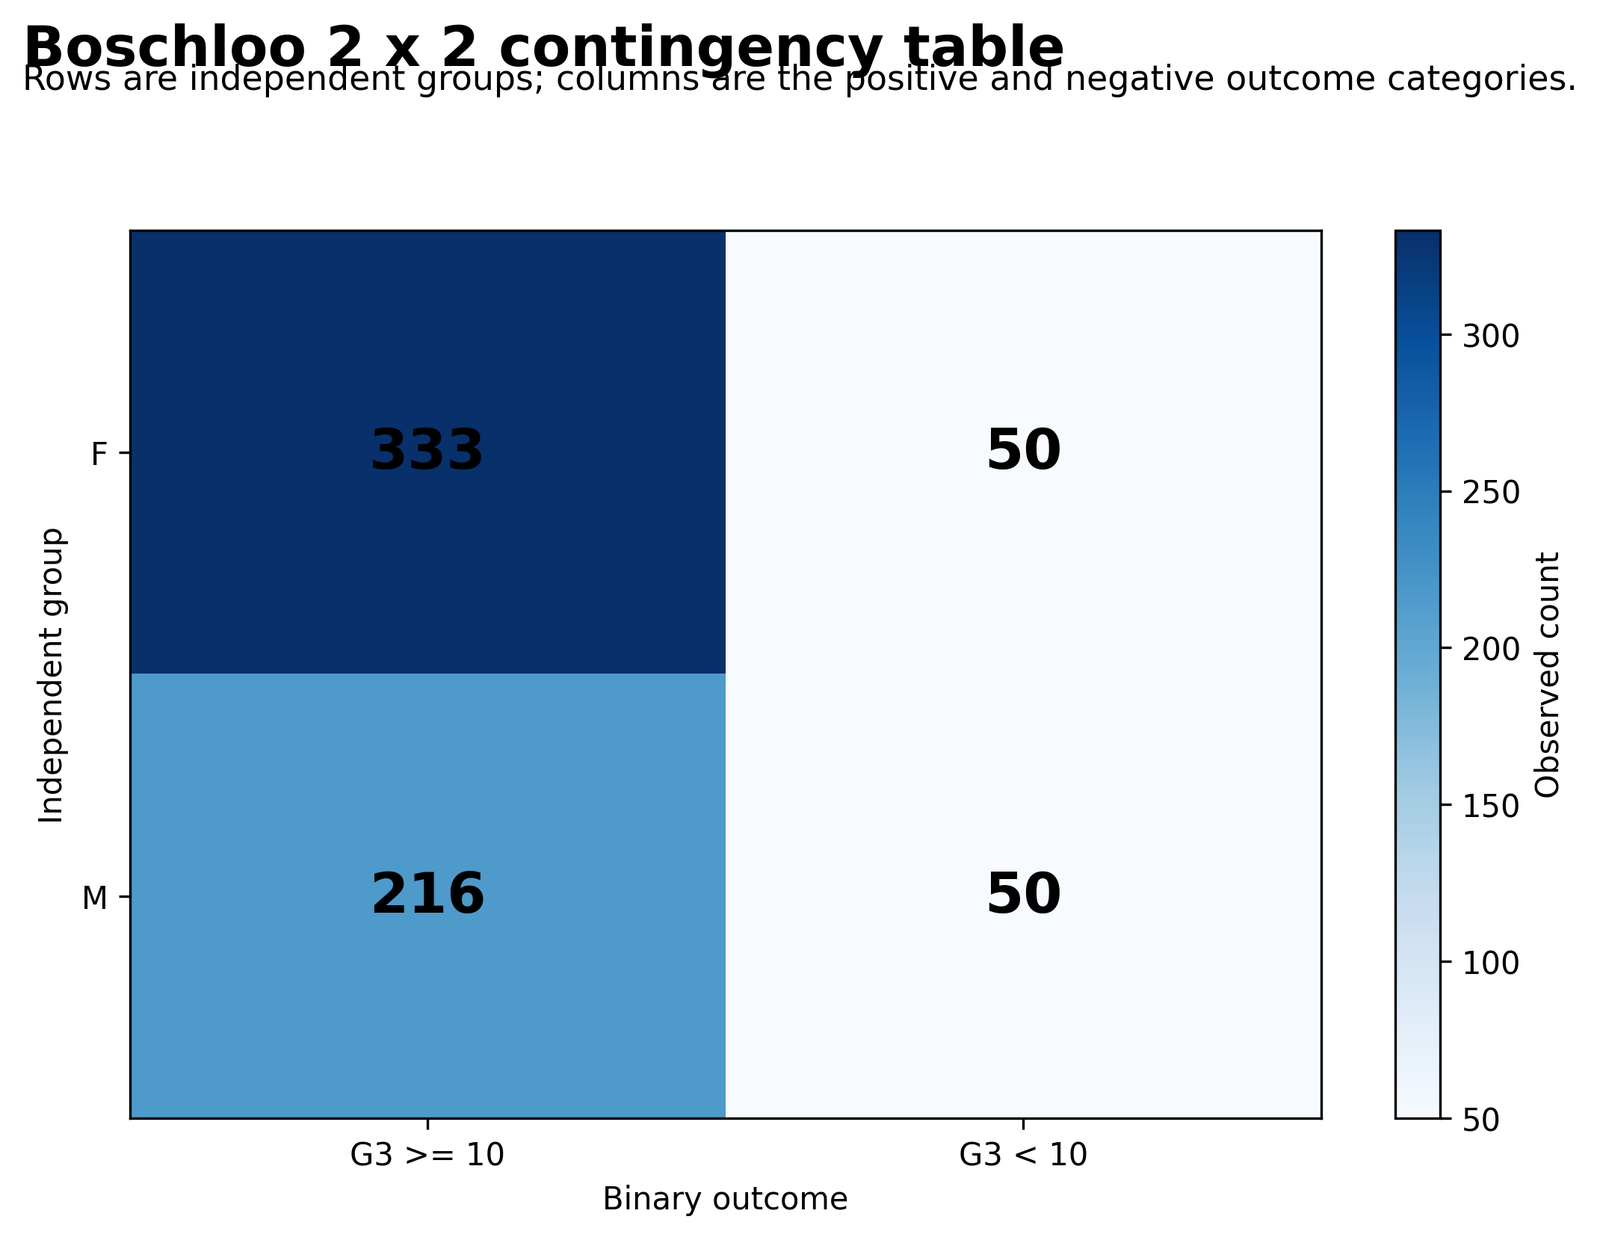
The largest cell is the female positive-outcome cell. Both negative cells contain 50 students, but the unequal group totals mean the negative-outcome rates are not equal. The heatmap therefore needs to be read with the row totals rather than by cell size alone.
Female: 333 positive and 50 negative, n = 383. Male: 216 positive and 50 negative, n = 266. The complete table contains 649 observations.
Boschloo Test compares two probabilities. The heatmap supplies the four counts used to calculate the one-sided Fisher ordering statistic, enumerate every possible table and construct the unconditional tail probability.
Every later statistic depends on this coding. Reversing the event category or treating the outcome totals as the sample sizes would answer a different question.
Python Chart 2: Boschloo Test — Group Outcome Proportions
The female positive segment is visibly larger, whereas the male negative segment is larger. Unlike the count chart, this display removes the effect of unequal sample sizes and presents the substantive group difference directly on the probability scale.
Female positive: 86.945%. Male positive: 81.203%. Female negative: 13.055%. Male negative: 18.797%.
The observed female advantage is approximately {(p_f-p_m)*100:.3f} percentage points. This is the primary absolute effect description and remains meaningful regardless of whether the exact p-value lies just above or below .05.
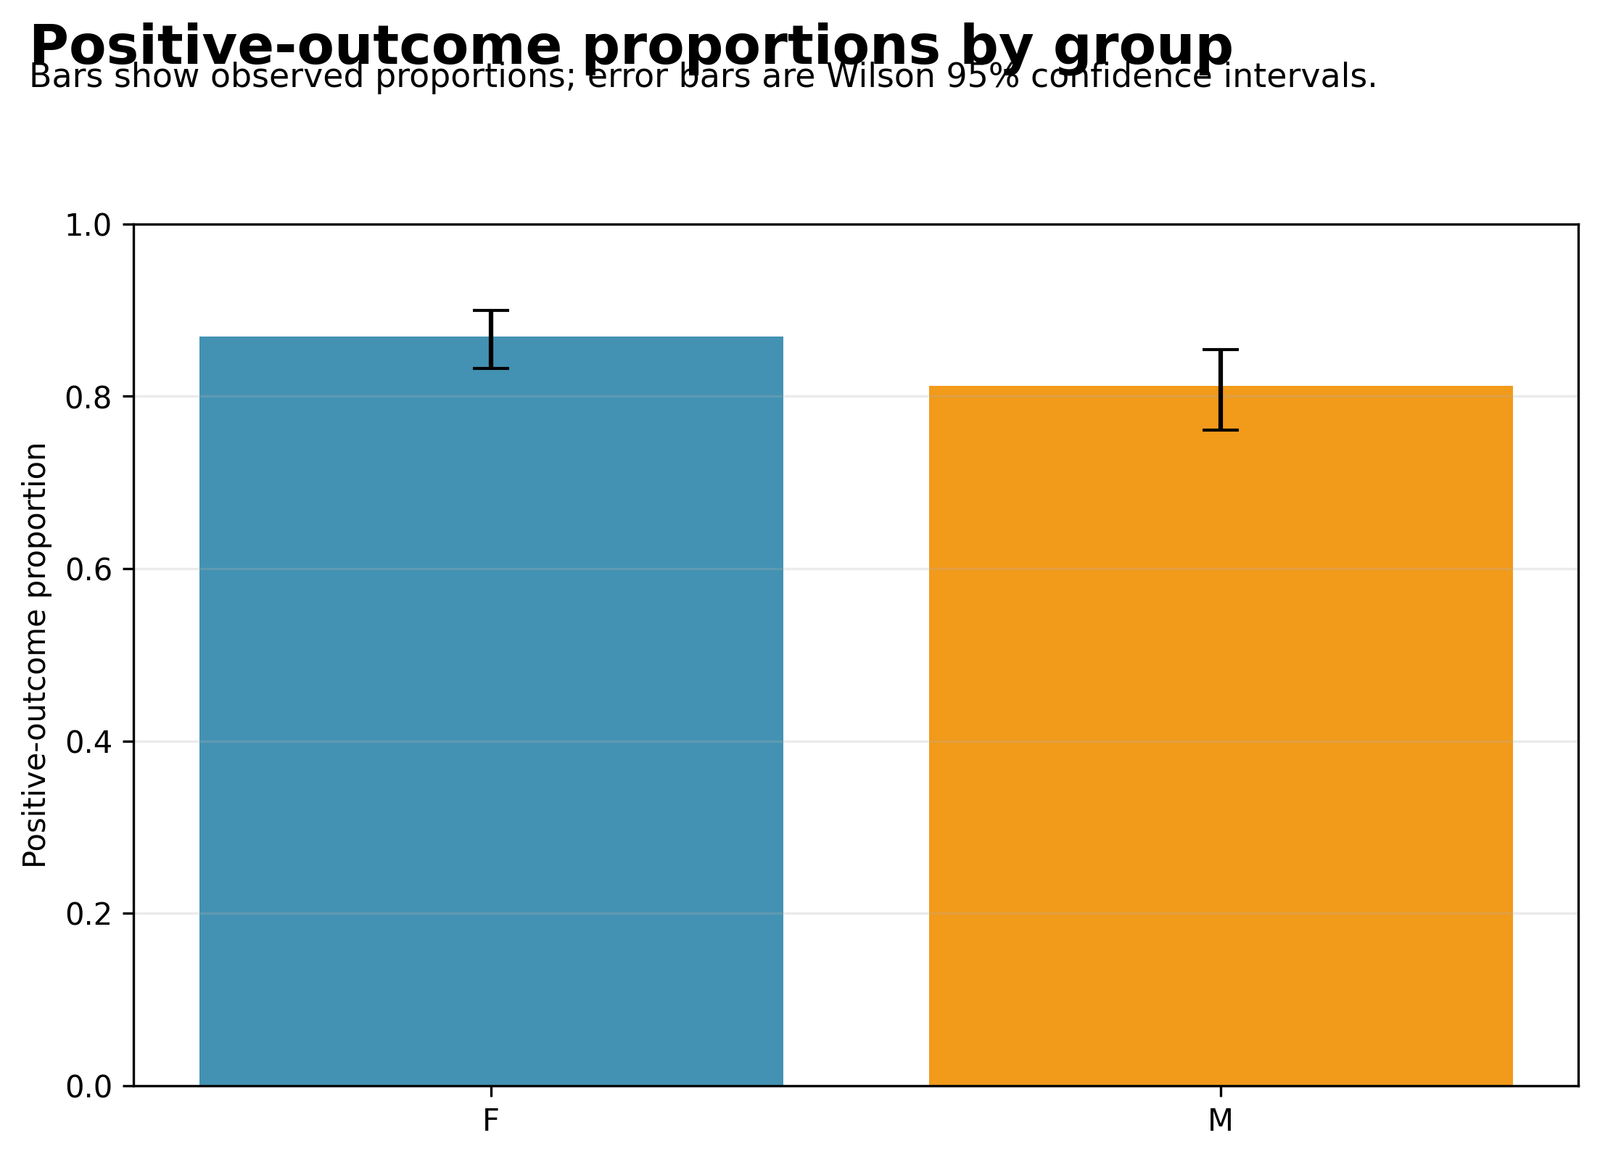
The proportion chart prevents the larger female sample from being mistaken for stronger performance merely because its positive count is larger.
Python Chart 3: Boschloo Test — Exact and Asymptotic P-Value Comparison
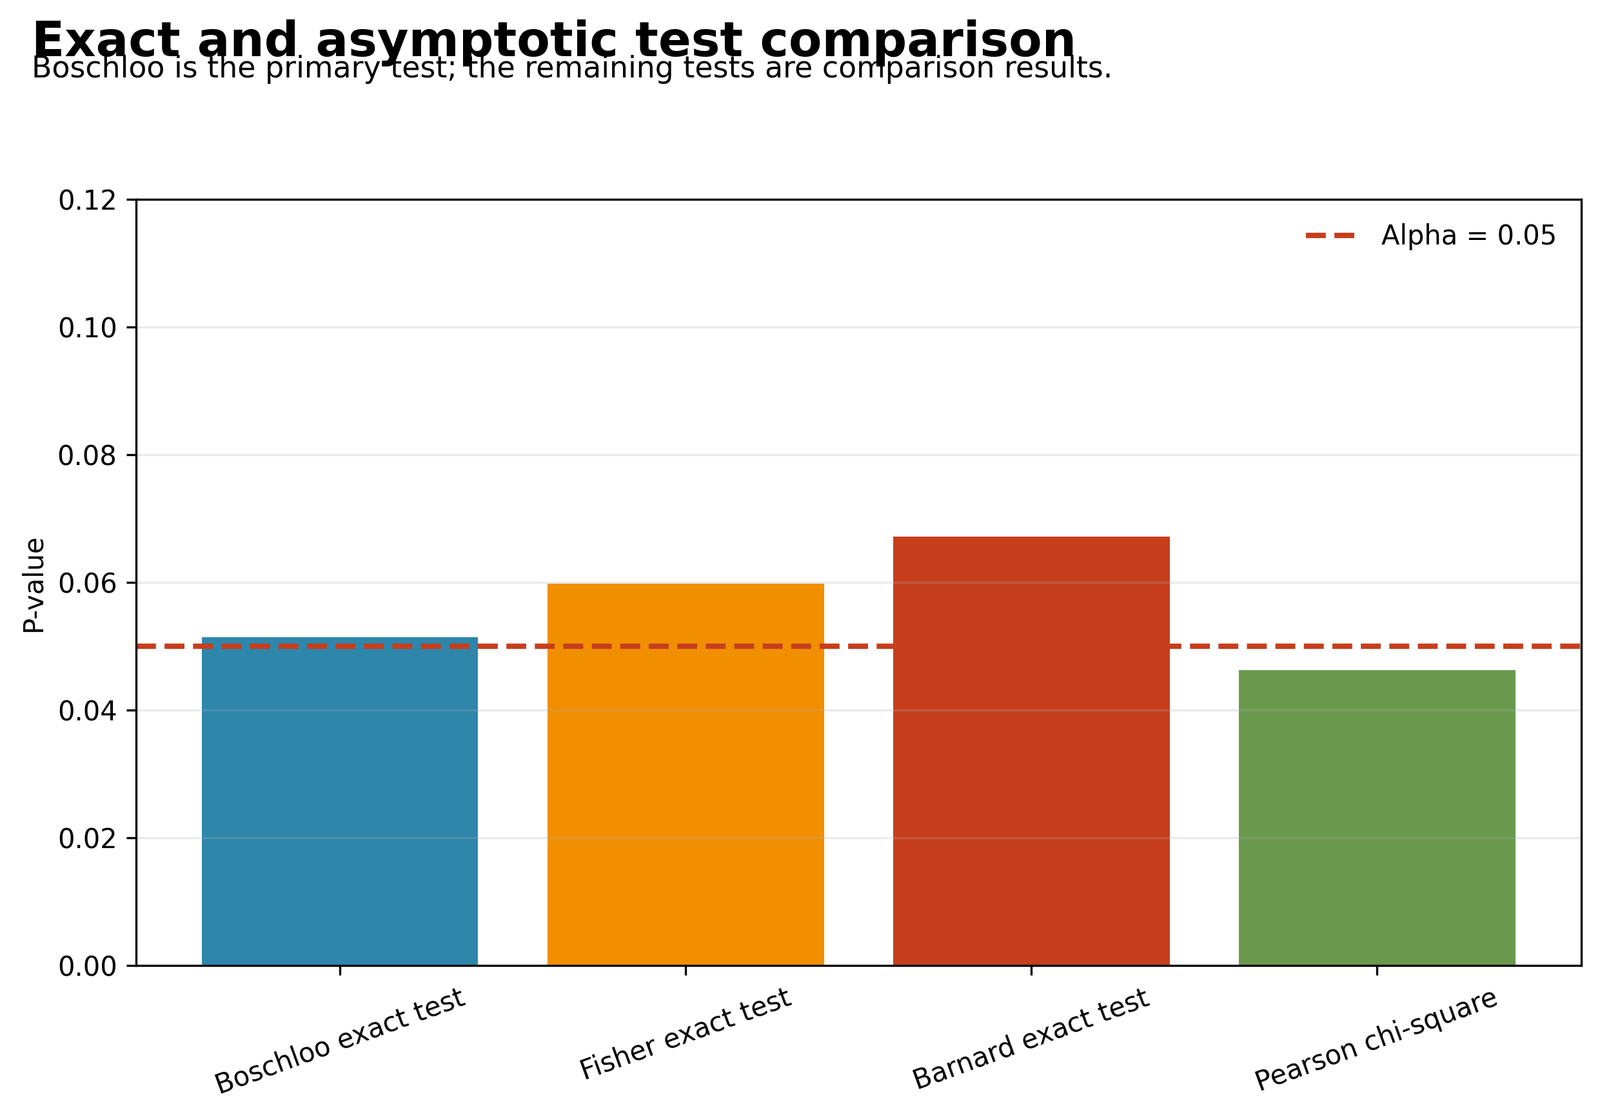
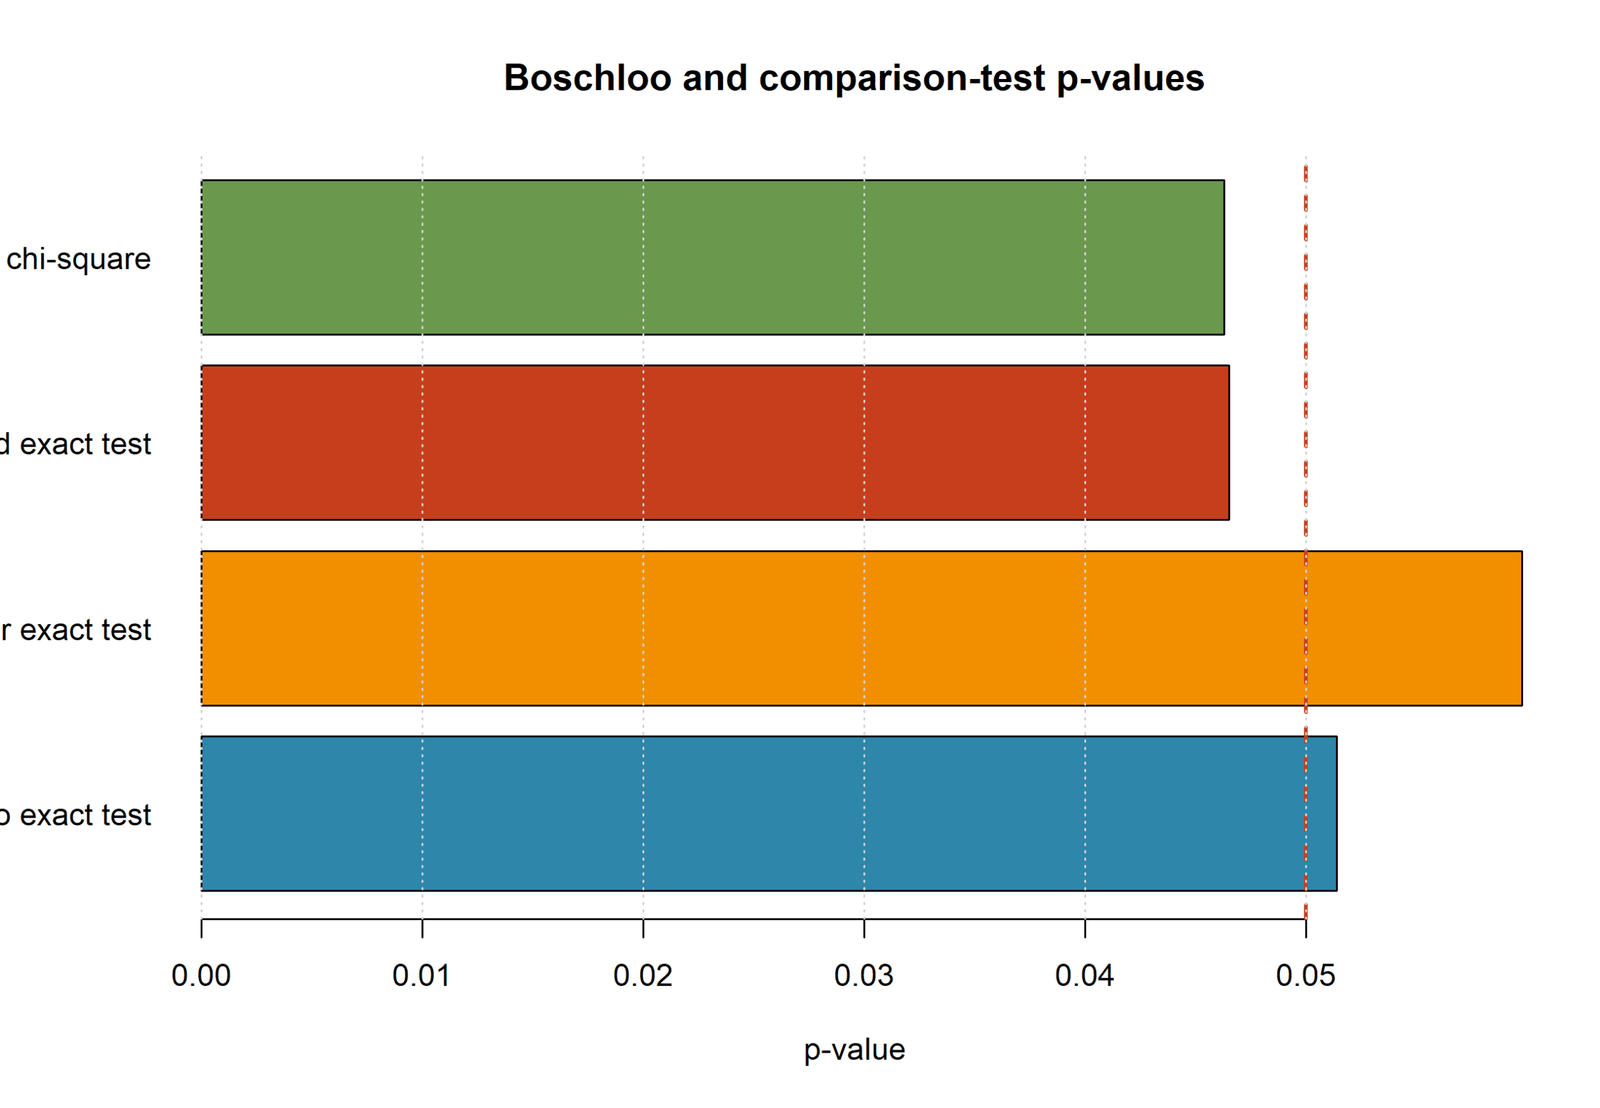
Boschloo Test and Fisher's exact test remain above .05, while the uncorrected Pearson chi-square result falls below the line. The figure demonstrates how a borderline 2 × 2 table can produce different binary decisions under different conditioning and approximation rules.
Boschloo: 0.051387. Fisher: 0.059797. Pearson: 0.046289. Yates: 0.059808.
The comparison does not identify one universally correct p-value. The primary method must be selected from the sampling design and analysis plan. Here, Boschloo Test is the headline procedure, so p = .051 governs the formal two-sided decision.
Choosing whichever method produces the smallest p-value after inspecting the table creates selective reporting. The chart is useful as a sensitivity display, not as a menu for post-hoc test selection.
Python Chart 4: Boschloo Test — Nuisance-Parameter Profile
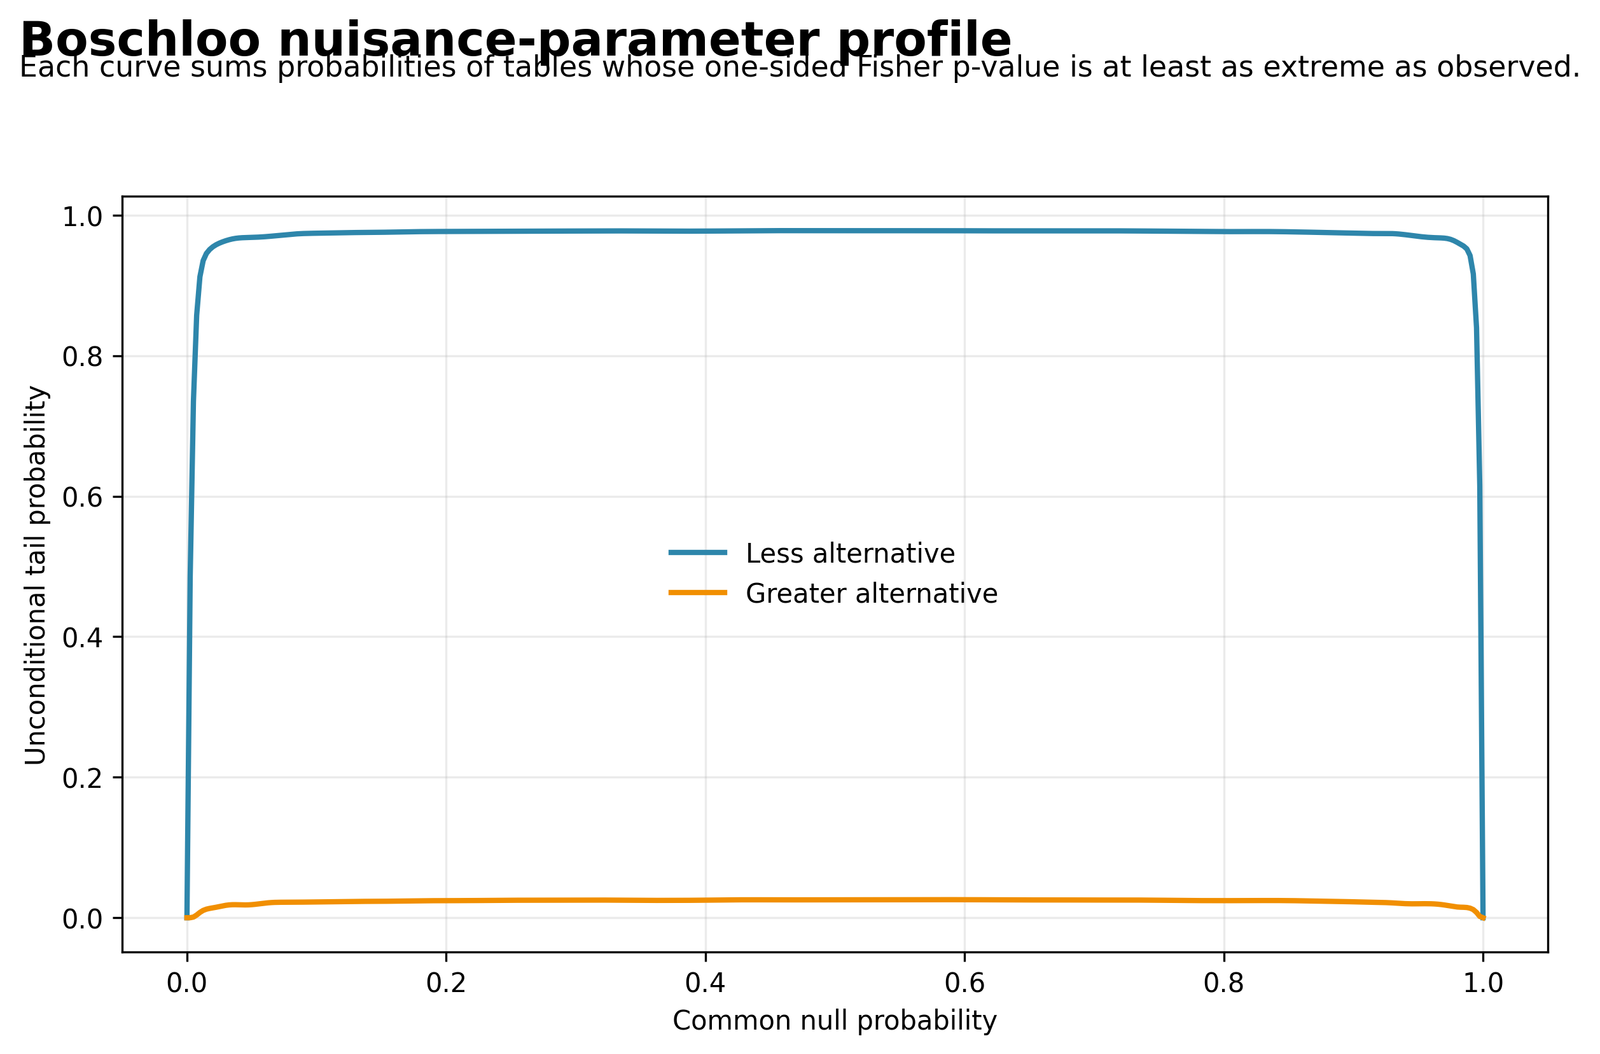
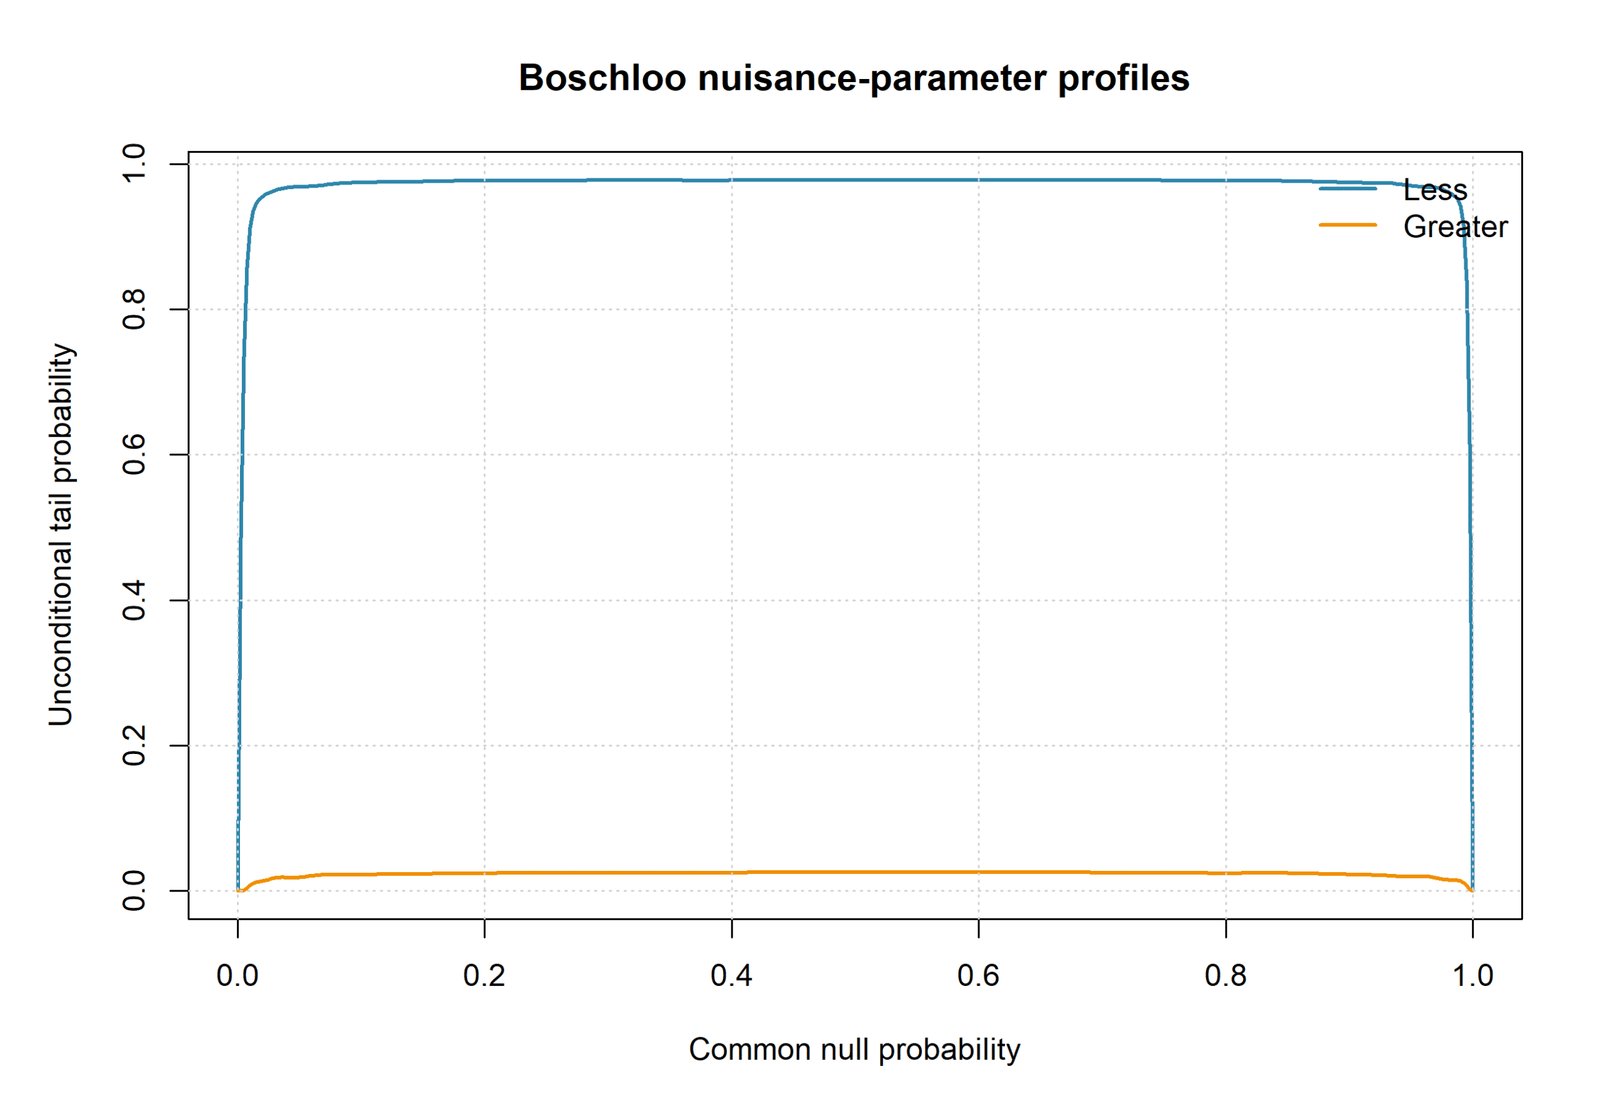
The relevant greater-direction curve rises from the boundaries, reaches an interior maximum and then declines. The opposite-direction curve has a much larger maximum because the observed table is not extreme in that direction.
Greater one-sided maximum: 0.0256936226. Maximizing π: approximately 0.590522. Less one-sided maximum: 0.9779287416.
The directional Boschloo p-value is the highest rejection probability over the entire nuisance-parameter range. It is not the probability evaluated only at the observed pooled proportion or at π = .50.
The profile is the computational heart of the unconditional exact method. A coarse grid can underestimate the supremum and make the test anti-conservative.
Python Chart 5: Boschloo Test — Risk Ratio and Odds Ratio
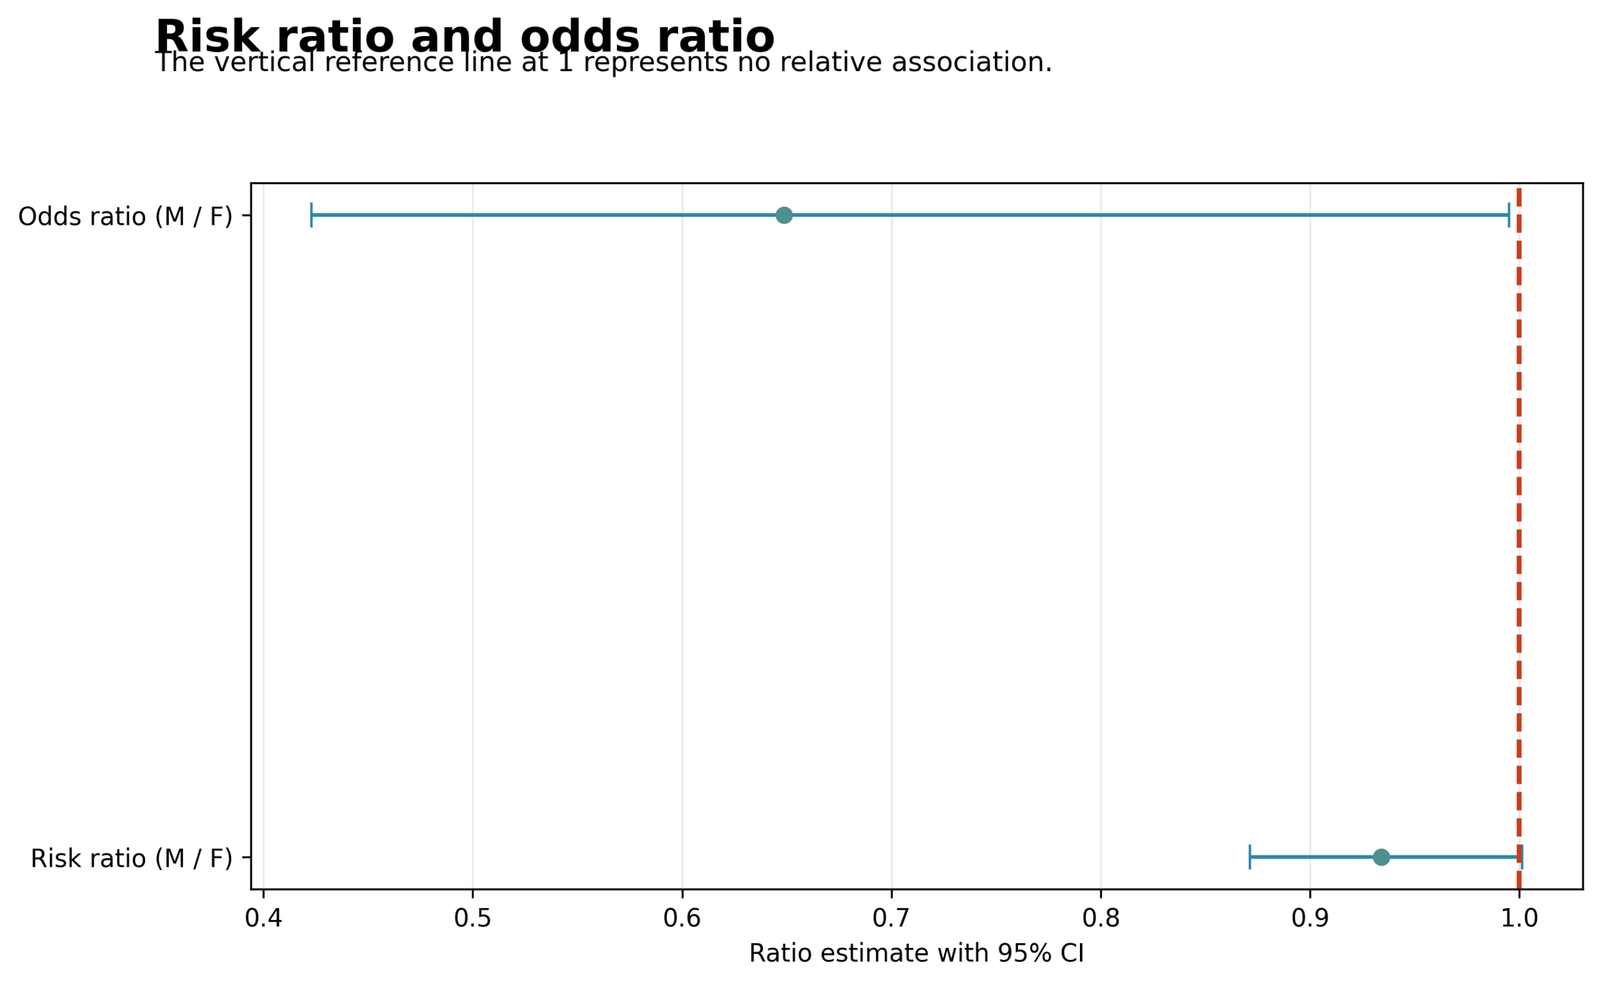
Both point estimates are below 1. The risk ratio stays relatively close to the null because it compares common event probabilities, while the odds ratio sits farther from 1 because odds and probability diverge when the outcome is frequent.
Risk ratio: 0.933957, 95% CI [0.871134, 1.001310]. Odds ratio: 0.648649, 95% CI [0.422898, 0.994909].
The male positive probability is estimated to be about 93.4% of the female probability. The male success odds are estimated to be about 64.9% of the female odds. These statements are not interchangeable.
Relative measures can make a small absolute difference look more dramatic. The risk difference of −5.74 percentage points should be presented first.
Python Chart 6: Boschloo Test — Observed and Expected Counts
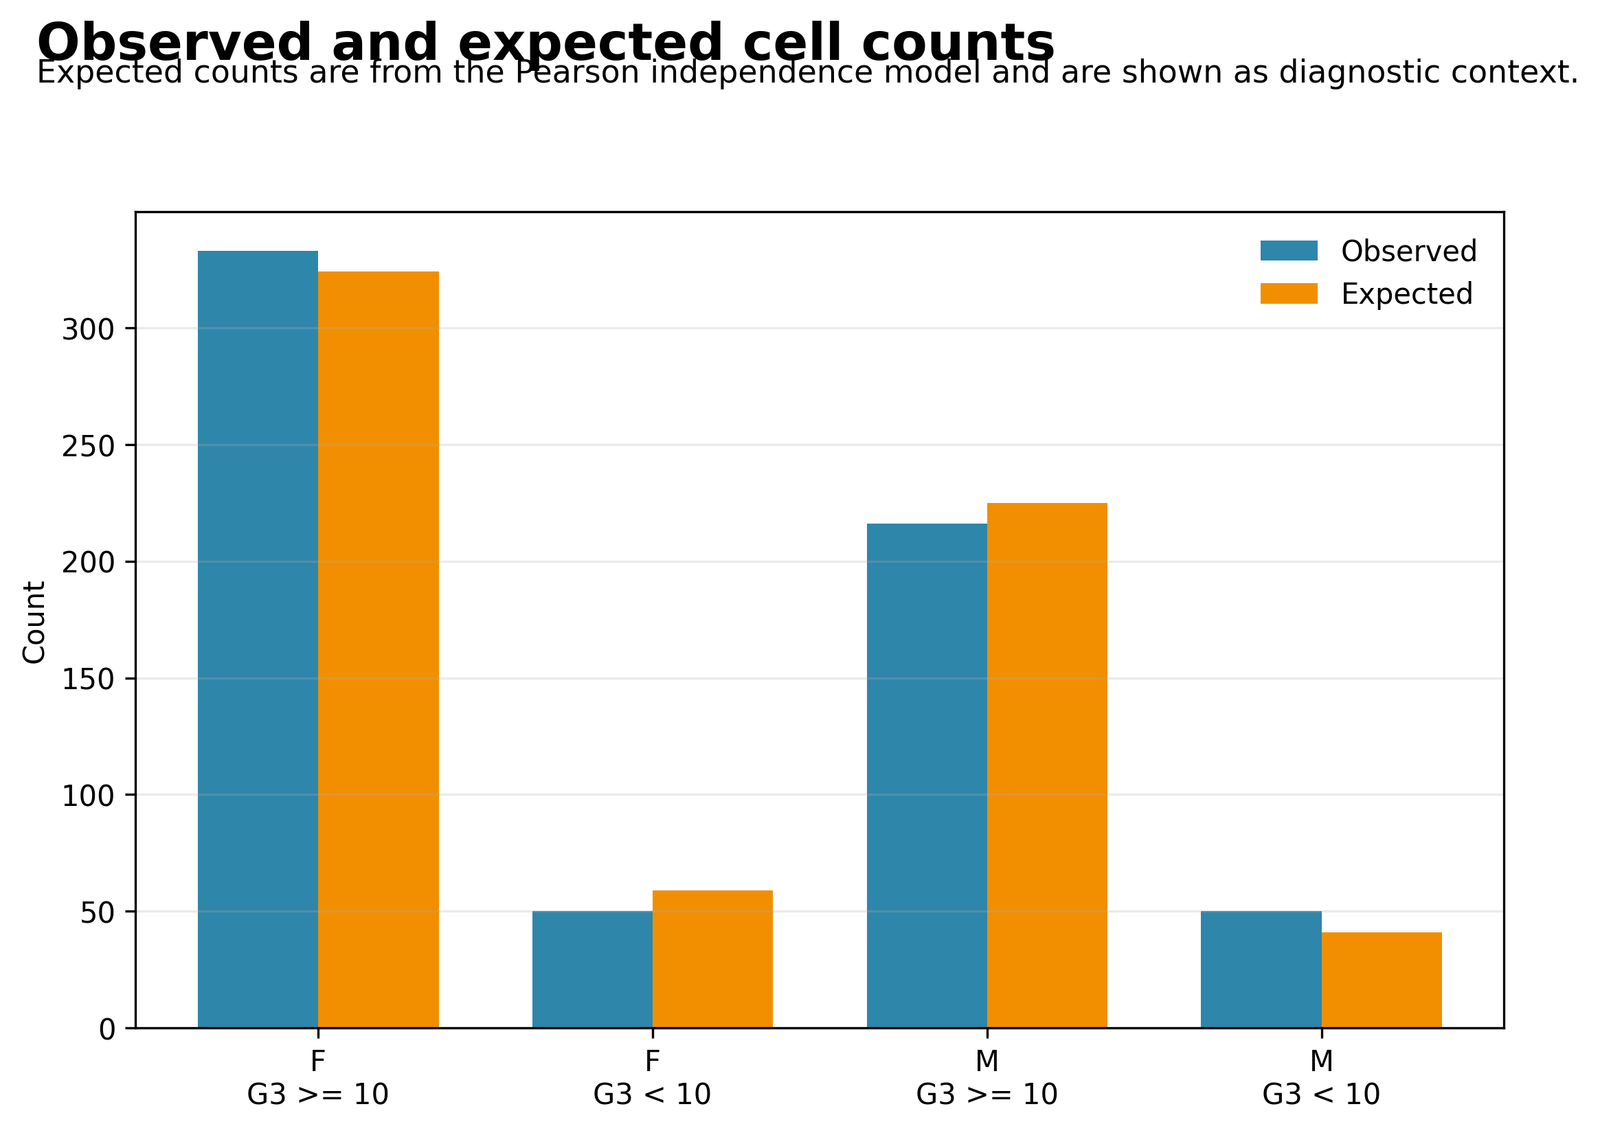
Female positive and male negative counts exceed their independence expectations. Female negative and male positive counts fall below expectation. The deviations are balanced because the margins determine all four expected values.
Expected counts: 323.986, 59.014, 225.014, and 40.986. Each observed-minus-expected deviation has magnitude approximately 9.014.
The deviations produce Pearson χ² = 3.971 and p = .0463. Boschloo Test does not use an expected-count rule, but the chart explains why the asymptotic comparison is close to the significance threshold.
All expected counts are above 40. The difference between Boschloo and Pearson is therefore caused by exact versus asymptotic probability rules, not by sparse expected cells.
Python Chart 7: Boschloo Test — Adjusted Standardized Residuals

The residual pattern is symmetric. Female positive and male negative cells have positive residuals, while female negative and male positive cells have negative residuals. Every cell carries the same absolute adjusted residual because the table has one degree of freedom.
Female positive: 1.992745. Female negative: -1.992745. Male positive: -1.992745. Male negative: 1.992745.
The absolute residual of approximately 1.993 lies close to the common descriptive guideline of 2. The pattern identifies which cells create the association but should not be converted into an independent set of significance tests.
Residuals are diagnostics for table structure. They do not replace Boschloo's Fisher-p ordering, the nuisance search or the unconditional p-value.
Additional R Boschloo Test Charts with Paired Explanations
The R heatmap and adjusted-residual image use the same published files already displayed in Python Charts 1 and 7, so those two images are not duplicated. The five additional R figures below provide distinct validation of percentages, confidence intervals, relative effects, p-value sensitivity and nuisance maximization. Each pair has a dedicated explanation box aligned with its chart.
R Group Outcome Percentages
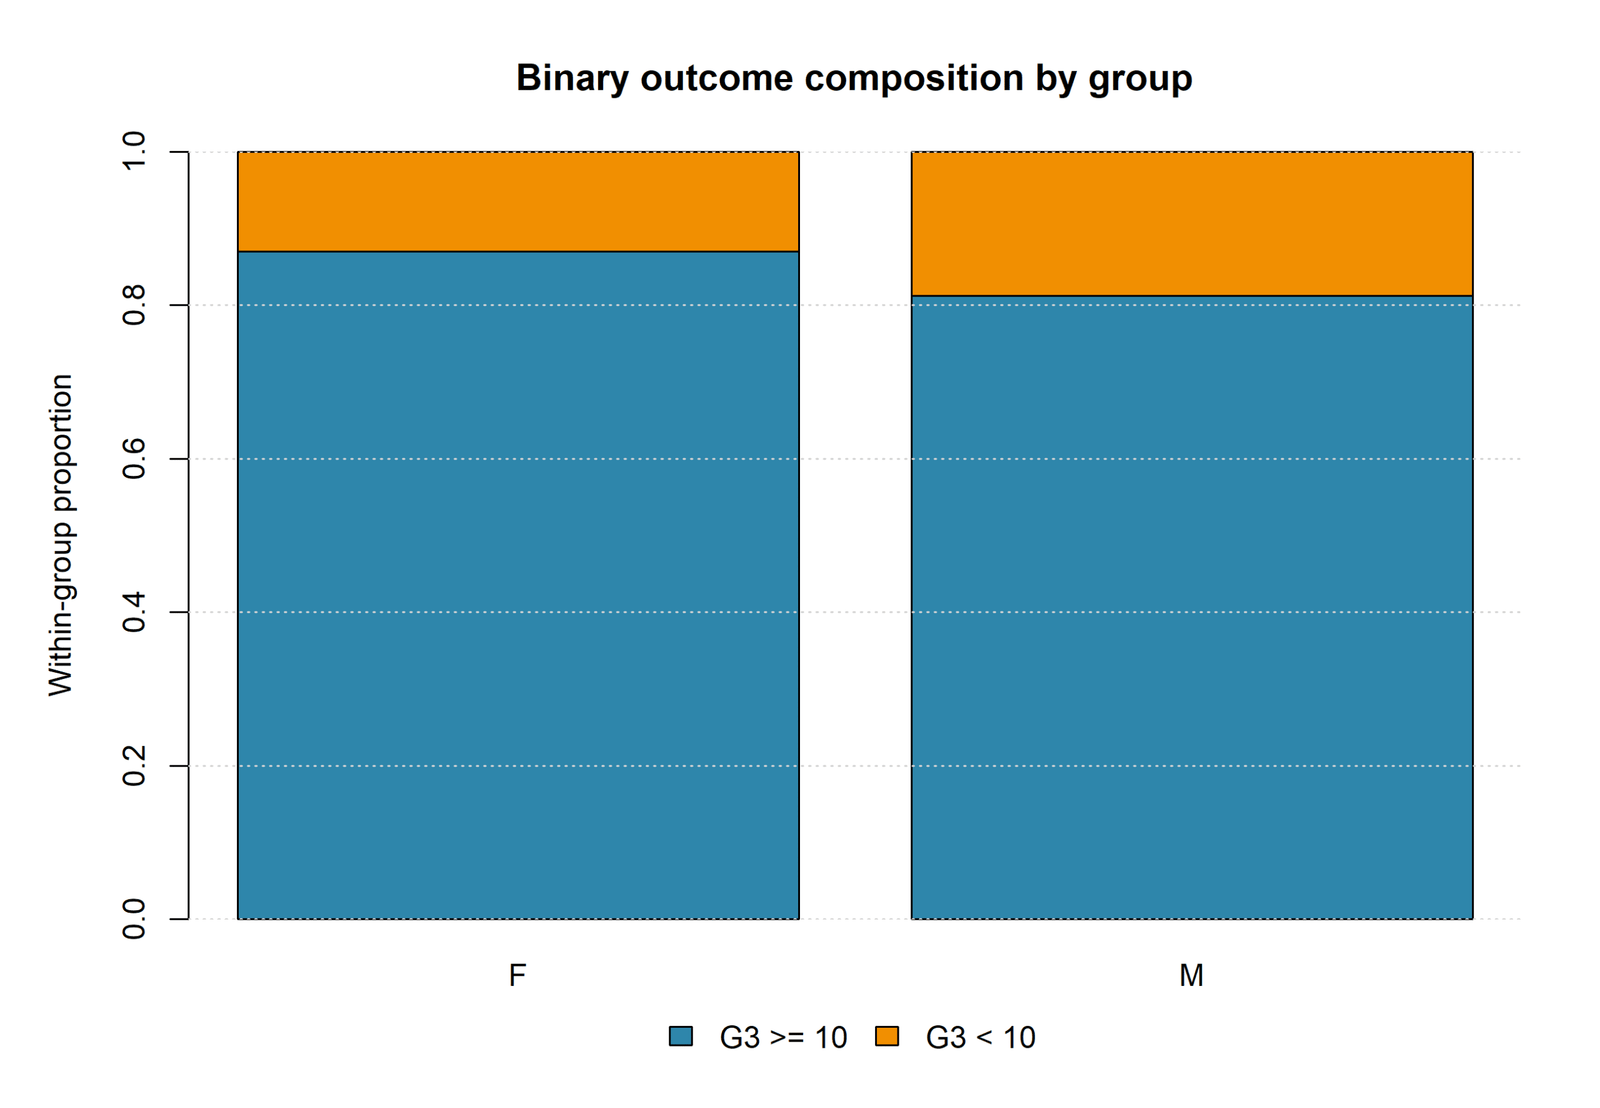
The R percentage chart reproduces 86.95% positive for female students and 81.20% for male students. Negative-outcome rates are 13.05% and 18.80%. Standardizing each bar to 100% confirms that the observed difference is not an artifact of the larger female sample.
R Proportions with Confidence Intervals
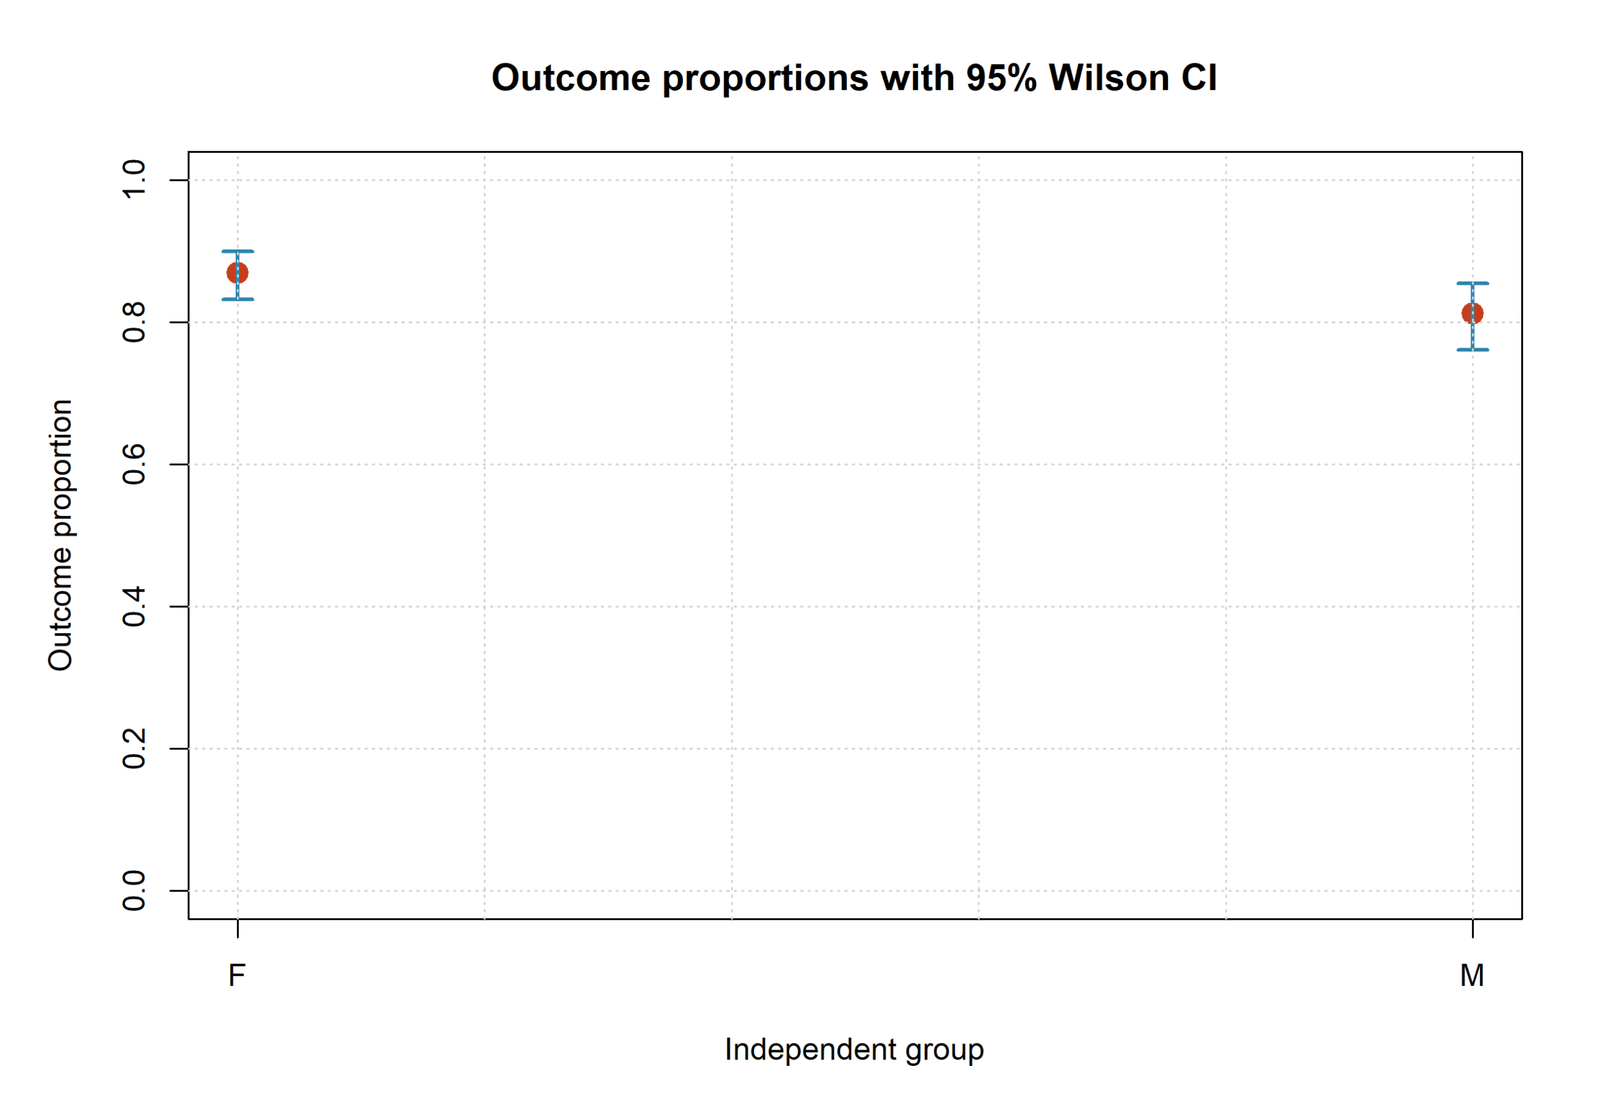
The female estimate is 0.8695, 95% CI [0.8320, 0.8996], and the male estimate is 0.8120, 95% CI [0.7608, 0.8544]. These intervals quantify each group separately and show the plausible range of each population probability.

R Relative Effects
The male/female risk ratio is 0.9340, while the male/female odds ratio is 0.6486. The risk-ratio interval narrowly reaches above 1, whereas the odds-ratio interval narrowly remains below 1. The difference arises from scale and interval construction rather than from different observed counts.
R P-Value Comparison
Boschloo p = 0.0514 and Fisher p = 0.0598 remain above .05. Pearson p = 0.0463 falls below .05, while Yates p = 0.0598 remains above it. The R chart reinforces that method specification matters most when evidence lies near a conventional threshold.
R Nuisance-Parameter Profile
The R profile confirms that the directional unconditional probability is maximized at an interior nuisance value rather than at an arbitrary fixed probability. The relevant maximum is approximately .025694, and doubling that smaller directional value gives the reported two-sided result of approximately .051387. The profile also makes clear why a reliable implementation needs a sufficiently fine numerical search.
Boschloo Test Assumptions and Diagnostics
Data Conditions
- Two independent groups
- One binary outcome
- One record per observational unit
- Independent Bernoulli responses
- Fixed or treated-as-fixed group sizes
- Correct group and event coding
Analysis Specifications
- Prespecified alternative hypothesis
- Declared two-sided convention
- One-sided Fisher-p ordering
- Global nuisance maximization
- Adequate numerical resolution
- Named software and version
Independence of observations
Each student should contribute one outcome to one group. Exact probability calculations do not correct for repeated measurements, matched observations, family clustering, classroom clustering or school-level dependence. If observations are correlated, the double-binomial probability model may understate uncertainty and a paired or cluster-aware method is required.
Fixed group sizes and nonfixed outcome totals
The two binomial sample sizes are 383 and 266. Boschloo Test allows the positive counts in both groups to vary under repeated samples and does not condition on the observed combined positive total of 549. If both margins were deliberately fixed by design, Fisher's conditional exact test has a more direct sampling interpretation.
Correct table orientation
Some software functions treat columns as the two binomial experiments, while conventional printed tables often place groups in rows. A correct implementation must use sample totals 383 and 266. A transposed table that instead treats the positive and negative totals as the samples changes the null sample space and can produce a misleading p-value.
Binary outcome definition
The positive outcome is G3 ≥ 10. The label “positive” is a coding choice, not a judgment of value. Reversing the outcome definition changes directional statistics and effect measures. The event category must be stated before the table is analysed so that the direction of every estimate is reproducible.
Two-sided convention
Discrete exact procedures do not have one universal two-sided definition. This article uses twice the smaller one-sided Boschloo p-value, clipped at 1. R packages can also provide central or minimum-likelihood conventions. When software packages use different rules, their p-values should not be expected to match exactly.
Nuisance-parameter optimization
The unconditional rejection probability changes across the common null probability π and can contain more than one local feature. A coarse grid can miss the supremum and report a p-value that is too small. Reliable software uses refined grids, global optimization or validated quasi-Monte Carlo sampling and checks stability as resolution increases.
Expected counts and exactness
Boschloo Test does not require expected counts above 5. In this table, the minimum expected count exceeds 40, so Pearson's chi-square approximation is numerically plausible. The exact procedure remains valid without relying on the approximation, and the cross-method difference comes from the reference rule rather than from sparse expected cells.
Effect intervals and the exact p-value
The risk-difference, risk-ratio and odds-ratio intervals shown in this post are conventional effect intervals. They are not exact inversions of the primary Boschloo Test. Consequently, one interval can touch or cross its null value at a slightly different boundary from the exact p-value. The interval construction should be named in formal reporting.
Dichotomization of G3
G3 is originally measured on a 0–19 scale. Converting it to G3 ≥ 10 versus G3 < 10 discards distance information: a grade of 10 and a grade of 19 receive the same binary code. The threshold should have a substantive interpretation, and a complete study can supplement the binary comparison with an analysis of the original quantitative grade.
Confounding and adjustment
The 2 × 2 table is unadjusted. School, prior grades, study time, failures, absences and other characteristics can be related to both sex and the outcome. Boschloo Test describes a marginal association; it does not remove confounding. Use Binary Logistic Regression when conditional or adjusted comparisons are required.
Multiple thresholds and subgroup analyses
Trying many G3 cutpoints or many subgroup tables and reporting only the smallest p-value inflates the chance of a false-positive conclusion. The primary outcome threshold, group comparison and alternative should be selected before analysis, or a multiplicity adjustment should be incorporated into the study plan.
Representativeness and causal claims
An exact p-value is exact for the stated probability model, not for every population claim. Generalization depends on how students entered the dataset, and causal conclusions require a suitable design. The current result should be described as an unadjusted association between sex and the G3 threshold outcome.
Boschloo Test in Python, R, SPSS and Excel
Python Boschloo Test Workflow
Python provides a direct exact procedure through SciPy. The array must contain nonnegative integer counts, and the two binomial samples are placed in columns.
- Construct the table as [[333, 216], [50, 50]].
- Select
alternative="two-sided"for the primary analysis. - Increase the numerical sampling setting to verify stability.
- Read the returned statistic as the Fisher-p ordering value.
- Calculate effect estimates and intervals separately.
Expected result: statistic = 0.0304927910; p = 0.0513872452.
Boschloo Test R Workflow
R packages for exact 2 × 2 inference can calculate Boschloo-related unconditional tests and offer several two-sided conventions. The package, alternative, mid-p setting and two-sided rule must be stated.
- Enter x1 = 333, n1 = 383, x2 = 216, n2 = 266.
- Run greater and less one-sided versions when reproducing the doubled-tail convention.
- Keep
midp = FALSEfor the full exact procedure. - Distinguish central, minimum-likelihood and doubled one-sided results.
- Save the printed call and package version with the report.
Boschloo Test in SPSS
SPSS CROSSTABS supplies the observed table, row and column percentages, expected counts, standardized residuals, Fisher's exact test, chi-square comparisons, risk estimates and association measures. Boschloo Test itself can be added through a validated embedded-Python calculation.
- Create a numeric two-level group variable.
- Create a binary G3 ≥ 10 outcome variable.
- Verify that the displayed counts are 333, 50, 216 and 50.
- Request risk estimates, Fisher, chi-square and residual output.
- Run the exact unconditional calculation without relabelling ordinary Fisher output.
The downloadable SPSS output includes a pure Python standard-library Boschloo calculation and reports statistic = 0.0304927910, p = 0.0513872452.
Boschloo Test in Excel
Excel has no single built-in Boschloo function, but a transparent workbook can reproduce the test through table enumeration. The calculation needs hypergeometric Fisher ordering values and double-binomial probabilities over a nuisance grid.
- Enter the four observed counts and calculate the two group totals.
- Enumerate all 102,528 possible positive-count pairs.
- Calculate a one-sided Fisher p-value for every possible table.
- Flag tables at least as extreme as the observed Fisher-p statistic.
- Maximize the summed joint binomial probability across π.
The workbook should document its nuisance-grid resolution and two-sided rule so that the result can be checked in Python or R.
Cross-Software Reporting Standard
| Element | Value to preserve | Why it matters |
|---|---|---|
| Observed table | Female [333, 50]; Male [216, 50] | Defines the complete data input. |
| Positive event | G3 ≥ 10 | Determines direction and effect estimates. |
| Alternative | Two-sided | Controls which tables count as extreme. |
| Fisher-p statistic | 0.0304927910 | Orders possible 2 × 2 tables. |
| Greater one-sided p | 0.0256936226 | Smaller directional Boschloo result. |
| Two-sided convention | Twice the smaller one-sided p-value | Explains the final p-value definition. |
| Two-sided Boschloo p | 0.0513872452 | Primary inferential result. |
| Decision | Fail to reject at α = .05 | Formal conclusion under the selected rule. |
Expandable Boschloo Test Code
Python: SciPy Boschloo Test
import numpy as np
from scipy.stats import boschloo_exact

# Rows are outcomes; columns are the two independent samples.
table = np.array([
    [333, 216],  # G3 >= 10
    [50, 50],  # G3 < 10
], dtype=int)

two_sided = boschloo_exact(
    table,
    alternative="two-sided",
    n=4096,
)

greater = boschloo_exact(
    table,
    alternative="greater",
    n=4096,
)

less = boschloo_exact(
    table,
    alternative="less",
    n=4096,
)

print("Fisher-p ordering statistic:", two_sided.statistic)
print("Two-sided Boschloo p-value:", two_sided.pvalue)
print("Greater one-sided p-value:", greater.pvalue)
print("Less one-sided p-value:", less.pvalue)
Python: proportions, effect estimates and comparison tests
import math
import numpy as np
from scipy import stats

table_groups = np.array([
    [333, 50],  # Female
    [216, 50],  # Male
], dtype=int)

p_female = 333 / 383
p_male = 216 / 266

risk_difference = p_male - p_female
risk_ratio = p_male / p_female
odds_ratio = (216 / 50) / (333 / 50)

fisher = stats.fisher_exact(table_groups, alternative="two-sided")
pearson = stats.chi2_contingency(table_groups, correction=False)
yates = stats.chi2_contingency(table_groups, correction=True)

print("Female proportion:", p_female)
print("Male proportion:", p_male)
print("Risk difference M-F:", risk_difference)
print("Risk ratio M/F:", risk_ratio)
print("Odds ratio M/F:", odds_ratio)
print("Fisher p:", fisher.pvalue)
print("Pearson p:", pearson.pvalue)
print("Yates p:", yates.pvalue)
R: reproduce the doubled one-sided Boschloo convention
# install.packages("exact2x2")
library(exact2x2)

greater_result <- boschloo(
  x1 = 333, n1 = 383,
  x2 = 216, n2 = 266,
  alternative = "greater",
  midp = FALSE
)

less_result <- boschloo(
  x1 = 333, n1 = 383,
  x2 = 216, n2 = 266,
  alternative = "less",
  midp = FALSE
)

two_sided_p <- min(
  1,
  2 * min(greater_result$p.value, less_result$p.value)
)

print(greater_result)
print(less_result)
cat("Two-sided Boschloo p-value:", two_sided_p, "\n")
R packages may also provide central or minimum-likelihood two-sided methods. The selected method must be named whenever results are compared across software.
SPSS: prepare the 2 × 2 table and comparison output
* Create the binary outcome.
COMPUTE boschloo_outcome = (G3 >= 10).
VALUE LABELS boschloo_outcome
  0 "G3 below 10"
  1 "G3 at least 10".

* Create the independent two-level group.
RECODE sex ("F"=0) ("M"=1) INTO boschloo_group.
VALUE LABELS boschloo_group
  0 "Female"
  1 "Male".
EXECUTE.

CROSSTABS
  /TABLES=boschloo_group BY boschloo_outcome
  /FORMAT=AVALUE TABLES
  /STATISTICS=CHISQ RISK PHI
  /CELLS=COUNT ROW COLUMN EXPECTED RESID SRESID
  /COUNT ROUND CELL.

* Add the Boschloo exact calculation through validated
* embedded Python. Ordinary Fisher output is not Boschloo.
Excel: exact enumeration and nuisance-profile structure
Observed inputs
B4 = 333   Female positive
C4 = 50   Female negative
B5 = 216   Male positive
C5 = 50   Male negative

For every possible positive-count pair (x1, x2):

1. Calculate the one-sided Fisher p-value with HYPGEOM.DIST.
2. Flag a table when Fisher p <= observed Fisher statistic.
3. For each nuisance probability p, calculate:
   BINOM.DIST(x1,n1,p,FALSE) *
   BINOM.DIST(x2,n2,p,FALSE)
4. Sum joint probabilities for flagged tables.
5. Take the maximum across the nuisance grid.
6. Repeat for both directions.
7. Return:
   MIN(1, 2*MIN(less maximum, greater maximum))

Validation target
Observed Fisher-p statistic = 0.0304927910
Greater one-sided Boschloo p = 0.0256936226
Two-sided Boschloo p = 0.0513872452
Advanced Boschloo Test Topics
Why Boschloo Test can outperform Fisher's exact test
Fisher's exact test conditions on the observed outcome total and evaluates a hypergeometric sample space. Boschloo Test uses the one-sided Fisher p-value only as an ordering statistic, then calibrates the rejection region with the unconditional double-binomial model. This construction retains exact size control while often reducing the conservatism caused by fixed-margin conditioning.
Central versus minimum-likelihood two-sided methods
Discrete exact procedures require a definition of two-sided extremeness. A central method combines directional tails, while a minimum-likelihood method includes tables whose probability or ordering statistic is no greater than the observed table's value. R packages can offer both options. Results should be compared only after confirming that the same convention is used.
Doubled one-sided Boschloo Test
The primary result in this article is twice the smaller one-sided Boschloo p-value, clipped at 1. The greater-direction probability is .025694, so the reported two-sided result is .051387. This definition is simple and reproducible, but it is not the only possible two-sided convention in discrete exact inference.
Mid-p Boschloo Test
A mid-p calculation reduces the contribution of the observed table, commonly by subtracting half its probability from a conventional exact tail. Mid-p values can be less conservative and more powerful, but they do not provide the same finite-sample size guarantee as the full exact procedure. A mid-p result should be clearly labelled and not mixed with the exact p-value reported here.
Boschloo Berger-Boos Test R searches
The search phrase boschloo berger boos test r combines two related but distinct unconditional strategies. Boschloo Test orders possible tables through Fisher p-values. A Berger-Boos procedure restricts nuisance maximization to a confidence set and adds a small adjustment parameter. R's exact 2 × 2 frameworks can provide both ideas, but they should not be treated as interchangeable names.
Confidence intervals associated with unconditional tests
An exact p-value does not automatically provide a matching interval for the risk difference, risk ratio or odds ratio. Unconditional exact frameworks can invert tests to construct intervals, but the target parameter, ordering and nuisance treatment must be specified. The intervals displayed in this article are effect-estimation intervals and are not claimed to be exact Boschloo inversions.
Nuisance optimization and numerical stability
The nuisance profile may contain interior peaks or flat regions. Reporting a maximum from a coarse grid without checking nearby values can underestimate the true supremum. A defensible workflow increases the number of sampling points, checks the stability of the p-value and records the numerical controls used by the software.
Zero cells and infinite effect estimates
Boschloo Test can analyse a table containing a zero cell because the exact probabilities remain defined. Ordinary odds ratios or risk ratios can become zero or infinite, and log-based confidence intervals may fail. Use a stated exact interval or a disclosed continuity correction for effect estimation rather than silently adding an arbitrary constant.
Unequal group sizes
Equal sample sizes are not required. The current totals are 383 and 266. The double-binomial model uses each denominator separately, so unequal allocation changes precision and power but does not invalidate the exact test. Sample-size planning should account for the intended allocation ratio.
Power and sample-size planning
Power depends on both sample sizes, the baseline probability, the true group difference, alpha, the alternative direction and the exact ordering rule. Exact power is calculated by summing alternative-distribution probabilities over the rejection region. See Statistical Power before selecting a sample size for a new study.
Relation to the two-proportion z-test
The Two-Proportion Z-Test standardizes the observed proportion difference and uses a normal reference distribution. Boschloo Test uses the finite double-binomial sample space. With large samples and probabilities away from boundaries, both methods may give similar conclusions, but the exact and asymptotic p-values are not mathematically identical.
Relation to logistic regression
A one-predictor logistic regression estimates a group odds ratio and can be extended with covariates, interactions and cluster terms. Boschloo Test provides an unadjusted exact comparison without a regression equation. Use Logistic Regression when explanation, adjustment or prediction is the research goal.
Equivalence and evidence of no meaningful difference
A nonsignificant Boschloo Test does not demonstrate that the two probabilities are practically equivalent. Equivalence requires a prespecified margin and an analysis designed to show that the entire plausible difference lies within that margin. The current risk-difference interval permits both a moderate female advantage and a value close to zero.
Multiple testing and selective thresholds
If several outcome cutpoints, group definitions or exact methods are tried, the chance of obtaining at least one favourable result increases. A transparent analysis defines the primary outcome and exact procedure before inspecting results and labels any additional calculations as sensitivity or exploratory analyses.
APA Reporting for Boschloo Test
APA reporting should make the design and exact procedure reproducible. Include the two independent groups, event definition, four observed counts, both proportions, alternative, Fisher-p ordering statistic, unconditional p-value, effect estimate, confidence interval method and a noncausal interpretation. Because the result is close to .05, retain three decimal places for the p-value rather than rounding it to .05.
Full APA-Style Result for the Worked Example
Female students reached G3 ≥ 10 in 333 of 383 cases (86.95%), compared with 216 of 266 male students (81.20%). A two-sided Boschloo unconditional exact test did not provide sufficient evidence that the two positive-outcome probabilities differed, Fisher-p ordering statistic = 0.0305, p = .051. The male-minus-female risk difference was -0.057, 95% CI [-0.115, 0.000], and Cramer's V was 0.078. The result represents a small unadjusted association and does not establish a causal effect.
Concise APA-Style Result
The G3 ≥ 10 proportions were 86.95% for female students and 81.20% for male students; Boschloo Test gave p = .051, risk difference = -0.057, Cramer's V = 0.078.
APA-Style Methods Sentence
A two-sided Boschloo unconditional exact test compared two independent binomial proportions. A one-sided Fisher exact p-value was used as the ordering statistic, and the final p-value was defined as twice the smaller one-sided unconditional p-value.
APA-Style Results Table
| Measure | Complete value | APA presentation |
|---|---|---|
| Female positive outcome | 333/383 = 0.869451697 | 333/383 (86.95%) |
| Male positive outcome | 216/266 = 0.812030075 | 216/266 (81.20%) |
| Fisher-p ordering statistic | 0.0304927910 | .0305 |
| Two-sided Boschloo p-value | 0.0513872452 | .051 |
| Risk difference, M − F | -0.057421622 | −.057 |
| Risk ratio, M/F | 0.933956513 | .934 |
| Odds ratio, M/F | 0.648648649 | .649 |
| Cramer's V | 0.078222103 | .078 |
Reusable APA Templates for Boschloo Test
Nonsignificant Two-Sided Boschloo Test
Group 1 had x₁/n₁ positive outcomes (p₁%), and Group 2 had x₂/n₂ (p₂%).
A two-sided Boschloo Test was not statistically significant, Fisher-p statistic = statistic, p = p-value.
The risk difference was estimate, 95% CI [lower, upper]. The analysis did not provide sufficient evidence of a difference; it did not prove equal probabilities.
Use when the prespecified two-sided p-value is at or above the selected alpha level.
Significant Two-Sided Boschloo Test
The positive-outcome proportion was p₁% in Group 1 and p₂% in Group 2.
A two-sided Boschloo Test indicated that the probabilities differed, Fisher-p statistic = statistic, p = p-value.
The absolute proportion difference was estimate percentage points, 95% CI [lower, upper], indicating a contextual effect description.
Describe the observed magnitude and uncertainty; do not use the p-value as an effect-size label.
Prespecified Directional Boschloo Test
A one-sided Boschloo Test evaluated the prespecified hypothesis that Group 1 had a higher/lower positive-outcome probability than Group 2.
The directional result was statistically significant / not statistically significant, Fisher-p statistic = statistic, p = p-value.
The observed proportions were p₁% and p₂%, with a directional risk difference of estimate.
Use one-sided wording only when the direction was selected before the table was examined.
APA Rounding and Interpretation Language
| Avoid | Use instead | Reason |
|---|---|---|
| The groups were equal. | The test did not detect sufficient evidence of a difference. | Nonsignificance is not evidence of exact equality. |
| p = .05 | p = .051 | A borderline exact p-value needs adequate precision. |
| Boschloo statistic = .051 | Fisher-p statistic = .0305; Boschloo p = .051 | The ordering statistic and unconditional p-value are different quantities. |
| The effect was unimportant because p > .05. | The observed difference was 5.74 percentage points and Cramer's V was .078. | Magnitude and statistical evidence answer different questions. |
| Boschloo proved there was no sex effect. | The unadjusted exact test did not cross the .05 threshold. | The study is observational and the table is unadjusted. |
Common Boschloo Test Mistakes and How to Correct Them
| Common mistake | Why it is a problem | Correct approach |
|---|---|---|
| Using Boschloo Test for a 2 × 4 table | The standard procedure is defined for 2 × 2 tables. | Use a larger-table exact method, multinomial model or scientifically justified recoding. |
| Calling the Fisher-p statistic the Boschloo p-value | The statistic only orders tables; the final p-value is an unconditional maximum. | Report the statistic and p-value separately. |
| Ignoring the two-sided convention | Central, minimum-likelihood and doubled one-sided rules can differ. | Name the convention in the methods and results. |
| Passing the table in the wrong orientation | The software may treat the outcome totals as sample sizes. | Verify that the binomial sample totals are 383 and 266. |
| Choosing a one-sided alternative after viewing the proportions | This increases false-positive risk. | Prespecify the direction before analysing the table. |
| Relabelling Fisher's exact output as Boschloo Test | Conditional and unconditional calculations are not the same. | Identify every exact procedure accurately. |
| Reporting only a p-value | The observed magnitude and uncertainty remain unknown. | Report both proportions, risk difference and confidence intervals. |
| Confusing odds ratio with risk ratio | The outcome is common, so odds and probability differ substantially. | Lead with the absolute risk difference and define every ratio direction. |
| Interpreting nonsignificance as equality | Failure to reject does not establish identical probabilities. | Interpret the confidence interval and consider equivalence methods when needed. |
| Claiming causation from the 2 × 2 table | The comparison is observational and unadjusted. | Use association language and discuss possible confounding. |
| Switching to a comparison method that crosses .05 | This is post-hoc method selection. | Retain the prespecified primary procedure. |
| Ignoring the original G3 scale | Dichotomization discards grade information. | Justify the threshold and consider analysis of the quantitative outcome. |
Boschloo Test Reports and Worked Excel Download
R Boschloo Test ReportR exact-test output, five additional validation figures and effect estimates.
SPSS Boschloo Test OutputCrosstabs, comparison tests, risk estimates and embedded pure-Python calculation.
Worked Boschloo Test Excel WorkbookEditable counts, Fisher ordering, table enumeration, nuisance profile and reporting formulas.
Frequently Asked Questions About Boschloo Test
The Boschloo Test questions below address the statistic, assumptions, two-sided convention, R workflow, Berger-Boos searches, calculator logic, effect sizes and APA reporting without repeating the complete worked sections above.
What is Boschloo Test?
Boschloo Test is an exact unconditional procedure for comparing two independent binary-outcome probabilities in a 2 × 2 table.
What is Boschloo's Test statistic?
The statistic is a one-sided Fisher exact p-value used to order all possible tables in the fixed-sample-size space.
What is the null hypothesis?
The null states that the two groups have the same positive-outcome probability.
What is the Boschloo p-value in this example?
The two-sided unconditional p-value is 0.0513872452, normally reported as .051.
Was the two-sided result statistically significant?
No. The prespecified two-sided result did not cross alpha .05.
What was the one-sided greater p-value?
The greater-direction Boschloo p-value was 0.0256936226.
Why is the one-sided result significant but the two-sided result is not?
The two-sided convention doubles the smaller directional p-value. Doubling approximately .025694 gives approximately .051387.
When should Boschloo Test be used?
Use it for two independent binomial samples arranged in a 2 × 2 table when an exact unconditional comparison is desired.
Can Boschloo Test analyse a 2 × 4 table?
No. The standard procedure is defined for 2 × 2 tables. A larger table requires another method or a justified recoding.
Does Boschloo Test require expected counts above 5?
No. It uses exact probabilities. Expected counts are relevant to the chi-square comparison rather than to the validity of Boschloo Test.
Can it be used with unequal group sizes?
Yes. The current group totals are 383 and 266, and each denominator is retained in the double-binomial model.
Can Boschloo Test be used for paired data?
No. Paired or matched binary observations require a paired procedure because the independence assumption is violated.
Why is Boschloo Test often more powerful than Fisher's exact test?
It uses Fisher-p ordering but calibrates the rejection region unconditionally rather than conditioning on the observed outcome total.
Is Boschloo Test the same as Barnard's exact test?
No. Both are unconditional, but Boschloo uses Fisher-p ordering while Barnard commonly uses a score or Wald statistic.
Why did Pearson chi-square reject in this example?
Pearson uses an asymptotic reference and produced p = .0463. Boschloo Test uses a discrete unconditional reference and produced p = .0514.
What is the risk difference?
The male-minus-female risk difference is -0.057422, equivalent to approximately −5.74 percentage points.
What is the risk ratio?
The male/female risk ratio is 0.933957.
What is the odds ratio?
The male/female odds ratio is 0.648649.
What is Cramer's V?
Cramer's V is 0.078222, indicating a small unadjusted association.
What is the nuisance parameter?
It is the unknown common positive-outcome probability under the equality null.
Why must the nuisance parameter be maximized?
The unconditional rejection probability depends on the unknown common probability, so the test uses the largest null tail across the allowed range.
What two-sided convention is used in this post?
The result is twice the smaller one-sided Boschloo p-value, clipped at 1.
Can R return another two-sided Boschloo result?
Yes. R packages can offer central and minimum-likelihood conventions, so the software method must be stated.
What is a mid-p Boschloo Test?
It reduces the contribution of the observed table to decrease conservatism, but it is not the same as the full exact procedure.
What does Boschloo Berger-Boos test R mean?
It combines two related but distinct unconditional approaches. Berger-Boos is an adjustment framework, not another name for Boschloo Test.
How do I run Boschloo Test in Python?
Use scipy.stats.boschloo_exact with a nonnegative integer 2 × 2 table, alternative and numerical sampling setting.
How do I run Boschloo Test in R?
Use exact2x2::boschloo or another validated unconditional exact implementation and report its two-sided method.
How do I run Boschloo Test in SPSS?
Use CROSSTABS for the table and comparison measures, then add the exact procedure through validated embedded Python.
Can Excel calculate Boschloo Test?
Yes, but it requires explicit enumeration of possible tables, hypergeometric Fisher ordering and binomial nuisance-profile formulas.
Can Boschloo Test establish causation?
No. It tests an unadjusted association and does not remove confounding, selection bias or dependence.
How should a nonsignificant result be interpreted?
State that there was insufficient evidence of a difference. Do not claim that the two population probabilities are equal.
How should the result be reported in APA style?
Report both group counts and proportions, Fisher-p statistic, Boschloo p-value, risk difference, interval method and noncausal interpretation.
What is the main conclusion from this example?
The female positive-outcome proportion was higher, but the primary two-sided Boschloo result was borderline and nonsignificant at .05.
Boschloo Test Conclusion
Boschloo Test is an exact unconditional comparison of two independent binary-outcome probabilities. It uses a one-sided Fisher exact p-value to order possible 2 × 2 tables and maximizes the unconditional rejection probability over the unknown common null probability.
In the worked example, 333 of 383 female students and 216 of 266 male students had G3 ≥ 10. The observed proportions were 0.869452 and 0.812030. The Fisher-p ordering statistic was 0.030493, and the two-sided Boschloo p-value was 0.051387.
At α = .05, the equality null was not rejected. The male-minus-female risk difference was -0.057422, and Cramer's V was 0.078222. The evidence is borderline and the observed association is small, so the result should be reported with its effect estimates and uncertainty rather than reduced to a binary label.

