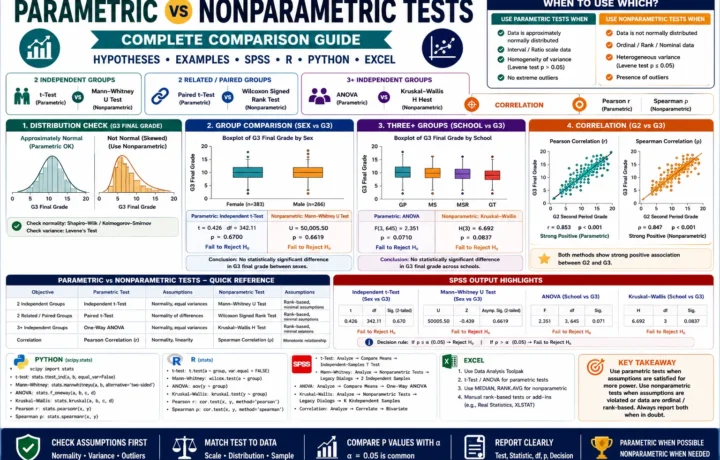
Parametric vs Nonparametric Tests: Python, R, SPSS and Excel Guide
Learn how to choose between parametric and nonparametric tests using hypotheses, assumptions, p-values, SPSS output, Python charts, R charts, and Excel workflows.

Free Statistical Analysis Online Calculators, Guides and Ethical Support
Category Guide Hub
Learn how to choose between parametric and nonparametric tests using hypotheses, assumptions, p-values, SPSS output, Python charts, R charts, and Excel workflows.
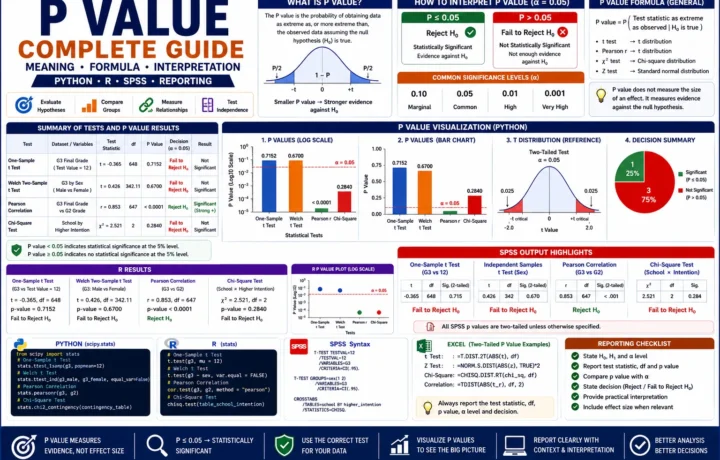
Learn what a P Value means, how to interpret it, and how to report p-values from t tests, correlation, and chi-square using Python, R, and SPSS.
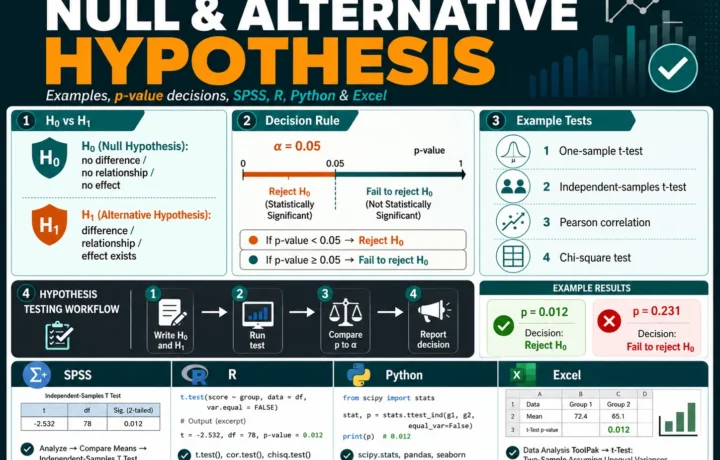
Learn how to write null and alternative hypotheses, compare p-values with alpha 0.05, and report one-sample, two-group, correlation, and chi-square hypothesis tests using SPSS, R, Python, and Excel.
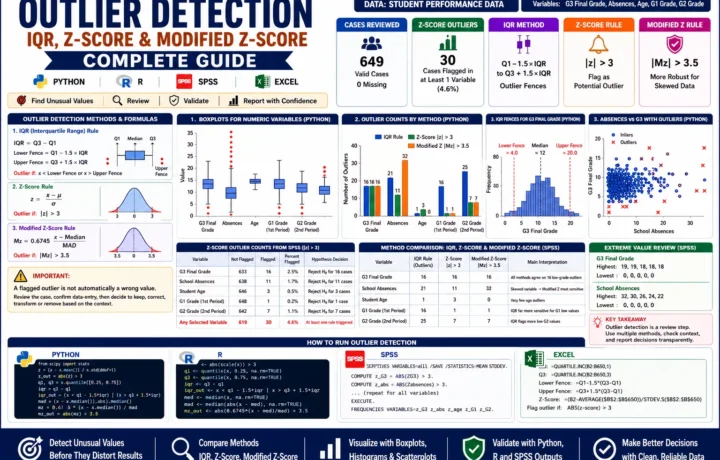
Learn Outlier Detection with IQR, z-score, and modified z-score methods using Python, R, SPSS output, boxplots, flagged cases, formulas, and chart interpretation.
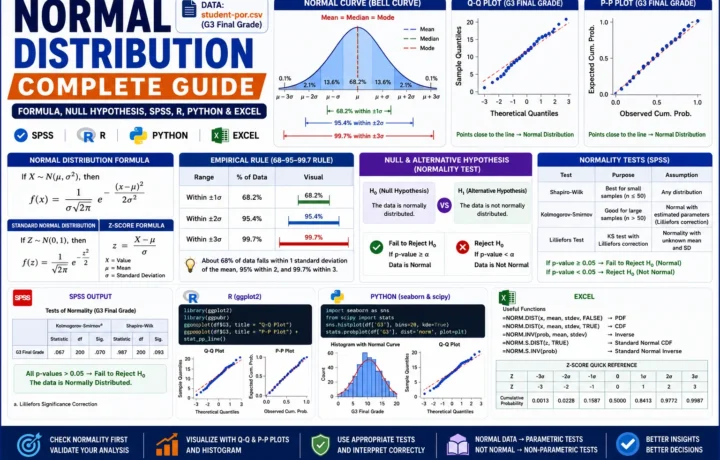
Learn normal distribution with formula, null hypothesis, hypothesis decision, SPSS normality tests, Q-Q plot, P-P plot, z-scores, empirical rule, R, Python, and Excel using student-por.csv G3 final grade data.
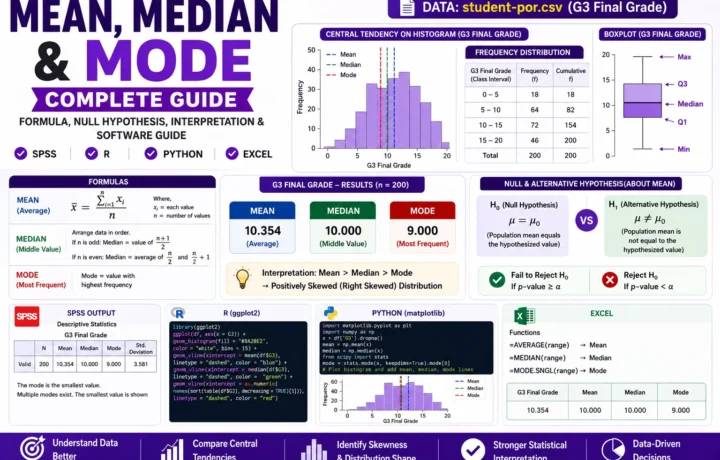
Learn mean, median and mode with formulas, null hypothesis framing, central tendency interpretation, SPSS output, R charts, Python charts, and Excel workflow using student-por.csv G3 final grade data.
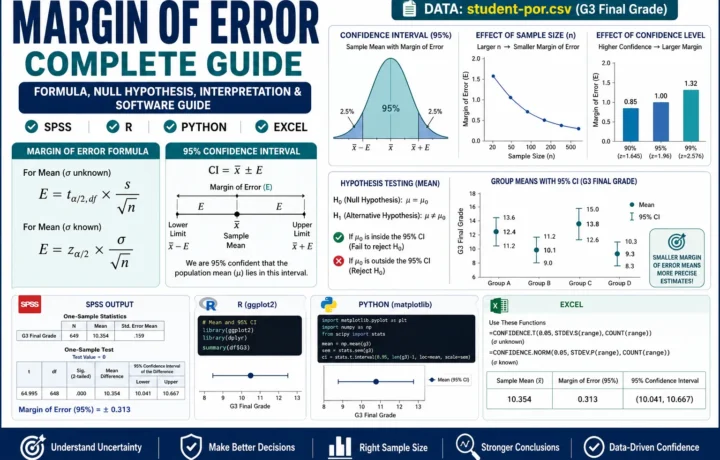
Learn margin of error with formula, null hypothesis, confidence interval interpretation, SPSS output, R charts, Python charts, and Excel workflow using student-por.csv G3 final grade data.
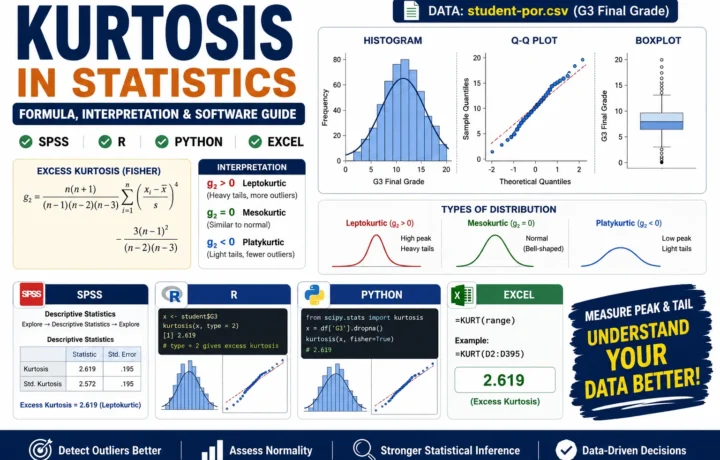
Kurtosis, kurtosis in statistics, kurtosis formula, kurtosis interpretation, excess kurtosis, Fisher kurtosis, Pearson kurtosis, leptokurtic distribution, mesokurtic distribution, platykurtic distribution, histogram kurtosis, Q-Q plot kurtosis, boxplot tail check, skewness and kurtosis, SPSS kurtosis, R kurtosis, Python kurtosis, Excel KURT function, normality check, descriptive statistics, G3 final grade, student-por.csv, statistical analysis guide, tail weight, heavy tails, light tails
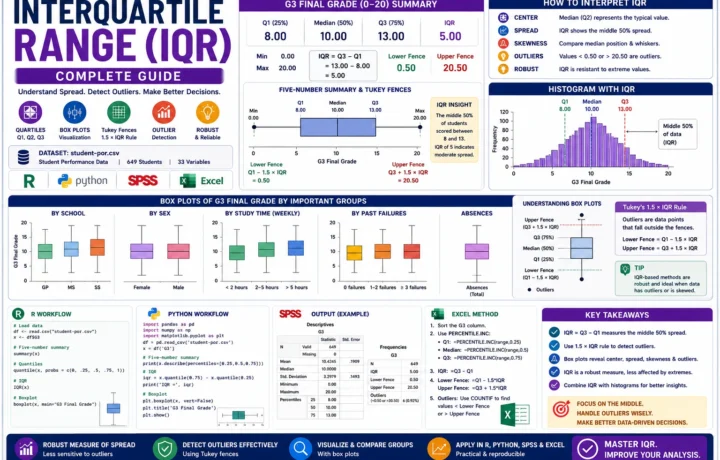
Learn Interquartile Range with a complete worked example using student performance data. This guide explains Q1, median, Q3, IQR, Tukey outlier fences, box plots, histograms, R, Python, SPSS, Excel and chart interpretation.
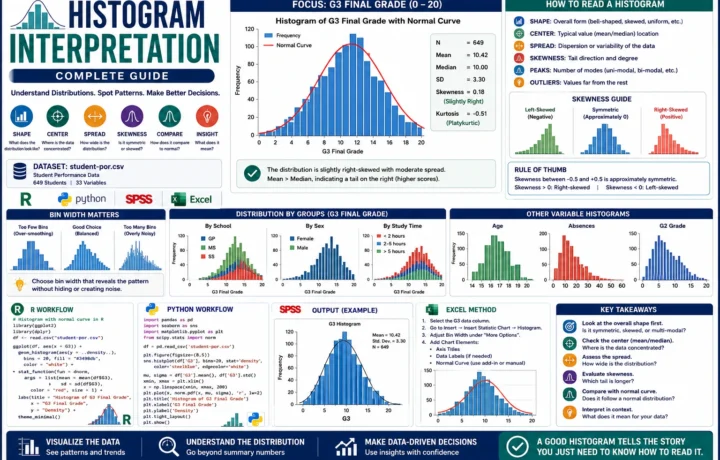
Learn Histogram Interpretation with a complete worked example using student performance data. This guide explains histogram shape, center, spread, skewness, bin width, normal curve comparison, R, Python, SPSS, Excel and detailed chart interpretation.