Data & Design Academic Support CLINICAL TRIALS USING R Digital Publishing Local Services R Programming RSTUDIO
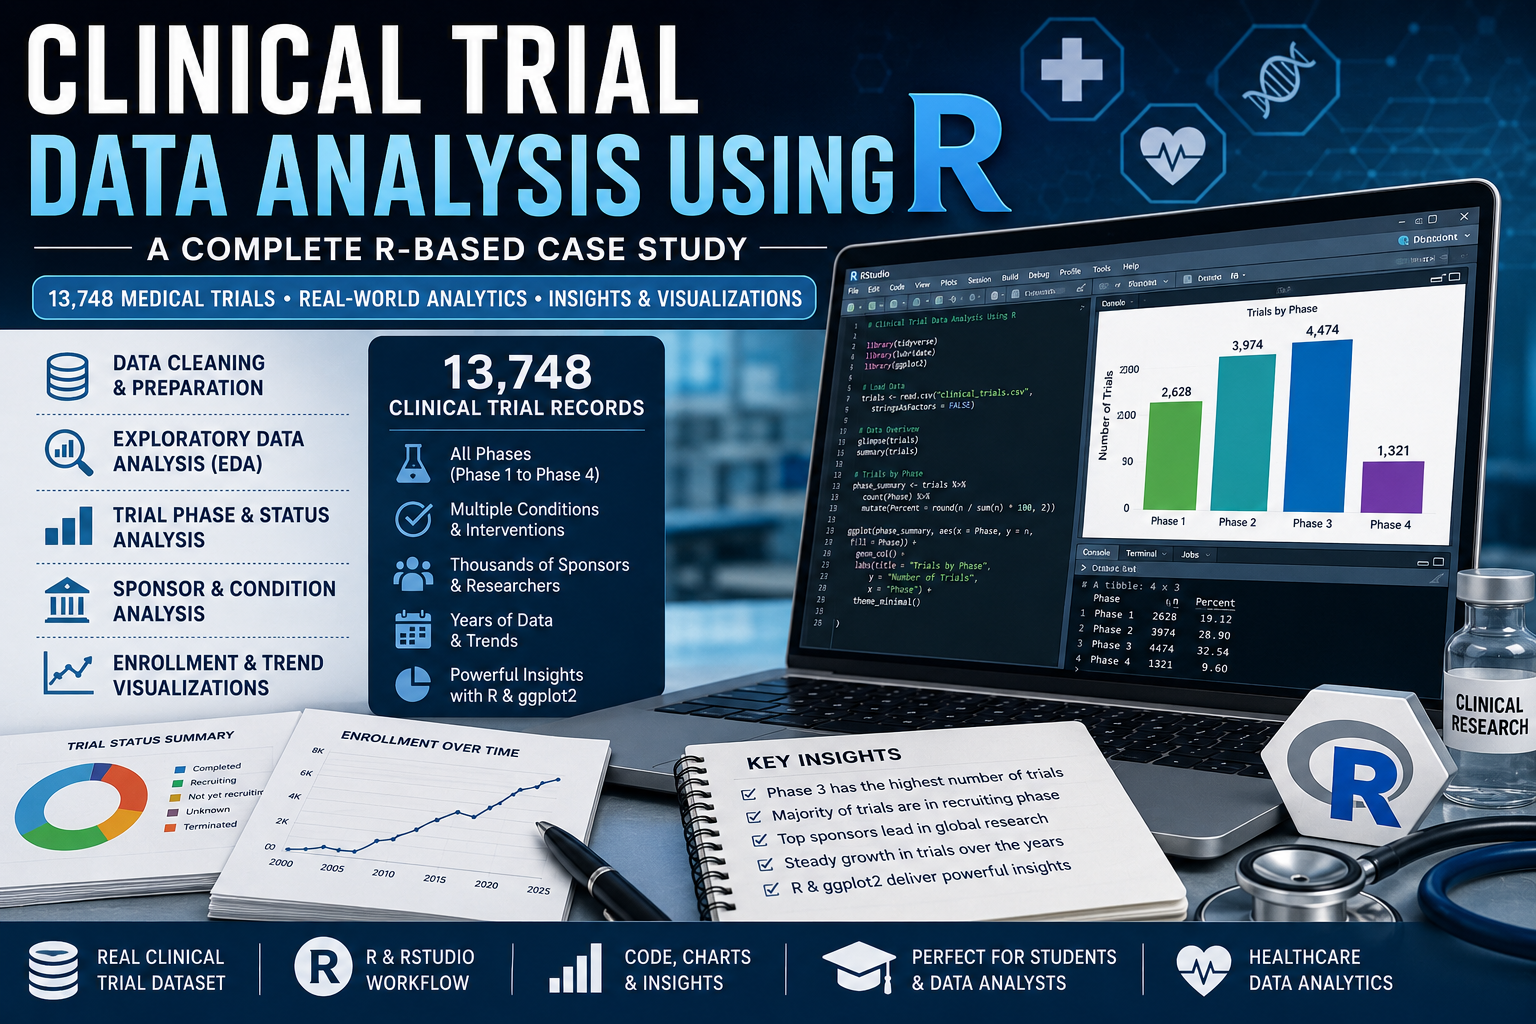
Clinical Trial Data Analysis Using R: 13,748 Medical Trials Case Study with Code, Charts and Insights
Clinical Trial Data Analysis Using R: Complete SEO-Based Case Study Clinical Trial Data Analysis Using R is a practical healthcare analytics project that teaches how to…