
Reliability, Agreement, Consistency, ICC Models and Excel Worked Results
Intraclass Correlation Coefficient: ICC Formula, Interpretation, SPSS, Python, R and Excel Guide
Intraclass Correlation Coefficient, usually written as ICC, measures how strongly repeated ratings, raters, judges, measurements or time points resemble one another for the same subjects. This complete guide explains ICC(1), ICC(2), ICC(3), single-measure ICC, average-measure ICC, absolute agreement, consistency, variance components, SPSS output, Python charts, R validation charts, Excel formulas, APA reporting and common mistakes.
Quick Answer: Intraclass Correlation Coefficient Result
The worked Excel, Python, R and SPSS example estimates reliability across three repeated grade-style measurements: G1, G2 and G3. The file uses 20 subjects and 3 ratings/measurements. The default reporting model is ICC(3,k), a two-way mixed-effects average-measure consistency model. The verified result is ICC(3,k) = 0.9968, which is interpreted as excellent reliability.
This means that the average of G1, G2 and G3 is extremely consistent for ranking or differentiating subjects. Most variation in the data comes from real differences between subjects, not from random rating noise. The result is also supported by the model-comparison table: single-measure ICC values are already excellent, while average-measure ICC values become even higher because averaging three repeated measurements reduces measurement error.
Final interpretation: The repeated G1, G2 and G3 measurements show excellent reliability. The default average-measure consistency coefficient, ICC(3,k) = 0.9968, indicates that the average repeated score is almost perfectly consistent for separating subjects by performance.
Model choice matters: ICC is not one single statistic. ICC(1), ICC(2) and ICC(3) answer different questions. Use ICC(2) when raters are sampled from a wider rater population and absolute agreement matters. Use ICC(3) when the same fixed raters or repeated measurements are used and consistency is the target. Use the “k” version when you report the reliability of the average of all ratings instead of one rating.
Table of Contents
- What Is the Intraclass Correlation Coefficient?
- When to Use ICC
- ICC(1), ICC(2), ICC(3), Single and Average Measures
- Intraclass Correlation Coefficient Formula
- Null and Alternative Hypotheses
- Dataset and Variables Used
- Excel Worked Results Explained
- SPSS Output Interpretation
- Python Chart-by-Chart Interpretation
- R Chart-by-Chart Validation
- SPSS, R, Python and Excel Workflows
- Code Blocks for ICC
- APA Reporting Wording
- Common Mistakes
- Downloads and Resources
- Related Guides
- FAQs
What Is the Intraclass Correlation Coefficient?
The Intraclass Correlation Coefficient is a reliability coefficient for measurements that are organized inside the same class or target. In ordinary Pearson correlation, each pair of variables is usually treated as two different measures. In ICC, the goal is different: we want to know whether several raters, judges, instruments or repeated measurements give similar values for the same subjects.
For example, assume 20 students have three repeated scores: G1, G2 and G3. A regular correlation matrix can show pairwise relationships between the three score columns, but ICC summarizes reliability across all repeated measurements in one model-based coefficient. It separates variation caused by real subject differences from variation caused by measurement error, rater differences or residual noise.
ICC values usually range from 0 to 1 in normal reliability settings. A value close to 0 means the ratings do not reliably distinguish subjects. A value close to 1 means the ratings are highly consistent or highly agreeing, depending on the chosen ICC model. Negative ICC values can occur when measurement noise is larger than between-subject variation, and those results normally indicate very poor reliability or a mismatch between model and data.
Simple definition: ICC measures how much of the total observed variation is due to true differences between subjects rather than disagreement or noise among repeated ratings.
When to Use Intraclass Correlation Coefficient
Use ICC when the research question is about reliability, agreement or consistency across repeated measurements of the same targets. It is common in psychology, medicine, education, sports science, measurement validation, interrater reliability, test-retest reliability and instrument comparison.
| Use ICC When | Example | Why ICC Fits |
|---|---|---|
| Several raters score the same subjects | Three teachers grade the same essays. | ICC estimates whether ratings are reliable across raters. |
| The same measure is repeated over occasions | G1, G2 and G3 repeated academic scores. | ICC estimates consistency across repeated measurements. |
| Several instruments measure the same target | Three devices record the same clinical value. | ICC estimates agreement or consistency across devices. |
| You report the reliability of an average score | Average of three judges’ scores. | Average-measure ICC estimates the reliability of the combined score. |
Do not use ICC when you simply need the association between two different variables. For two continuous variables, use correlation in R, correlation in Python, correlation in SPSS or correlation in Excel. Use ICC when the columns are intended to measure the same construct or target.
ICC(1), ICC(2), ICC(3), Single and Average Measures
The most common confusion in ICC reporting is model selection. The coefficient changes depending on the design. A one-way random model treats ratings as exchangeable and does not model systematic rater effects separately. A two-way random model treats both subjects and raters as random. A two-way mixed model treats subjects as random but raters or repeated measurements as fixed.
| ICC Type | Verified Value | Model | Definition | Interpretation | Recommended Reporting Use |
|---|---|---|---|---|---|
| ICC(1,1) | 0.9545 | One-way random effects | Single rating, absolute agreement | Excellent reliability | Use when raters or measurements are random/exchangeable and the report concerns a single score. |
| ICC(1,k) | 0.9844 | One-way random effects | Average of k ratings, absolute agreement | Excellent reliability | Use for reliability of the average repeated score under one-way random assumptions. |
| ICC(2,1) | 0.9551 | Two-way random effects | Single rating, absolute agreement | Excellent reliability | Use when raters are sampled from a wider population and exact agreement matters. |
| ICC(2,k) | 0.9846 | Two-way random effects | Average of k ratings, absolute agreement | Excellent reliability | Use for the average of sampled raters when absolute agreement matters. |
| ICC(3,1) | 0.9905 | Two-way mixed effects | Single rating, consistency | Excellent reliability | Use when the same fixed raters or measurements are used and consistency matters. |
| ICC(3,k) | 0.9968 | Two-way mixed effects | Average of k ratings, consistency | Excellent reliability | Useful default here for G1, G2 and G3 as fixed repeated grade measurements. |
Single-measure ICC answers: “How reliable is one rating or one measurement?” Average-measure ICC answers: “How reliable is the average of all k ratings or measurements?” Average-measure values are usually larger because averaging reduces random error. In this worked example, ICC(3,1) is already excellent at 0.9905, and ICC(3,k) increases to 0.9968.
Intraclass Correlation Coefficient Formula
ICC formulas are built from ANOVA mean squares. The important mean squares are the between-subject mean square, the rater or measurement mean square, the residual mean square and the within-subject one-way error mean square.
| Term | Meaning | Verified Value | Interpretation |
|---|---|---|---|
| MSsubject | Between-subject mean square | 39.4596 | Large value showing that subjects differ clearly from one another. |
| MSrater | Between-rater or between-measurement mean square | 9.9500 | Shows that G1, G2 and G3 column means are not identical. |
| MSerror | Residual or interaction mean square | 0.1254 | Very small remaining noise after subject and measurement effects. |
| MSwithin | One-way within-subject error | 0.6167 | Used in ICC(1,1) and ICC(1,k). |
The workbook uses these common formulas:
The default ICC(3,k) formula is simple in this example because it is an average-measure consistency model. Substituting the verified values gives (39.4596 − 0.1254) / 39.4596 = 0.9968. This high value occurs because MSsubject is very large compared with MSerror.
Null and Alternative Hypotheses for ICC
The hypothesis statement for ICC depends on the software output and test value. Most classroom examples test whether the population ICC is greater than zero. In practical reliability analysis, however, the more important question is often whether the ICC is large enough for the intended decision.
| Statement | Hypothesis | Meaning |
|---|---|---|
| Null hypothesis | H0: ICC = 0 | The repeated ratings do not reliably distinguish subjects. |
| Alternative hypothesis | H1: ICC > 0 | The repeated ratings have positive reliability. |
| Practical decision | ICC ≥ acceptable threshold | The ratings are reliable enough for reporting, ranking or averaging. |
Common interpretation cutoffs are: below .50 = poor, .50 to .75 = moderate, .75 to .90 = good, and .90 or higher = excellent. These cutoffs are helpful as a guide, but they are not universal laws. A clinical diagnosis tool may need stronger reliability than a quick classroom screening measure. The current example is safely in the excellent zone because all verified ICC values are above .95.
Dataset and Variables Used
The worked file contains 20 subjects and three repeated measurement columns. The variables are named G1, G2 and G3. Each row is a subject, and each score column is treated as a repeated rating or measurement of the same target.
| Variable | Role | Used In | Interpretation Purpose |
|---|---|---|---|
| Subject_ID | Target identifier | Excel, Python, R and SPSS | Defines the subject or target being measured repeatedly. |
| G1 | Repeated measurement 1 | All workflows | First rating or time-point score; mean = 10.95. |
| G2 | Repeated measurement 2 | All workflows | Second rating or time-point score; mean = 11.50. |
| G3 | Repeated measurement 3 | All workflows | Third rating or time-point score; mean = 12.35. |
| Subject_Mean | Row summary | Excel and charts | Average score for each subject across G1, G2 and G3. |
| Subject_SD | Within-subject spread | Excel and charts | Shows how much repeated scores vary inside each subject. |
Before reporting ICC, it is useful to examine descriptive statistics, standard deviation, variance, box plots, histograms, correlation heatmaps and correlation assumptions.
Excel Worked Results Explained
The Excel workbook provides the clearest fully worked calculation because it shows the raw data, subject means, subject standard deviations, ANOVA sum of squares, mean squares and ICC formulas. The workbook purpose is to compute ICC from repeated rating columns such as G1, G2 and G3. The default model is ICC(3,k), reported as 0.9968.
Excel ANOVA Components
| Source | Sum of Squares | df | Mean Square | Formula Meaning |
|---|---|---|---|---|
| Subjects / targets | 749.7333 | 19 | 39.4596 | k × sum of squared differences between subject means and grand mean. |
| Raters / measurements | 19.9000 | 2 | 9.9500 | n × sum of squared differences between rating means and grand mean. |
| Residual / interaction | 4.7667 | 38 | 0.1254 | Total SS minus subject SS and rater SS. |
| Total | 774.4000 | 59 | — | Sum of squared differences between each score and the grand mean. |
| Within-subject one-way error | 24.6667 | 40 | 0.6167 | Sum of squared differences between each score and its subject mean. |
The key result is the contrast between a very large subject mean square and a very small residual mean square. Subject variation is the real signal: different subjects have clearly different repeated-score levels. Residual variation is small: repeated values inside the same subject remain close together. That is why ICC(3,k) is almost 1.
Excel Model Results
| Model | ICC Value | Best Plain-Language Reading |
|---|---|---|
| ICC(1,1) | 0.9545 | One random single measurement is already highly reliable. |
| ICC(1,k) | 0.9844 | The average of the three measurements is more reliable than one measurement. |
| ICC(2,1) | 0.9551 | Single-measure absolute agreement is excellent under a two-way random design. |
| ICC(2,k) | 0.9846 | Average-measure absolute agreement is excellent under a two-way random design. |
| ICC(3,1) | 0.9905 | Single-measure consistency is extremely high for the fixed repeated columns. |
| ICC(3,k) | 0.9968 | Average-measure consistency is almost perfect for G1, G2 and G3. |
Excel interpretation rule: The default result should be written as “The average-measure two-way mixed consistency ICC was 0.9968, indicating excellent reliability.” If you need absolute agreement rather than consistency, report ICC(2,k) = 0.9846 instead.
SPSS Output Interpretation for Intraclass Correlation Coefficient
The SPSS output confirms the ICC reliability workflow for the repeated columns G1, G2 and G3. In SPSS, ICC is commonly produced from the Reliability Analysis procedure. The important choices are model, type and whether the report is based on a single measure or the average of k measurements.
Open the SPSS Intraclass Correlation Coefficient output PDF
| SPSS Output Item | What to Check | Interpretation in This Guide |
|---|---|---|
| Case processing summary | Number of complete subjects | The worked file uses 20 complete subjects across G1, G2 and G3. |
| Reliability statistics | ICC model and coefficient | The reported model should match the chosen design: one-way random, two-way random or two-way mixed. |
| Single measures | Reliability of one measurement | Single-measure ICCs are excellent in the worked result, from about 0.9545 to 0.9905. |
| Average measures | Reliability of the mean of all measurements | Average-measure ICCs are higher, from about 0.9844 to 0.9968. |
| Confidence interval | Precision of ICC estimate | Use the confidence interval when reporting the reliability estimate in a thesis, article or results section. |
| F test | Test against a null ICC value | A significant F test supports reliability above the tested null, but practical reliability depends on ICC size and confidence interval. |
The best SPSS interpretation does not simply say “ICC is significant.” Statistical significance is not enough. The report should name the model, state whether it is single-measure or average-measure, give the ICC value, include the confidence interval if available and explain whether the value is poor, moderate, good or excellent.
SPSS reporting note: If you select a two-way mixed consistency model in SPSS, do not describe it as an absolute-agreement model. Consistency ignores systematic mean shifts among raters or measurements, while absolute agreement penalizes those shifts.
Python Chart-by-Chart Interpretation
The Python charts turn the ICC calculation into a visual reliability story. They show rating means, subject profiles, model comparison, pairwise correlations, variance components and within-subject spread. Together, these visuals explain why the default ICC is so high.
Python Chart 1: Rating Means with Confidence Intervals
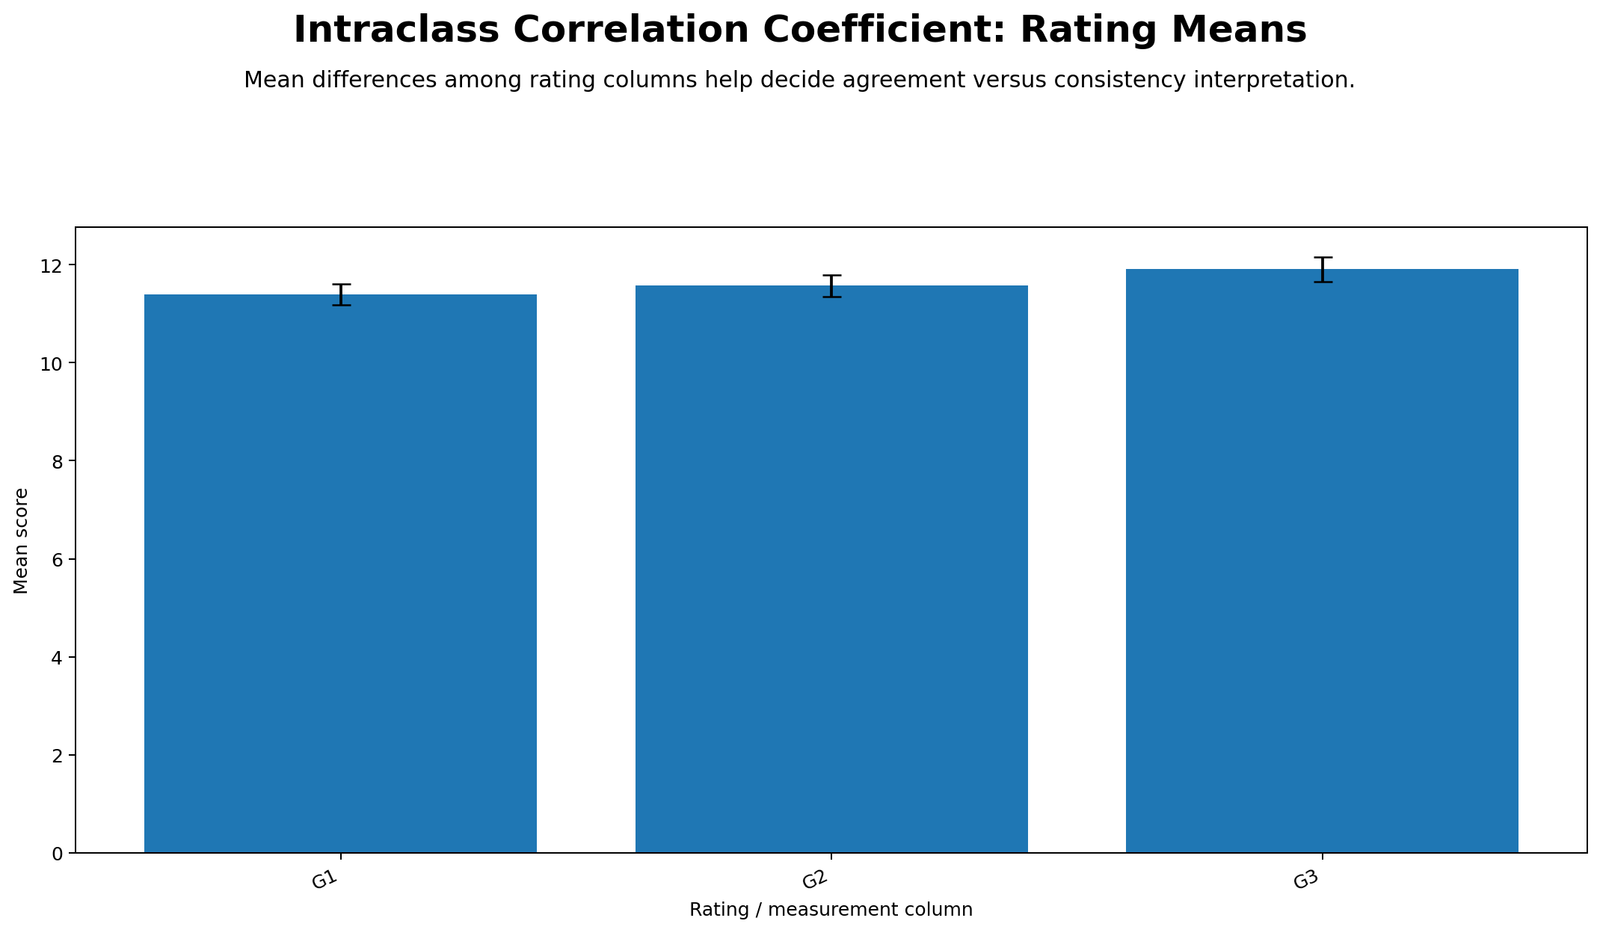
This chart shows the average score for each repeated measurement column. The verified column means are G1 = 10.95, G2 = 11.50 and G3 = 12.35. The gradual increase indicates that the columns are not identical in level, but ICC(3,k) remains extremely high because consistency focuses on whether subjects keep similar relative positions across measurements.
The chart is important because it separates systematic measurement level from random measurement noise. If absolute agreement is the goal, differences among rating means matter more and ICC(2,k) is safer to report. If consistency is the goal, a stable ranking pattern can still produce an excellent ICC even when one measurement column has a slightly higher mean.
Python Chart 2: Subject Rating Profiles
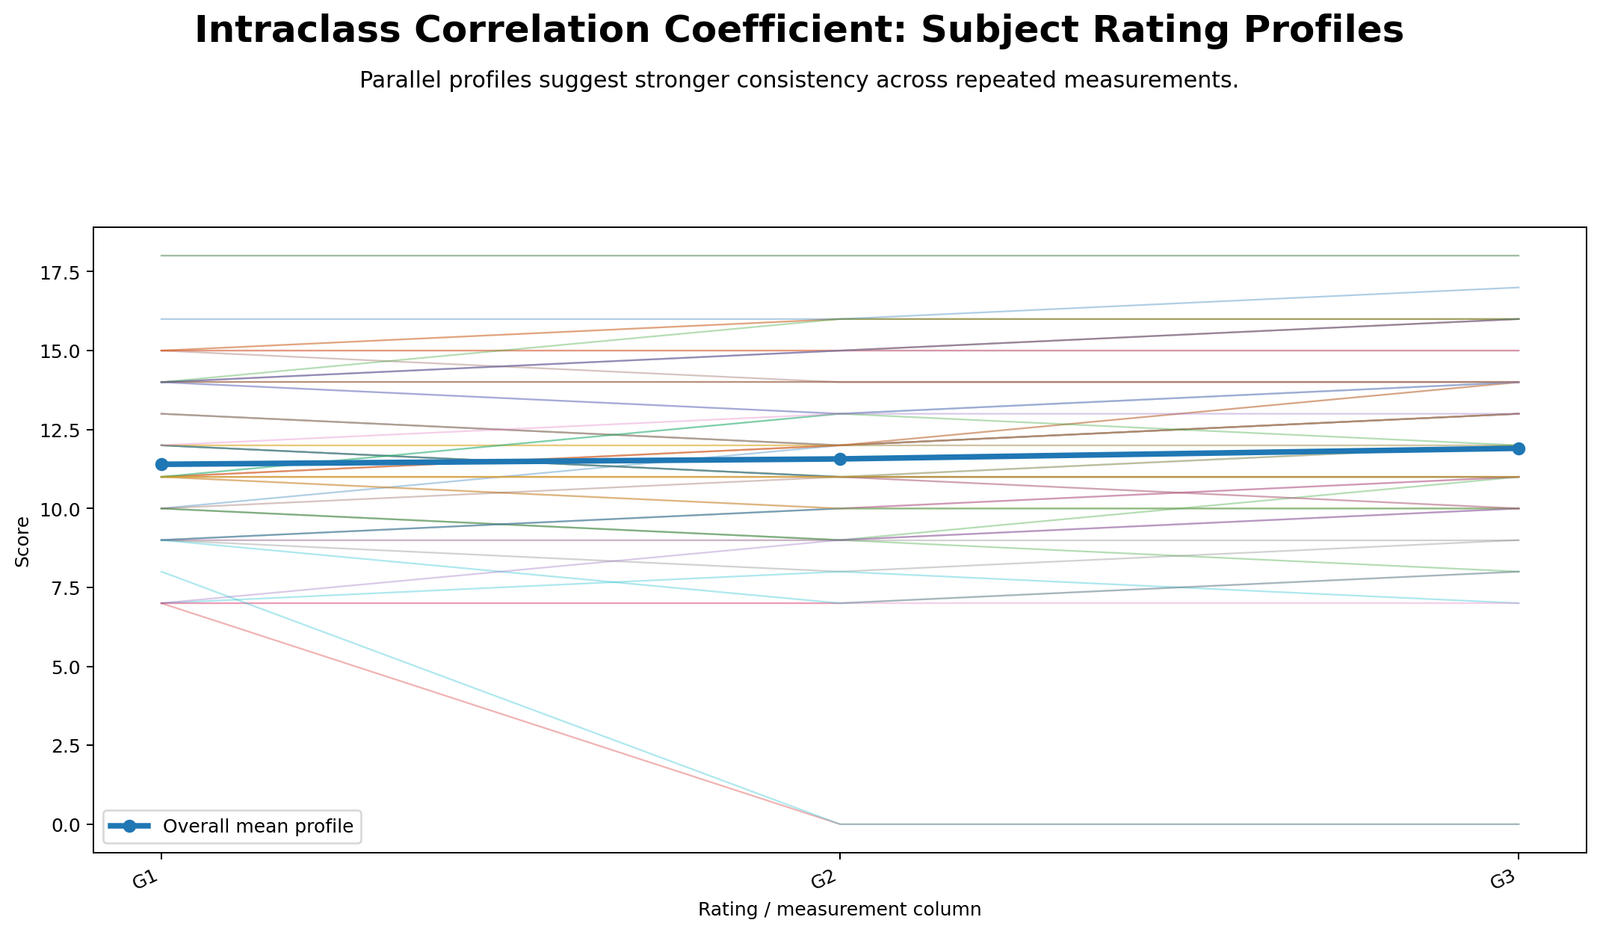
The subject profile chart shows one line or profile per subject across G1, G2 and G3. The profiles remain close within each subject, while different subjects have clearly different score levels. This is the ideal pattern for a high ICC: repeated values inside a subject are stable, but subject means differ enough to separate targets.
If the profiles crossed wildly or moved up and down randomly, within-subject error would be larger and ICC would fall. Instead, the chart supports the Excel result because the main visible pattern is between-subject separation, not measurement disagreement.
Python Chart 3: ICC Model Comparison
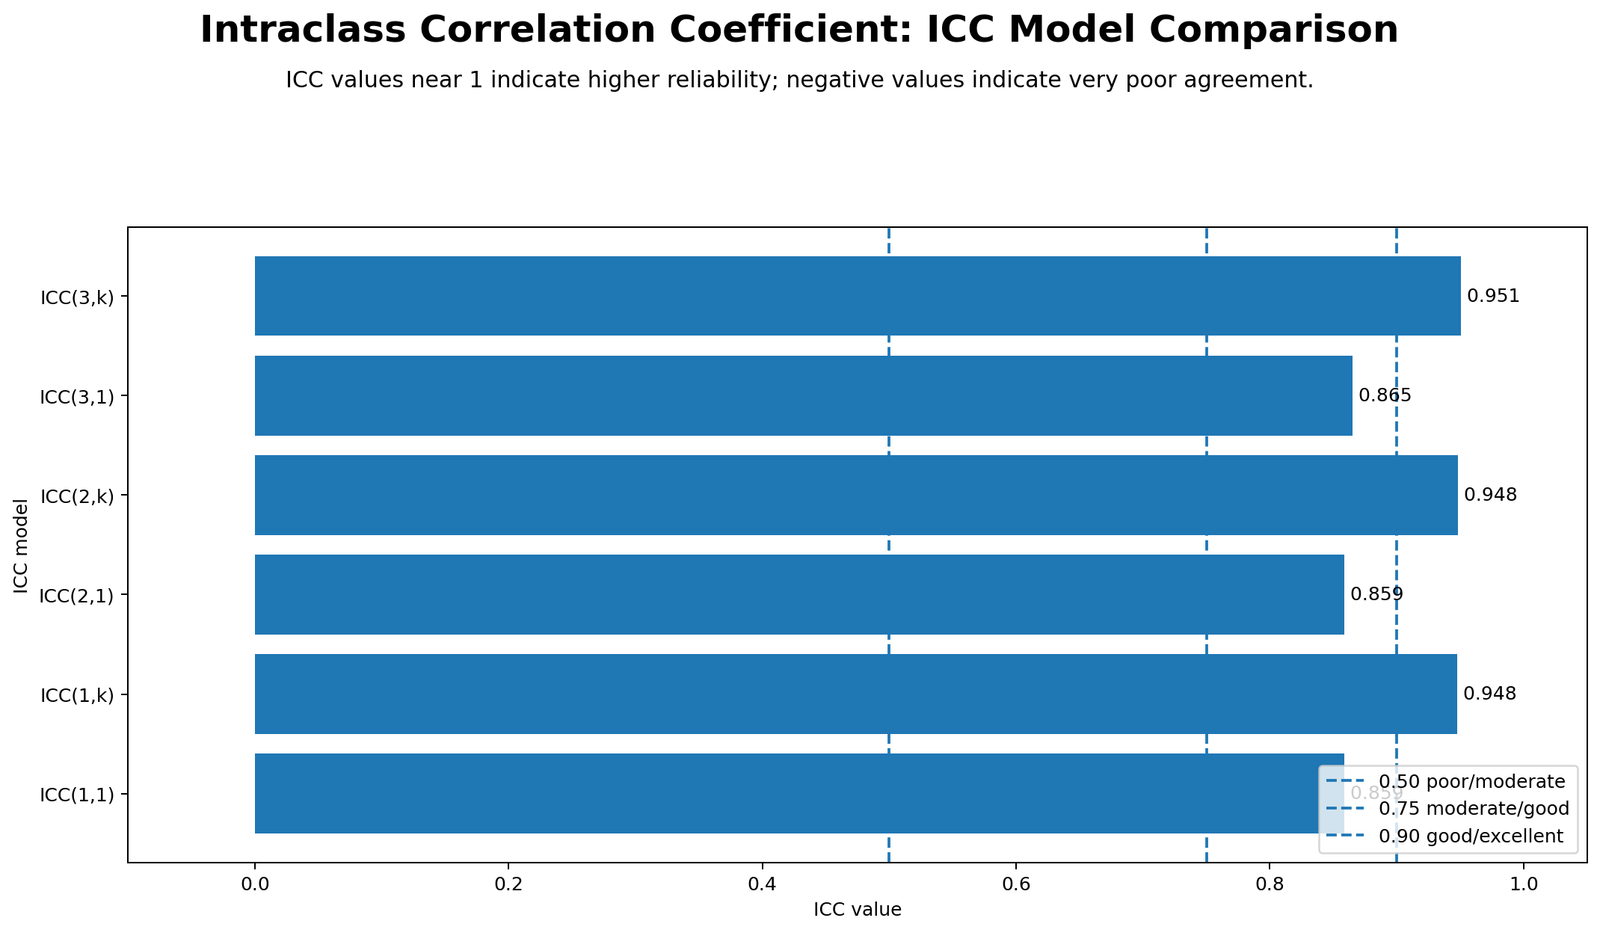
The model comparison chart shows that all six ICC estimates are in the excellent range. Single-measure models are lower because they evaluate one score at a time. Average-measure models are higher because they evaluate the reliability of the average of three repeated scores. The default reported model, ICC(3,k), is the highest at 0.9968.
This chart helps readers understand why a post should not report “the ICC” without naming the model. ICC(1,1), ICC(2,1), ICC(3,1), ICC(1,k), ICC(2,k) and ICC(3,k) are related but not interchangeable. In this dataset they all lead to the same practical conclusion of excellent reliability, but in other datasets the model choice can change the conclusion.
Python Chart 4: Pairwise Correlation Heatmap
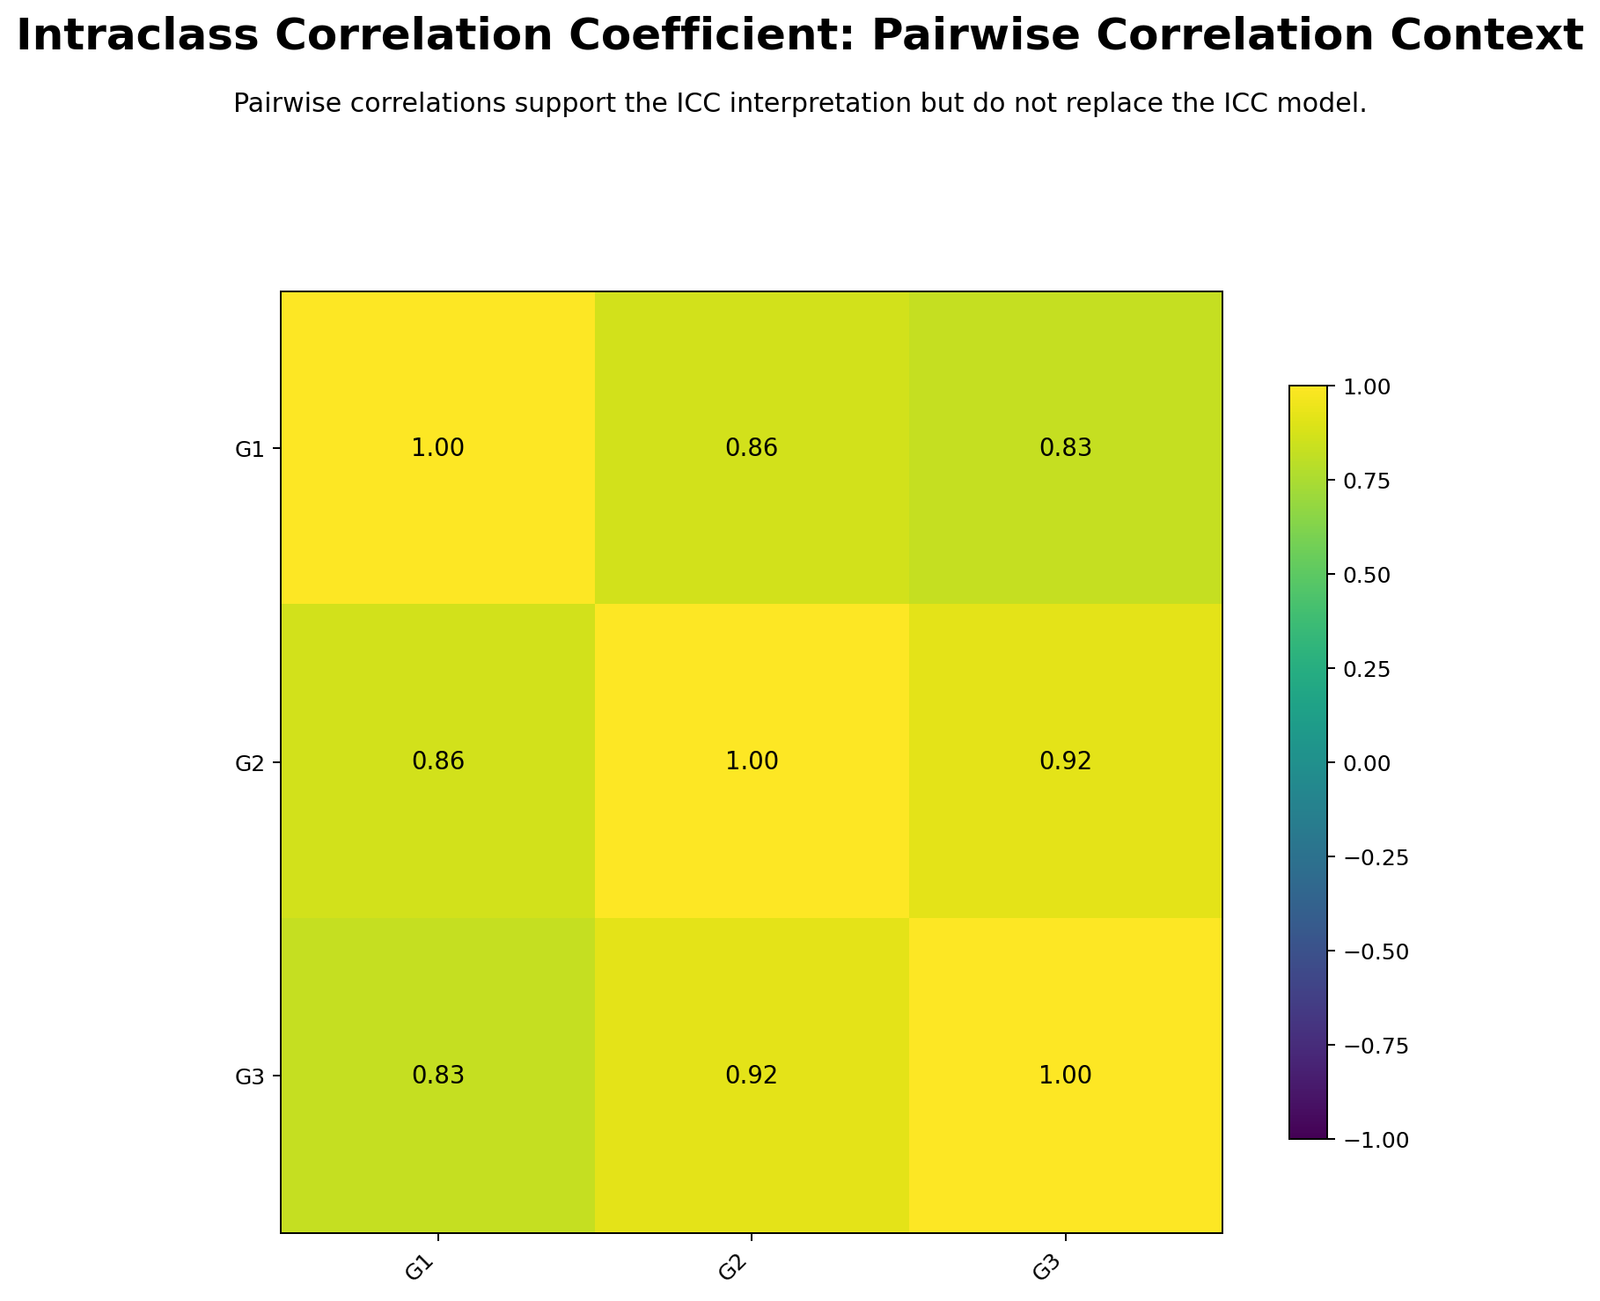
The heatmap gives a familiar correlation-based check before the model-based ICC interpretation. Strong positive pairwise relationships among G1, G2 and G3 show that subjects with higher values on one repeated measurement tend to have higher values on the other repeated measurements too. This supports the consistency interpretation.
Pairwise correlations are not a replacement for ICC because they do not handle all repeated measurements in one reliability model. However, the heatmap is useful as supporting evidence. It visually confirms that the repeated columns move together strongly.
Python Chart 5: Variance Components
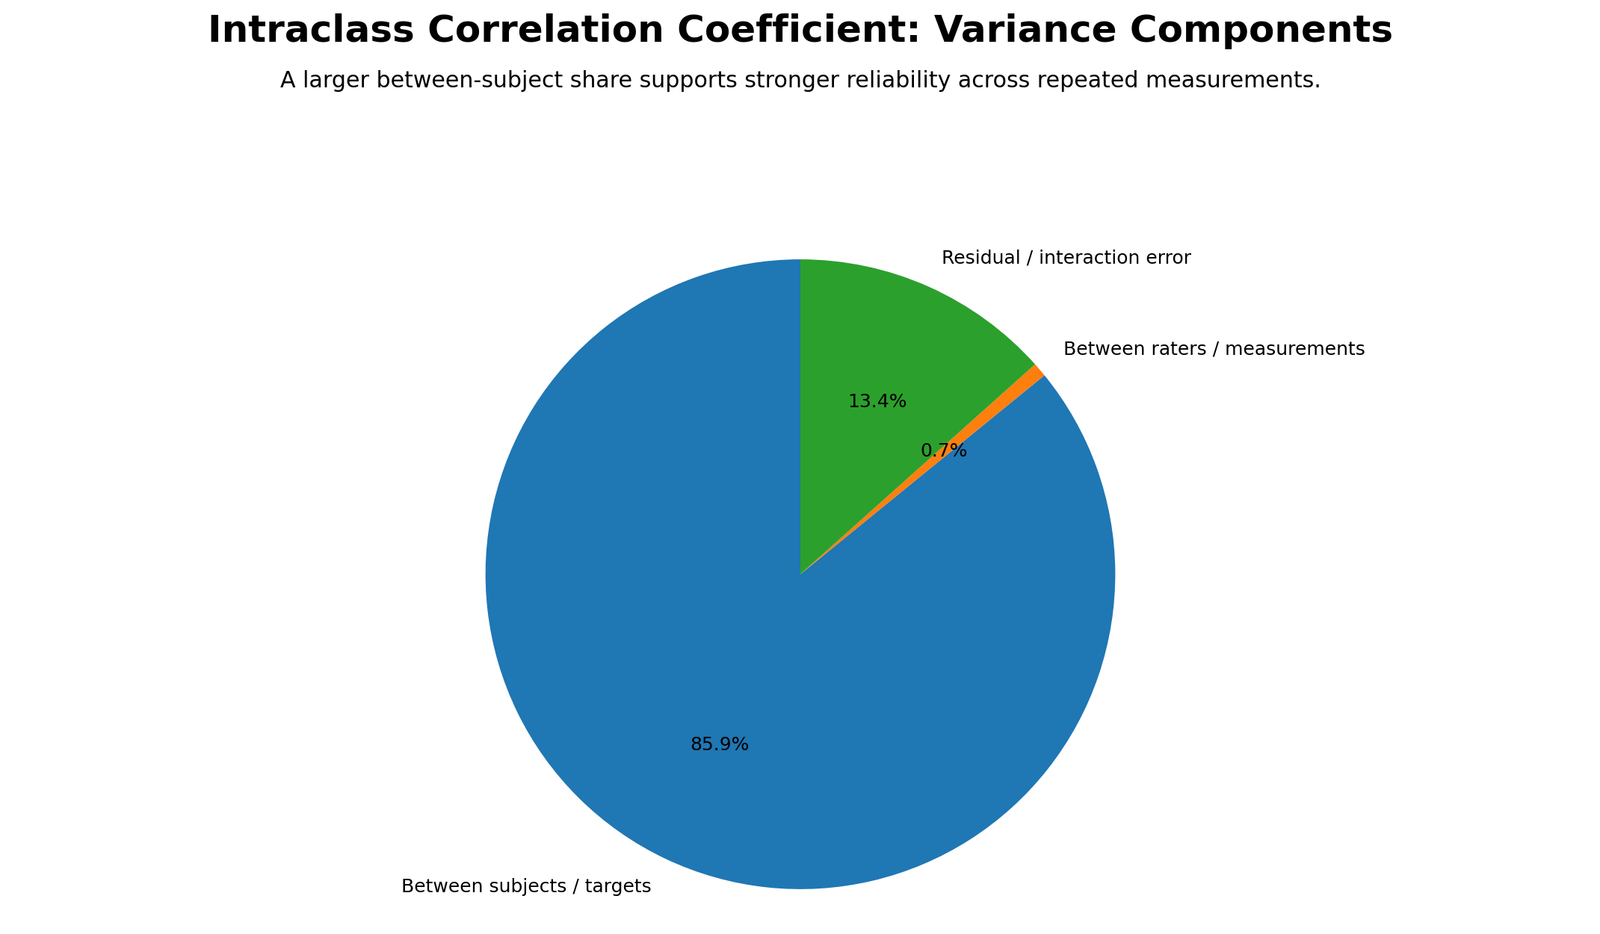
The variance component chart shows the mathematical reason for the high ICC. The between-subject mean square is 39.4596, while the residual mean square is only 0.1254. In plain language, subjects differ a lot from one another, but repeated measurements inside the same subject differ very little after model effects are considered.
ICC increases when between-subject variation is large relative to error variation. This chart is therefore the most direct explanation of the result. The reliability is excellent because the signal is far larger than the noise.
Python Chart 6: Subject Mean vs Within-Subject Spread
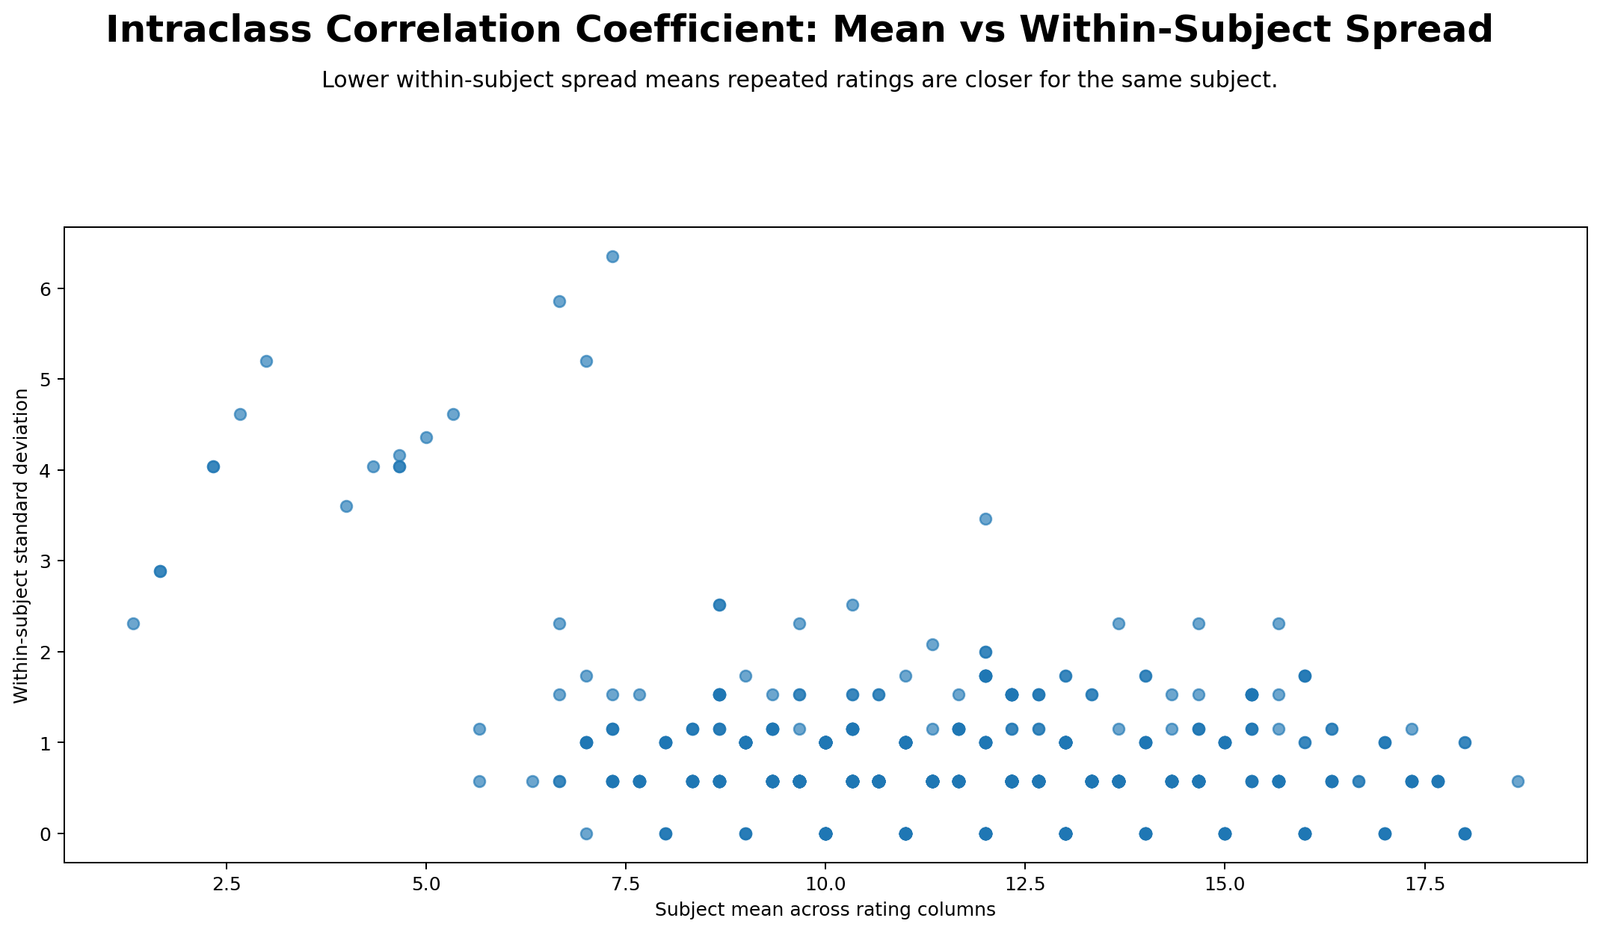
This chart places each subject by average score and within-subject spread. A strong reliability pattern has many subjects with different means but small within-subject standard deviations. The sample follows that pattern: subject means range from low to high, while most within-subject spreads remain small.
This chart is useful for diagnosing whether a high ICC is driven by genuine subject differences. If all subjects had similar means, ICC would be low even if repeated measurements were close. Here, subject means vary widely and within-subject spread stays controlled, producing excellent reliability.
R Chart-by-Chart Validation
The R charts validate the same result with a second workflow. They use the same repeated measurements and produce the same reliability story with a colorful visual style. Agreement between Python and R strengthens confidence that the reported ICC values are reproducible.
R Chart 1: Colorful Rating Means with Confidence Intervals
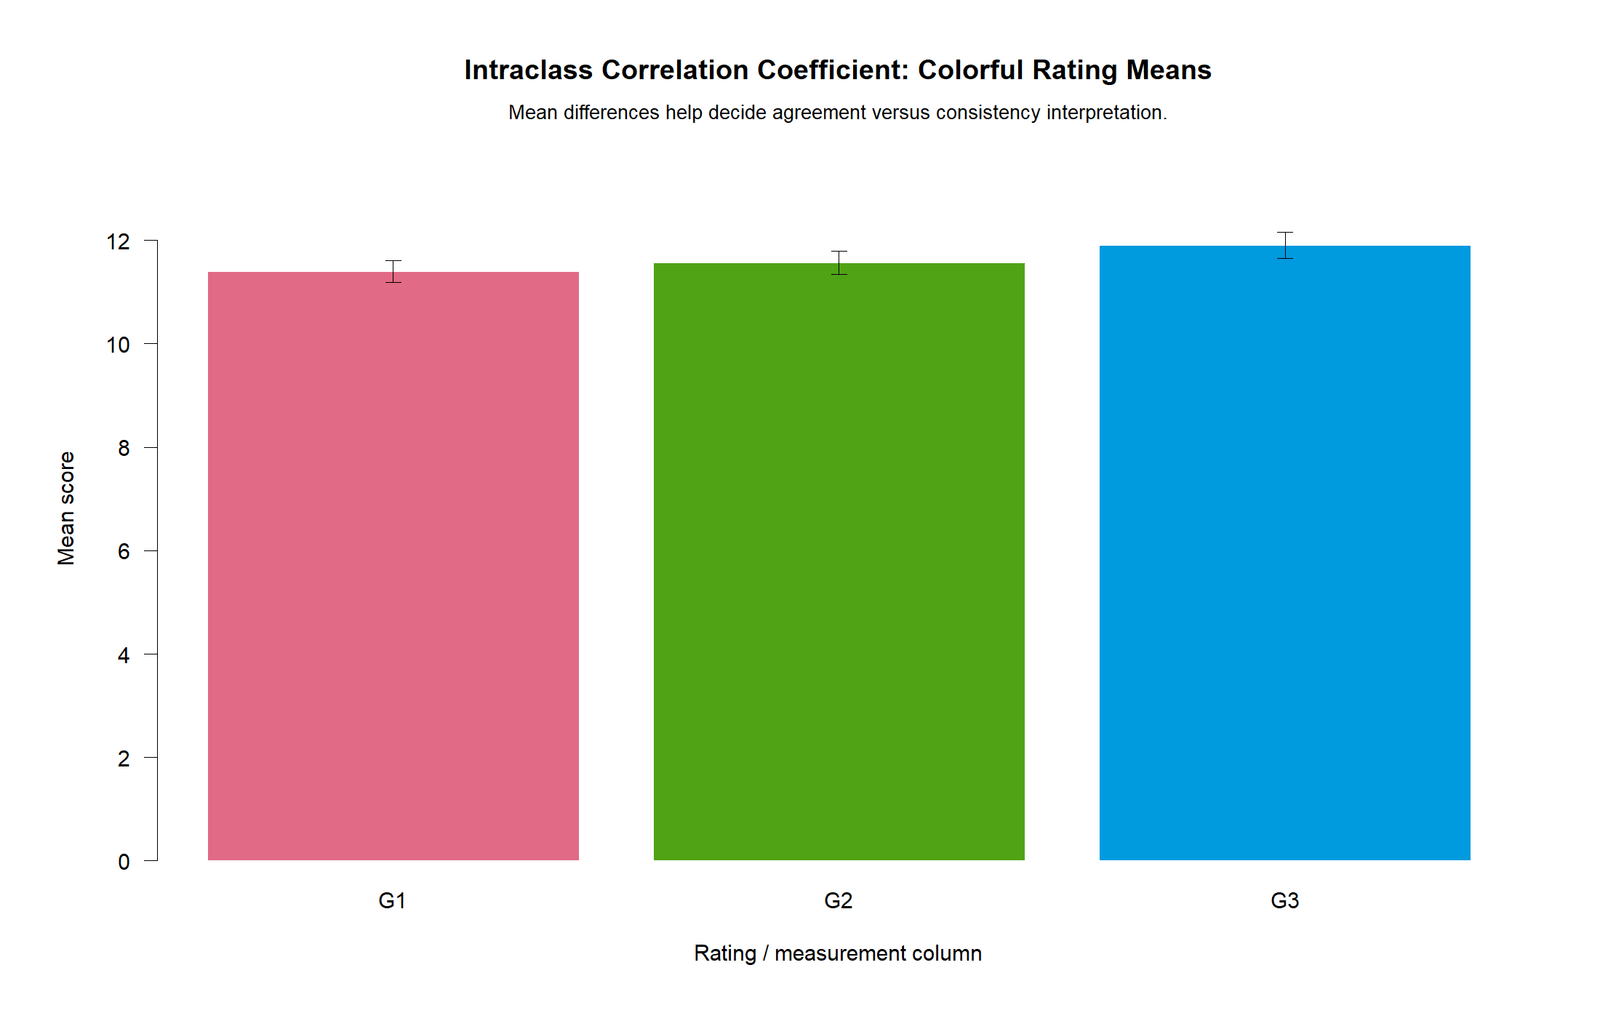
The R mean chart repeats the Python finding that G1, G2 and G3 increase slightly across the repeated columns. This does not contradict the high consistency ICC. It simply means the later measurement column has a higher average level while subjects remain ordered very similarly.
The practical interpretation is that average scores are reliable, but the analyst should choose the model based on the research question. Consistency is appropriate when stable ranking is acceptable. Absolute agreement is better when exact equality among rating levels matters.
R Chart 2: Colorful Subject Rating Profiles
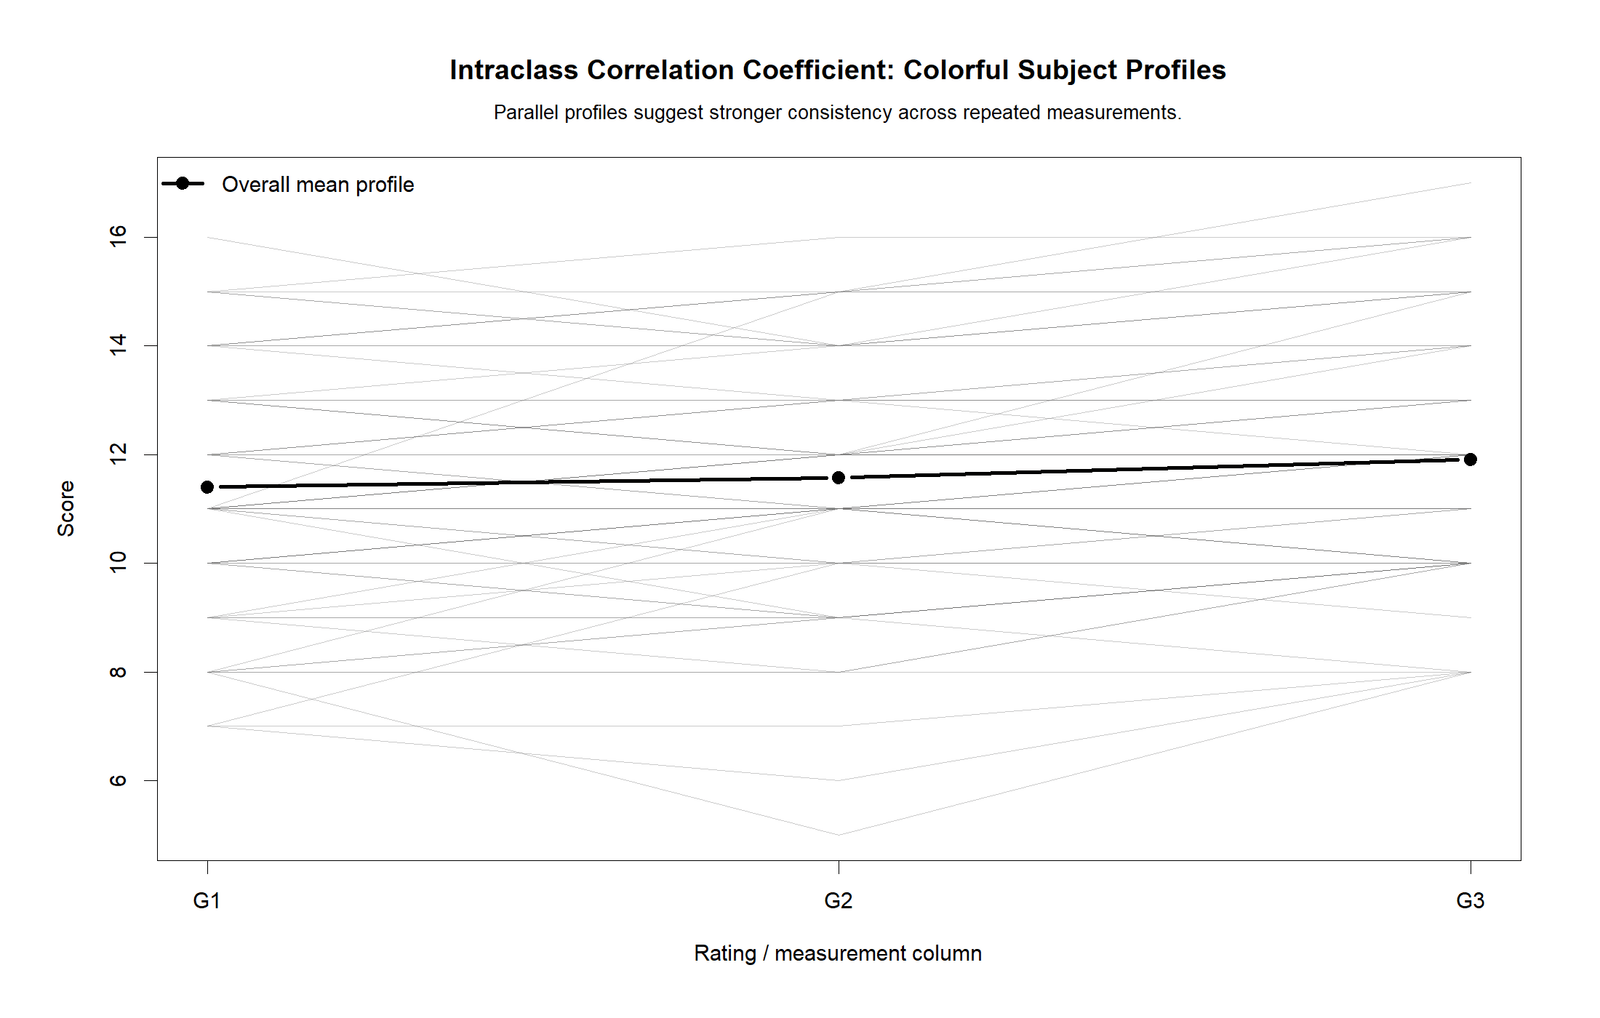
The R profile chart confirms the strong within-subject stability. Each subject tends to remain in a similar performance band across the repeated scores. The profiles are not random zigzags; they show a stable measurement structure.
This is exactly what ICC is designed to detect. A high ICC is not just a high average score. It means repeated measurements reliably preserve differences among subjects.
R Chart 3: Colorful ICC Model Comparison
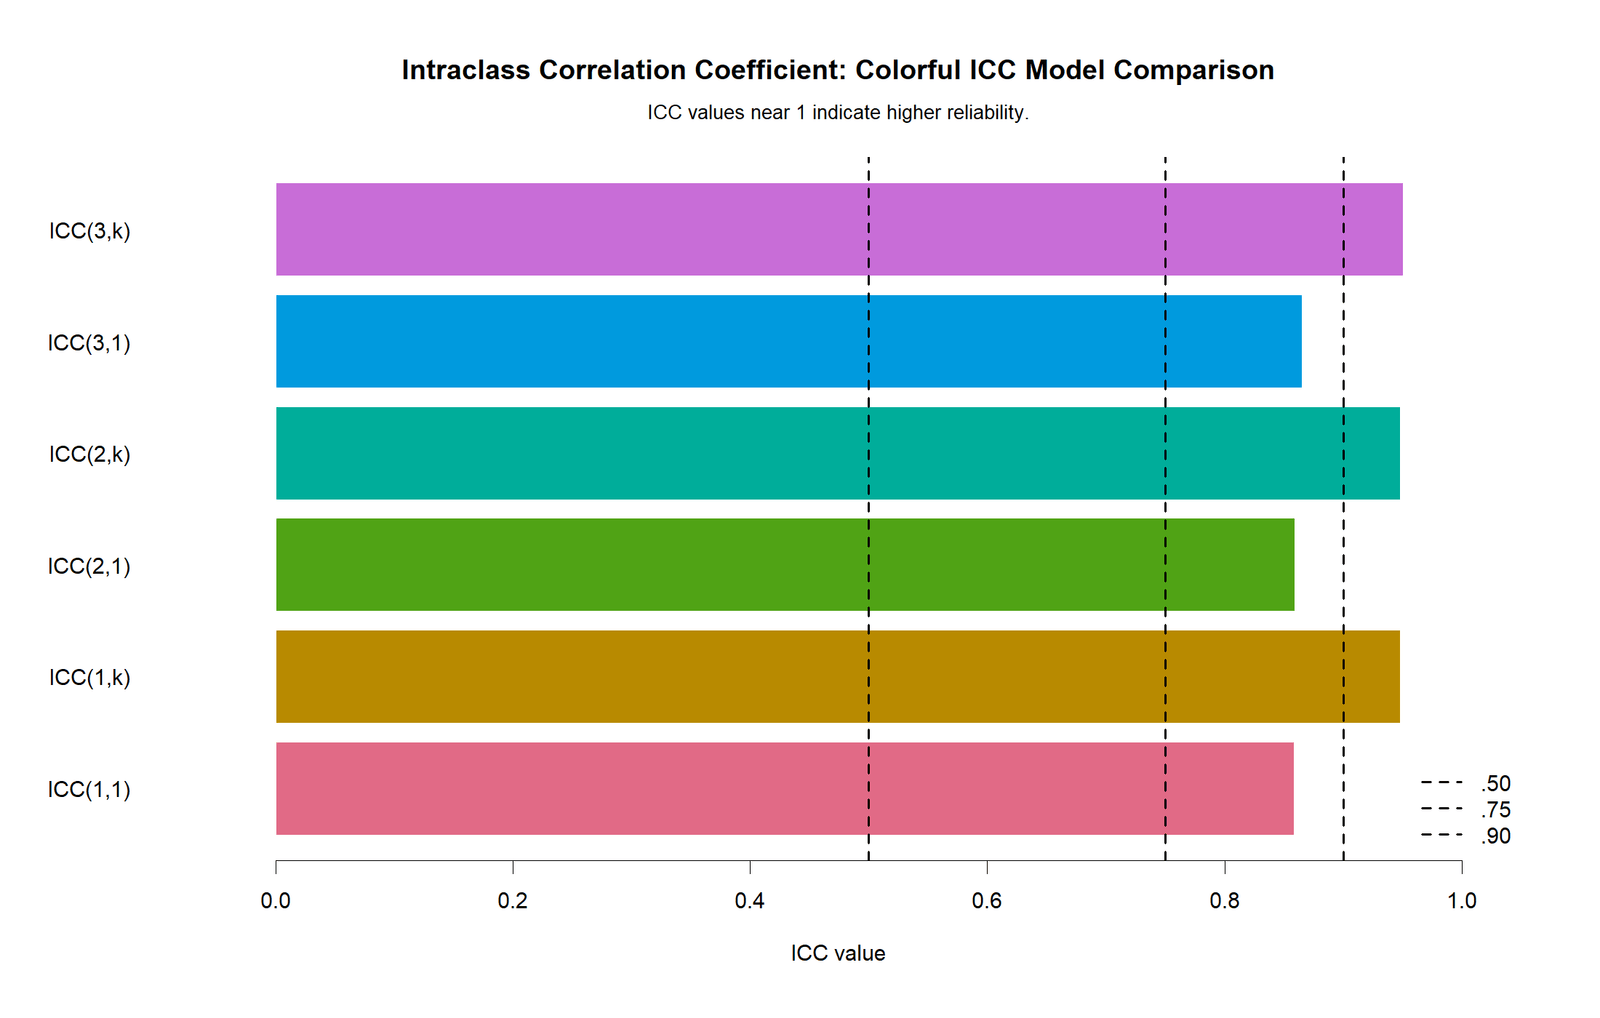
The R model comparison again shows excellent reliability for every reported ICC model. ICC(1,1) and ICC(2,1) are about 0.955, ICC(3,1) is about 0.991, and the average-measure models are above 0.984. The highest result is ICC(3,k) at about 0.997.
This chart is the best visual for explaining single-measure versus average-measure reliability. If a researcher plans to use only one rater or one measurement, the single-measure ICC is the relevant value. If the final score is an average of three measurements, the average-measure ICC is the relevant value.
R Chart 4: Colorful Pairwise Correlation Heatmap
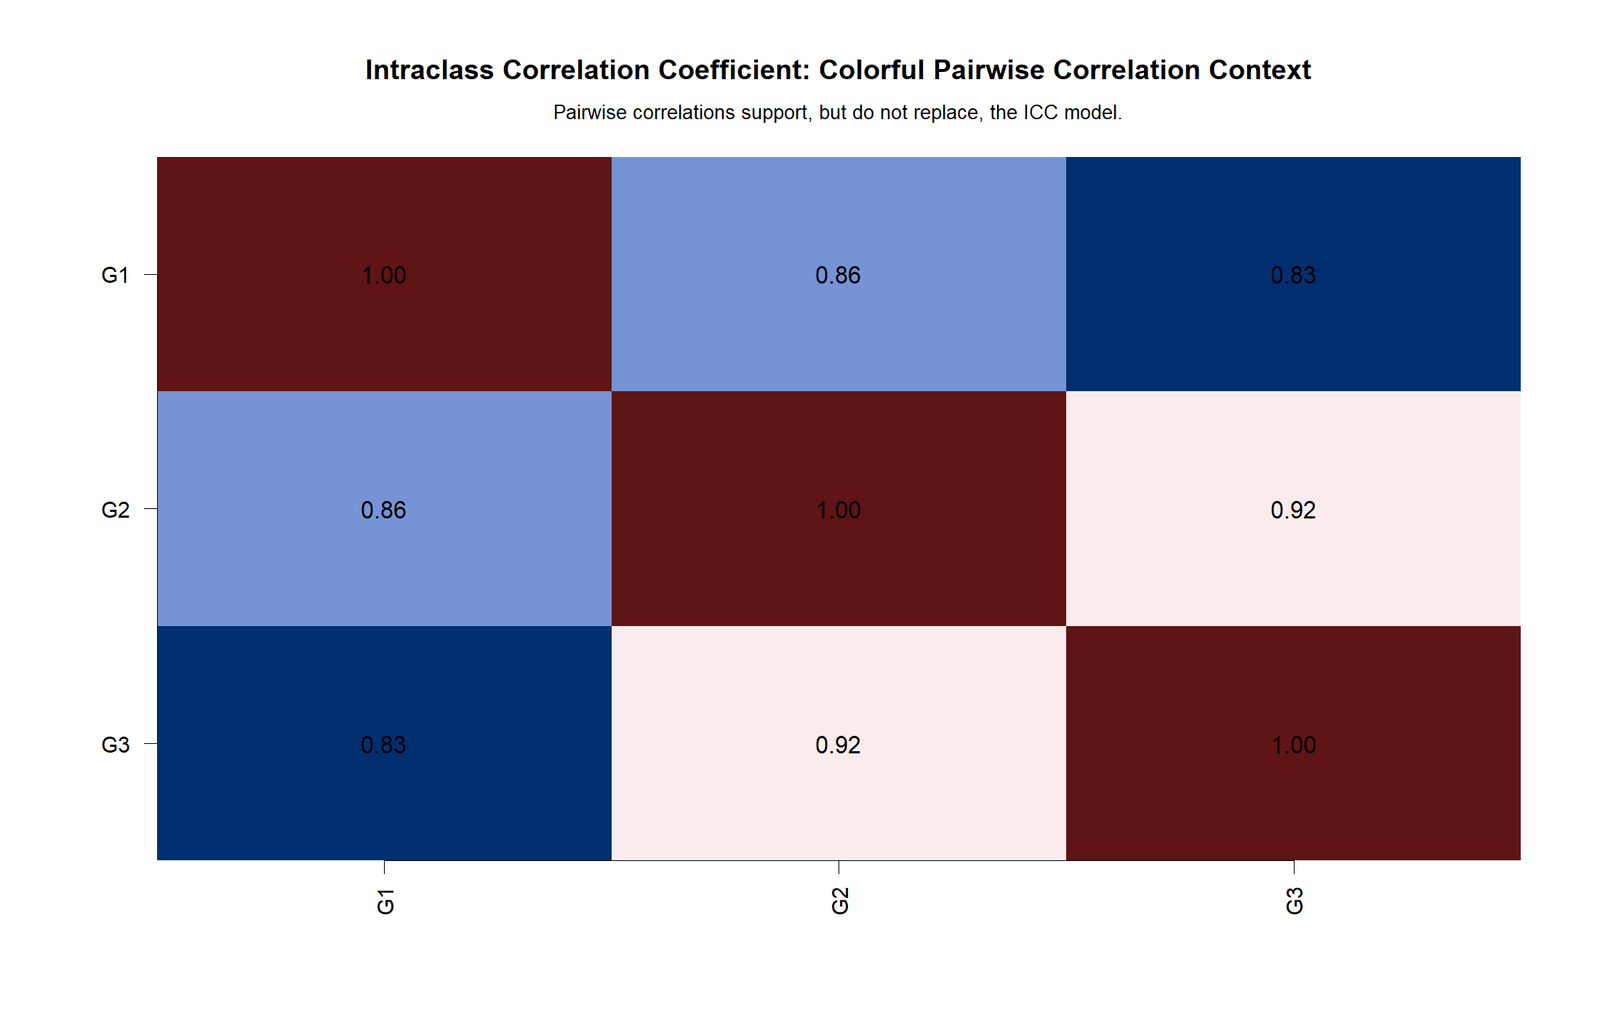
The R heatmap confirms that the repeated score columns are strongly related. High pairwise correlations are expected when ICC is high, because subjects who score high on one column also tend to score high on the other columns.
The heatmap should be described as a supporting diagnostic, not the final reliability test. ICC remains the main statistic because it accounts for the repeated-measurement design in a single reliability coefficient.
R Chart 5: Colorful Variance Components
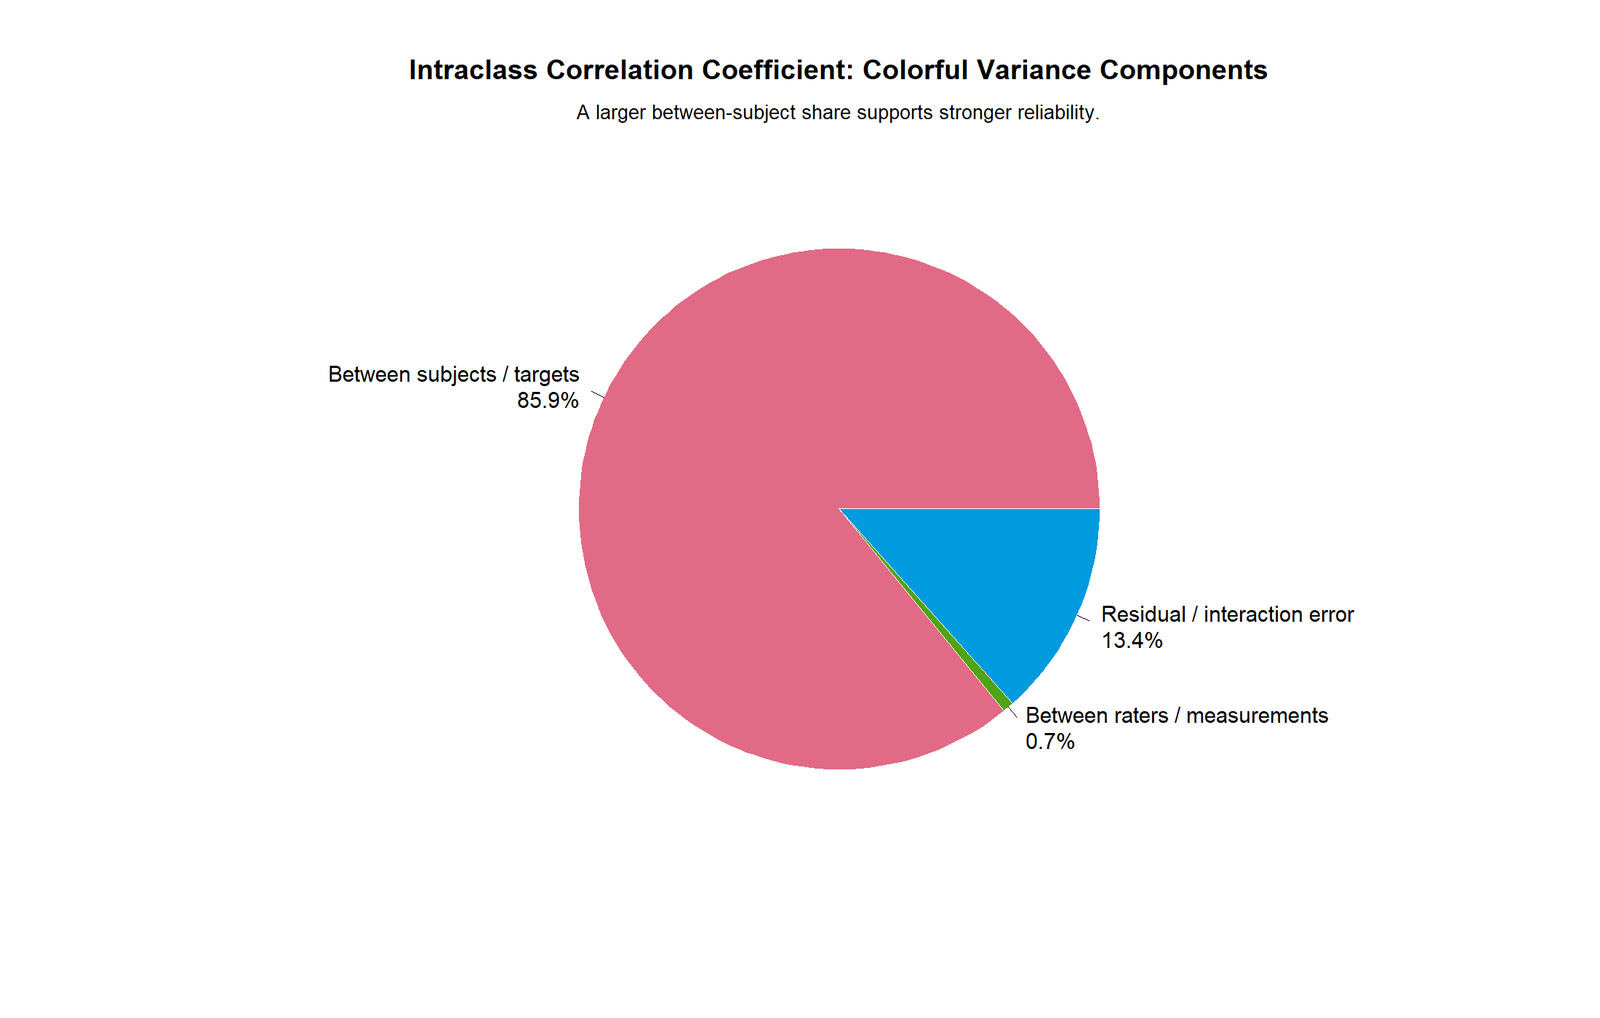
The R variance component chart repeats the central explanation: the subject component dominates the error component. This is why the model estimates excellent reliability. When subject differences are large and residual error is small, ICC approaches 1.
This is also the best visual for teaching the formula. ICC is essentially a signal-to-total-variation ratio. In this dataset, the signal is the stable difference between subjects, and the noise is the small residual disagreement among repeated measurements.
R Chart 6: Colorful Subject Mean vs Within-Subject Spread
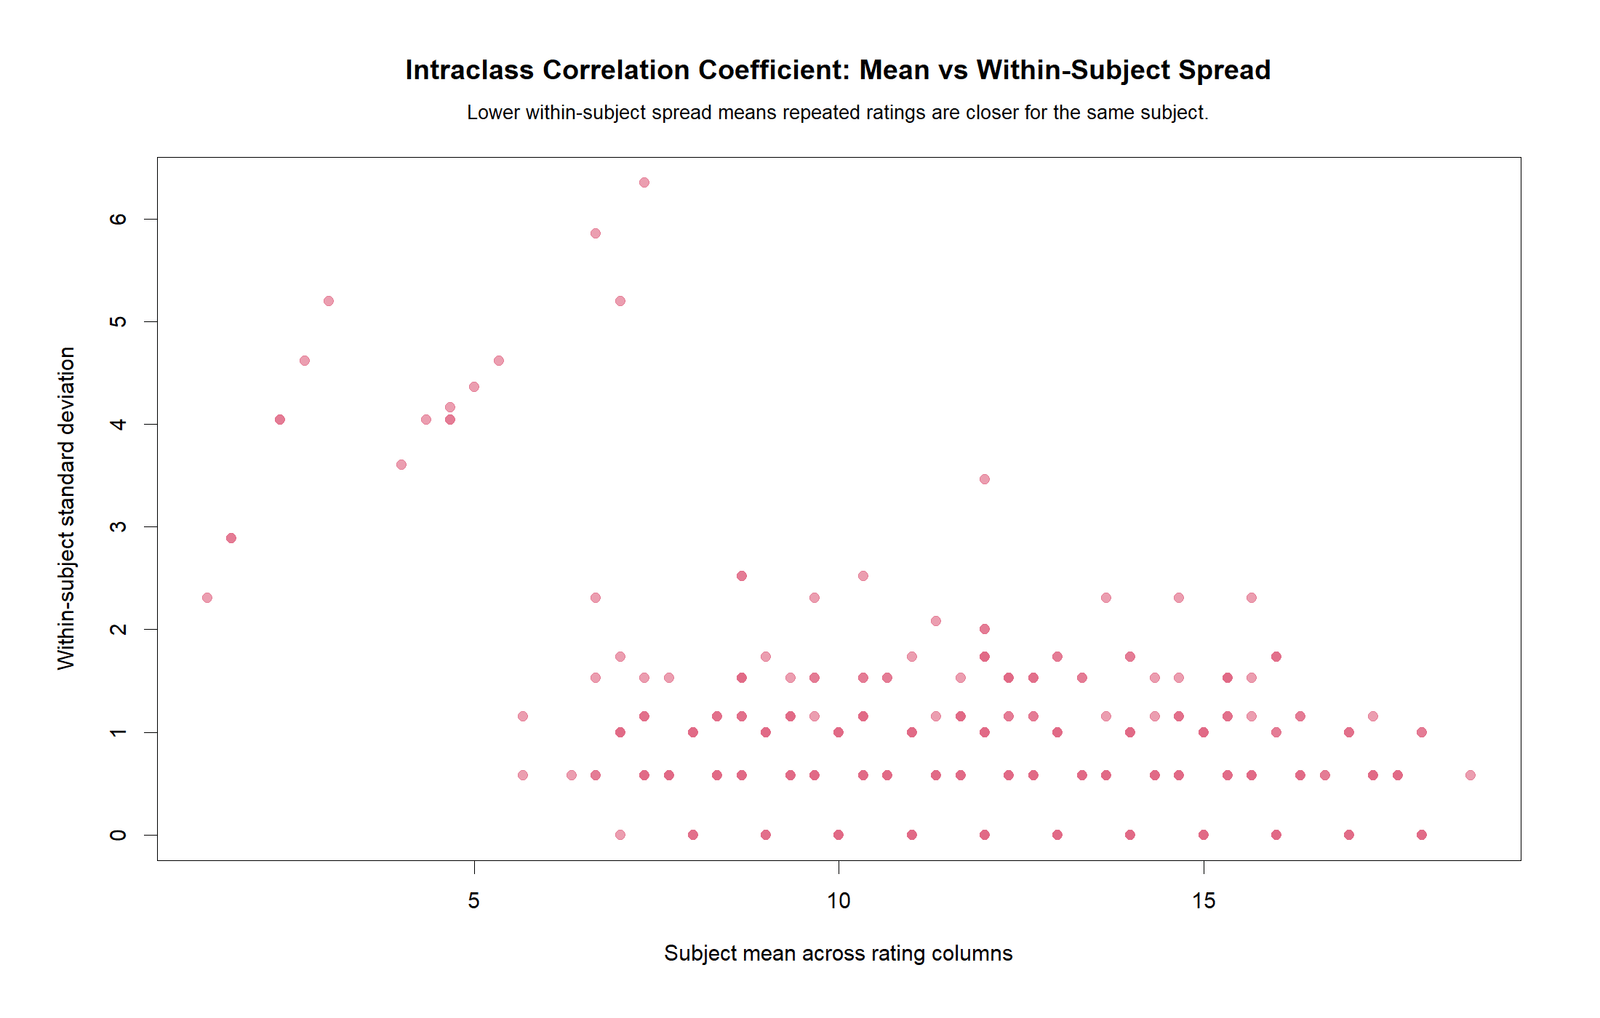
The final R chart confirms that the sample contains clear differences in subject means along with small repeated-measurement spread inside most subjects. This combination is the visual signature of excellent ICC reliability.
When writing a results paragraph, this chart supports the statement that reliability is high because measurement error is small relative to between-subject differences. It also helps readers understand why averaging G1, G2 and G3 is statistically defensible.
SPSS, R, Python and Excel Workflows for ICC
The same Intraclass Correlation Coefficient analysis can be reproduced in all four tools. The workflow is similar: arrange data with one row per subject and one column per repeated rating, calculate variance components, choose the ICC model and report the value with interpretation.
| Software | Main Steps | Best Use |
|---|---|---|
| SPSS | Analyze > Scale > Reliability Analysis; move G1, G2 and G3 into items; request Intraclass Correlation Coefficient; choose one-way random, two-way random or two-way mixed model. | Formal output PDF, classroom submission and thesis reporting. |
| Python | Read data, reshape if needed, calculate ANOVA components manually or use a reliability package, then plot rating means, profiles, model comparison and variance components. | Automated chart production and reproducible reporting. |
| R | Use a reliability package such as psych or irr, or calculate formulas manually from mean squares, then validate charts with ggplot2. | Statistical validation and publication visuals. |
| Excel | Use row means, column means, grand mean, sum of squares, mean squares and formulas for ICC(1), ICC(2) and ICC(3). | Step-by-step teaching and fully worked formula explanation. |
Code Blocks for Intraclass Correlation Coefficient
SPSS Syntax for Intraclass Correlation Coefficient
* Intraclass Correlation Coefficient in SPSS.
* Repeated measurement columns: G1 G2 G3.

OUTPUT CLOSE ALL.
OUTPUT NEW NAME=ICC_Output.

RELIABILITY
  /VARIABLES=G1 G2 G3
  /SCALE('G1 G2 G3') ALL
  /MODEL=ALPHA
  /STATISTICS=DESCRIPTIVE SCALE CORR ANOVA
  /ICC=MODEL(MIXED) TYPE(CONSISTENCY) CIN=95 TESTVAL=0.

* Optional absolute-agreement model for sampled raters.
RELIABILITY
  /VARIABLES=G1 G2 G3
  /SCALE('G1 G2 G3') ALL
  /MODEL=ALPHA
  /STATISTICS=DESCRIPTIVE SCALE CORR ANOVA
  /ICC=MODEL(RANDOM) TYPE(ABSOLUTE) CIN=95 TESTVAL=0.

OUTPUT EXPORT
  /CONTENTS EXPORT=VISIBLE
  /PDF DOCUMENTFILE='Intraclass-Correlation-Coefficient-SPSS-Output.pdf'.
Python Code for ICC from Mean Squares
import pandas as pd
import numpy as np

# Data must be wide: one row per subject, repeated ratings in columns.
df = pd.read_csv("dataset.csv")
ratings = df[["G1", "G2", "G3"]].dropna().astype(float)

n, k = ratings.shape
grand_mean = ratings.values.mean()
subject_means = ratings.mean(axis=1)
rating_means = ratings.mean(axis=0)

ss_subject = k * ((subject_means - grand_mean) ** 2).sum()
ss_rater = n * ((rating_means - grand_mean) ** 2).sum()
ss_total = ((ratings - grand_mean) ** 2).to_numpy().sum()
ss_error = ss_total - ss_subject - ss_rater
ss_within = ((ratings.sub(subject_means, axis=0)) ** 2).to_numpy().sum()

df_subject = n - 1
df_rater = k - 1
df_error = (n - 1) * (k - 1)
df_within = n * (k - 1)

ms_subject = ss_subject / df_subject
ms_rater = ss_rater / df_rater
ms_error = ss_error / df_error
ms_within = ss_within / df_within

icc_1_1 = (ms_subject - ms_within) / (ms_subject + (k - 1) * ms_within)
icc_1_k = (ms_subject - ms_within) / ms_subject
icc_2_1 = (ms_subject - ms_error) / (ms_subject + (k - 1) * ms_error + k * (ms_rater - ms_error) / n)
icc_2_k = (ms_subject - ms_error) / (ms_subject + (ms_rater - ms_error) / n)
icc_3_1 = (ms_subject - ms_error) / (ms_subject + (k - 1) * ms_error)
icc_3_k = (ms_subject - ms_error) / ms_subject

print("n subjects:", n)
print("k ratings:", k)
print("Grand mean:", round(grand_mean, 4))
print("ICC(1,1):", round(icc_1_1, 4))
print("ICC(1,k):", round(icc_1_k, 4))
print("ICC(2,1):", round(icc_2_1, 4))
print("ICC(2,k):", round(icc_2_k, 4))
print("ICC(3,1):", round(icc_3_1, 4))
print("ICC(3,k):", round(icc_3_k, 4))
R Code for Intraclass Correlation Coefficient
# Intraclass Correlation Coefficient in R
# Data must be wide: one row per subject, repeated ratings in columns.

df <- read.csv("dataset.csv")
ratings <- na.omit(df[, c("G1", "G2", "G3")])
ratings <- data.frame(lapply(ratings, as.numeric))

n <- nrow(ratings)
k <- ncol(ratings)
grand_mean <- mean(as.matrix(ratings))
subject_means <- rowMeans(ratings)
rating_means <- colMeans(ratings)

ss_subject <- k * sum((subject_means - grand_mean)^2)
ss_rater <- n * sum((rating_means - grand_mean)^2)
ss_total <- sum((as.matrix(ratings) - grand_mean)^2)
ss_error <- ss_total - ss_subject - ss_rater
ss_within <- sum((as.matrix(ratings) - subject_means)^2)

ms_subject <- ss_subject / (n - 1)
ms_rater <- ss_rater / (k - 1)
ms_error <- ss_error / ((n - 1) * (k - 1))
ms_within <- ss_within / (n * (k - 1))

icc_1_1 <- (ms_subject - ms_within) / (ms_subject + (k - 1) * ms_within)
icc_1_k <- (ms_subject - ms_within) / ms_subject
icc_2_1 <- (ms_subject - ms_error) / (ms_subject + (k - 1) * ms_error + k * (ms_rater - ms_error) / n)
icc_2_k <- (ms_subject - ms_error) / (ms_subject + (ms_rater - ms_error) / n)
icc_3_1 <- (ms_subject - ms_error) / (ms_subject + (k - 1) * ms_error)
icc_3_k <- (ms_subject - ms_error) / ms_subject

round(c(
  ICC_1_1 = icc_1_1,
  ICC_1_k = icc_1_k,
  ICC_2_1 = icc_2_1,
  ICC_2_k = icc_2_k,
  ICC_3_1 = icc_3_1,
  ICC_3_k = icc_3_k
), 4)
Excel Formulas for ICC
Assume repeated ratings are in B2:D21.

n subjects:
=COUNT(B2:B21)

k ratings:
=COUNTA(B1:D1)

Grand mean:
=AVERAGE(B2:D21)

Subject mean for row 2:
=AVERAGE(B2:D2)

Rating mean for G1:
=AVERAGE(B2:B21)

SS_subject:
=k*SUMXMY2(subject_mean_range, grand_mean_repeated_range)

SS_rater:
=n*SUMXMY2(rating_mean_range, grand_mean_repeated_range)

SS_total:
=SUMXMY2(all_scores_range, grand_mean_repeated_range)

SS_error:
=SS_total-SS_subject-SS_rater

MS_subject:
=SS_subject/(n-1)

MS_rater:
=SS_rater/(k-1)

MS_error:
=SS_error/((n-1)*(k-1))

ICC(3,k):
=(MS_subject-MS_error)/MS_subject
APA Reporting Wording for Intraclass Correlation Coefficient
When reporting ICC, always include the model, measure type, coefficient value and interpretation. If your software provides confidence intervals, include them after the ICC value. Do not report only “ICC was significant,” because reliability is judged mainly by the size and precision of the coefficient.
APA-Style Full Report
An intraclass correlation coefficient was computed to evaluate reliability across three repeated grade measurements, G1, G2 and G3, for 20 subjects. A two-way mixed-effects average-measure consistency model was selected because the same fixed repeated measurements were used and the reliability of the average score was the main target. The average-measure ICC was excellent, ICC(3,k) = .997. The corresponding single-measure consistency coefficient was also excellent, ICC(3,1) = .991. These results indicate that the repeated measurements were highly consistent and that averaging G1, G2 and G3 provides a very reliable score.
Short APA-Style Version
The repeated G1, G2 and G3 measurements showed excellent reliability using a two-way mixed-effects average-measure consistency model, ICC(3,k) = .997. The result indicates that the average repeated score is highly reliable for distinguishing subjects.
Absolute-Agreement Version
Using a two-way random-effects average-measure absolute-agreement model, reliability remained excellent, ICC(2,k) = .985. This indicates strong agreement for the average of the three measurements when the rater or measurement set is treated as sampled from a wider population.
Common Mistakes When Using ICC
| Mistake | Why It Is a Problem | Better Practice |
|---|---|---|
| Reporting “ICC = .997” without model name | Readers cannot know whether the result is ICC(1), ICC(2), ICC(3), single or average measure. | Write the full model, such as ICC(3,k) = .997. |
| Using consistency when absolute agreement is required | Consistency can stay high even if one rater is systematically higher or lower. | Use absolute agreement when exact matching matters. |
| Reporting average-measure ICC for a single rating decision | Average-measure ICC can overstate reliability if the user will only use one rating. | Use single-measure ICC when decisions are based on one score. |
| Confusing ICC with Pearson correlation | Pearson correlation measures pairwise association, not full repeated-measure reliability. | Use ICC when multiple ratings measure the same target. |
| Ignoring confidence intervals | A point estimate alone hides uncertainty. | Report the confidence interval from SPSS, R or Python when available. |
Downloads and Resources
Use the following resources to verify the Intraclass Correlation Coefficient result and reproduce the charts. Keep the filenames unchanged when uploading to WordPress so the links remain predictable.
FAQs About Intraclass Correlation Coefficient
What does Intraclass Correlation Coefficient measure?
It measures reliability, agreement or consistency among repeated ratings or measurements of the same subjects. It estimates how much observed variation is due to true subject differences compared with measurement error.
What is a good Intraclass Correlation Coefficient?
A common guide is below .50 = poor, .50 to .75 = moderate, .75 to .90 = good and .90 or higher = excellent. The worked result, ICC(3,k) = .9968, is excellent.
What is the difference between ICC(2) and ICC(3)?
ICC(2) is a two-way random-effects model and is used when raters or measurements are sampled from a wider population. ICC(3) is a two-way mixed-effects model and is used when the same fixed raters or repeated measurements are the only raters of interest.
What is the difference between single-measure and average-measure ICC?
Single-measure ICC estimates reliability for one rating or measurement. Average-measure ICC estimates reliability for the mean of all k ratings. Average-measure ICC is usually higher because averaging reduces error.
How do I calculate Intraclass Correlation Coefficient in Excel?
Arrange repeated scores in columns, calculate row means, column means, the grand mean, sum of squares, mean squares and then apply the ICC formulas. The worked file uses MS_subject = 39.4596 and MS_error = 0.1254, giving ICC(3,k) = 0.9968.
How do I report ICC in APA style?
Report the model, measure type, ICC value, confidence interval if available and interpretation. For example: “A two-way mixed-effects average-measure consistency ICC showed excellent reliability, ICC(3,k) = .997.”
Can ICC be used instead of Pearson correlation?
Not always. Pearson correlation is for pairwise association between variables. ICC is for reliability across repeated measurements of the same target. Use ICC when the columns are intended to measure the same construct or subject repeatedly.

