
.abx-article{–ink:#102238;–muted:#52657a;–line:#dce5ed;–paper:#fff;–soft:#f4f8fb;–navy:#092a45;–teal:#0d7774;–cyan:#dff7f6;–amber:#f4a340;–amber-soft:#fff4df;–red:#a83232;–red-soft:#fff0f0;–green:#176b47;–green-soft:#e9f8f0;–violet:#6654b8;–violet-soft:#f0edff;–shadow:0 16px 45px rgba(18,44,67,.10);font-family:Inter,ui-sans-serif,system-ui,-apple-system,BlinkMacSystemFont,”Segoe UI”,Arial,sans-serif;color:var(–ink);line-height:1.72;display:block;width:100%!important;max-width:100%!important;margin:0 auto!important;background:var(–paper);font-size:17px;overflow-x:clip}
.abx-article *{box-sizing:border-box}.abx-article a{color:#075f72;text-decoration-thickness:1px;text-underline-offset:3px}.abx-article a:hover{color:#043f4c}.abx-shell{width:100%;max-width:1480px;margin:0 auto;padding:clamp(18px,2.8vw,42px)}.abx-hero{position:relative;overflow:hidden;border-radius:28px;background:linear-gradient(132deg,#07263f 0%,#0b4b61 55%,#0a7770 100%);color:#fff;padding:clamp(28px,6vw,68px);box-shadow:var(–shadow)}.abx-hero:before{content:””;position:absolute;right:-90px;top:-120px;width:360px;height:360px;border-radius:50%;background:rgba(255,255,255,.07)}.abx-hero:after{content:””;position:absolute;left:-110px;bottom:-180px;width:390px;height:390px;border-radius:50%;background:rgba(244,163,64,.10)}.abx-hero>*{position:relative;z-index:1}.abx-kicker{display:inline-flex;align-items:center;gap:9px;padding:7px 12px;border:1px solid rgba(255,255,255,.25);border-radius:999px;background:rgba(255,255,255,.09);font-size:.78rem;font-weight:800;letter-spacing:.08em;text-transform:uppercase}.abx-kicker i{width:9px;height:9px;border-radius:50%;background:#ffbd62;box-shadow:0 0 0 5px rgba(255,189,98,.16)}.abx-hero h1{font-size:clamp(2.15rem,5.2vw,4.65rem);line-height:1.04;letter-spacing:-.045em;margin:22px 0 18px;max-width:1000px;color:#fff}.abx-hero .abx-lead{font-size:clamp(1.05rem,2vw,1.34rem);max-width:900px;color:#e9f7fb;margin:0}.abx-badges{display:flex;flex-wrap:wrap;gap:10px;margin-top:25px}.abx-badge{padding:8px 12px;border-radius:999px;background:rgba(255,255,255,.11);border:1px solid rgba(255,255,255,.19);font-size:.84rem;font-weight:750}.abx-hero-result{margin-top:28px;display:grid;grid-template-columns:repeat(4,minmax(0,1fr));gap:12px}.abx-hero-metric{background:rgba(255,255,255,.10);border:1px solid rgba(255,255,255,.16);border-radius:16px;padding:14px}.abx-hero-metric span{display:block;color:#cdeaf0;font-size:.78rem;text-transform:uppercase;letter-spacing:.05em;font-weight:800}.abx-hero-metric strong{display:block;margin-top:4px;font-size:1.28rem;color:#fff}.abx-ad{display:flex;align-items:center;justify-content:center;min-height:96px;margin:26px 0;border:1px dashed #b8c6d1;border-radius:18px;background:#f8fafc;color:#718096;font-size:.78rem;letter-spacing:.14em;text-transform:uppercase}.abx-quick{display:grid;grid-template-columns:1.35fr .65fr;gap:20px;margin:28px 0}.abx-card{min-width:0;max-width:100%;border:1px solid var(–line);border-radius:22px;background:#fff;box-shadow:0 10px 30px rgba(21,48,70,.06);padding:clamp(19px,3vw,30px)}.abx-card h2,.abx-card h3{margin-top:0}.abx-answer{background:linear-gradient(145deg,#f2fbfa,#fff);border-color:#bfe5e2}.abx-answer .abx-verdict{display:inline-flex;align-items:center;gap:9px;padding:8px 12px;border-radius:999px;background:var(–green-soft);color:var(–green);font-weight:850;font-size:.84rem}.abx-answer .abx-verdict:before{content:”✓”;display:grid;place-items:center;width:22px;height:22px;border-radius:50%;background:var(–green);color:#fff}.abx-answer h2{font-size:clamp(1.55rem,3vw,2.25rem);line-height:1.15;margin:15px 0 10px}.abx-mini-table{display:grid;gap:10px}.abx-mini-row{display:flex;justify-content:space-between;gap:20px;padding:11px 0;border-bottom:1px solid var(–line)}.abx-mini-row:last-child{border-bottom:0}.abx-mini-row span{color:var(–muted)}.abx-mini-row strong{text-align:right}.abx-toc{margin:26px 0;border-radius:22px;background:var(–navy);color:#fff;padding:24px}.abx-toc h2{color:#fff;margin:0 0 14px;font-size:1.2rem}.abx-toc-grid{display:grid;grid-template-columns:repeat(3,minmax(0,1fr));gap:8px 20px}.abx-toc a{color:#d9f6f5;text-decoration:none;padding:7px 0;display:block;border-bottom:1px solid rgba(255,255,255,.12)}.abx-toc a:hover{color:#fff}.abx-section{scroll-margin-top:24px;margin:54px 0}.abx-section-head{display:grid;grid-template-columns:auto 1fr;align-items:start;gap:14px;margin-bottom:20px}.abx-num{width:42px;height:42px;border-radius:13px;background:var(–navy);color:#fff;display:grid;place-items:center;font-weight:900}.abx-section-head h2{margin:0;font-size:clamp(1.65rem,3.4vw,2.65rem);line-height:1.15;letter-spacing:-.025em}.abx-section-head p{grid-column:2;margin:5px 0 0;color:var(–muted);max-width:920px}.abx-grid-2{display:grid;grid-template-columns:repeat(2,minmax(0,1fr));gap:20px}.abx-grid-2>*,.abx-grid-3>*,.abx-grid-4>*,.abx-chart-grid>*,.abx-downloads>*,.abx-related>*,.abx-quick>*{min-width:0}.abx-grid-3{display:grid;grid-template-columns:repeat(3,minmax(0,1fr));gap:18px}.abx-grid-4{display:grid;grid-template-columns:repeat(4,minmax(0,1fr));gap:14px}.abx-callout{border-radius:18px;padding:18px 20px;border-left:5px solid var(–teal);background:var(–cyan);margin:20px 0}.abx-callout strong{color:#084f4c}.abx-warning{border-left-color:var(–red);background:var(–red-soft)}.abx-warning strong{color:var(–red)}.abx-note{border-left-color:var(–amber);background:var(–amber-soft)}.abx-note strong{color:#875311}.abx-formula{border:1px solid #cbd8e3;background:linear-gradient(180deg,#fff,#f7fafc);border-radius:20px;padding:22px;margin:18px 0;text-align:center;overflow:visible}.abx-formula .eq{font-family:”Cambria Math”,”Times New Roman”,serif;font-size:clamp(1.08rem,2.2vw,1.5rem);white-space:normal;overflow-wrap:anywhere;word-break:normal;line-height:1.55}.abx-formula p{margin:8px auto 0;color:var(–muted);max-width:850px;text-align:left;font-size:.94rem}.abx-pill-list{display:flex;flex-wrap:wrap;gap:10px;margin:15px 0}.abx-pill{background:var(–soft);border:1px solid var(–line);border-radius:999px;padding:8px 12px;font-weight:750;font-size:.88rem}.abx-flow{display:grid;grid-template-columns:repeat(5,minmax(0,1fr));gap:10px;counter-reset:flow}.abx-step{position:relative;padding:18px 14px 16px;border:1px solid var(–line);border-radius:18px;background:#fff;min-height:148px}.abx-step:before{counter-increment:flow;content:counter(flow);display:grid;place-items:center;width:30px;height:30px;border-radius:10px;background:var(–teal);color:#fff;font-weight:900;margin-bottom:10px}.abx-step h3{font-size:1rem;margin:0 0 6px}.abx-step p{font-size:.9rem;color:var(–muted);margin:0}.abx-table-wrap{min-width:0;max-width:100%;overflow-x:auto;border:1px solid var(–line);border-radius:18px;background:#fff}.abx-table{width:100%;border-collapse:collapse;min-width:720px}.abx-table.abx-compact{min-width:0}.abx-table th{background:var(–navy);color:#fff;text-align:left;padding:13px 14px;font-size:.85rem;letter-spacing:.02em}.abx-table td{padding:13px 14px;border-bottom:1px solid var(–line);vertical-align:top}.abx-table tbody tr:nth-child(even){background:#f8fafc}.abx-table tbody tr:last-child td{border-bottom:0}.abx-stat-grid{display:grid;grid-template-columns:repeat(4,minmax(0,1fr));gap:12px;margin:16px 0}.abx-stat{border:1px solid var(–line);border-radius:16px;padding:16px;background:#fff}.abx-stat span{display:block;color:var(–muted);font-size:.78rem;font-weight:800;text-transform:uppercase;letter-spacing:.05em}.abx-stat strong{display:block;font-size:1.34rem;margin-top:4px}.abx-stat small{display:block;color:var(–muted);margin-top:4px}.abx-result-panel{border-radius:22px;background:linear-gradient(145deg,#082c47,#0b5966);color:#fff;padding:26px}.abx-result-panel h3{color:#fff;margin-top:0;font-size:1.45rem}.abx-result-panel p{color:#e5f6f7}.abx-result-panel .abx-result-big{font-size:clamp(2rem,5vw,3.7rem);line-height:1;font-weight:950;color:#fff;margin:10px 0}.abx-result-panel .abx-result-tag{display:inline-block;padding:8px 12px;border-radius:999px;background:rgba(255,255,255,.12);border:1px solid rgba(255,255,255,.18);font-weight:800}.abx-figure{min-width:0;max-width:100%;margin:0;border:1px solid var(–line);border-radius:22px;overflow:hidden;background:#fff;box-shadow:0 10px 30px rgba(21,48,70,.06)}.abx-figure img{display:block;width:100%;height:auto;background:#f3f6f8}.abx-figure figcaption{padding:18px 20px}.abx-figure h3{font-size:1.08rem;margin:0 0 6px}.abx-figure p{margin:0;color:var(–muted);font-size:.94rem}.abx-chart-grid{display:grid;grid-template-columns:repeat(2,minmax(0,1fr));gap:20px}.abx-chart-grid .abx-wide{grid-column:1/-1}.abx-code{min-width:0;max-width:100%;position:relative;background:#071d2d;color:#e6f2f7;border-radius:18px;overflow:auto;padding:20px;margin:16px 0;box-shadow:inset 0 0 0 1px rgba(255,255,255,.07)}.abx-code code{display:block;white-space:pre;min-width:max-content;font-family:”SFMono-Regular”,Consolas,”Liberation Mono”,monospace;font-size:.88rem;line-height:1.65}.abx-code-label{display:inline-block;margin-bottom:8px;color:#7ee7db;font-size:.76rem;font-weight:900;letter-spacing:.08em;text-transform:uppercase}.abx-downloads{display:grid;grid-template-columns:repeat(4,minmax(0,1fr));gap:14px}.abx-download{display:flex;flex-direction:column;min-height:190px;padding:20px;border-radius:20px;border:1px solid var(–line);background:#fff;text-decoration:none!important;color:var(–ink)!important;box-shadow:0 10px 30px rgba(21,48,70,.06);transition:.2s transform,.2s box-shadow}.abx-download:hover{transform:translateY(-3px);box-shadow:0 16px 38px rgba(21,48,70,.12)}.abx-file-icon{width:46px;height:46px;border-radius:14px;display:grid;place-items:center;background:var(–violet-soft);color:var(–violet);font-weight:950;margin-bottom:16px}.abx-download strong{font-size:1.05rem}.abx-download span{color:var(–muted);font-size:.88rem;margin-top:6px}.abx-download em{margin-top:auto;padding-top:16px;color:#075f72;font-style:normal;font-weight:850}.abx-checks{display:grid;gap:10px}.abx-check{position:relative;padding:13px 14px 13px 44px;border:1px solid var(–line);border-radius:15px;background:#fff}.abx-check:before{content:”✓”;position:absolute;left:14px;top:13px;width:22px;height:22px;border-radius:50%;display:grid;place-items:center;background:var(–green-soft);color:var(–green);font-weight:950}.abx-faq details{border:1px solid var(–line);border-radius:17px;background:#fff;margin:11px 0;overflow:hidden}.abx-faq summary{cursor:pointer;font-weight:850;padding:17px 20px;list-style:none}.abx-faq summary::-webkit-details-marker{display:none}.abx-faq summary:after{content:”+”;float:right;color:var(–teal);font-size:1.4rem;line-height:1}.abx-faq details[open] summary:after{content:”−”}.abx-faq .abx-faq-answer{padding:0 20px 18px;color:var(–muted)}.abx-related{display:grid;grid-template-columns:repeat(3,minmax(0,1fr));gap:12px}.abx-related a{display:block;border:1px solid var(–line);border-radius:15px;padding:14px 16px;background:#fff;text-decoration:none;font-weight:800}.abx-footer-note{border-radius:22px;background:var(–soft);border:1px solid var(–line);padding:22px;color:var(–muted)}.abx-back{display:inline-flex;align-items:center;gap:8px;border-radius:999px;background:var(–navy);color:#fff!important;text-decoration:none!important;padding:11px 16px;font-weight:850;margin-top:18px}.abx-sr{position:absolute!important;width:1px!important;height:1px!important;padding:0!important;margin:-1px!important;overflow:hidden!important;clip:rect(0,0,0,0)!important;white-space:nowrap!important;border:0!important}
@media(max-width:960px){.abx-hero-result,.abx-grid-4,.abx-stat-grid,.abx-downloads{grid-template-columns:repeat(2,minmax(0,1fr))}.abx-toc-grid,.abx-grid-3,.abx-related{grid-template-columns:repeat(2,minmax(0,1fr))}.abx-flow{grid-template-columns:repeat(2,minmax(0,1fr))}.abx-flow .abx-step:last-child{grid-column:1/-1}.abx-quick{grid-template-columns:1fr}}
@media(max-width:680px){.abx-article{font-size:16px;width:100%!important;max-width:100%!important;margin:0 auto!important}.abx-shell{padding:12px}.abx-hero{border-radius:20px;padding:26px 20px}.abx-hero h1{font-size:2.2rem}.abx-hero-result,.abx-grid-2,.abx-grid-3,.abx-grid-4,.abx-stat-grid,.abx-downloads,.abx-chart-grid,.abx-toc-grid,.abx-related,.abx-flow{grid-template-columns:1fr}.abx-chart-grid .abx-wide,.abx-flow .abx-step:last-child{grid-column:auto}.abx-card{border-radius:18px;padding:18px}.abx-section{margin:42px 0}.abx-section-head{grid-template-columns:36px 1fr;gap:11px}.abx-num{width:36px;height:36px}.abx-section-head p{grid-column:1/-1}.abx-table{min-width:650px}.abx-formula{padding:18px 12px;text-align:left}.abx-formula .eq{font-size:1.05rem}.abx-mini-row{align-items:flex-start;flex-direction:column;gap:2px}.abx-mini-row strong{text-align:left}}
.abx-seo-context{font-size:1.02rem;color:#31475d;margin:-5px 0 20px;max-width:1180px}
.abx-model{display:grid;grid-template-columns:1.05fr .95fr;gap:20px;align-items:stretch}
.abx-model .abx-card{height:100%}
.abx-hypothesis{border:1px solid var(–line);border-radius:18px;padding:20px;background:#fff}
.abx-hypothesis h3{margin:0 0 10px}
.abx-direction{display:grid;grid-template-columns:repeat(3,minmax(0,1fr));gap:12px;margin:16px 0}
.abx-direction>div{border:1px solid var(–line);border-radius:16px;padding:16px;background:var(–soft)}
.abx-keyword-box{border:1px solid #b9d8e2;border-radius:20px;background:linear-gradient(145deg,#eff9fc,#fff);padding:22px;margin:22px 0}
.abx-keyword-box h3{margin-top:0}
.abx-equation-lines{display:grid;gap:10px;text-align:left}
.abx-equation-line{display:grid;grid-template-columns:minmax(140px,.38fr) 1fr;gap:16px;align-items:start;padding:10px 0;border-bottom:1px solid var(–line)}
.abx-equation-line:last-child{border-bottom:0}
.abx-equation-line strong{color:var(–navy)}
@media(max-width:900px){.abx-model,.abx-direction{grid-template-columns:1fr}.abx-equation-line{grid-template-columns:1fr;gap:4px}}
body:has(.abx-article) .site-main>article>.entry-header,
body:has(.abx-article) main>article>.entry-header,
body:has(.abx-article) .single-post-header,
body:has(.abx-article) .single-entry-header,
body:has(.abx-article) .post-header:not(.abx-hero),
body:has(.abx-article) .post-hero:not(.abx-hero),
body:has(.abx-article) .page-header:has(.entry-title),
body:has(.abx-article) .page-header:has(.page-title),
body:has(.abx-article) .wp-block-post-title,
body:has(.abx-article) h1.entry-title,
body:has(.abx-article) h1.post-title,
body:has(.abx-article) h1.page-title,
body:has(.abx-article) .single-post-title{display:none!important}
body:has(.abx-article) .site-content,
body:has(.abx-article) .content-sidebar-wrap,
body:has(.abx-article) .site-grid,
body:has(.abx-article) .main-content-wrap{display:block!important;grid-template-columns:minmax(0,1fr)!important;width:100%!important;max-width:none!important;margin-left:auto!important;margin-right:auto!important}
body:has(.abx-article) #primary,
body:has(.abx-article) .content-area,
body:has(.abx-article) .site-main,
body:has(.abx-article) main.site-main,
body:has(.abx-article) .main-content,
body:has(.abx-article) .entry-content:has(.abx-article){float:none!important;flex:0 0 100%!important;width:100%!important;max-width:none!important;margin-left:auto!important;margin-right:auto!important;margin-top:0!important;padding-top:0!important}
body:has(.abx-article) #secondary,
body:has(.abx-article) .widget-area,
body:has(.abx-article) aside.sidebar,
body:has(.abx-article) .content-sidebar{display:none!important}
body:has(.abx-article) .abx-shell{width:min(1480px,100%)!important;max-width:1480px!important;margin-left:auto!important;margin-right:auto!important}
body:has(.abx-article) .abx-hero{width:100%!important;margin-left:auto!important;margin-right:auto!important}
Kolmogorov Smirnov Two Sample Test: Formula, Interpretation, Python, R, SPSS and Excel Guide
The Kolmogorov Smirnov Two Sample Test is a nonparametric procedure for comparing whether two independent samples come from the same distribution. This complete guide explains the Kolmogorov Smirnov Two Sample Test formula, null hypothesis, assumptions, empirical distribution functions, tied-data permutation p-values, and a worked example comparing student absences between female and male groups.
Empirical CDF comparison
Permutation p-value for ties
Python + R + SPSS + Excel
Full worked example
The Kolmogorov Smirnov Two Sample Test found no statistically significant difference between the full absence distributions of female and male students.
In this worked Kolmogorov Smirnov Two Sample Test example, the outcome variable was absences and the two independent groups were female and male students. The maximum empirical CDF gap was D = 0.050187, occurring at an absence count of 3. Because absence data are discrete and contain many ties, significance was evaluated using 10,000 fixed-size label permutations rather than the continuous-sample asymptotic approximation. The resulting permutation p-value was 0.505649, so the data do not provide evidence that the two complete distributions differ.
What does the Kolmogorov Smirnov Two Sample Test measure?
A whole-distribution comparison based on the largest gap between two empirical cumulative distribution functions.
The Kolmogorov Smirnov Two Sample Test, often shortened to the two-sample KS test, compares two independent samples by examining the empirical distribution of each sample at every observed value. Rather than focusing on only a difference in means, medians, or variances, the Kolmogorov Smirnov Two Sample Test looks at the greatest absolute separation between the two empirical cumulative distribution functions, usually written as F1(x) and F2(x).
This broader distributional focus is what makes the Kolmogorov Smirnov Two Sample Test valuable. If the samples differ in center, spread, or shape, the empirical CDFs may separate somewhere along the support of the data. The statistic D records the largest such gap. In the current worked example, the two distributions are the absence counts of female and male students.
That broader perspective is also why the test is often introduced alongside descriptive statistics, five-number summaries, and box-plot interpretation. Those summaries help readers see the shape of each sample, while the Kolmogorov Smirnov Two Sample Test turns the visual comparison into a formal inferential statement.
Why people use the Kolmogorov Smirnov Two Sample Test
Researchers use the Kolmogorov Smirnov Two Sample Test when they want a distribution-level comparison without assuming a particular parametric family. It is especially attractive when readers want more than a simple difference in average scores. Because the method relies on empirical CDFs, it can detect several kinds of distributional differences at once.
That makes the test conceptually different from a two-sample t test or even a Mann–Whitney-type rank test, each of which emphasizes a narrower question.
What the statistic means in plain language
The Kolmogorov Smirnov Two Sample Test statistic answers this question: at what data value do the two running cumulative proportions differ the most, and how large is that largest gap? In the absence example, the maximum difference was only 0.05019, meaning the two cumulative distributions were never more than about five percentage points apart at any observed absence count.
That relatively small separation is one reason the final p-value is not significant.
When should you use the Kolmogorov Smirnov Two Sample Test?
Use it when you want to compare two independent empirical distributions rather than only their averages.
The Kolmogorov Smirnov Two Sample Test is useful when you have two independent groups and a numeric variable, and when your main scientific question is whether the full distributions differ. If your goal is specifically to compare central tendency, other methods may be more direct. If your goal is a wider distributional comparison, the Kolmogorov Smirnov Two Sample Test is often appropriate.
Use it when
You want to compare the complete pattern of two independent samples, such as two groups of student absence counts, biomarker readings, or waiting times.
It is especially helpful when
You are interested in differences in location, spread, skew, or overall shape simultaneously, and you do not want to reduce the comparison to only one summary statistic.
Another method may be better when
You only care about mean differences, medians, or a specific regression model. In those cases, methods linked to hypothesis testing for a narrower target may be easier to interpret.
In practical data-analysis work, the Kolmogorov Smirnov Two Sample Test is especially helpful as a follow-up to a careful exploratory phase. Analysts often begin with histograms, frequency distributions, and mean–median–mode comparisons. If those descriptive tools suggest subtle differences across the entire support rather than only in one summary number, the KS framework becomes particularly informative.
Kolmogorov Smirnov Two Sample Test assumptions
Nonparametric does not mean assumption-free; it means the assumptions are different.
The Kolmogorov Smirnov Two Sample Test has a short but important assumption list. The two samples must be independent, the observations must come from the two groups without pairing or matching, and the outcome must be ordered numerically so that empirical cumulative distributions can be constructed. The method does not require normality, and that is one reason it is often grouped under nonparametric tests.
Independent samples
Each case belongs to exactly one group. In the present example, every student is classified as female or male, not both.
Numeric or ordered outcome
The variable absences is numeric and therefore supports ranking, ordering, and cumulative counting.
Appropriate reference distribution
For continuous tie-free data, standard asymptotic approximations are common. For discrete tied data, a permutation reference is more appropriate.
Because the absence counts include repeated values such as 0, 2, 4, and 6, the tie issue matters here. That is why the worked Kolmogorov Smirnov Two Sample Test uses 10,000 label permutations while keeping the female and male sample sizes fixed.
Another useful way to think about the assumptions is to connect them to study design. If the same students had been measured twice, a paired or repeated-measures method would have been needed instead. If the main inferential target were the difference in means under a roughly normal model, a t-based procedure would likely be more efficient. The Kolmogorov Smirnov Two Sample Test is the right tool precisely when the research goal is to compare the whole distribution under an independent-group design.
Null and alternative hypotheses
The test asks whether the two complete population distributions are the same.
Null hypothesis
H0: the distribution of absence counts is the same for female and male students. Equivalently, the two population CDFs are identical at all values of x.
Alternative hypothesis
H1: the distribution of absence counts differs between female and male students, so the two population CDFs are not identical somewhere along the support.
This framing is slightly broader than the null and alternative structure used in a null-and-alternative-hypothesis lesson for mean-based tests, because the object of inference is the entire distribution rather than a single parameter such as the mean.
Kolmogorov Smirnov Two Sample Test formula and tied-data permutation inference
The test statistic is the largest absolute difference between two empirical CDFs.
The statistic D is the supremum, or largest observed value, of the absolute difference between the two empirical CDFs. In practice, you compute each sample’s cumulative proportion at every observed value, take the absolute gap, and select the maximum.
How the empirical CDFs are built
For any absence count x, the female empirical CDF is the proportion of female observations less than or equal to x, and the male empirical CDF is the corresponding male proportion. The Kolmogorov Smirnov Two Sample Test compares these two functions value by value.
In the workbook, the support values range from 0 to 32, with 24 unique support points appearing across the combined sample.
Why the p-value uses permutations here
With discrete tied data, the classical continuous-reference p-value can be inaccurate. The analysis therefore uses a fixed-size label permutation strategy: the observed absence values are kept intact, but the female and male labels are repeatedly shuffled while preserving sample sizes 383 and 266. For each permutation, a new D statistic is computed. The p-value is the proportion of permutation statistics at least as large as the observed one.
This produces a distribution-sensitive p-value that is tailored to the actual tied structure of the data.
Variables used in the worked example
The data dictionary clarifies exactly what the two-sample comparison is testing.
| Variable | Role | Description |
|---|---|---|
| absences | Outcome variable | Number of absences for each student; this is the numeric variable compared by the Kolmogorov Smirnov Two Sample Test. |
| gender | Grouping variable | Two independent groups: female and male students. The source dataset codes this field with the original label sex, but the public interpretation is presented as gender. |
| Female sample size | Group count | 383 students. |
| Male sample size | Group count | 266 students. |
Worked example: female versus male absence distributions
The worked example makes the Kolmogorov Smirnov Two Sample Test concrete and interpretable.
The two groups have similar descriptive summaries at first glance. Both groups share a median of 2, both have a first quartile of 0, and both have comparable upper-tail spread. The female group has Q3 = 5, while the male group has Q3 = 6. Their sample means differ only slightly, with females at 3.5770 absences and males at 3.7782.
These descriptives already suggest that any difference detected by the Kolmogorov Smirnov Two Sample Test is likely to be modest. The empirical CDF calculations confirm this. The largest absolute gap occurs at absence count 3, where the female cumulative proportion is 0.59530 and the male cumulative proportion is 0.54511, giving an absolute difference of 0.05019.
Top support points by ECDF separation
| Absence count | Female ECDF | Male ECDF | Absolute gap |
|---|---|---|---|
| 3 | 0.59530 | 0.54511 | 0.05019 |
| 2 | 0.58225 | 0.53759 | 0.04465 |
| 5 | 0.75457 | 0.71053 | 0.04404 |
| 6 | 0.82507 | 0.79323 | 0.03183 |
| 4 | 0.72846 | 0.70301 | 0.02545 |
Observed result
The tied-data permutation framework provides the final inferential result for the worked example.
The observed gap is smaller than what would be unusual under the null. In fact, the mean of the permutation null distribution is slightly larger at 0.05218, which reinforces the lack of evidence for a real distributional difference.
Exact results table
The summary table brings the descriptive, empirical CDF, and inferential results together in one place.
| Metric | Value | Interpretation |
|---|---|---|
| Female sample size | 383 | Number of female observations in the two-sample comparison. |
| Male sample size | 266 | Number of male observations in the two-sample comparison. |
| D statistic | 0.0501874791 | Largest absolute ECDF gap between the two groups. |
| Location of maximum gap | Absence count = 3 | The observed distributions were furthest apart at x = 3. |
| Permutation p-value | 0.5056494351 | No statistically significant evidence against equal distributions. |
| Permutation null mean | 0.0521758643 | Average D under the fixed-size label permutation reference. |
| Number of permutations | 10,000 | Reference distribution size used for the p-value. |
| Support values | 24 | Distinct absence counts evaluated in the ECDF table. |
The most important numbers are the D statistic and the permutation p-value. The observed D is small, and the p-value is far larger than the conventional 0.05 threshold, so the final conclusion is that the female and male distributions of absences are not detectably different in this sample.
How to interpret the Kolmogorov Smirnov Two Sample Test
Interpretation should emphasize distributional equality rather than only average differences.
The key interpretation of the Kolmogorov Smirnov Two Sample Test is simple: because the p-value is 0.50565, there is not enough evidence to reject the null hypothesis that female and male students share the same underlying absence distribution. That does not prove the distributions are identical in every theoretical sense; it means the observed sample differences are well within what we would expect under the null permutation reference.
From a substantive point of view, the result means that the pattern of low, moderate, and high absence counts looks broadly similar in the two groups. The analysis does not suggest a strong difference in the lower tail, middle of the distribution, or upper tail. If a public reader wants a quick summary, the cleanest statement is that the two gender groups show comparable attendance-loss profiles in the sample.
What the result does say
The data do not show a meaningful separation between the empirical CDFs. The maximum absolute difference is only about five percentage points, and even that maximum is not unusual relative to the permutation null distribution.
Public-facing interpretation: female and male students exhibited very similar absence patterns in the observed data.
What the result does not say
The result does not claim the two samples have exactly the same mean, exactly the same variance, or exactly the same median. It evaluates the broader question of distributional equality. If a study is focused on only one summary quantity, methods targeted to that quantity may be more efficient and easier to interpret.
This is why the Kolmogorov Smirnov Two Sample Test should be chosen to answer the right question, not merely because it is nonparametric.
Kolmogorov Smirnov Two Sample Test in Python
The Python chart set summarizes the distributional comparison from metrics through verification.
The Kolmogorov Smirnov Two Sample Test in Python section explains each supplied Python figure in the same ideal format as the other public posts on the site. Every image sits in a boxed figure card, and every caption translates the figure into statistical meaning rather than merely restating the title.
For many readers, Python is also the easiest environment in which to reproduce the logic of the test. The empirical CDFs can be built directly from sorted values or by tabulating cumulative proportions, and the permutation reference can be generated transparently with repeated label shuffling. That transparency is one reason the Python workflow is a useful teaching device for the Kolmogorov Smirnov Two Sample Test.
Python chart 1: primary metrics
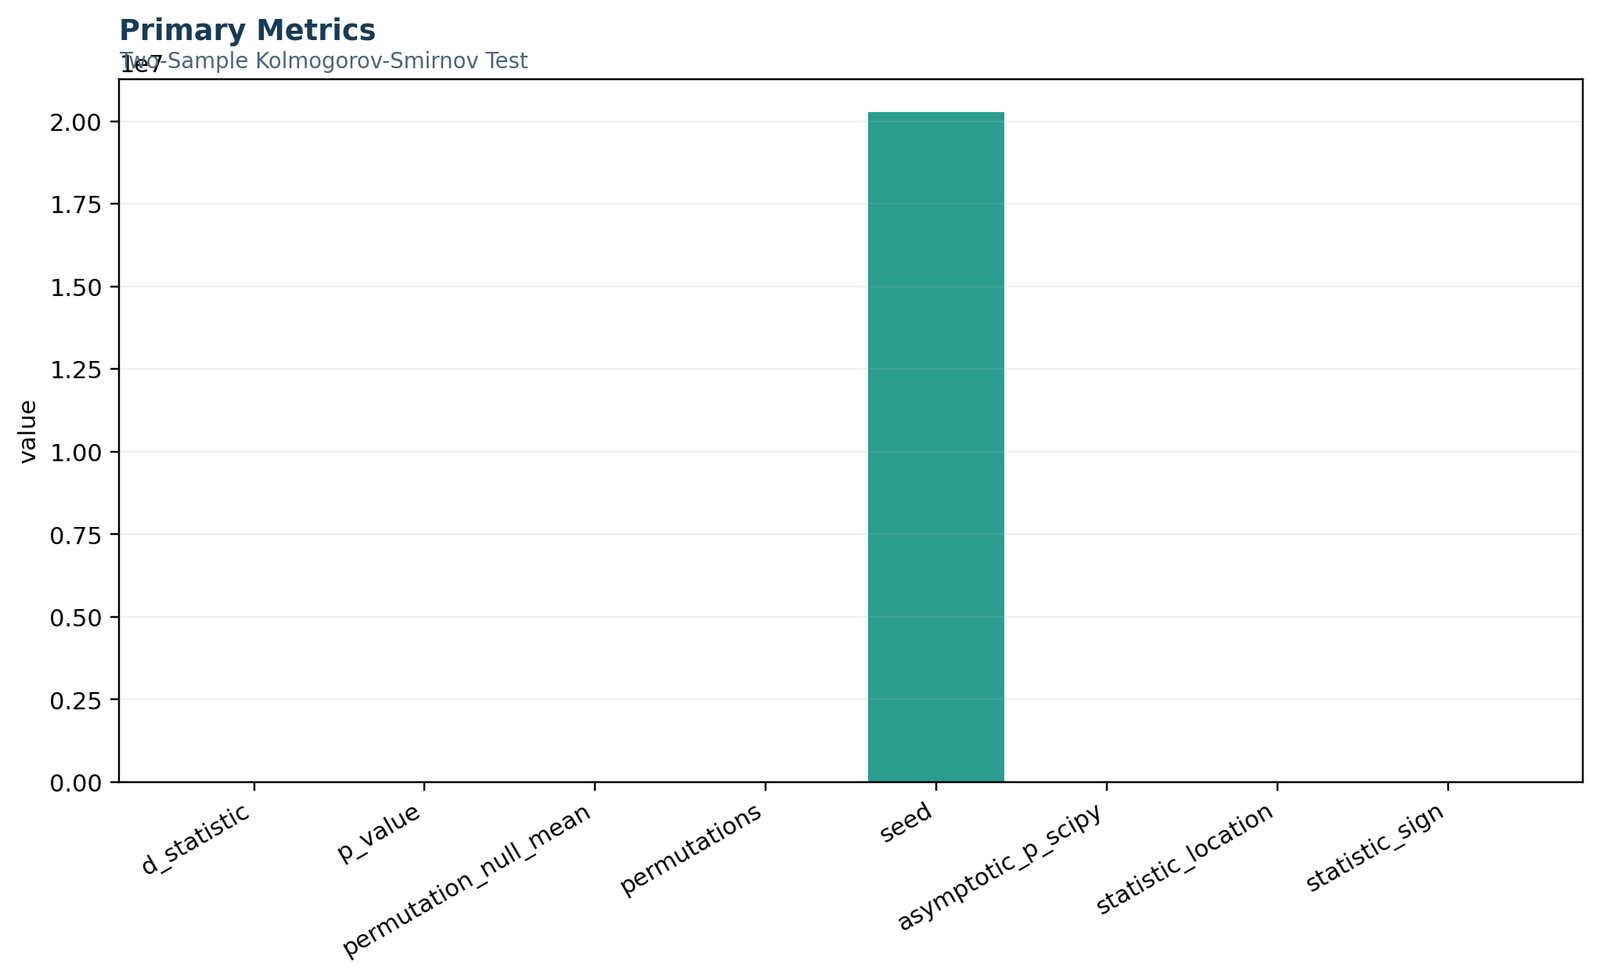
This summary chart introduces the complete Kolmogorov Smirnov Two Sample Test result. It highlights the core values needed for interpretation: D = 0.05019, a permutation p-value of 0.50565, and the two sample sizes of 383 and 266. The figure makes the broad message immediately visible: the test does not detect a statistically significant difference between the two absence distributions.
Python chart 2: female and male absence summary
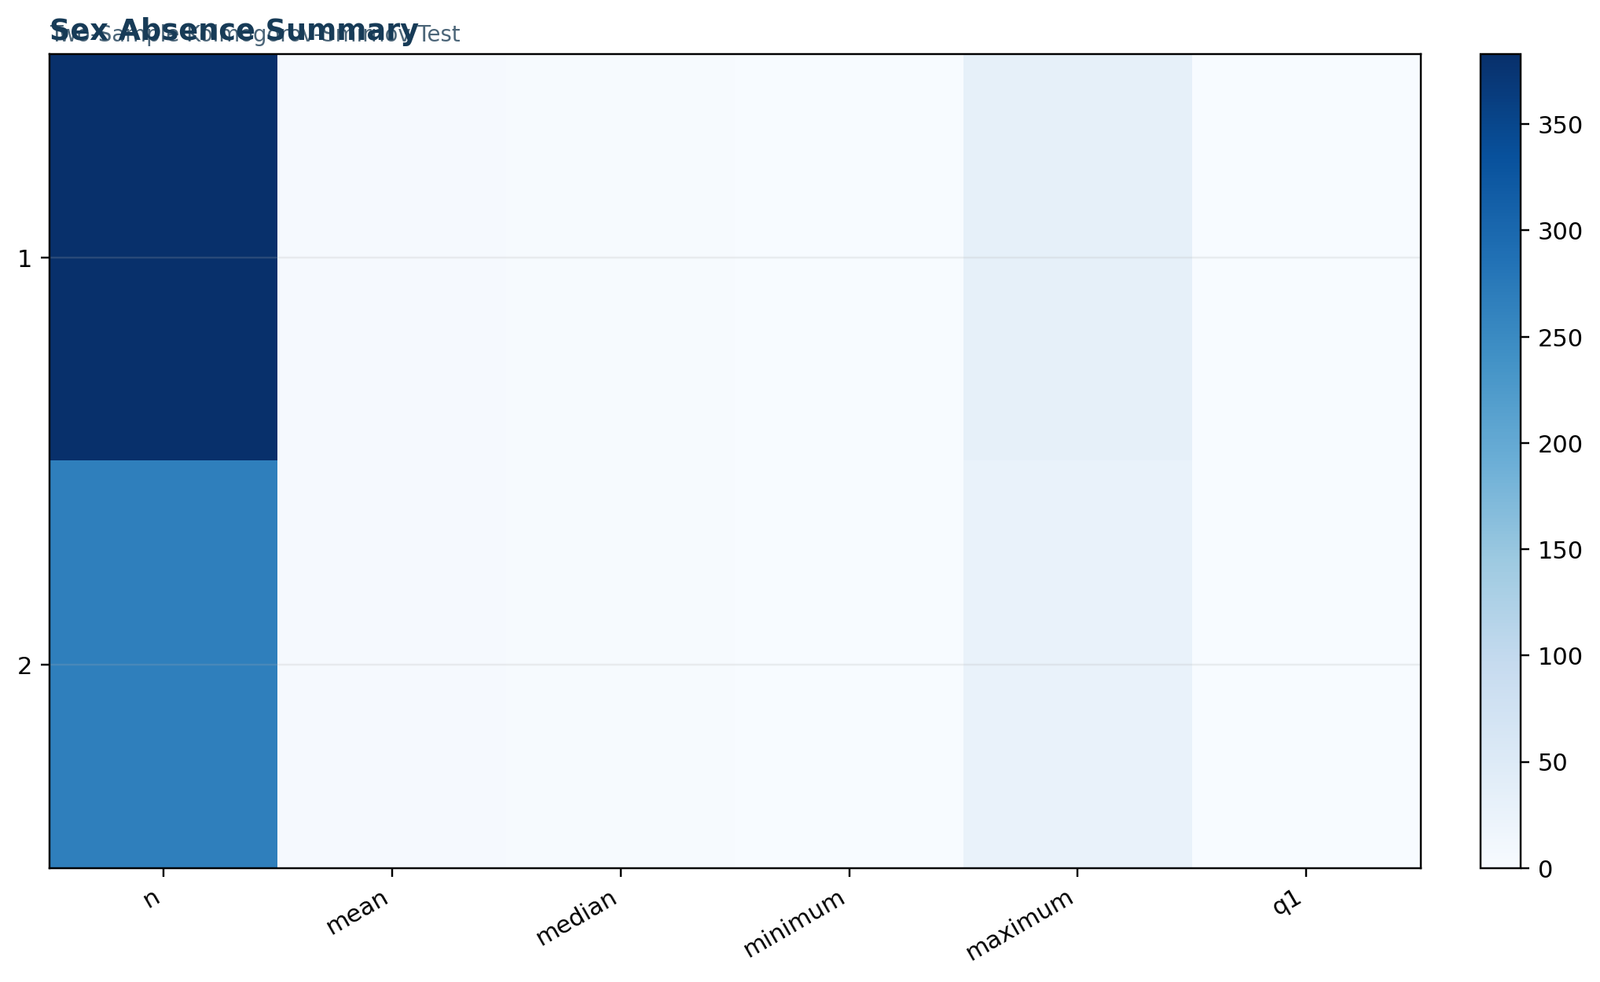
This chart organizes the descriptive summaries that sit behind the empirical CDF comparison. Both groups share the same median of 2, while the female mean is 3.5770 and the male mean is 3.7782. The close descriptive agreement helps explain why the eventual KS statistic remains small.
Python chart 3: ECDF separation
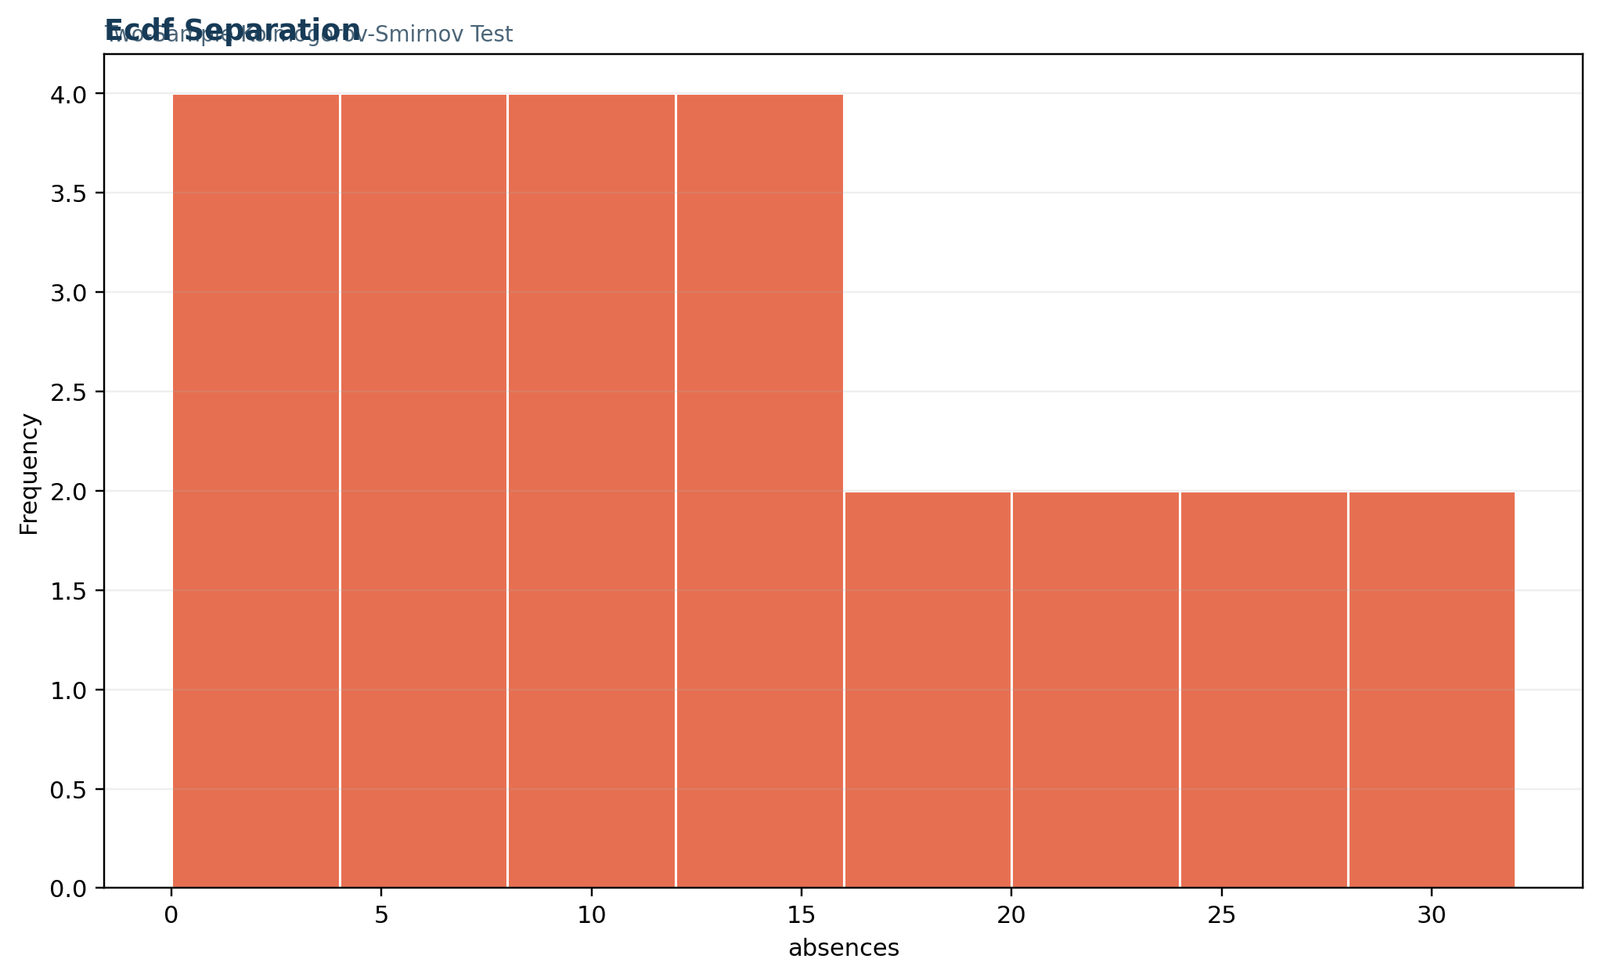
The empirical CDF separation chart is the conceptual heart of the Kolmogorov Smirnov Two Sample Test. It shows where the two cumulative curves diverge and where they come back together. The maximum gap occurs at an absence count of 3, where the female CDF reaches 0.59530 and the male CDF reaches 0.54511.
Python chart 4: rows with the largest gaps
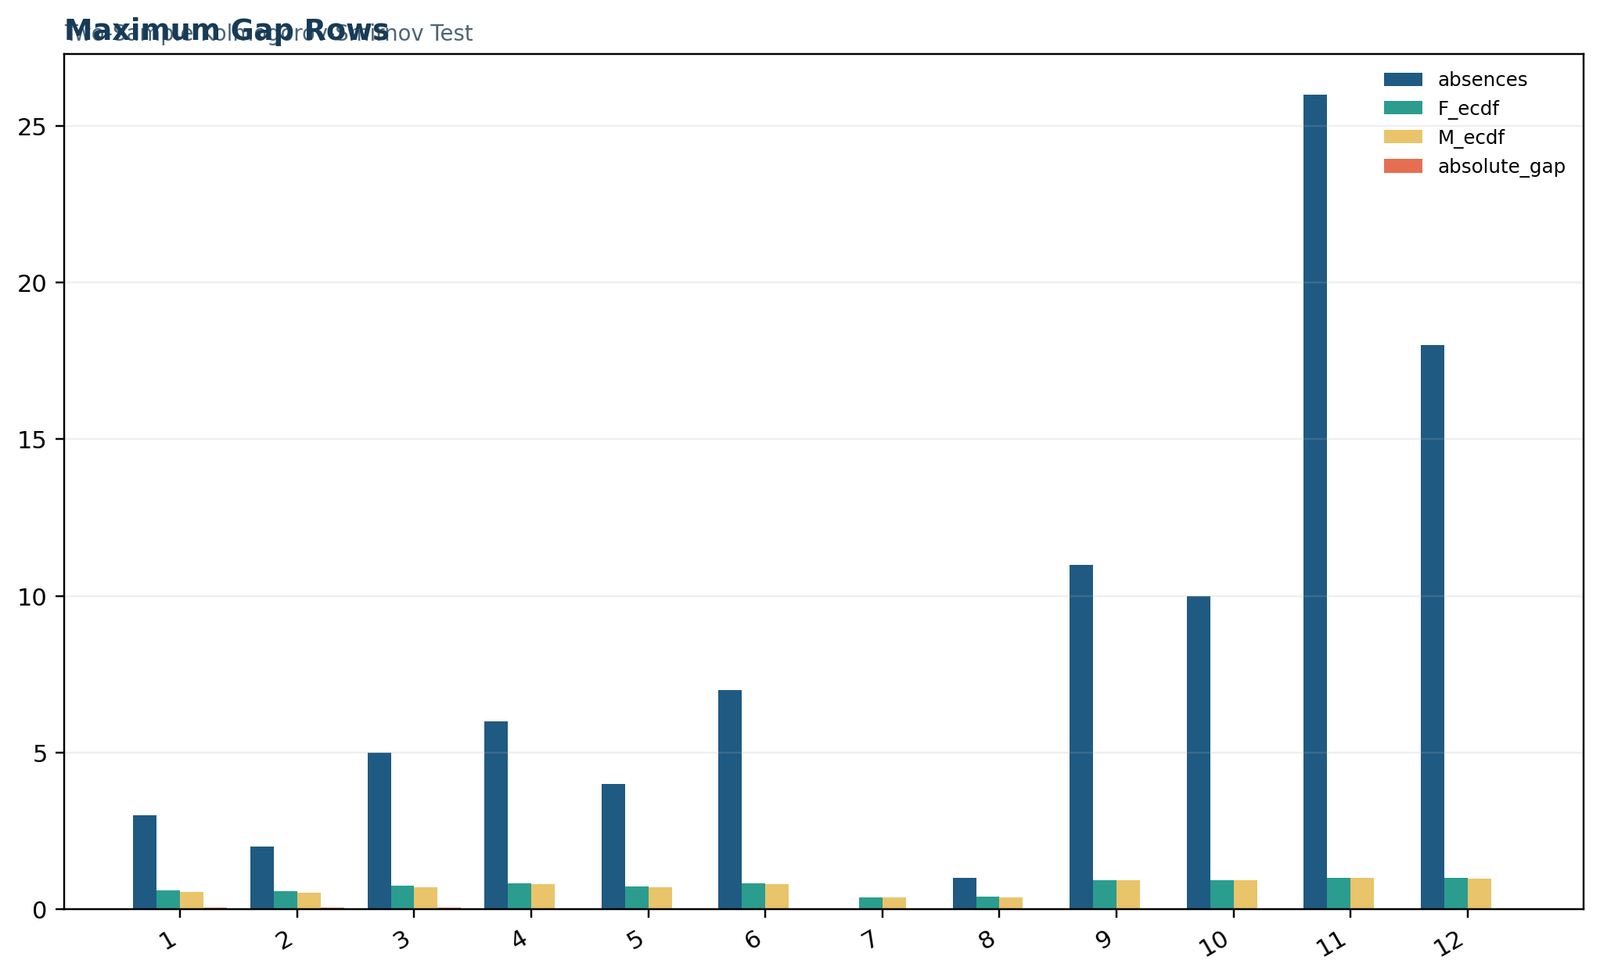
This figure isolates the support points that matter most. The largest five ECDF gaps appear at absence counts 3, 2, 5, 6, and 4. Even the largest of these values is only about five percentage points, reinforcing the interpretation that the two distributions are quite similar.
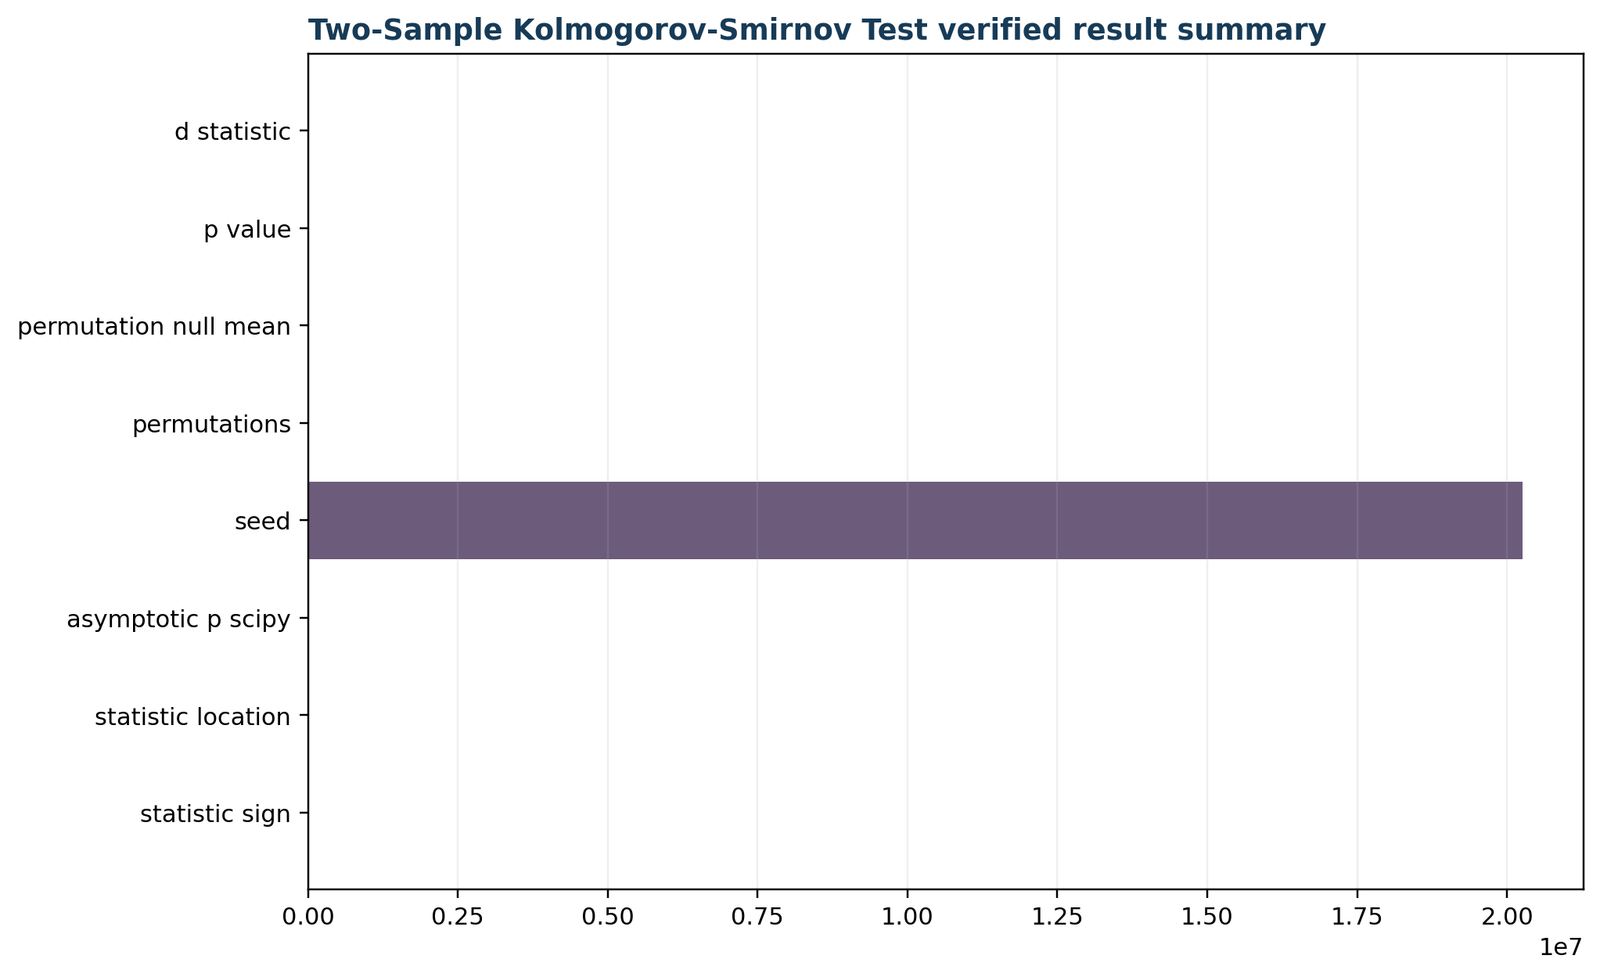
Python chart 5: verified result summary
The closing Python chart compresses the full analysis into one public-facing message. The observed D is modest, the permutation p-value is non-significant, and the distributional comparison between female and male absences does not yield evidence of a real difference.
Kolmogorov Smirnov Two Sample Test in R
The R chart block reaches the same substantive conclusion and strengthens reproducibility.
The Kolmogorov Smirnov Two Sample Test in R mirrors the Python analysis. That cross-software consistency matters because public readers often work in more than one environment. When Python, R, SPSS, and Excel agree on the same tied-data conclusion, confidence in the interpretation increases.
R is also especially useful for public explanations because it encourages explicit data handling and reproducible analysis scripts. In a classroom or consulting setting, the same empirical CDF table shown in the workbook can be reproduced directly from code, which helps bridge the gap between the mathematical formula and the final result summary.
R chart 1: primary metrics
The first R figure confirms the same D statistic and p-value reported in Python. This supports the main conclusion that the two absence distributions are not significantly different under the chosen permutation reference.
R chart 2: group summary
The second R figure shows the same descriptive story: very similar medians, similar spread, and only a slight mean difference. It places the inferential result in clear descriptive context.
R chart 3: ECDF separation
This figure visualizes the cumulative separation that defines the KS statistic. The distributional gap remains modest across the support, with the maximum still occurring near absence count 3.
R chart 4: maximum-gap rows
The R chart emphasizing the largest gap rows underlines how local differences accumulate into the final D statistic. No single support point shows a dramatic separation.
R chart 5: verified result summary
The final R panel confirms the same inferential bottom line as the Python analysis: the Kolmogorov Smirnov Two Sample Test does not provide evidence against equal absence distributions for female and male students.
Kolmogorov Smirnov Two Sample Test in SPSS
SPSS readers need the same interpretation even when software menus differ.
SPSS interpretation points
The SPSS workflow should preserve the same two independent groups and the same outcome variable. The public interpretation stays the same: the test compares complete distributions through their empirical CDFs. Because the absence data are discrete and tied, SPSS output should be interpreted with the same caution about continuous-reference approximations, and the permutation-based reference remains the preferred inference for this workbook-guided example.
What the SPSS result means here
The SPSS results agree with the Python and R analyses: the observed distributional gap is small, and the overall evidence does not support a difference between female and male absence distributions. The practical message for public reporting is therefore stable across platforms.
Kolmogorov Smirnov Two Sample Test in Excel
The workbook makes every empirical CDF step visible and auditable.
The Excel workbook is a strength of this guide because it shows the full chain from raw data to final inference. The Data_Input sheet stores the unchanged variables, the Working sheet calculates female and male empirical CDFs across every observed support value, the Calculations sheet extracts the maximum absolute difference and permutation results, and the Reporting sheet cross-checks the workbook values against the verified reference values. For readers learning the Kolmogorov Smirnov Two Sample Test, this kind of transparent workbook is often easier to follow than software output alone.
The workbook also fits nicely with other foundational site topics such as standard error, confidence intervals, and effect size, even though those ideas are not the core of the KS procedure itself. Public readers frequently understand a method better when they can place it within the broader statistics toolkit.
| Workbook sheet | Purpose |
|---|---|
| Guide | Explains the design, null hypothesis, and core formula. |
| Data_Input | Stores the raw absences and gender values. |
| Working | Lists each support value with female ECDF, male ECDF, and absolute gap. |
| Calculations | Shows D, permutation p-value, null mean, permutation count, and seed. |
| Diagnostics | Records method-specific interpretation notes about D, ties, and fixed group sizes. |
| Reporting | Compares workbook results with the verified reference analysis. |
How to report the Kolmogorov Smirnov Two Sample Test
A clean report should include the statistic, the reference method, and the substantive conclusion.
APA-style example
A Kolmogorov Smirnov Two Sample Test was used to compare the distribution of student absences between female and male groups. The maximum empirical CDF difference was small, D = 0.050, and a tied-data permutation procedure based on 10,000 fixed-size label permutations yielded p = .506. These results indicate no statistically significant difference between the female and male absence distributions.
A good public report also explains that the p-value came from a permutation procedure because the data were discrete and tied. That is a more faithful description of the actual method than simply mentioning a generic asymptotic p-value.
Kolmogorov Smirnov Two Sample Test versus other two-group tests
Different procedures answer different questions, so method choice should match the inferential target.
| Method | Main question | How it differs from the Kolmogorov Smirnov Two Sample Test |
|---|---|---|
| Kolmogorov Smirnov Two Sample Test | Are the two full distributions the same? | Compares empirical CDFs and uses the largest absolute separation. |
| Two-sample t test | Are the group means different? | Targets mean differences rather than the entire distribution. |
| Welch’s t test | Are means different with unequal variances? | Still mean-based and parametric, unlike the CDF-based KS approach. |
| Mann–Whitney style test | Do rank distributions or location tend to differ? | Focuses on rank-order differences rather than the maximum CDF gap. |
| Anderson–Darling / Cramér–von Mises style tests | Are the distributions globally different? | Use different weighting schemes across the support, whereas KS uses the single maximum gap. |
If your main interest is a broader distributional question, the Kolmogorov Smirnov Two Sample Test is often attractive. If the research question is specifically about a mean, median, or regression effect, another method may be more directly aligned with the target.
This method-comparison step is important for interpretation quality. Good analysis is not only about obtaining a p-value; it is about choosing a test whose statistical question matches the real-world question. The Kolmogorov Smirnov Two Sample Test earns its place when analysts care about the entire distribution rather than one summary statistic alone.
Downloads
These links provide the complete supporting materials for the worked example.
Python reportDetailed Python output and interpretation for the Kolmogorov Smirnov Two Sample Test.Open report
R reportR output for the same two-sample KS analysis.Open report
SPSS outputSPSS companion output for the worked example.Open report
Excel workbookAuditable workbook with ECDF calculations and permutation summary.Open workbook
Frequently asked questions
Short answers to common questions about the two-sample KS procedure.
What is the Kolmogorov Smirnov Two Sample Test used for?
The Kolmogorov Smirnov Two Sample Test is used to compare whether two independent samples appear to come from the same distribution.
What does the D statistic mean?
The D statistic is the largest absolute difference between the two empirical cumulative distribution functions.
What were the two groups in this example?
The two groups were female and male students, compared on the outcome variable absences.
What was the observed D value?
The observed D statistic was 0.050187.
What was the p-value?
The permutation p-value was 0.505649.
Why was permutation inference used?
Permutation inference was used because the absence counts are discrete and contain many ties, making a tied-data reference more appropriate.
Was the result statistically significant?
No. The p-value is much larger than 0.05, so the test did not detect a significant distributional difference.
At which value did the maximum gap occur?
The largest empirical CDF gap occurred at an absence count of 3.
Does the two-sample KS test require normality?
No. The Kolmogorov Smirnov Two Sample Test is nonparametric and does not assume a normal distribution.
Does a non-significant result mean the samples are identical?
No. It means the observed differences are not large enough to provide evidence against the null under the chosen reference distribution.
How large were the samples?
The female sample size was 383 and the male sample size was 266.
Can the KS test detect shape differences?
Yes. Because it compares empirical CDFs, it can respond to differences in location, spread, and shape.
How is this different from a two-sample t test?
A two-sample t test focuses on the mean, whereas the Kolmogorov Smirnov Two Sample Test compares the full distributions.
Can the method be run in Python and R?
Yes. This guide includes matched Python and R chart explanations along with downloadable reports.
What is the main conclusion of this worked example?
The female and male absence distributions are very similar, and the test does not find evidence of a statistically significant difference.
How many permutations were used?
The p-value was based on 10,000 fixed-size label permutations.
Why is the maximum gap more informative than one single mean difference?
Because the maximum ECDF gap compares the entire running cumulative pattern of the two samples, it can detect broader distributional differences than a single mean comparison.
Is the female distribution slightly lower or higher than the male distribution overall?
The descriptive statistics suggest only a slight difference, with females having a slightly lower mean absences value than males, but the KS test shows that the overall distributions are not significantly different.