
Python-only scipy, pandas and matplotlib t test tutorial
T Test in Python: How to Do One Sample, Independent, Paired and Welch T Tests
T Test in Python is a reproducible way to test whether means are statistically different using scipy.stats, pandas and matplotlib. This Python-only guide shows how to do a t test in Python, how to perform a t test in Python on a pandas DataFrame, how to calculate the t statistic and p value, and how to interpret one sample, independent, paired and Welch t tests. The worked examples use student performance variables such as G3, school, G1 and G3 to show real Python output, charts, confidence intervals and summary tables.
Quick Answer: How to Do T Test in Python
To do a T Test in Python, load your data with pandas, clean missing values, select the correct t-test function from scipy.stats, run the test, then report the t statistic, degrees of freedom, p value, confidence interval and decision.
The Python examples in this guide show four common results. A one sample t test checks whether mean G3 differs from a null value such as 10. An independent t test compares G3 between GP and MS. A Welch t test compares GP and MS without assuming equal variances. A paired t test compares G1 and G3 for the same students.
Python-only result summary: In the worked Python output, the one sample, independent, Welch and paired t-test examples all produce statistically significant results. The independent and Welch examples show GP has a higher mean G3 score than MS. The paired example shows G3 is higher than G1 on average for the same students.
Most important Python rule: Do not choose the t test by p value. Choose the test by design. Use ttest_1samp() for one sample, ttest_ind() for independent groups, ttest_ind(equal_var=False) for Welch unequal variances, and ttest_rel() for paired data.
Table of Contents
- What Is a T Test in Python?
- T Test in Python Formula
- Null and Alternative Hypothesis in Python
- Dataset and Python Variables Used
- Python Output Interpretation
- Python Chart-by-Chart Interpretation
- Python Validation and Result Checks
- Python Workflow Only
- Python Code Blocks
- APA Reporting Wording from Python Output
- Common Python T Test Mistakes
- When to Use T Test in Python
- Python Downloads and Resources
- Related Python and T Test Guides
- FAQs
What Is a T Test in Python?
A T Test in Python is a statistical hypothesis test run with Python code. It tests whether one sample mean differs from a fixed value, whether two independent group means differ, whether two independent means differ when variances are unequal, or whether two related means differ for the same observations.
The standard Python package for t tests is scipy.stats. The most important functions are ttest_1samp(), ttest_ind(), and ttest_rel(). A complete Python t-test workflow normally also uses pandas for reading and cleaning the dataset and matplotlib for charts.
This Python tutorial answers the attached keyword intentions: how to do t test in Python, how to perform t test in Python, t test code in Python, t test in Python pandas, independent t test in Python, one sample t test in Python, paired t test in Python, two sample t test in Python, and Welch t test in Python.
Simple definition: A T Test in Python uses scipy.stats to calculate a t statistic and p value so you can decide whether a mean or mean difference is statistically significant.
Before running any Python t test, decide which design you have. One numeric sample needs a one sample t test. Two independent groups need an independent or Welch t test. Two matched measurements need a paired t test. Related guides include T Test Assumptions, P Value, Confidence Interval, Effect Size, Standard Error, and Normal Distribution.
T Test in Python Formula
Python calculates the t statistic automatically, but understanding the formula helps you interpret the output correctly.
One Sample T Test Formula in Python
Use this when you want to test whether one sample mean differs from a known or hypothesized value. In Python, use stats.ttest_1samp(sample, popmean).
Independent T Test Formula in Python
Use this when comparing two independent groups and equal variances are assumed. In Python, use stats.ttest_ind(group1, group2, equal_var=True).
Welch T Test Formula in Python
Use this when comparing two independent groups and equal variances are not assumed. In Python, use stats.ttest_ind(group1, group2, equal_var=False).
Paired T Test Formula in Python
Use this when the same subjects have two related measurements. In Python, use stats.ttest_rel(after, before).
| Python Keyword | Correct Python Function | Use This When |
|---|---|---|
| one sample t test in Python | stats.ttest_1samp() | You compare one sample mean with a fixed value. |
| independent t test in Python | stats.ttest_ind() | You compare two unrelated groups. |
| two sample t test in Python | stats.ttest_ind() | You compare two independent samples. |
| Welch t test in Python | stats.ttest_ind(equal_var=False) | You compare two independent groups with unequal variances. |
| paired t test in Python | stats.ttest_rel() | You compare two related measurements from the same rows. |
| t test in Python pandas | df.dropna() + scipy.stats | You run the t test from columns in a pandas DataFrame. |
Null and Alternative Hypothesis in Python
Python only returns numerical output. You must define the null and alternative hypothesis before running the code.
| Python Test | Null Hypothesis | Alternative Hypothesis | Python Function |
|---|---|---|---|
| One sample t test | H0: μ = μ0 | H1: μ ≠ μ0 | ttest_1samp() |
| Independent t test | H0: μ1 = μ2 | H1: μ1 ≠ μ2 | ttest_ind() |
| Welch t test | H0: μ1 = μ2 | H1: μ1 ≠ μ2 | ttest_ind(equal_var=False) |
| Paired t test | H0: μD = 0 | H1: μD ≠ 0 | ttest_rel() |
Python decision rule: If p_value < 0.05, reject the null hypothesis at the 5% level. Then check the confidence interval and group means to explain the direction and size of the difference.
Dataset and Python Variables Used
This T Test in Python tutorial uses a student performance dataset. The examples use G3 as the main numeric outcome, school as the grouping variable for independent and Welch tests, and G1 with G3 for the paired t test.
| Python Column | Role in Python T Test | Example Use |
|---|---|---|
G3 | Main numeric variable | Used in one sample, independent and Welch t tests. |
school | Grouping variable | Used to split G3 into GP and MS groups. |
G1 | First paired measurement | Used with G3 in the paired t test. |
G3 - G1 | Paired difference | Used to interpret the paired samples t test. |
The examples are written so you can use the same method on any pandas DataFrame. Replace G3, G1, and school with your own column names.
Python Output Interpretation
A good T Test in Python report should not stop at the SciPy output object. You should extract and interpret the statistic, p value, degrees of freedom, mean difference and confidence interval.
Python One Sample T Test Output
The one sample Python output tests whether the mean of G3 differs from a fixed null value such as 10. In the worked output, the mean G3 score is above the null value, and the result is statistically significant.
Python Independent T Test Output
The independent t test compares G3 between GP and MS groups. The Python group means show that GP has the higher average G3 score. The t test evaluates whether that difference is larger than expected by sampling variation.
Python Welch T Test Output
The Welch t test is the recommended Python output when the two groups have unequal variances. In SciPy, this is done with stats.ttest_ind(gp, ms, equal_var=False). The worked result shows a positive mean difference in favor of GP and a confidence interval above zero.
Python Paired T Test Output
The paired t test compares two related columns for the same rows. In this example, G3 is compared with G1. The paired difference distribution and table show that G3 is higher than G1 on average.
Python interpretation summary: Use ttest_1samp() for one sample, ttest_ind() for independent groups, equal_var=False for Welch, and ttest_rel() for paired data. Always pair the SciPy p value with means, standard deviations, confidence intervals and charts.
Python Chart-by-Chart Interpretation
The following Python charts are the actual visual outputs for this T Test in Python tutorial. They show one sample, independent, Welch, paired, variance and summary-table workflows.
Python Chart 1: One Sample T Distribution
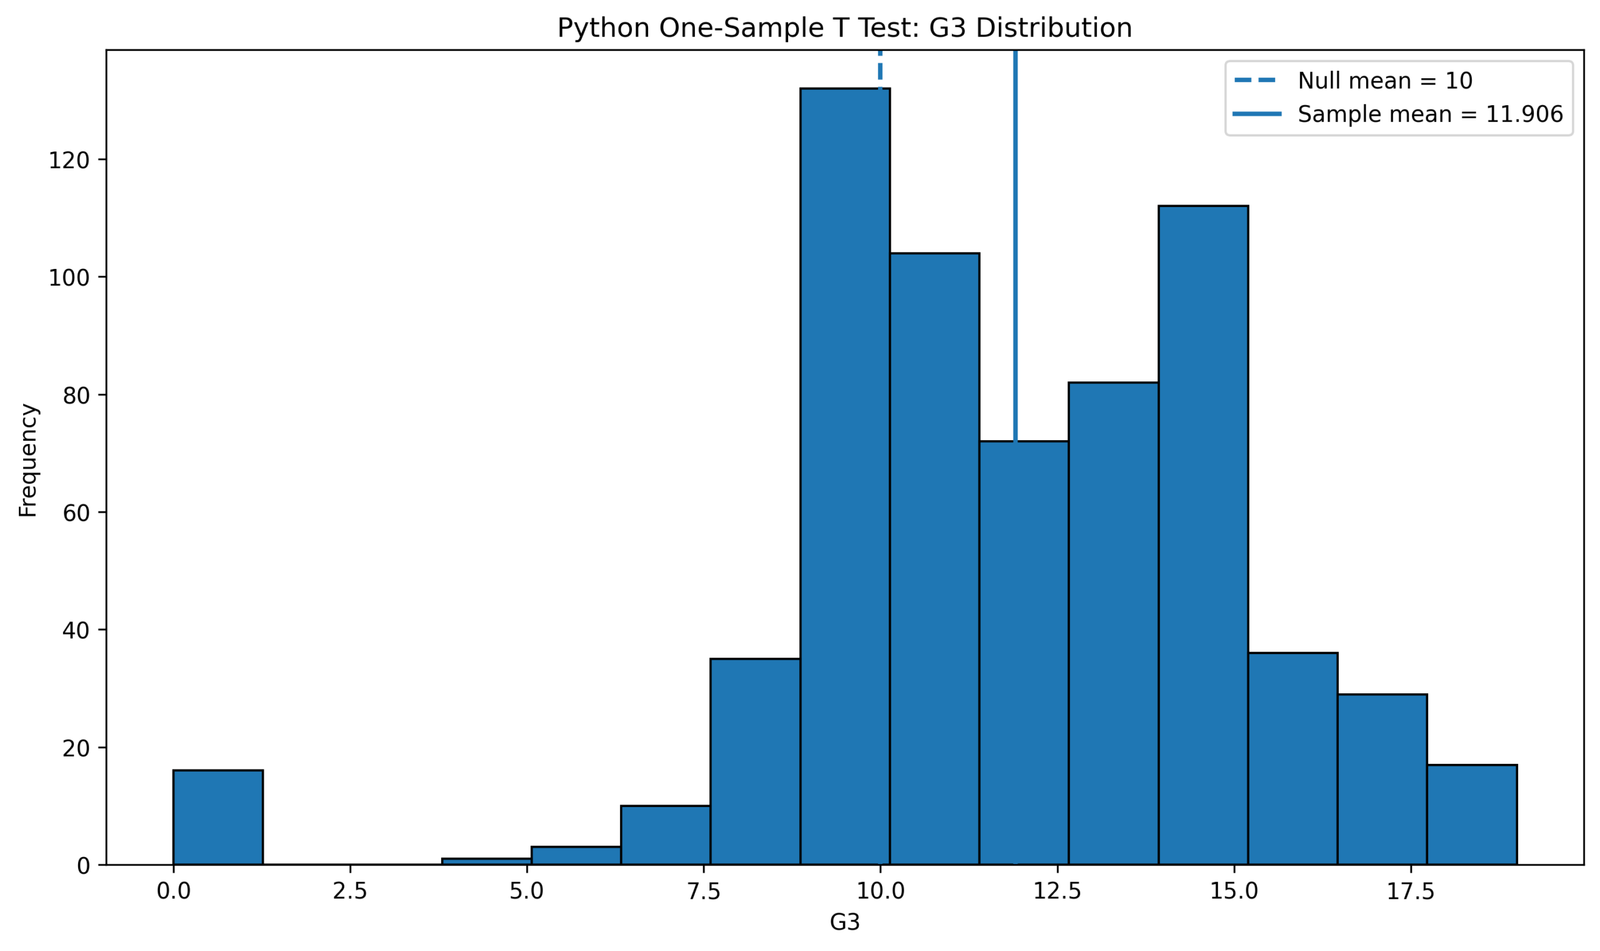
This chart explains the one sample t test in Python. The sample mean is compared with a null value, and the observed t statistic is plotted on the t distribution.
The chart is important because it shows how Python converts a mean difference into a probability decision. When the t statistic falls far from zero, the p value becomes small and the null hypothesis is rejected.
Python Chart 2: Independent T Group Means
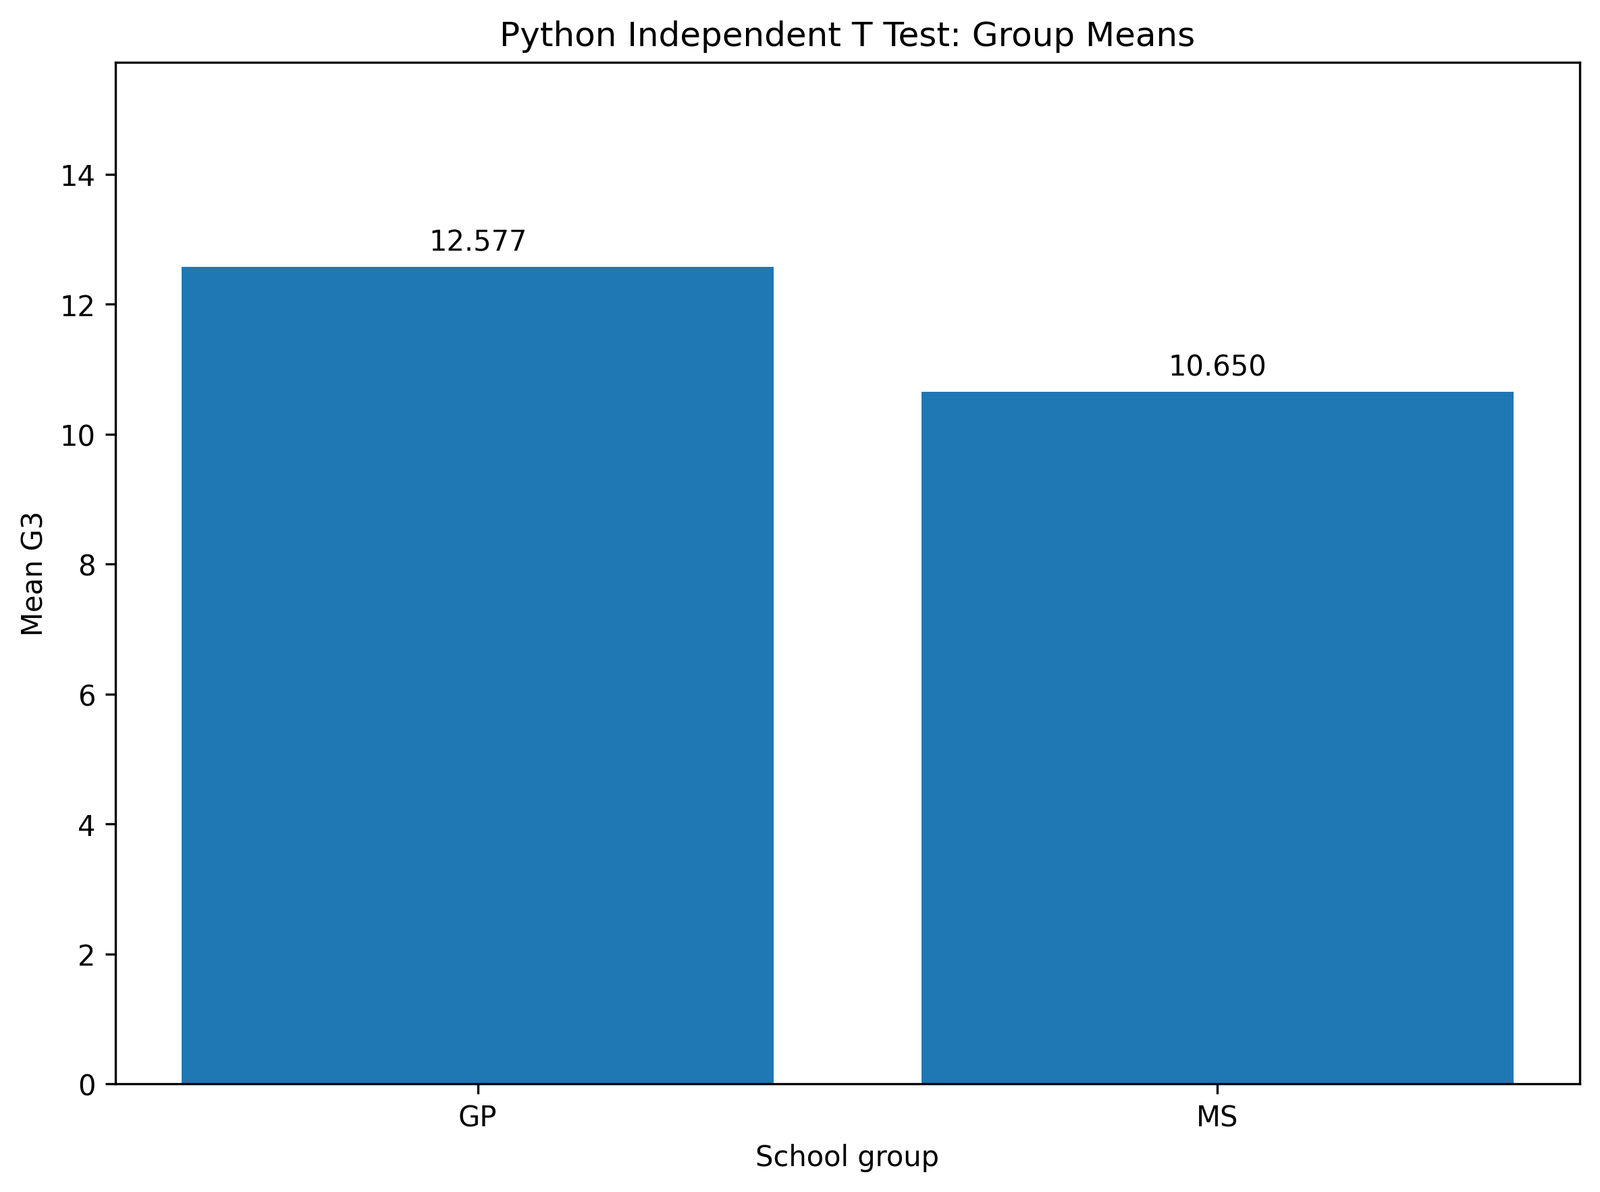
This chart supports the keyword independent t test in Python. It compares the group means for GP and MS. GP has a higher average G3 score than MS.
The chart gives the practical meaning before the p value is interpreted. The t test asks whether the observed group mean difference is large enough to be statistically significant.
Python Chart 3: Welch Confidence Interval
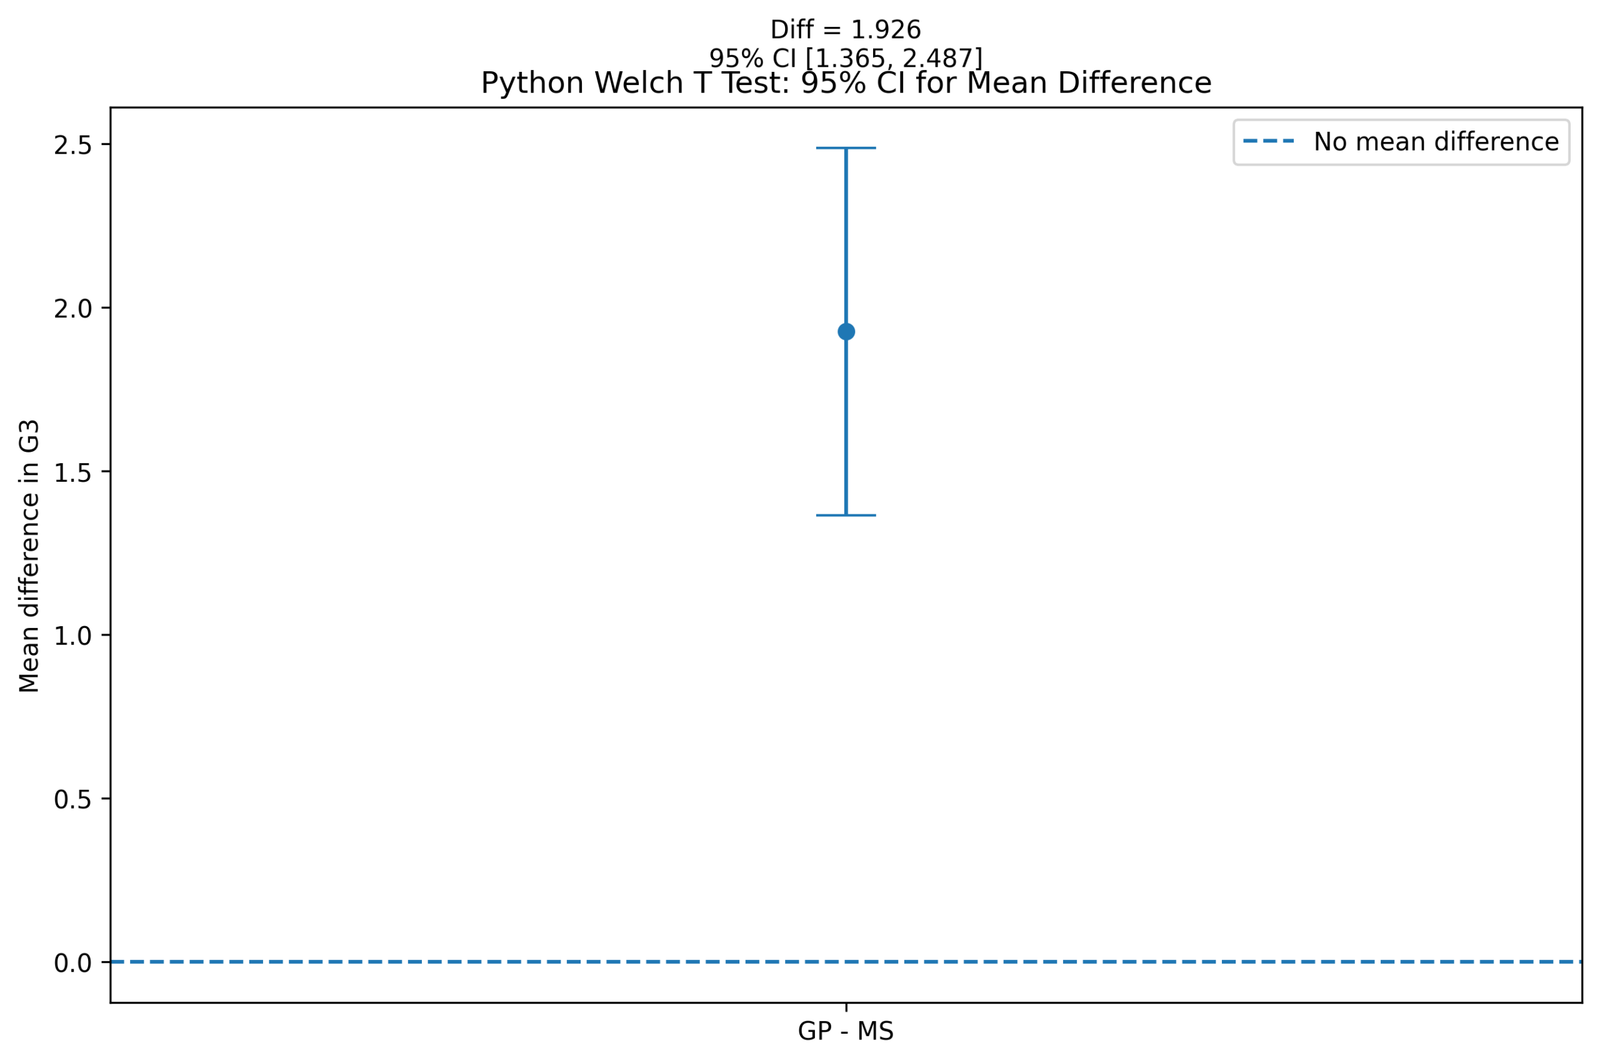
This chart explains the Welch t test in Python. The confidence interval for the mean difference is above zero, showing that the group difference is positive and statistically significant.
Welch’s method is used in Python with equal_var=False. It is preferred when the two groups have unequal variances.
Python Chart 4: Welch T Distribution
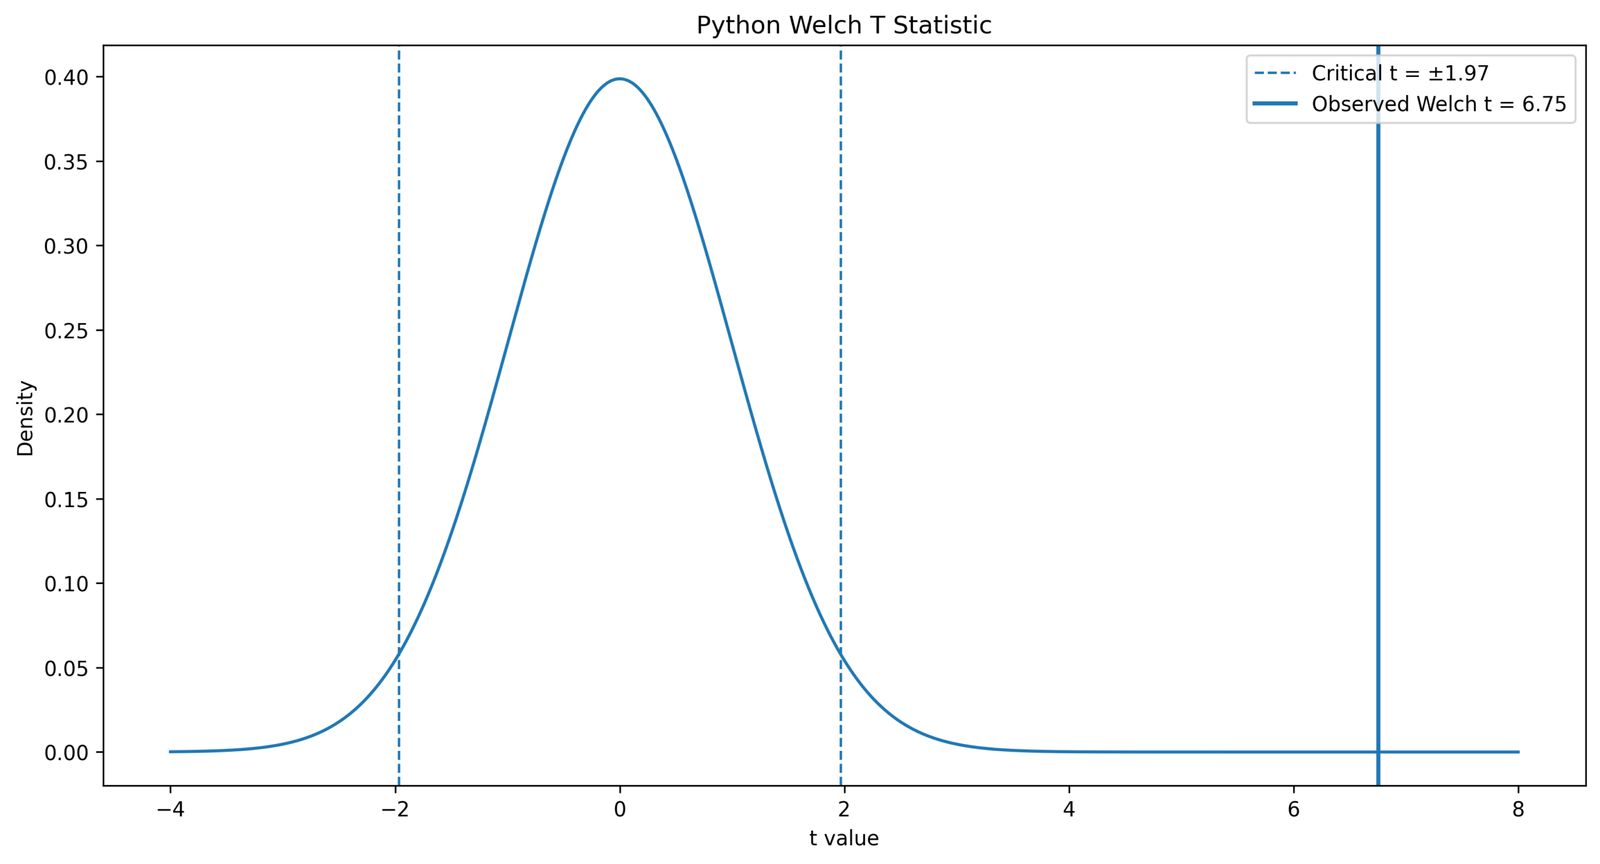
This chart places the Welch t statistic on the adjusted t distribution. It shows why the p value is small when the observed statistic is far from the null center.
The chart is especially useful for explaining how to interpret t test in Python, because it connects the t statistic with the rejection decision.
Python Chart 5: Variance Comparison
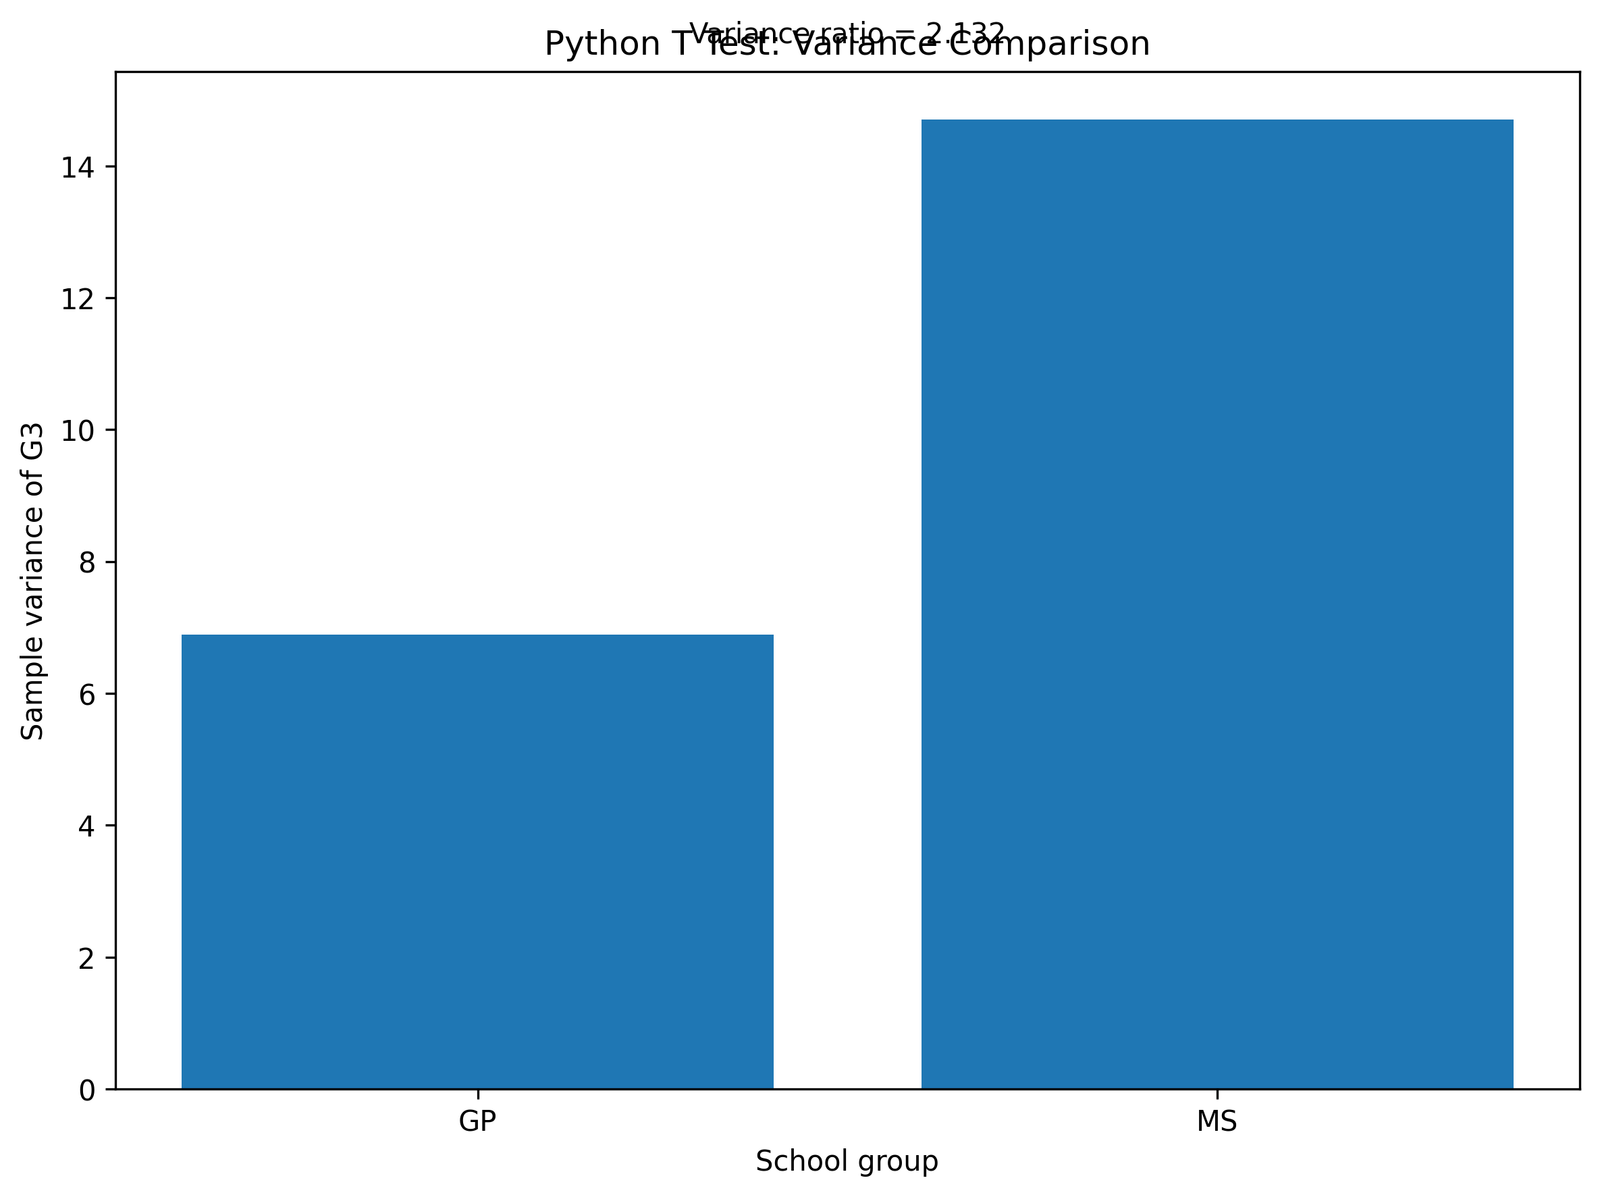
This chart checks whether the independent groups have similar spread. If group variances are very different, use stats.ttest_ind(equal_var=False) for Welch’s t test.
The chart prevents a common Python mistake: running the default independent t test without checking whether equal variance is reasonable.
Python Chart 6: Paired Difference Distribution
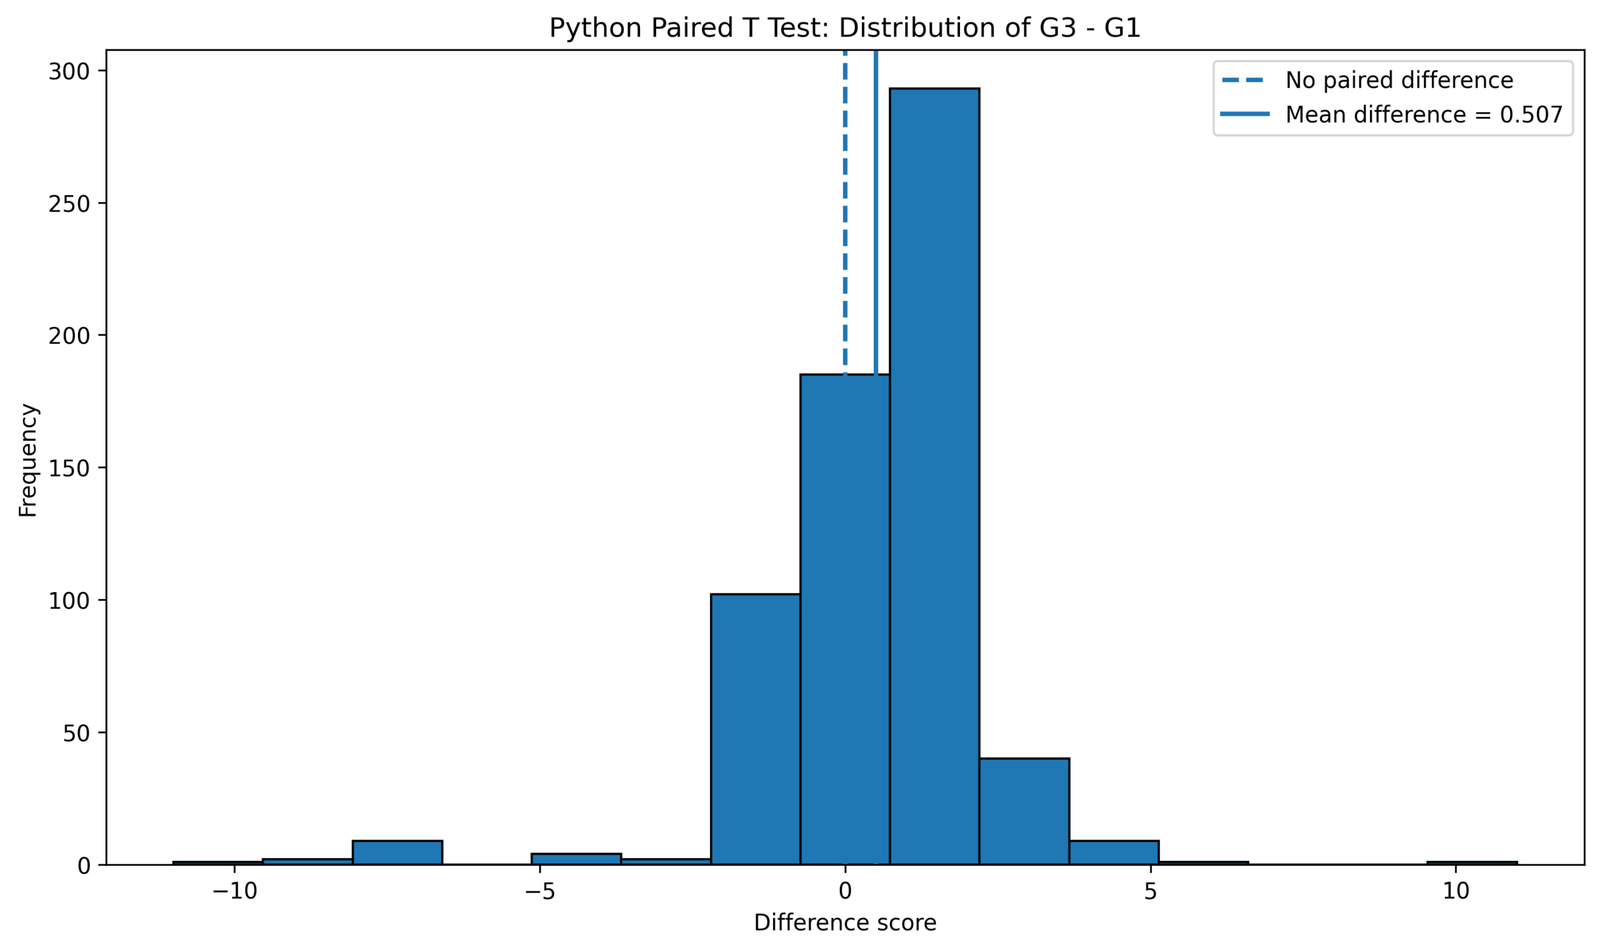
This chart supports the keyword paired t test in Python. The paired t test does not compare independent groups. It calculates a difference for each row, such as G3 - G1, and tests whether the average difference is zero.
The center of the distribution is above zero, which supports a positive average paired difference.
Python Chart 7: T Test P Value Comparison
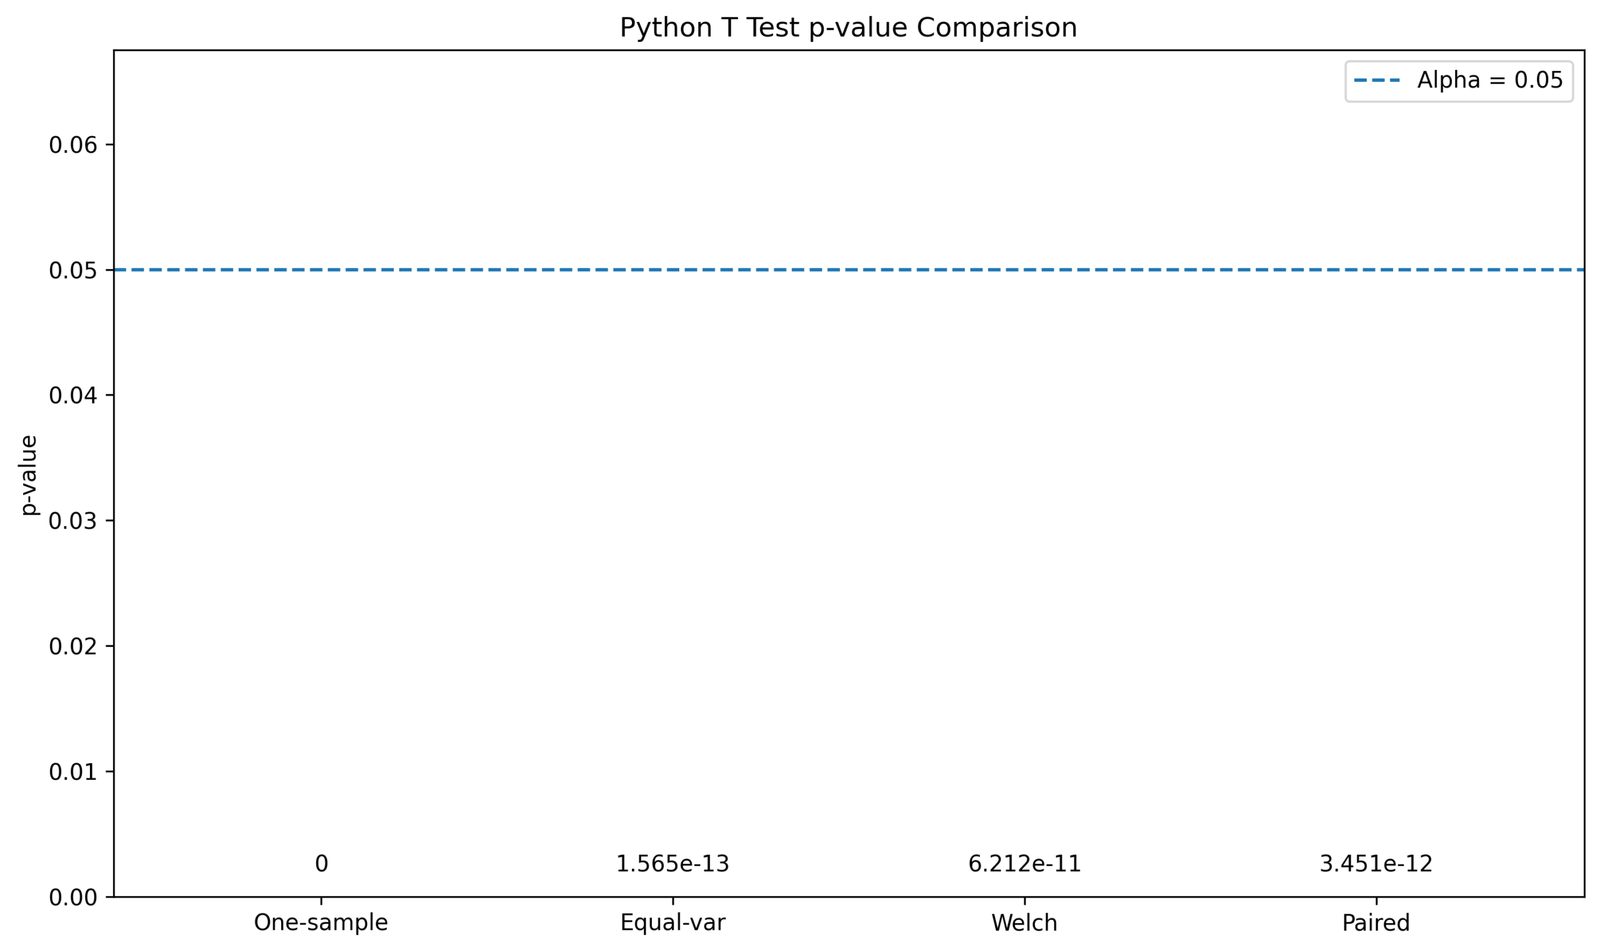
This chart compares Python p values across different t-test types. It helps readers understand that each t test answers a different research question.
Do not choose a t test because it has the smallest p value. Choose the Python t test based on the design: one sample, independent groups, unequal variances or paired measurements.
Python Chart 8: T Test Summary Table
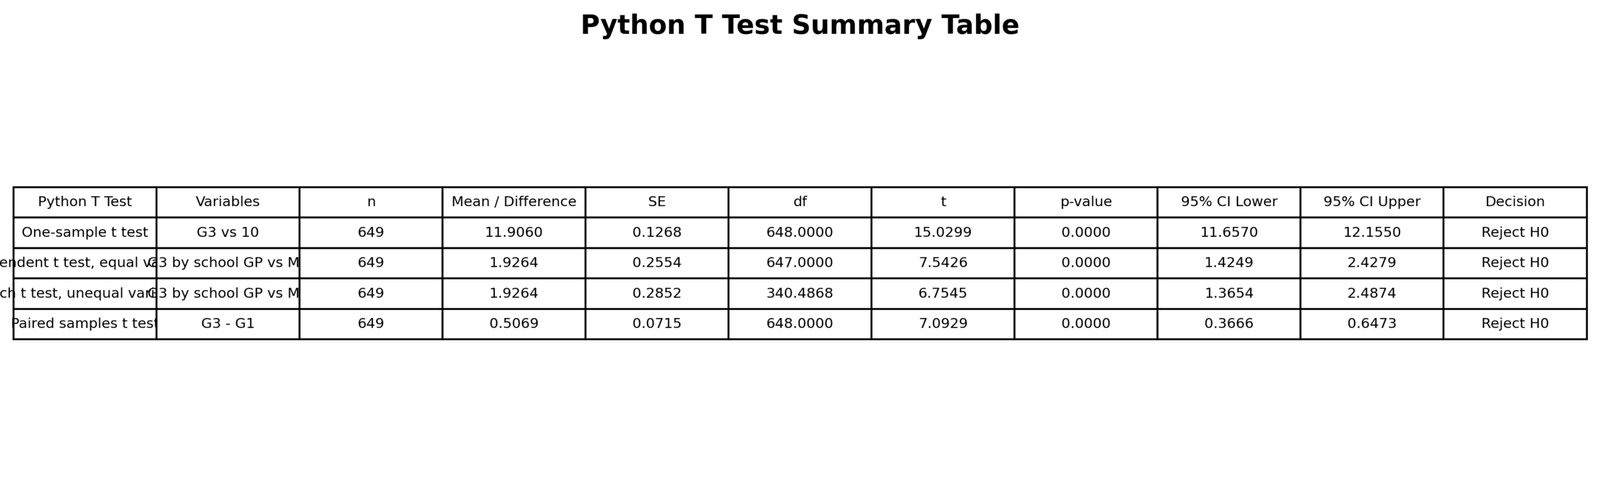
This Python table summarizes the one sample, independent, Welch and paired t-test results in one place. It is the best table for checking the overall output before writing the report.
The table should include test name, statistic, degrees of freedom, p value, confidence interval and decision. This makes the Python output ready for interpretation.
Python Chart 9: Group Statistics Table
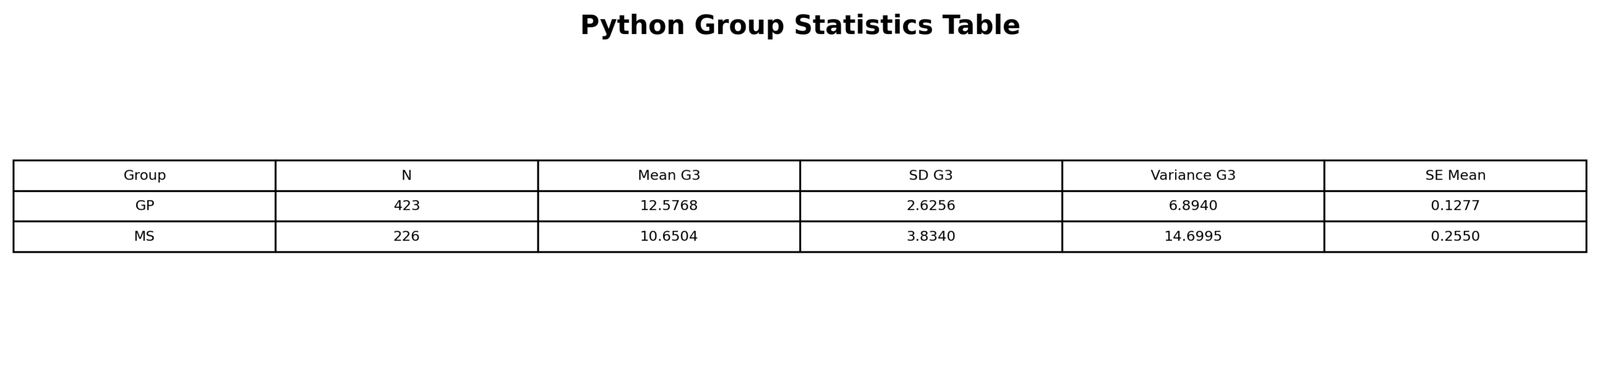
This table supports t test in Python pandas. It shows how pandas can summarize groups before running SciPy’s t test.
Always inspect group statistics before interpreting a t test. The table explains the sample size, mean, spread and variance condition behind the t-test result.
Python Chart 10: Paired Statistics Table
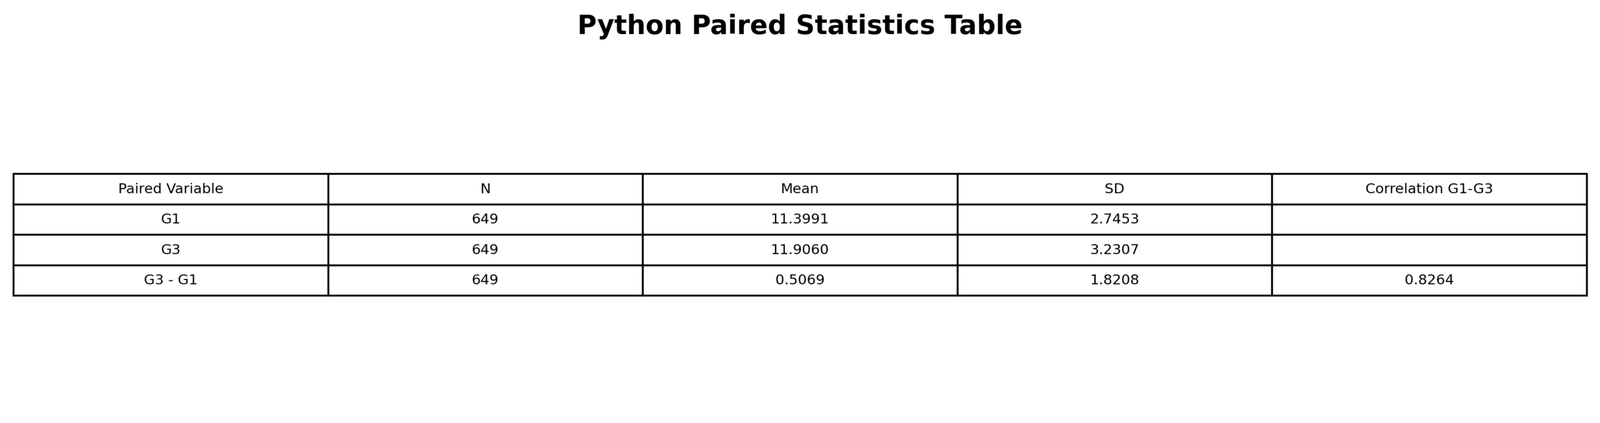
This table summarizes the paired t-test workflow. It shows the paired variables, paired means, paired difference and test decision.
The paired statistics table is important because paired t tests depend on row-by-row differences. It helps readers verify that the analysis used matched observations correctly.
Python Validation and Result Checks
After running a T Test in Python, validate the result before publishing. Validation means checking that the right rows, variables, missing values, group order and test type were used.
| Python Check | Code Idea | Why It Matters |
|---|---|---|
| Check missing values | df[cols].isna().sum() | Missing rows change sample size and p value. |
| Check group sizes | df.groupby("school").size() | Unequal group sizes affect interpretation. |
| Check group means | df.groupby("school")["G3"].mean() | Means explain the direction of the result. |
| Check group variances | df.groupby("school")["G3"].var() | Variance comparison helps choose Welch or equal variance. |
| Check paired alignment | df[["G1","G3"]].dropna() | Paired t tests require both values on the same row. |
| Check comparison direction | mean_gp - mean_ms | The sign changes if you reverse group order. |
Python validation conclusion: A correct Python t-test result must match the research design, use clean numeric columns, remove missing values consistently, and report the direction of the mean difference.
Python Workflow Only
This section gives the complete Python-only workflow for the keywords how to do t test in Python, how to perform t test in Python, t test code in Python, and t test in Python pandas.
| Step | Python Action | Purpose |
|---|---|---|
| 1. Import packages | import pandas as pd, from scipy import stats | Load the Python tools for data and statistics. |
| 2. Read dataset | pd.read_csv("dataset.csv") | Load the data into a pandas DataFrame. |
| 3. Convert numeric columns | pd.to_numeric() | Make sure the test variables are numeric. |
| 4. Remove missing values | dropna() | Use only complete rows for the selected test. |
| 5. Choose test | ttest_1samp, ttest_ind, ttest_rel | Match the Python function to the research design. |
| 6. Calculate confidence interval | stats.t.ppf() | Add interpretation beyond the p value. |
| 7. Create charts | matplotlib.pyplot | Visualize the t distribution, group means and paired differences. |
| 8. Export outputs | to_csv(), savefig() | Save Python tables and charts for reporting. |
Python Code Blocks
Install and Import Python Packages
import pandas as pd
import numpy as np
from scipy import stats
import matplotlib.pyplot as plt
Read Dataset and Clean Columns with pandas
df = pd.read_csv("dataset.csv")

# Convert columns to numeric where needed
for col in ["G1", "G3"]:
    df[col] = pd.to_numeric(df[col], errors="coerce")

# Keep rows with the needed variables
df_clean = df.dropna(subset=["G1", "G3", "school"]).copy()

print(df_clean[["G1", "G3", "school"]].head())
print(df_clean[["G1", "G3"]].describe())
One Sample T Test in Python
# One sample t test in Python
# Question: Is mean G3 different from 10?

g3 = df_clean["G3"]
mu0 = 10

result_one = stats.ttest_1samp(g3, popmean=mu0)

n = len(g3)
mean_g3 = g3.mean()
sd_g3 = g3.std(ddof=1)
se_g3 = sd_g3 / np.sqrt(n)
df_one = n - 1

t_crit = stats.t.ppf(0.975, df_one)
ci_low = mean_g3 - t_crit * se_g3
ci_high = mean_g3 + t_crit * se_g3

print("One Sample T Test in Python")
print("n:", n)
print("Mean G3:", mean_g3)
print("t statistic:", result_one.statistic)
print("df:", df_one)
print("p value:", result_one.pvalue)
print("95% CI:", (ci_low, ci_high))
Independent T Test in Python
# Independent t test in Python
# Question: Is mean G3 different between GP and MS?

gp = df_clean.loc[df_clean["school"] == "GP", "G3"]
ms = df_clean.loc[df_clean["school"] == "MS", "G3"]

result_ind = stats.ttest_ind(gp, ms, equal_var=True)

mean_diff = gp.mean() - ms.mean()
df_ind = len(gp) + len(ms) - 2

print("Independent T Test in Python")
print("GP n:", len(gp), "GP mean:", gp.mean(), "GP SD:", gp.std(ddof=1))
print("MS n:", len(ms), "MS mean:", ms.mean(), "MS SD:", ms.std(ddof=1))
print("Mean difference GP - MS:", mean_diff)
print("t statistic:", result_ind.statistic)
print("df:", df_ind)
print("p value:", result_ind.pvalue)
Welch T Test in Python
# Welch t test in Python
# Use this when equal variances are not assumed.

result_welch = stats.ttest_ind(gp, ms, equal_var=False)

n1, n2 = len(gp), len(ms)
m1, m2 = gp.mean(), ms.mean()
v1, v2 = gp.var(ddof=1), ms.var(ddof=1)

mean_diff = m1 - m2

se1 = v1 / n1
se2 = v2 / n2
welch_se = np.sqrt(se1 + se2)

welch_df = ((se1 + se2) ** 2) / ((se1 ** 2 / (n1 - 1)) + (se2 ** 2 / (n2 - 1)))

t_crit = stats.t.ppf(0.975, welch_df)
ci_low = mean_diff - t_crit * welch_se
ci_high = mean_diff + t_crit * welch_se

print("Welch T Test in Python")
print("Mean difference GP - MS:", mean_diff)
print("Welch SE:", welch_se)
print("Welch t statistic:", result_welch.statistic)
print("Welch df:", welch_df)
print("p value:", result_welch.pvalue)
print("95% CI:", (ci_low, ci_high))
Paired T Test in Python
# Paired t test in Python
# Question: Is G3 different from G1 for the same students?

paired_data = df_clean.dropna(subset=["G1", "G3"]).copy()

g1 = paired_data["G1"]
g3 = paired_data["G3"]

result_paired = stats.ttest_rel(g3, g1)

diff = g3 - g1
n_pair = len(diff)
mean_diff = diff.mean()
sd_diff = diff.std(ddof=1)
se_diff = sd_diff / np.sqrt(n_pair)
df_pair = n_pair - 1

t_crit = stats.t.ppf(0.975, df_pair)
ci_low = mean_diff - t_crit * se_diff
ci_high = mean_diff + t_crit * se_diff

print("Paired T Test in Python")
print("n pairs:", n_pair)
print("Mean G1:", g1.mean())
print("Mean G3:", g3.mean())
print("Mean paired difference G3 - G1:", mean_diff)
print("t statistic:", result_paired.statistic)
print("df:", df_pair)
print("p value:", result_paired.pvalue)
print("95% CI:", (ci_low, ci_high))
Create a Python Summary Table for T Tests
summary = pd.DataFrame([
    {
        "test": "One Sample T Test",
        "python_function": "stats.ttest_1samp",
        "statistic": result_one.statistic,
        "df": df_one,
        "p_value": result_one.pvalue,
        "decision": "Reject H0" if result_one.pvalue < 0.05 else "Fail to reject H0"
    },
    {
        "test": "Independent T Test",
        "python_function": "stats.ttest_ind(equal_var=True)",
        "statistic": result_ind.statistic,
        "df": df_ind,
        "p_value": result_ind.pvalue,
        "decision": "Reject H0" if result_ind.pvalue < 0.05 else "Fail to reject H0"
    },
    {
        "test": "Welch T Test",
        "python_function": "stats.ttest_ind(equal_var=False)",
        "statistic": result_welch.statistic,
        "df": welch_df,
        "p_value": result_welch.pvalue,
        "decision": "Reject H0" if result_welch.pvalue < 0.05 else "Fail to reject H0"
    },
    {
        "test": "Paired T Test",
        "python_function": "stats.ttest_rel",
        "statistic": result_paired.statistic,
        "df": df_pair,
        "p_value": result_paired.pvalue,
        "decision": "Reject H0" if result_paired.pvalue < 0.05 else "Fail to reject H0"
    }
])

print(summary)
summary.to_csv("python_t_test_summary.csv", index=False)
Plot T Test Results in Python
# Example: plot group means for independent t test in Python

group_summary = df_clean.groupby("school")["G3"].agg(["count", "mean", "std"]).reset_index()
group_summary["se"] = group_summary["std"] / np.sqrt(group_summary["count"])

plt.figure(figsize=(8, 5))
plt.bar(group_summary["school"], group_summary["mean"], yerr=group_summary["se"], capsize=6)
plt.xlabel("School")
plt.ylabel("Mean G3")
plt.title("Independent T Test in Python: Group Means")
plt.tight_layout()
plt.savefig("python_independent_t_group_means.png", dpi=300)
plt.close()
APA Reporting Wording from Python Output
When reporting a T Test in Python, focus on the statistical result, not only the software. Mention Python if the report needs reproducibility details.
One sample Python report: A one sample t test in Python showed that the mean G3 score was significantly different from the null value of 10, p < .001.
Welch Python report: A Welch t test in Python was used to compare G3 scores between GP and MS because equal variances were not assumed. GP students had a significantly higher mean G3 score than MS students, p < .001, with a positive confidence interval for the mean difference.
Paired Python report: A paired t test in Python showed that G3 was significantly higher than G1 for the same students, p < .001.
Common Python T Test Mistakes
| Mistake | Why It Is Wrong | Correct Python Practice |
|---|---|---|
Using ttest_ind() for paired data | Paired data are related rows, not independent groups. | Use stats.ttest_rel(). |
Forgetting equal_var=False | Unequal variances need Welch's t test. | Use stats.ttest_ind(a, b, equal_var=False). |
| Not removing missing values | SciPy may return invalid or inconsistent results if data include missing values. | Use dropna() before the test. |
| Using categorical outcome | T tests require a numeric outcome variable. | Use numeric columns such as scores, marks, income or time. |
| Reporting only p value | The p value does not show effect direction or size. | Report means, mean difference, confidence interval and effect size. |
| Reversing group order without explaining it | The sign of the statistic and difference can change. | State the comparison order clearly, such as GP − MS. |
When to Use T Test in Python
Use T Test in Python when your outcome variable is numeric and your research question is about a mean or mean difference. Python is especially useful when you need reproducible analysis, automated charts, clean result tables and reusable code.
| Situation | Python Function | Example |
|---|---|---|
| Compare one sample mean with a fixed value | stats.ttest_1samp() | Test whether mean G3 differs from 10. |
| Compare two independent groups | stats.ttest_ind() | Compare G3 between GP and MS. |
| Compare two independent groups with unequal variances | stats.ttest_ind(equal_var=False) | Run Welch t test for GP vs MS. |
| Compare two related columns | stats.ttest_rel() | Compare G1 and G3 for the same students. |
| Run t test on a pandas DataFrame | df[column] + scipy.stats | Use DataFrame columns directly in SciPy. |
Do not use a t test in Python when the outcome is categorical, when there are more than two independent groups, or when the question is about association rather than mean difference. Choose the statistical test based on the data structure.
Python Downloads and Resources
Use these Python-only resources to reproduce the T Test in Python workflow. Replace the placeholder links with final hosted file URLs after uploading your Python scripts and templates to WordPress Media Library.
Download Complete Python Script
One sample, independent, Welch and paired t tests using scipy, pandas and matplotlib.
Download Python Notebook
Step-by-step notebook for how to do t test in Python with charts and explanations.
Download Python Output Tables
CSV result tables for t statistics, p values, confidence intervals and decisions.
Download Python Chart Pack
PNG chart outputs for one sample, independent, Welch and paired t tests.
FAQs About T Test in Python
How do I do a t test in Python?
Use scipy.stats. Use ttest_1samp() for one sample, ttest_ind() for independent groups, ttest_ind(equal_var=False) for Welch, and ttest_rel() for paired data.
How do I perform t test in Python pandas?
Load the data with pandas, select the required columns, remove missing values with dropna(), then pass the pandas Series into the correct scipy.stats t-test function.
What is the Python code for independent t test?
Use stats.ttest_ind(group1, group2, equal_var=True) for the equal-variance independent t test, or stats.ttest_ind(group1, group2, equal_var=False) for Welch's unequal-variance t test.
How do I run one sample t test in Python?
Use stats.ttest_1samp(sample, popmean). The sample must be numeric, and popmean is the null hypothesis value.
How do I run paired t test in Python?
Use stats.ttest_rel(after, before). The two variables must be related measurements from the same rows or subjects.
How do I run Welch t test in Python?
Use stats.ttest_ind(group1, group2, equal_var=False). This is the correct Python function when equal variances are not assumed.
Does NumPy have a t test function?
NumPy is useful for arrays and calculations, but SciPy is the standard Python package for t tests. Use scipy.stats for t-test functions.
How do I interpret p value in Python t test?
If the p value is below your alpha level, usually .05, reject the null hypothesis. Then interpret the means and confidence interval to explain direction and size.

