
Nonparametric Tests in SPSS: 12 Essential Methods, Menus, Syntax and Interpretation
Nonparametric tests in SPSS help analyze ordered, skewed, discrete, tied, paired and small-sample data without forcing every research question into a normal-theory mean model. This SPSS-only guide explains how to choose the right procedure, use the modern Nonparametric Tests interface and legacy dialogs, paste reproducible syntax, interpret output tables, calculate effect sizes and report a verified final-grade comparison across guardian groups.
SPSS provides different nonparametric procedures for different designs and hypotheses.
Nonparametric tests in SPSS are not one generic replacement for parametric analysis. For two independent groups, the Mann–Whitney U test evaluates rank ordering; for several independent groups, Kruskal–Wallis compares pooled ranks; for paired measurements, Wilcoxon signed-rank or the sign test may be appropriate; for repeated conditions, Friedman preserves within-unit blocking; and for several groups, the median test directly classifies observations around a pooled median.
In the verified SPSS example, final grade (G3) was compared across three guardian groups: mother (n = 455), father (n = 153) and other (n = 41). SPSS-oriented calculations produced a tie-corrected Kruskal–Wallis H(2) = 8.017740, p = 0.018154. The independent pooled-median analysis also found a significant difference, χ²(2) = 7.604164, p = 0.022324, using pooled median 12.
What are nonparametric tests in SPSS?
Procedures based on ranks, signs, medians, frequencies or distribution-free reference logic rather than one fixed normal-theory model.
Nonparametric tests in SPSS are a collection of procedures designed for research questions where ordering, paired direction, distributional position, exact frequencies or rank patterns matter more than a standard mean-and-variance model. They are frequently used for ordinal outcomes, skewed continuous data, discrete counts, small samples, severe outliers and measurements with many tied values.
What nonparametric means
A nonparametric test generally avoids specifying a complete population distribution such as normality with a particular mean and variance structure. Instead, the procedure may convert observations to ranks, classify values around a median, count positive and negative paired differences or evaluate contingency-table frequencies. This can make the method more compatible with ordinal scales and heavily skewed outcomes.
The term does not mean the analysis has no assumptions. Nonparametric tests in SPSS still depend on independent observations or correct pairing, meaningful ordering, appropriate group definitions, transparent treatment of ties and a sampling design that supports the intended inference.
What nonparametric does not mean
It does not mean that every procedure tests medians. Mann–Whitney U and Kruskal–Wallis are pooled-rank tests and can respond to differences in location, spread or shape. Calling their results median differences requires additional conditions, especially similarly shaped group distributions. The median test is more directly connected to a common pooled median but uses less information because it reduces observations to two categories.
It also does not mean that nonparametric tests in SPSS should automatically replace parametric methods whenever a normality test rejects. Method selection should follow the design, measurement scale and estimand before it follows any diagnostic p-value.
Why SPSS is practical for this work
SPSS offers a modern Nonparametric Tests interface with objective-based choices, field roles, settings and automatically generated output. It also retains legacy dialogs that many textbooks and courses still use. Both routes can paste syntax, allowing the analyst to move beyond a one-time menu click and create a reproducible analysis record.
The software also places descriptive information, hypothesis-test summaries and detailed tables in the Output Viewer. That makes nonparametric tests in SPSS approachable for beginners while still allowing experienced analysts to verify group counts, ranks, expected frequencies and significance values.
Typical applications
Common applications include comparing satisfaction ratings between two departments, analyzing test scores across several independent classes, comparing pretest and posttest scores, testing repeated condition ratings, evaluating monotonic associations and analyzing small contingency tables. The unifying feature is not “bad data”; it is a design or question better represented by ranks, signs, medians or exact frequencies.
A strong SPSS workflow states the hypothesis first, chooses the procedure second, runs descriptives and charts third, and interprets the output only after checking that the grouping and missing-value rules are correct.
Useful background guides include parametric vs nonparametric tests, null and alternative hypotheses and p-value interpretation.
How to choose nonparametric tests in SPSS
Start with dependence, number of groups, outcome scale and the precise feature of the distribution you want to test.
Choosing nonparametric tests in SPSS is easiest when the analyst answers four questions: Are observations independent or related? How many groups or conditions exist? Is the outcome ordinal, continuous or nominal? Is the target rank ordering, a common median, an entire distribution, monotonic association or categorical frequency?
| Design and target | SPSS procedure | Typical route | Interpretive focus | Main caution |
|---|---|---|---|---|
| Two independent groups | Mann–Whitney U | Independent-Samples Nonparametric Tests | Relative rank ordering between groups | Median language requires comparable shapes |
| Several independent groups | Kruskal–Wallis H | Independent-Samples Nonparametric Tests | Whether at least one rank distribution differs | Omnibus significance does not identify pairs |
| Several independent groups; median focus | Median test | Independent-Samples Nonparametric Tests | Counts above versus at/below a pooled median | Uses less information than pooled ranks |
| Two related measurements | Wilcoxon signed-rank | Related-Samples Nonparametric Tests | Signed ranks of paired differences | Symmetry supports a location interpretation |
| Two related measurements; direction only | Sign test | Related-Samples Nonparametric Tests | Positive versus negative differences | Lower power because magnitudes are ignored |
| Three or more repeated conditions | Friedman test | Related-Samples Nonparametric Tests | Within-unit rank differences across conditions | Requires correct blocking by unit |
| One sample against a reference | Binomial, chi-square or one-sample Wilcoxon | One-Sample Nonparametric Tests | Proportion, distribution or median reference | Choose the reference value before analysis |
| Nominal contingency table | Chi-square or exact procedure | Crosstabs | Association between categorical variables | Not a rank-based test |
Identify dependence
Independent groups and repeated measurements require different procedures.
Count groups
Two groups, several groups and repeated conditions use different test families.
Define the outcome
Ordinal, continuous, count and nominal outcomes do not support the same statistics.
Define the estimand
Decide whether the hypothesis concerns ranks, medians, signs or categorical frequencies.
Plan follow-ups
State the multiple-comparison strategy before interpreting pairwise results.
Why the design-first rule works
Suppose the same students provide G1 and G2 grades. Treating those values as two independent samples would ignore the matched structure. Conversely, comparing two different schools with a paired procedure would invent a relationship that does not exist. The correct nonparametric tests in SPSS begin with the sampling unit, not the appearance of the distribution.
The same principle applies to the estimand. Kruskal–Wallis and the median test can both be run on the same several-group outcome, but they do not use the same information. The worked example intentionally presents both so the reader can see the distinction.
Why generic rules fail
The rule “use nonparametric when normality fails” is too vague to be safe. It does not specify whether the data are paired, whether the outcome is ordinal, whether several groups are ordered, or whether the goal is to compare medians rather than general rank distributions. It also ignores the possibility that a robust parametric analysis remains appropriate.
A better rule is: write the null hypothesis in words, identify how observations are connected, then select the SPSS procedure whose statistic represents that hypothesis.
Assumptions for nonparametric tests in SPSS
Distribution-free does not mean design-free, tie-free or interpretation-free.
The validity of nonparametric tests in SPSS depends on correct sampling units, meaningful ranking, accurate group coding, transparent missing-value handling and an interpretation that matches the statistic actually used.
Independent or correctly related cases
Independent procedures require independent units. Related-samples procedures require valid pairings or repeated measurements from the same block.
Ordered outcome for rank methods
Mann–Whitney, Kruskal–Wallis, Wilcoxon and Friedman need an outcome that can be meaningfully ordered.
Representative sampling or assignment
Population inference still depends on the sampling or assignment design, even when the test itself does not assume normality.
Comparable shapes for median language
A rank-test result can reflect spread or shape. Interpreting it as a pure median difference requires comparable group shapes.
Symmetric paired differences
The signed-rank test has a cleaner location interpretation when paired differences are reasonably symmetric.
Transparent ties and exactness
Ties are common in grades and ratings. They affect exact calculations and should be acknowledged in the report.
How to check the assumptions in SPSS
Begin with Data View and Variable View. Confirm that each row represents the intended unit, that group values are labeled correctly, and that the outcome is numeric or ordinal as required. Then use Analyze → Descriptive Statistics → Explore to obtain group counts, medians, percentiles, boxplots and histograms. The goal is not to force the data to pass a checklist; it is to understand whether the planned interpretation is defensible.
For paired procedures, compare the number of valid pairs with the expected sample size and inspect the distribution of differences. For several independent groups, inspect whether one group is extremely small or has a radically different shape. In the worked example, the “other” guardian group has only 41 observations, much fewer than the mother group’s 455, so group summaries are essential context.
Assumptions that are often misstated
It is inaccurate to say that nonparametric tests in SPSS have no assumptions. They make fewer assumptions about a parametric distribution, but they may make stronger demands on independence, exchangeability, symmetry or comparable shapes depending on the method. A significance value cannot repair a miscoded grouping variable or a violated pairing structure.
It is also inaccurate to say that Kruskal–Wallis always tests medians. The test evaluates rank distributions. The median test is the procedure in this article that explicitly classifies observations around the pooled median.
FREQUENCIES VARIABLES=guardian G3

/ORDER=ANALYSIS.EXAMINE VARIABLES=G3 BY guardian

/PLOT=BOXPLOT HISTOGRAM

/COMPARE=GROUP

/STATISTICS=DESCRIPTIVES PERCENTILES

/CINTERVAL=95

/MISSING=LISTWISE.
SPSS setup, variable coding and reproducibility
Correct output begins with correct measurement levels, labels, missing values and case structure.
A reliable workflow for nonparametric tests in SPSS should make variable roles explicit before opening the hypothesis-test dialog. The worked analysis uses numeric final grade G3 as the test field and guardian as a three-category grouping field.
Variable View checklist
A grouping field may be string or numeric in the modern procedure. Legacy dialogs are often simpler with a numeric grouping code, so this guide also provides a transparent recode syntax.
Why pasted syntax matters
Menu selections are useful for learning, but a pasted command is the permanent analysis record. Syntax captures the test field, grouping field, missing-value rule and requested tests in a form that can be rerun after the data are updated. It also reduces the risk that two analysts click slightly different settings while believing they ran the same procedure.
For production-quality nonparametric tests in SPSS, save the syntax file together with the data and output. Use brief comments to identify the analysis purpose and the decision rule.
Modern versus legacy procedures
The modern Analyze → Nonparametric Tests interfaces organize analysis by one-sample, independent-samples and related-samples objectives. They can choose tests automatically or allow a custom selection. They also create a Hypothesis Test Summary and detailed model-view output.
The legacy dialogs remain useful because many textbooks show them and because the output is compact and familiar. Both approaches are SPSS workflows. The important requirement is to document which procedure and settings produced the reported result.
Missing data scope
Listwise or analysis-specific exclusion can change the valid sample size. Always compare the number of valid cases in output with the expected source count. The verified workbook contains 649 complete G3 and guardian records. If the SPSS output shows a different number, stop and investigate before interpreting the test.
When several outcomes are tested together, the missing-value scope becomes especially important because one setting can exclude cases based on all selected fields while another can analyze each field with its available cases.
Worked SPSS example: final grades by guardian group
Two complementary several-group procedures are used: Kruskal–Wallis for pooled ranks and the median test for pooled-median classifications.
This worked example demonstrates nonparametric tests in SPSS using final grade G3 across mother, father and other guardian groups. The analysis contains 649 valid cases and preserves the original unequal group sizes.
Research questions
Rank-distribution question: Are the G3 distributions identical across the three guardian groups?
Kruskal–Wallis evaluates whether the pooled ranks are distributed as expected under a common population distribution.
Median-classification question: Is the proportion of students above the pooled median the same across groups?
Values equal to the pooled median are classified at or below in the verified workbook.
Variables and coding
| Role | Variable | Definition |
|---|---|---|
| Test field | G3 | Numeric final grade, observed from 0 to 19. |
| Grouping field | guardian | mother, father or other. |
| Pooled-median threshold | 12 | Calculated over all 649 observations. |
| Significance level | α = .05 | Decision threshold used for both omnibus procedures. |
| Guardian | n | Mean | SD | Median | Q1 | Q3 | IQR | Range |
|---|---|---|---|---|---|---|---|---|
| Mother | 455 | 11.8967 | 3.2799 | 12 | 10 | 14 | 4 | 0–19 |
| Father | 153 | 12.2026 | 3.1920 | 12 | 11 | 14 | 3 | 0–19 |
| Other | 41 | 10.9024 | 2.6249 | 11 | 10 | 12 | 2 | 0–15 |
What the descriptives suggest
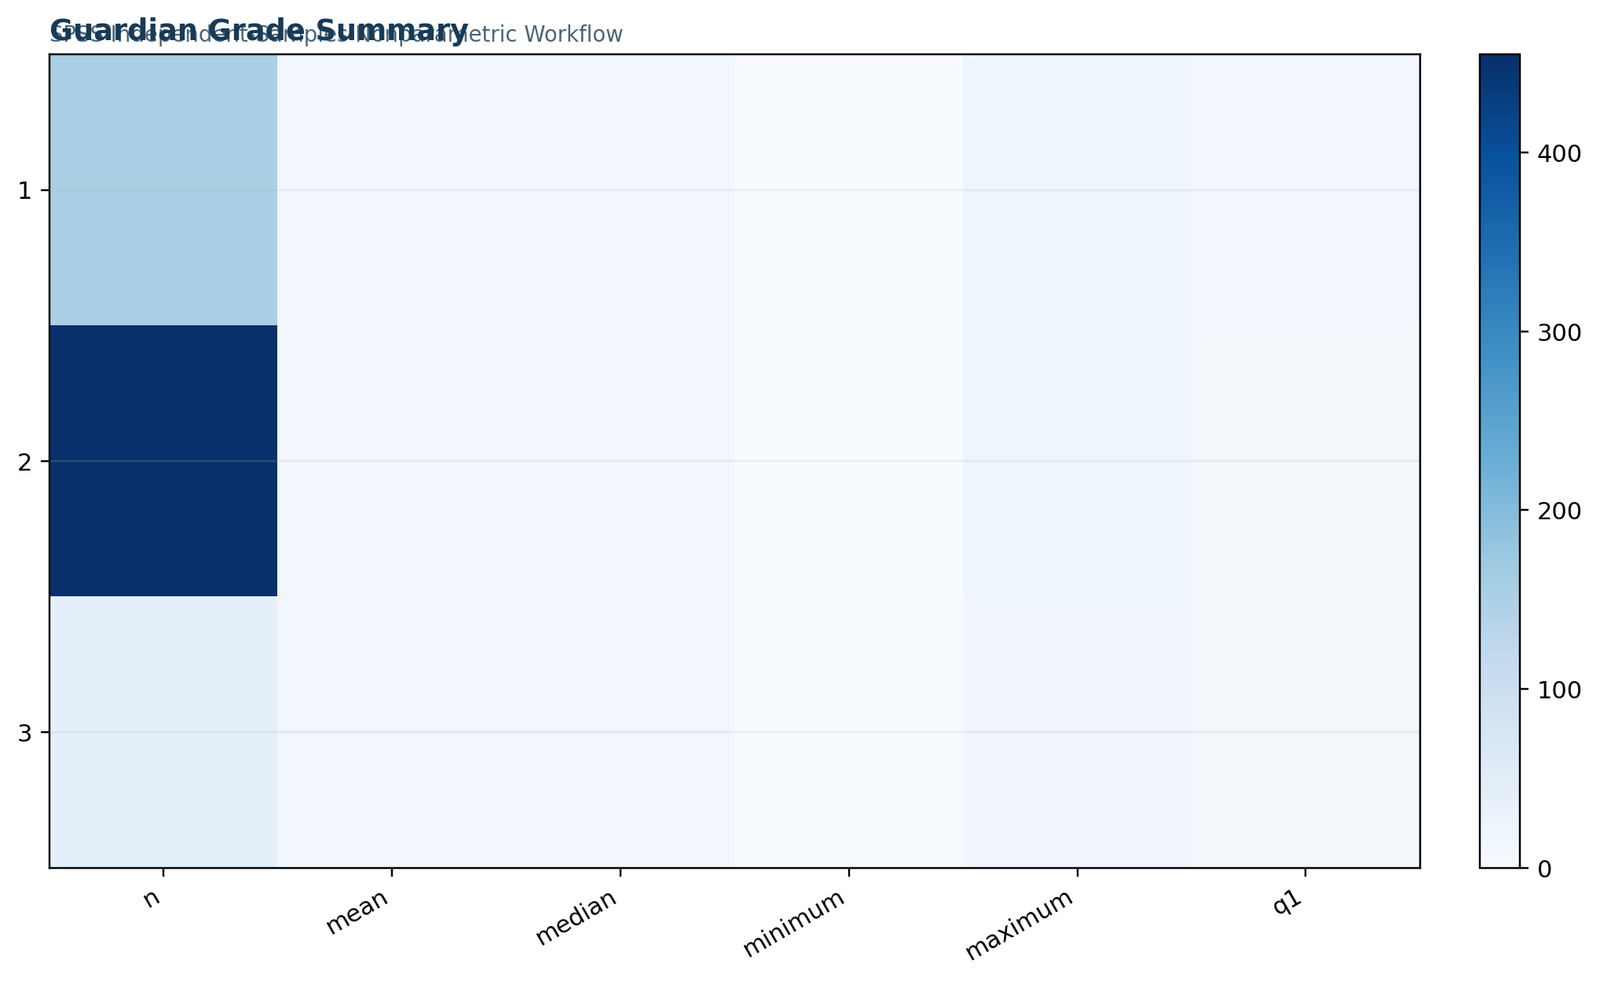
The mother and father groups both have median 12, while the other group has median 11. The father group has the highest mean, and the other group has the lowest mean and the narrowest IQR. These differences provide a descriptive reason to perform the omnibus tests, but they do not replace the inferential analysis.
The unequal sample sizes also matter for visual interpretation. The mother group contains roughly eleven times as many cases as the other group, so the precision of group summaries is not equal.
Why two SPSS methods are reported
Kruskal–Wallis uses the full ordering of all 649 observations and is generally more informative about rank distribution differences. The median test discards within-category ordering and asks whether group membership is associated with being above versus at/below the pooled median. Agreement between the two methods strengthens the conclusion that the group pattern is not limited to one computational representation.
Disagreement would not automatically mean that one test is wrong; it could mean the methods are responding to different aspects of the data.
NPTESTS

/INDEPENDENT TEST(G3) GROUP(guardian)

KRUSKAL_WALLIS

MEDIAN(TESTVALUE=SAMPLE)

/MISSING SCOPE=ANALYSIS USERMISSING=EXCLUDE

/CRITERIA ALPHA=0.05 CILEVEL=95.Verified Kruskal–Wallis and median-test calculations
The workbook separates pooled-rank verification from the pooled-median contingency calculation.
The exact values below are the statistical foundation of this nonparametric tests in SPSS article. The workbook reconciles each final result with an independently verified reference.
Kruskal–Wallis result
Reject the common-distribution null
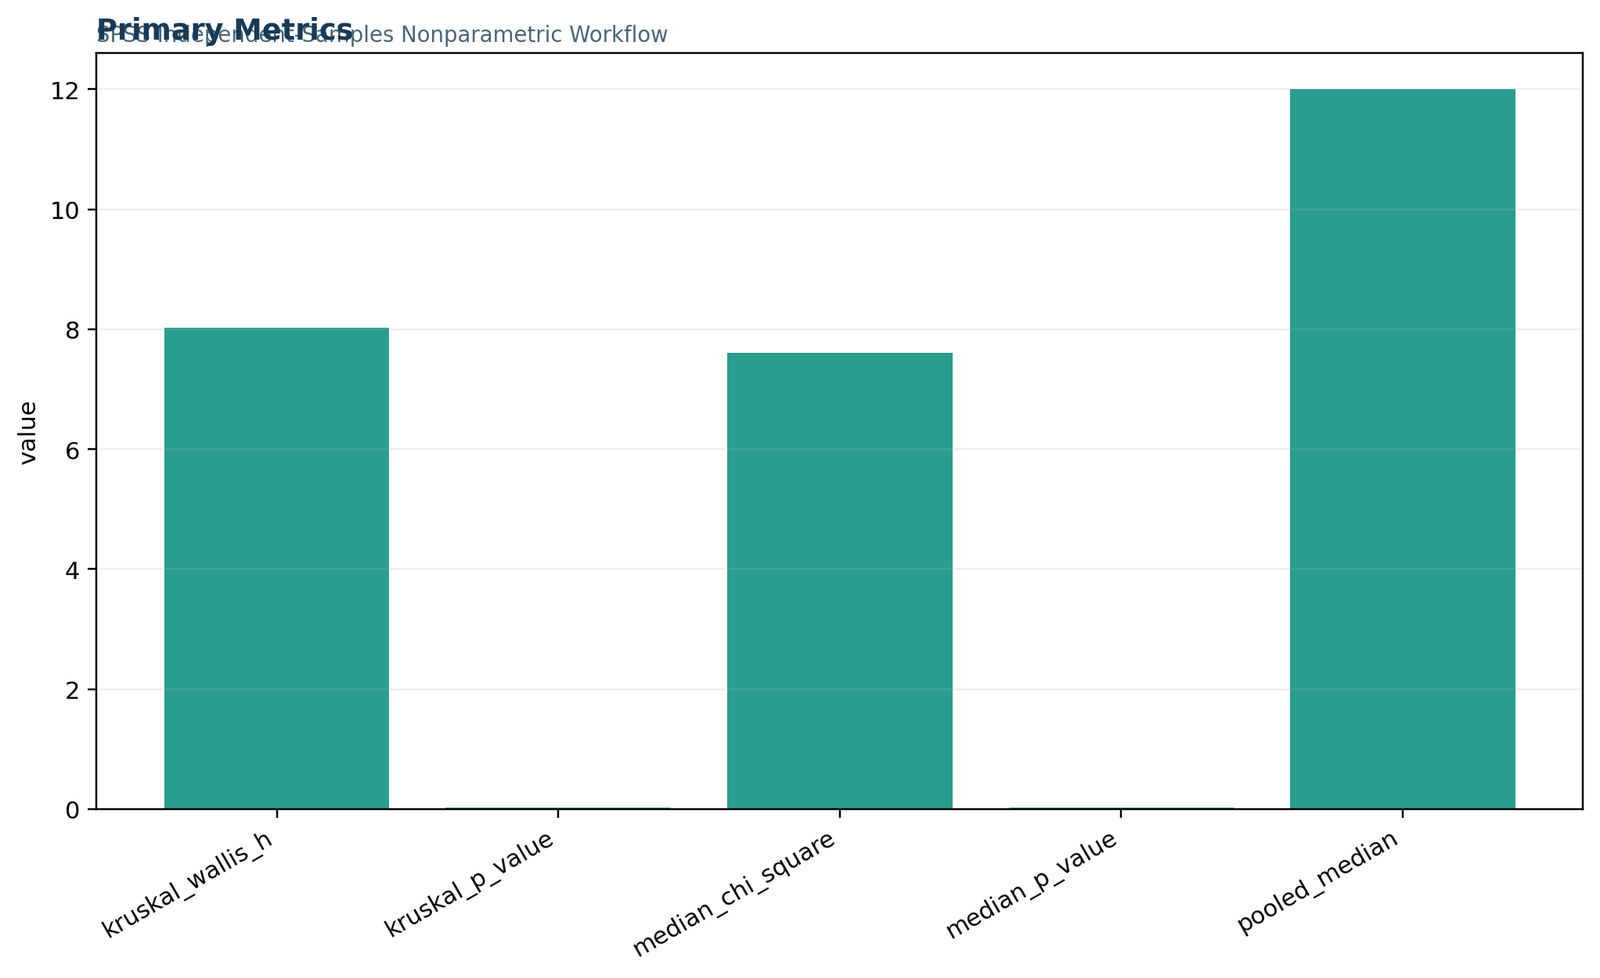
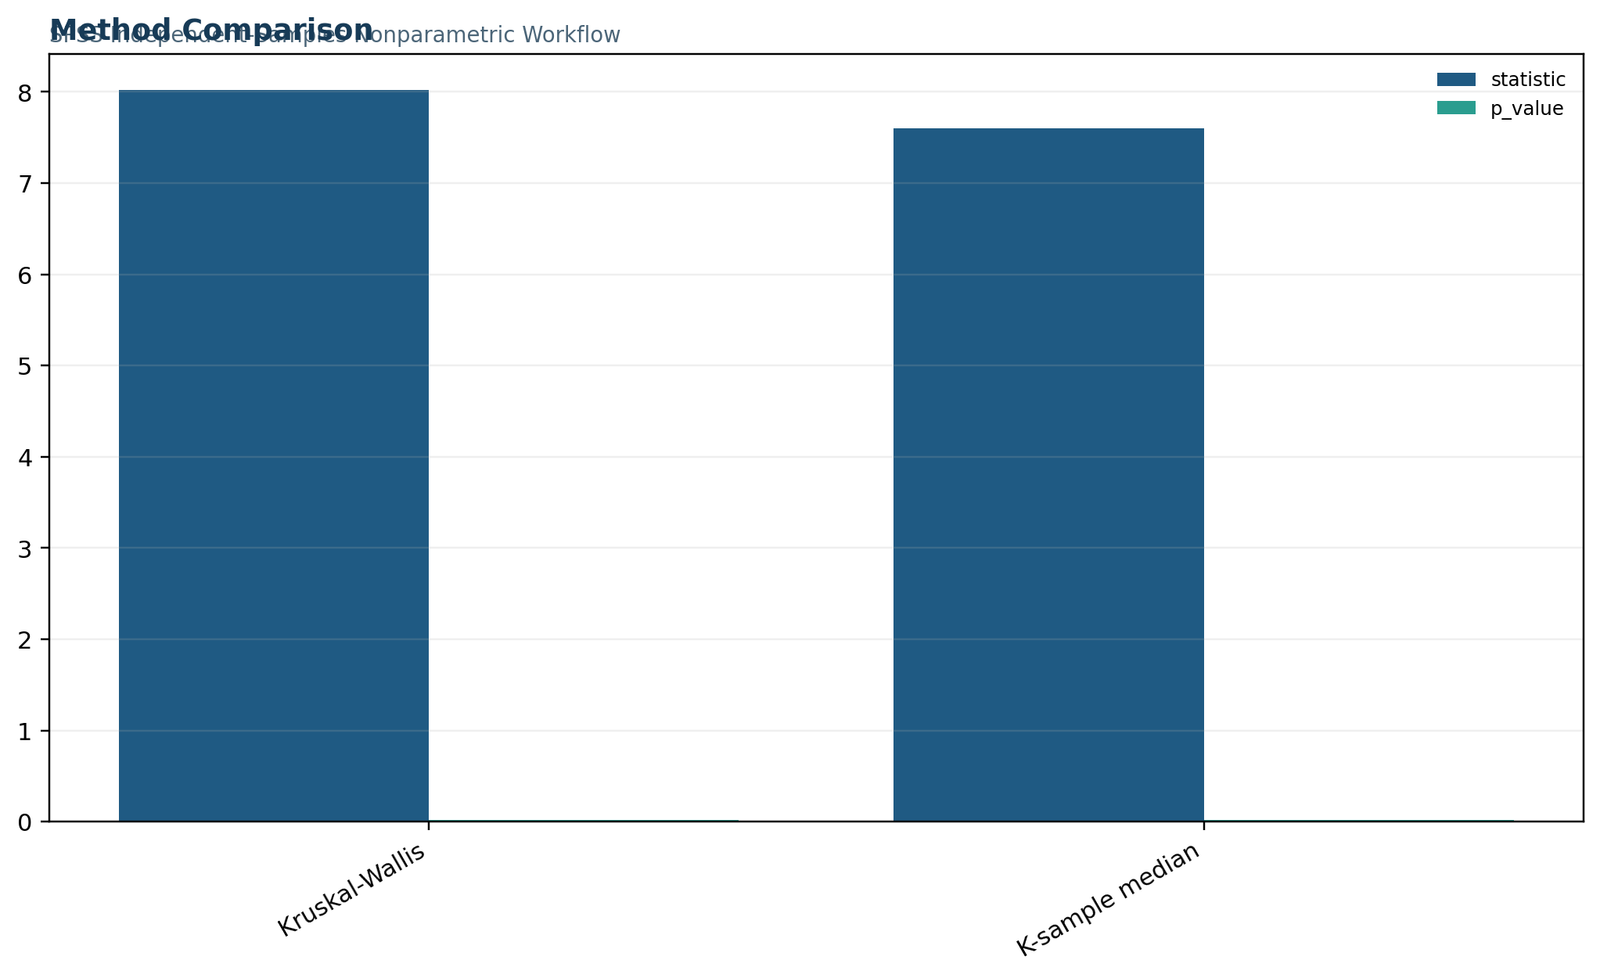
The tie-corrected statistic is H = 8.0177396 with df = 2. At α = .05, the rank distributions are not treated as identical across guardian groups.
Median-test result
Reject equal pooled-median proportions
The pooled-median contingency statistic is χ² = 7.6041641 with df = 2. The proportion above median 12 differs across groups.
Pooled-median observed and expected counts
| Guardian | Observed above 12 | Observed at/below 12 | Expected above | Expected at/below | Above-median rate |
|---|---|---|---|---|---|
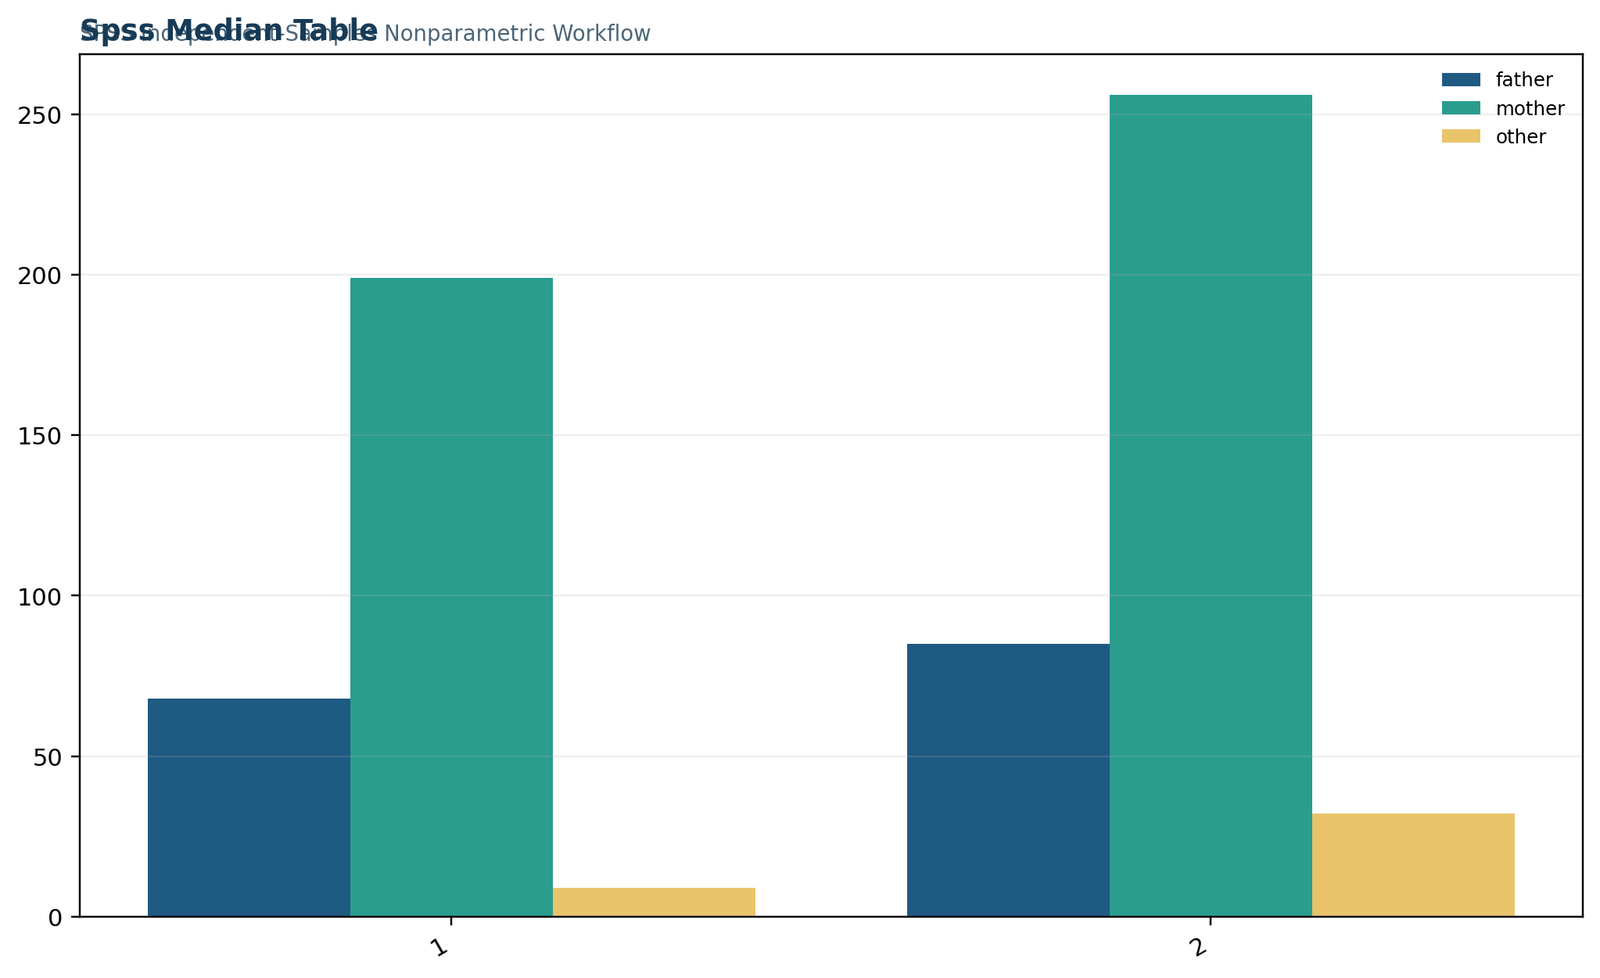
| Father | 68 | 85 | 65.0663 | 87.9337 | 44.44% |
| Mother | 199 | 256 | 193.4977 | 261.5023 | 43.74% |
| Other | 9 | 32 | 17.4361 | 23.5639 | 21.95% |
| Total | 276 | 373 | 276 | 373 | 42.53% |
For each guardian group, the expected count is row total multiplied by column total and divided by N = 649. The strongest departure occurs in the “other” group, which has only 9 students above the pooled median compared with an expected 17.436.
Why the median table is informative
The mother and father groups have nearly identical above-median rates, approximately 43.7% and 44.4%. The other group’s rate is only about 22.0%. That contrast explains the significant median-test chi-square. It also gives a direct, understandable interpretation that complements the pooled-rank result.
However, the median table should not be used to claim that mother and father are identical or that the other group differs significantly from both in separate adjusted tests. The table is descriptive within an omnibus procedure.
Why the Kruskal result adds value
Kruskal–Wallis uses every rank, not only whether a grade is above 12. It therefore captures ordering differences throughout the distributions. The significant H = 8.0177 indicates that the overall rank pattern is unlikely under a common distribution, even after accounting for ties.
When both procedures reject, the analyst can say that the guardian groups differ under two complementary nonparametric summaries, while still avoiding unsupported pairwise claims.
| Metric | Workbook value | Verified reference | Absolute difference |
|---|---|---|---|
| Kruskal–Wallis H | 8.0177395916 | 8.0177395916 | 0 |
| Kruskal p-value | 0.0181539013 | 0.0181539013 | 0 |
| Median chi-square | 7.6041641492 | 7.6041641492 | < 0.000000000000001 |
| Median-test p-value | 0.0223242427 | 0.0223242427 | < 0.000000000000001 |
| Pooled median | 12 | 12 | 0 |
SPSS charts for the verified guardian-grade analysis
Chart 1 is full width; charts 2–3 and 4–5 are displayed as paired rows.
The five charts below are used only as SPSS charts in this SPSS-only post. Their narratives are grounded in the verified workbook values rather than generic image descriptions.
Primary SPSS metrics
The full-width summary brings the two omnibus procedures together: N = 649, Kruskal–Wallis H = 8.0177 with p = 0.0182, and median-test χ² = 7.6042 with p = 0.0223. Because both p-values are below .05, both procedures reject their respective null hypotheses.
Guardian grade summaries
The mother and father groups both have median 12, while the other group has median 11. Father has the highest mean at 12.2026; other has the lowest at 10.9024 and the narrowest IQR at 2. The figure helps explain why the omnibus result is significant even though two group medians match exactly.
SPSS median-test table
The mother and father groups are close to their expected above-median counts, while the other group has 9 observed above the pooled median against 17.436 expected. That shortfall is the clearest cell-level contribution to the significant median-test result.
Kruskal–Wallis versus median test
The method comparison emphasizes that Kruskal–Wallis uses pooled ranks across the full grade scale, whereas the median test reduces grades to above versus at/below 12. Both procedures are significant here, but the chart reminds readers that they answer related—not identical—questions.
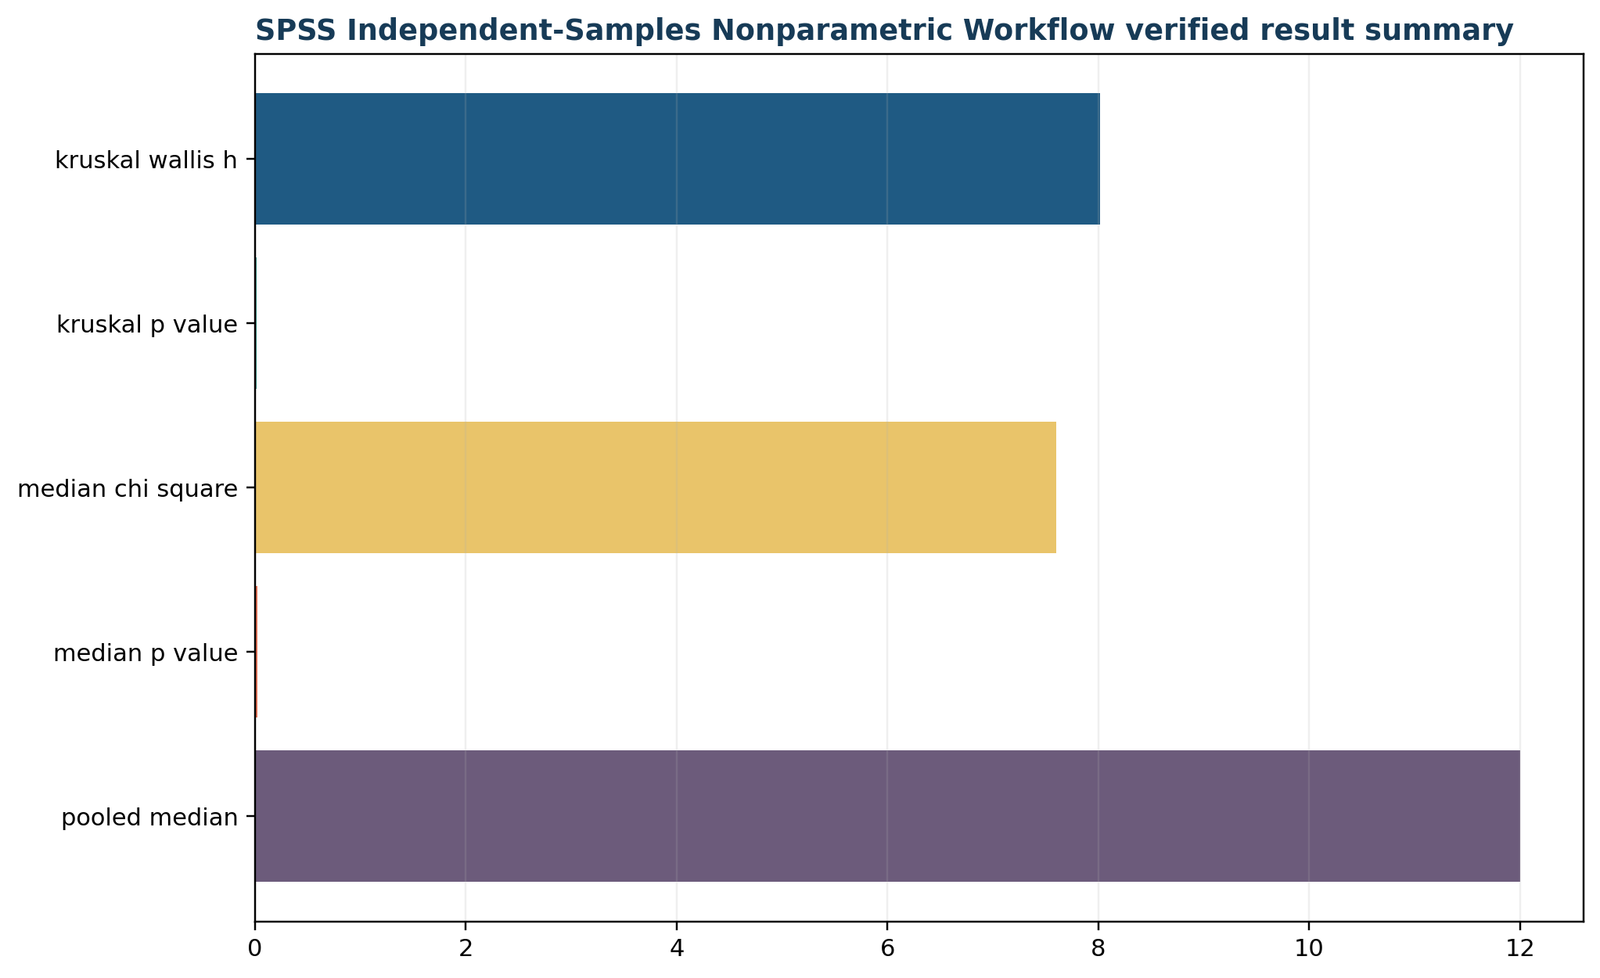
Verified SPSS result summary
The final panel reconciles the group counts, pooled median, observed contingency counts and both omnibus tests. The consistent workbook-reference differences of zero or numerical rounding error confirm that the narrative, tables and downloadable SPSS report describe the same analysis.
Independent-samples nonparametric tests in SPSS
Use these procedures when each case belongs to one group and contributes one outcome value.
Independent-samples nonparametric tests in SPSS cover two-group and several-group designs. The modern interface can automatically choose Mann–Whitney for two groups or Kruskal–Wallis for several groups, but a custom objective is better when the analyst wants explicit control.
Mann–Whitney U
Use Mann–Whitney U for two independent groups with an ordinal or continuous outcome. SPSS ranks all observations together and evaluates whether the rank distributions differ. Report the U statistic, standardized test statistic if provided, p-value, group medians and an effect size.
Kruskal–Wallis H
Use Kruskal–Wallis for three or more independent groups. The result is omnibus: a significant H indicates that at least one distribution differs. Multiple comparisons or planned contrasts are needed to localize the pattern.
Median test
Use the median test when the explicit question concerns classification around a common median. It is robust and easy to explain but generally less efficient because it discards ordering information within the two median categories.
Two independent groups workflow
Choose Analyze → Nonparametric Tests → Independent Samples. On Fields, assign the continuous or ordinal outcome as Test Fields and the two-level group variable as Groups. On Settings, select Customize tests and request Mann–Whitney U. Use the Run button to create the output, then open the detailed view for ranks and significance.
When the group field has more than two levels, Mann–Whitney is not the correct omnibus test. Either filter to a planned two-group comparison or use a several-group method.
Several independent groups workflow
With three or more groups, select Kruskal–Wallis. If the research question specifically concerns medians, select the median test as a separate procedure rather than pretending that the rank test is a direct median test. If the groups have a meaningful order, an ordered-alternative test may be more efficient than a general omnibus procedure.
Always compare the hypothesis-test summary with the descriptive group table. A significant omnibus p-value without group medians, IQRs and sample sizes is incomplete reporting.
* Two related measurements.

NPAR TESTS

/WILCOXON=G1 WITH G2 (PAIRED)

/SIGN=G1 WITH G2 (PAIRED).* Three repeated grade measurements.

NPAR TESTS

/FRIEDMAN=G1 G2 G3.
Several-group nonparametric analysis in SPSS
Kruskal–Wallis, the median test and ordered-alternative procedures solve different several-group problems.
Several-group nonparametric tests in SPSS require an omnibus strategy and a clearly stated follow-up plan. The worked example demonstrates the first two layers: pooled ranks and pooled-median classification.
Kruskal–Wallis as the primary omnibus test
Kruskal–Wallis is often the most informative general several-independent-samples procedure because it uses all pooled ranks. When group shapes are broadly comparable, a significant result is often discussed as a location difference. When shapes differ, the result should be described more generally as a distributional rank difference.
In the guardian example, H(2) = 8.0177 and p = .018. That result is significant but does not itself specify that the “other” group differs from both mother and father. The descriptive pattern suggests that possibility, but formal pairwise inference requires an adjusted comparison strategy.
Median test as a complementary view
The median test produces a simple table showing how many cases in each group lie above and at/below the pooled median. It is easy to explain to nontechnical readers and is less sensitive to extreme magnitudes. Its cost is reduced power because grades of 13 and 19 are treated identically once both are classified above 12.
Here, the “other” group has an above-median rate around 22%, compared with approximately 44% in the other two groups. That contrast produces χ²(2) = 7.6042, p = .022.
Ordered groups
If groups have a prespecified natural order, an ordered-alternative procedure may use that information more efficiently than Kruskal–Wallis. The ordering must be substantive and decided before inspecting the outcomes. Sorting group labels alphabetically does not create a scientific order.
Post-hoc comparisons
When the omnibus result is significant, request or calculate pairwise comparisons with multiplicity control. The adjustment rule should be chosen before interpreting results. Report adjusted p-values, not a selective set of raw pairwise values.
One-sample nonparametric tests in SPSS
One-sample procedures compare a distribution, median or category frequency with a specified reference.
One-sample nonparametric tests in SPSS are appropriate when there is one measured field and the hypothesis concerns a reference median, distribution, proportion or randomness property.
| Question | SPSS procedure | Typical output | Key decision |
|---|---|---|---|
| Is a population median equal to a reference? | One-sample Wilcoxon | Test statistic and significance | Choose reference before analysis |
| Does a binary proportion equal a target? | Binomial test | Observed proportion and exact significance | Define success category clearly |
| Do category frequencies match expectations? | One-sample chi-square | Observed and expected counts | Expected probabilities must sum to one |
| Does a continuous variable follow a reference distribution? | One-sample distribution test | Distribution-distance statistic | Parameters and ties affect interpretation |
| Is a sequence random? | Runs test | Runs count, standardized statistic and p | Sequence order must be meaningful |
Menu route
Choose Analyze → Nonparametric Tests → One Sample. Assign the field, then select an automatic objective or customize the test. The objective-based interface is convenient, but the analyst should inspect the Settings tab to confirm what hypothesis is being tested.
Reference values
A one-sample test is only as meaningful as its reference. A median of 10, a proportion of .50 or a specified category distribution should come from a theory, policy, historical benchmark or preregistered target—not from searching for a value that makes the result significant.
* Two-way contingency table with chi-square and exact request.

CROSSTABS

/TABLES=school BY internet

/STATISTICS=CHISQ PHI RISK

/CELLS=COUNT EXPECTED ROW COLUMN

/EXACT=FISHER.* Paired binary outcome.

NPAR TESTS

/MCNEMAR=before_binary WITH after_binary (PAIRED).
Categorical procedures related to nonparametric analysis in SPSS
Nominal outcomes require frequency-based procedures rather than rank-based methods.
Some searches for nonparametric tests in SPSS actually describe categorical questions. When the outcome has no meaningful order, use contingency-table or exact procedures instead of assigning artificial ranks.
Chi-square through Crosstabs
For two categorical variables, use Analyze → Descriptive Statistics → Crosstabs. Request chi-square statistics and display observed, expected, row and column percentages. If expected counts are small, consider an exact procedure where appropriate.
Report the table, chi-square statistic, degrees of freedom, p-value and an effect size such as Phi or Cramér’s V. The phrase “chi square nonparametric test in SPSS” is common in search behavior, but the analysis should still be described accurately as a categorical association test.
Paired binary outcomes
When the same units are measured twice on a binary outcome, McNemar’s test evaluates discordant pairs. It is not interchangeable with an independent-samples chi-square test because the observations are paired.
The same design-first logic applies throughout nonparametric tests in SPSS: dependence and measurement scale determine the procedure before distribution shape does.
* Recode string guardian for legacy dialogs.
RECODE guardian ('father'=1) ('mother'=2) ('other'=3) INTO guardian_code.
VARIABLE LABELS guardian_code 'Guardian group numeric code'.
VALUE LABELS guardian_code 1 'Father' 2 'Mother' 3 'Other'.
EXECUTE.* Several independent samples: legacy syntax.
NPAR TESTS
/K-W=G3 BY guardian_code(1 3)
/MEDIAN=G3 BY guardian_code(1 3).
* Two independent groups.
NPAR TESTS
/M-W=G3 BY school_code(1 2).
* Paired outcomes.
NPAR TESTS
/WILCOXON=G1 WITH G2 (PAIRED)
/SIGN=G1 WITH G2 (PAIRED).
* Three repeated conditions.
NPAR TESTS
/FRIEDMAN=G1 G2 G3.
* One-sample procedures.
NPAR TESTS
/BINOMIAL(.50)=pass_indicator
/CHISQUARE=category_variable
/RUNS(MEDIAN)=G3.
SPSS syntax for common nonparametric tests
Syntax makes menu-based analyses repeatable and easier to audit.
A complete guide to nonparametric tests in SPSS should provide reusable syntax while explaining the data structure each command assumes.
Why recoding may be needed
The modern NPTESTS procedure can work directly with categorical group fields, including labeled fields. Legacy commands often require a numeric grouping range. The explicit RECODE command maps father, mother and other to 1, 2 and 3 so the legacy K-W and MEDIAN subcommands can define the full group range.
Never assume that an automatic recode uses the order you intended. Explicit mapping preserves meaning and prevents group-code mistakes.
Syntax comments and versioning
Use an asterisk followed by a period for block comments. State the purpose of the test, the outcome, the grouping field and the decision threshold. Save a dated syntax version when changing the analysis. A small amount of documentation makes the command file much more useful than a sequence of unexplained commands.
When the output is updated, rerun the whole syntax file rather than manually replacing individual tables. That keeps charts, values and interpretation synchronized.
Exact and Monte Carlo options
Some installations provide additional exact-test capabilities. When exact or Monte Carlo inference is requested, report that method explicitly. Exact calculations may be computationally expensive for larger samples, while Monte Carlo values depend on the number of samples and randomization settings.
The verified guardian example uses large-sample chi-square reference probabilities with explicit tie-aware and contingency calculations.
Batch output management
For repeatable production, use OMS or OUTPUT EXPORT commands to route selected tables to files and save the full Output Viewer. Give output objects short titles because extremely long subtitles can be truncated or difficult to read. The public report should reproduce the exact values in the saved output.
How to interpret SPSS nonparametric output
Read the hypothesis-test summary, detailed tables, group descriptives and footnotes together.
Interpreting nonparametric tests in SPSS requires more than locating “Sig.” The analyst must confirm the statistic, degrees of freedom, exact or asymptotic method, group order, valid N and any multiple-comparison notes.
Hypothesis Test Summary
The modern output summarizes the null hypothesis, test name, significance value and decision. This is useful for orientation but should not be the only reported table. Open the detailed view to inspect group ranks, pairwise comparisons or median classifications.
A decision of “Reject the null hypothesis” means the p-value is below the selected alpha. It does not measure effect size and does not prove that every group differs from every other group.
Ranks and test-statistics tables
For rank tests, inspect group n and mean rank. The mean-rank ordering helps describe which groups tend to have higher observations. The test-statistics table provides H, U, Z or chi-square, degrees of freedom where applicable and significance.
Do not infer practical importance from rank order alone. Combine ranks with group medians, IQRs and an effect-size estimate.
Median-test output
Confirm the pooled median and the above versus at/below counts. Check expected counts when recreating the contingency chi-square. In this example, values equal to 12 are included in the at-or-below category, matching the verified workbook rule.
The significant table tells you that the above-median proportion is not the same across all groups. The cell counts show that the other group contributes the clearest departure.
Footnotes and warnings
Footnotes may describe continuity correction, exact significance, ties, small expected frequencies or unavailable calculations. Warnings should never be deleted from the reasoning merely because they are inconvenient. If an exact method is unavailable, report the method that was actually used.
When SPSS output and a manually verified workbook disagree, pause the article production and reconcile group coding, missing cases, threshold rules and statistic conventions before publishing.
Effect sizes and reporting nonparametric tests in SPSS
A complete report identifies the design, groups, descriptives, statistic, p-value, effect magnitude and interpretation boundary.
Good reporting for nonparametric tests in SPSS avoids the two extremes of publishing only a p-value and publishing every output table without explanation.
APA-style worked-example report
“Final grades differed significantly across guardian groups according to a Kruskal–Wallis test, H(2) = 8.02, p = .018. A complementary median test also indicated unequal above-median proportions across groups, χ²(2, N = 649) = 7.60, p = .022. Median G3 was 12 for the mother and father groups and 11 for the other guardian group.”
This wording reports both methods, gives the main descriptive pattern and avoids claiming untested pairwise significance.
Effect-size options
For two-group rank tests, standardized r, rank-biserial correlation or probability of superiority can be reported. For Kruskal–Wallis, epsilon squared or eta-squared-type rank effects are common. For contingency-table procedures, Cramér’s V can summarize association magnitude. For Friedman, Kendall’s W is commonly used.
State the formula or software source because effect-size conventions can differ. Do not label a small p-value as a “large effect.”
Minimum reporting checklist
Common reporting errors
SPSS output PDF download
The article is SPSS-only, so only the verified SPSS report is displayed.
The downloadable report supports this guide to nonparametric tests in SPSS with the software output used for the worked guardian-grade analysis.
Nonparametric tests in SPSS FAQs
Answers to the most common method, menu and interpretation questions.
How do I run a nonparametric test in SPSS?
Choose Analyze → Nonparametric Tests and select One Sample, Independent Samples or Related Samples according to the design. Assign fields, customize the test and paste syntax before running.
Which SPSS test compares two independent groups?
Mann–Whitney U is the standard rank-based test for two independent groups.
Which SPSS test compares three or more independent groups?
Kruskal–Wallis is the standard general rank-based omnibus test for several independent groups.
Which SPSS test compares two paired measurements?
Use Wilcoxon signed-rank when signed magnitudes are meaningful, or the sign test when only direction should be used.
Which SPSS test handles three repeated conditions?
Use the Friedman test for three or more repeated or blocked conditions.
Does Kruskal–Wallis test medians?
It tests pooled-rank distribution differences. A median interpretation requires comparable group shapes.
What does the SPSS median test evaluate?
It evaluates whether groups have the same pattern of cases above versus at/below a pooled or specified median.
What was the pooled median in the worked example?
The pooled median of G3 was 12.
Was the Kruskal–Wallis result significant?
Yes. H(2) = 8.017740 with p = 0.018154.
Was the median-test result significant?
Yes. χ²(2) = 7.604164 with p = 0.022324.
Which guardian group had the lowest median grade?
The other guardian group had median G3 = 11, compared with 12 for mother and father.
Which group contributed most clearly to the median-test difference?
The other group had 9 cases above the pooled median compared with approximately 17.436 expected.
Can I use string groups in SPSS nonparametric tests?
The modern interface can use categorical fields directly. Legacy grouping-range syntax is often easier with an explicitly recoded numeric field.
Should I use the modern or legacy SPSS dialog?
Either can be valid. Use the modern interface for objective-based settings and detailed views, or legacy dialogs for compact classic output. Always save syntax.
Are nonparametric tests assumption-free?
No. They still require correct independence or pairing, meaningful outcome ordering and assumptions appropriate to the chosen interpretation.
What should I report besides the p-value?
Report group sizes, medians, IQRs, the test statistic, degrees of freedom, inference method, effect size and any multiplicity adjustment.
Can a non-significant SPSS result prove that groups are equal?
No. It means the test did not detect sufficient evidence against the null at the selected significance level.
Why does this post include only one download?
The article is intentionally SPSS-only, so only the verified SPSS output PDF is included.
How should I interpret both significant tests together?
The guardian groups differ in pooled-rank distributions and in their proportions above the pooled median, but pairwise conclusions require adjusted follow-up tests.