
Wilcoxon Signed Rank Test: 7 Steps, Formula and Worked Example
The Wilcoxon signed rank test is a magnitude-sensitive nonparametric method for two related measurements or one sample of differences. This complete guide explains what the test measures, when to use it, how zeros and tied ranks are handled, how W and V differ across software, and how to reproduce a verified G1-versus-G3 grade analysis in Python, R, SPSS and Excel.
Final grades were systematically higher than first-period grades.
For 649 paired student records, the difference was defined as G3 − G1. There were 344 positive changes, 120 negative changes, and 185 zero differences. After excluding zeros, the positive absolute-rank sum was W+ = 82,284.5 and the negative sum was W− = 25,595.5. The two-sided minimum statistic was W = 25,595.5, with tie-adjusted z = −10.099 and p = 5.5689 × 10⁻²⁴. The matched-pairs rank-biserial correlation was 0.5255, and the sample median increase was 1 grade point.
What does the Wilcoxon signed rank test measure?
A paired test that combines the direction and ranked magnitude of nonzero differences.
The Wilcoxon signed rank test begins with paired differences rather than with two separate samples. Every student, patient, machine, site or matched unit contributes one difference. The method then ranks the absolute nonzero differences and restores their signs, allowing larger changes to contribute more than smaller changes while avoiding the normality requirement of the paired t test.
The formal target
Let D = Y − X denote a paired difference. The Wilcoxon signed rank test null is most accurately expressed as a difference distribution that is symmetric around zero. Under a continuous symmetric location-shift model, that statement is equivalent to a zero median and zero pseudomedian shift. The distinction matters because the method uses both signs and magnitudes; it is not merely a count of observations above and below zero.
For the worked example, X is the first-period grade G1 and Y is the final grade G3. A positive D means that the final grade exceeds the earlier grade. Because the same student supplies both values, the pairing removes stable between-student differences from the comparison and focuses directly on within-student change.
What the test does not measure
It is not the Wilcoxon rank sum test, Mann–Whitney U test, or a comparison of two independent groups. It is also not automatically a test of means, and the phrase “test of medians” is incomplete unless the paired-difference distribution is reasonably symmetric. It does not show that every individual improved, nor does a small p-value establish that the change is educationally important.
The scientific result should therefore combine the Wilcoxon signed rank test inference with the median paired change, the counts of positive, negative and zero changes, and an effect size. This prevents a very large sample from turning a statistically detectable but trivial change into an exaggerated conclusion.
When should you use the Wilcoxon signed rank test?
Use it when the design is paired and the ranked magnitudes of within-pair changes are scientifically meaningful.
A paired Wilcoxon signed rank test is appropriate for before-and-after measurements, two conditions applied to the same subjects, matched case-control pairs, or a one-sample comparison of observations with a hypothesized value. The decision should follow the research design and estimand, not simply a failed normality test.
Confirm pairing
Each value in the first measurement must correspond to exactly one value in the second.
Create differences
Define the subtraction direction before viewing the result, such as G3 − G1.
Check the scale
Differences must be orderable, and their absolute magnitudes must be meaningful enough to rank.
Assess symmetry
A simple location-shift interpretation requires a reasonably symmetric nonzero-difference distribution.
Plan inference
Choose the zero method, exact or approximate reference, continuity correction, and effect size.
Strong applications
Use another method when
Wilcoxon signed rank test assumptions
Nonparametric does not mean assumption-free.
The most important Wilcoxon signed rank test assumptions concern correct pairing, independence between pairs, an orderable response, meaningful paired differences, and symmetry when the result is interpreted as a location or median shift. Ties and zeros do not invalidate the analysis, but they change its calculation and reference distribution.
Correctly matched pairs
The two values in each row must refer to the same observational unit or to a defensibly matched pair. A row mismatch creates artificial differences and can overwhelm the rank calculation.
Independence between pairs
One student’s difference should not determine another student’s difference. Family, classroom, school or repeated-session clustering requires additional modeling.
Ordered measurement
The response must support ordering, and the sizes of the differences must carry enough meaning for absolute differences to be ranked.
Symmetric differences
For a clean zero-median location-shift interpretation, the nonzero difference distribution should be approximately symmetric around its center.
Randomization basis
Generalization depends on random sampling, random assignment, or a clearly defined observational population. The test itself cannot repair selection bias.
Transparent zeros and ties
Zero differences and tied absolute differences must be handled by a stated rule. Software defaults are not interchangeable.
The current differences range from −11 to +11. Most observations are at −1, 0, +1 or +2, but a few large changes appear in both tails. The median is +1, the first quartile is 0 and the third quartile is +1. This structure supports a clear directional conclusion, while the sensitivity section checks whether the result depends on magnitude, zero treatment or a few influential pairs.
Hypotheses for paired and one-sample signed-rank tests
State the difference direction and the population claim before calculating ranks.
Two-sided paired hypothesis
Under a symmetric location-shift model, this is commonly summarized as a population median or pseudomedian paired change of zero.
The alternative allows either systematically higher G3 or systematically lower G3.
Directional alternatives
H₁: D is shifted above 0.
H₁: D is shifted below 0.
H₁: D differs from 0 in either direction.
A one-sided hypothesis must be prespecified. Choosing “greater” after observing that G3 is higher invalidates the intended error rate. The subtraction order must also be explicit: reversing G3 − G1 to G1 − G3 reverses the signs, swaps W+ and W−, and changes the direction of a one-sided alternative.
Applied statement for the worked data
The analysis tests whether the paired student-grade differences G3 − G1 are centered symmetrically around zero. The observed median difference is +1. Positive changes occur in 344 rows and negative changes in 120 rows. More importantly for the Wilcoxon signed rank test method, the positive ranked magnitude is 82,284.5 compared with 25,595.5 for negative changes. This produces overwhelming evidence against the zero-centered null.
Wilcoxon signed rank test formula and seven calculation steps
The full calculation explains W, V, ties, zeros, z and the p-value.
The Wilcoxon signed rank test formula is simple only after the data preparation rules are made explicit. The calculation must preserve pairs, define the sign direction, remove or otherwise treat zeros, rank tied absolute differences with midranks, and distinguish the positive rank sum from the minimum two-sided statistic.
Step 1: calculate paired differences
For this example, dᵢ = G3ᵢ − G1ᵢ. Positive values represent higher final grades.
Step 2: identify zero differences
Under the conventional Wilcox rule, dᵢ = 0 observations are removed from the rank calculation. They remain important descriptive information. Here 185 of 649 pairs are unchanged, leaving n = 464 nonzero differences.
Step 3: rank the nonzero absolute differences
Tied absolute differences receive their average rank. The 276 absolute differences of one receive rank 138.5, while the 119 absolute differences of two receive rank 336.0.
Step 4: restore the signs
A positive difference contributes a positive rank and a negative difference contributes a negative rank.
Step 5: sum positive and negative ranks
In the worked analysis, W+ = 82,284.5 and W− = 25,595.5. Their sum is n(n+1)/2 = 107,880, verifying that every nonzero rank is allocated exactly once.
Step 6: define the reported statistic
Many two-sided implementations report the smaller sum. R commonly reports V = W+, while MATLAB and SPSS may label a positive-rank statistic or standardized result. Always name the convention.
Step 7: standardize with tie adjustment
The summation runs over tie groups in the nonzero absolute differences. For these data, Var = 7,877,035.875 and SE = 2,806.605757.
Using the minimum statistic produces a negative standardized value. The two-sided probability is 2Φ(−|z|) = 5.568917 × 10⁻²⁴ without continuity correction.
| Absolute difference | Frequency among nonzero pairs | Assigned midrank | Role in the calculation |
|---|---|---|---|
| 1 | 276 | 138.5 | Most common magnitude; dominates the number of ranked observations. |
| 2 | 119 | 336.0 | Second-most common magnitude and a major part of W+. |
| 3 | 42 | 416.5 | Moderate paired changes. |
| 4 | 9 | 442.0 | Less frequent, higher-ranked changes. |
| 5–11 | 18 | 449.5–463.5 | Tail observations with high individual ranks but low frequency. |
Worked example: G1 versus G3 student grades
A fully auditable paired analysis with 649 rows.
Research scenario and variables
The source data contain the same students’ first-period grade G1 and final grade G3. The observational unit is the student row, so the measurements are paired. The research question is whether final grades are systematically shifted relative to first-period grades.
| Role | Variable | Meaning |
|---|---|---|
| Earlier measurement | G1 | First-period numeric grade. |
| Later measurement | G3 | Final numeric grade. |
| Paired difference | G3 − G1 | Positive means final grade is higher. |
| Valid paired rows | 649 | Rows with both values present. |
Descriptive context
G1 has mean 11.3991, median 11 and standard deviation 2.7453. G3 has mean 11.9060, median 12 and standard deviation 3.2307. The paired difference has mean 0.5069, median 1 and standard deviation 1.8208. Its first and third quartiles are 0 and 1.
These summaries already suggest improvement, but they do not incorporate the pairing in an inferential calculation. The signed-rank test asks whether the direction and ranked magnitude of the within-student differences are consistent with a zero-centered symmetric distribution.
| Difference G3 − G1 | Count | Interpretive note |
|---|---|---|
| −11 to −3 | 18 | Large declines are uncommon but must be inspected. |
| −2 | 17 | Moderate decline. |
| −1 | 85 | Most frequent negative change. |
| 0 | 185 | Excluded from conventional signed ranks and reported separately. |
| +1 | 191 | Most frequent positive change. |
| +2 | 102 | Substantial contribution to positive rank sum. |
| +3 to +11 | 51 | Larger improvements, including a small number of extremes. |
Wilcoxon signed rank test results and effect size
Statistical significance, practical magnitude and software conventions reconciled.
Primary inference
Reject H₀
The tie-adjusted normal approximation places the observed minimum rank sum more than ten standard errors from its null expectation. The evidence for a positive shift from G1 to G3 is overwhelming.
Calculation audit
Matched-pairs rank-biserial
This effect size compares positive and negative ranked evidence. A positive value means the ranked changes favor G3, and a magnitude above 0.5 is substantial in this sample.
Standardized r
This widely reported standardized measure uses the 464 nonzero pairs. State the denominator because using all 649 pairs would yield a different number.
Original-unit change
The grade-point scale remains essential. The effect sizes describe ranked dominance, while the median communicates a typical observed change in the original units.
| Evidence | Result | What it adds |
|---|---|---|
| Signed-rank normal approximation | z = −10.099, p = 5.5689 × 10⁻²⁴ | Magnitude-sensitive inference with tie adjustment. |
| Continuity-corrected approximation | p = 5.5790 × 10⁻²⁴ | Shows the decision is insensitive to the optional correction. |
| Exact two-sided sign test | p = 4.1673 × 10⁻²⁶ | Direction-only sensitivity analysis; zeros excluded. |
| Rank-biserial correlation | 0.5255 | Quantifies positive versus negative ranked magnitude. |
| Median paired difference | +1 grade point | Returns the finding to the observed measurement scale. |
Wilcoxon signed rank test in Python
SciPy calculation, zero handling, tie-aware approximation and chart interpretation.
The Wilcoxon signed rank test in Python is available through scipy.stats.wilcoxon. For auditable work, create and round the paired differences explicitly, document zero_method, choose the approximation method, and inspect the returned statistic convention before comparing it with R or SPSS.
import numpy as np
import pandas as pd
from scipy import statsdf = pd.read_csv("dataset.csv")
d = (df["G3"] - df["G1"]).dropna().to_numpy()
d = np.round(d, 12) # prevents artificial near-zero differences
result = stats.wilcoxon(
d,
zero_method="wilcox",
correction=False,
alternative="two-sided",
method="approx"
)
print(f"W minimum = {result.statistic:.6f}")
print(f"z = {result.zstatistic:.6f}")
print(f"p = {result.pvalue:.12e}")
# W minimum = 25595.500000
# z = -10.099210
# p = 5.568917452888e-24
Why pass the difference vector?
Passing a precomputed difference vector makes the subtraction order visible and allows deliberate rounding before equality and zero checks. Floating-point subtraction can create tiny nonzero values that should be zero, causing inconsistent ranks. That issue is less visible when two vectors are passed directly.
Zero-method sensitivity
The conventional wilcox result is the primary analysis. With these data, the Pratt method gives statistic 47,795.5 and p = 8.44 × 10⁻²⁶, while z-split gives statistic 56,398.0 and p = 2.30 × 10⁻²⁵. All reject strongly, but they answer slightly different zero-handling implementations.
Python chart 1: Primary metrics
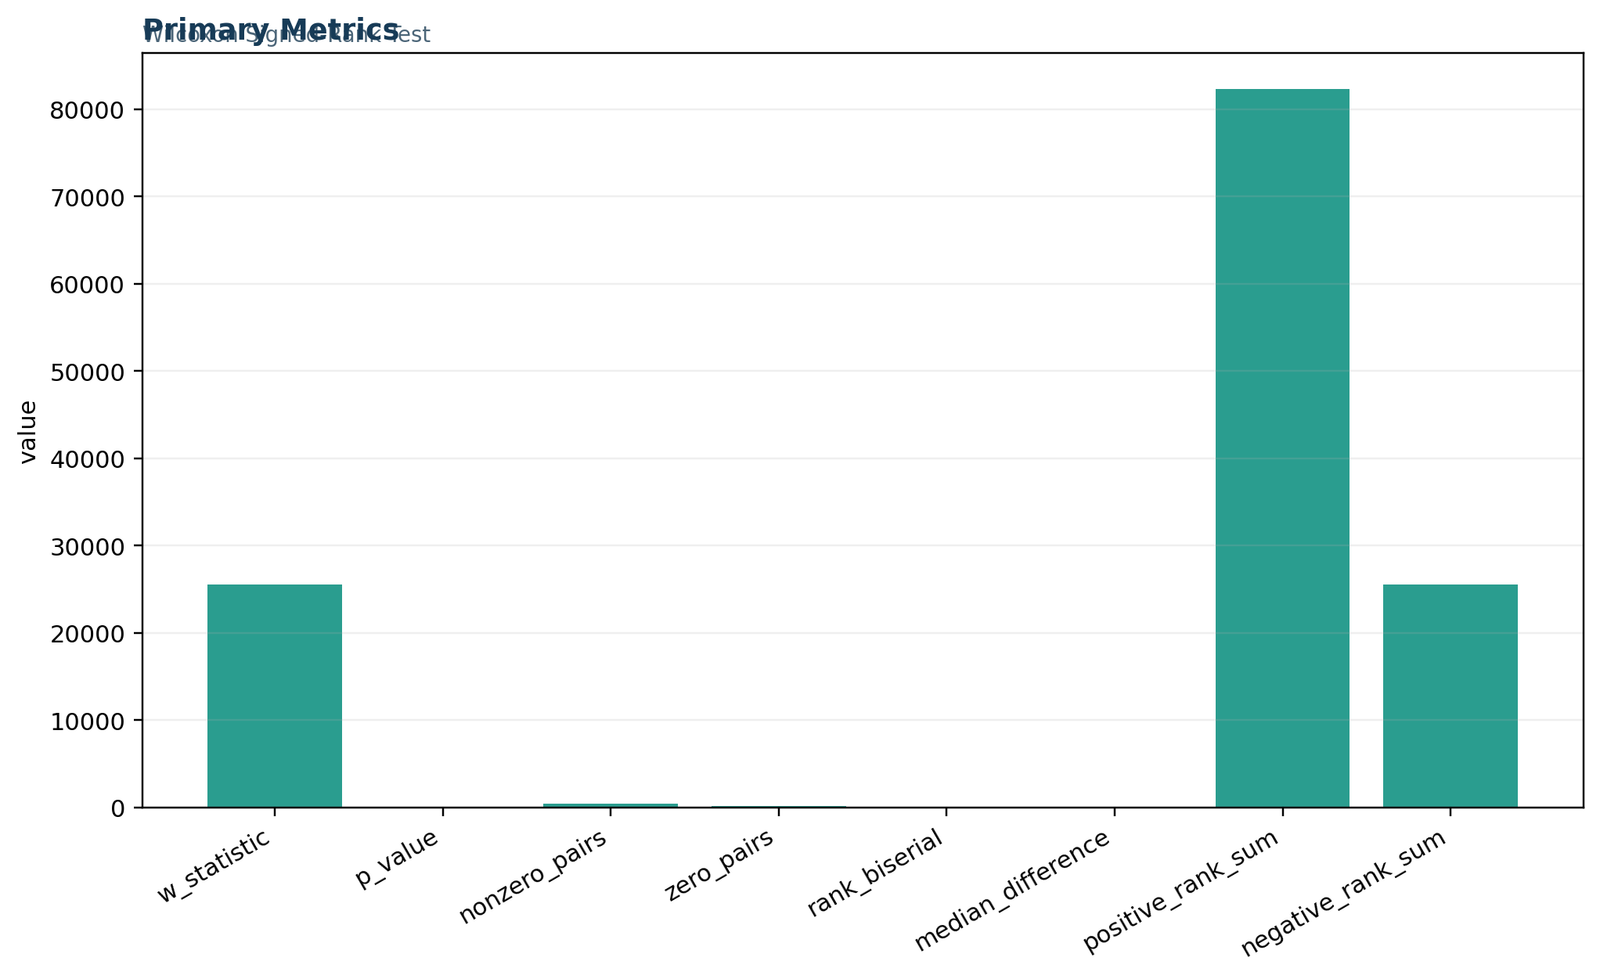
The primary-metrics chart combines the minimum signed-rank statistic, p-value, nonzero and zero-pair counts, matched-pairs rank-biserial correlation, median paired difference, and the positive and negative rank sums. The very large positive-rank total—82,284.5 versus 25,595.5—shows that increases from G1 to G3 were not only more frequent but also carried substantially greater ranked magnitude.
Python chart 2: Signed paired differences
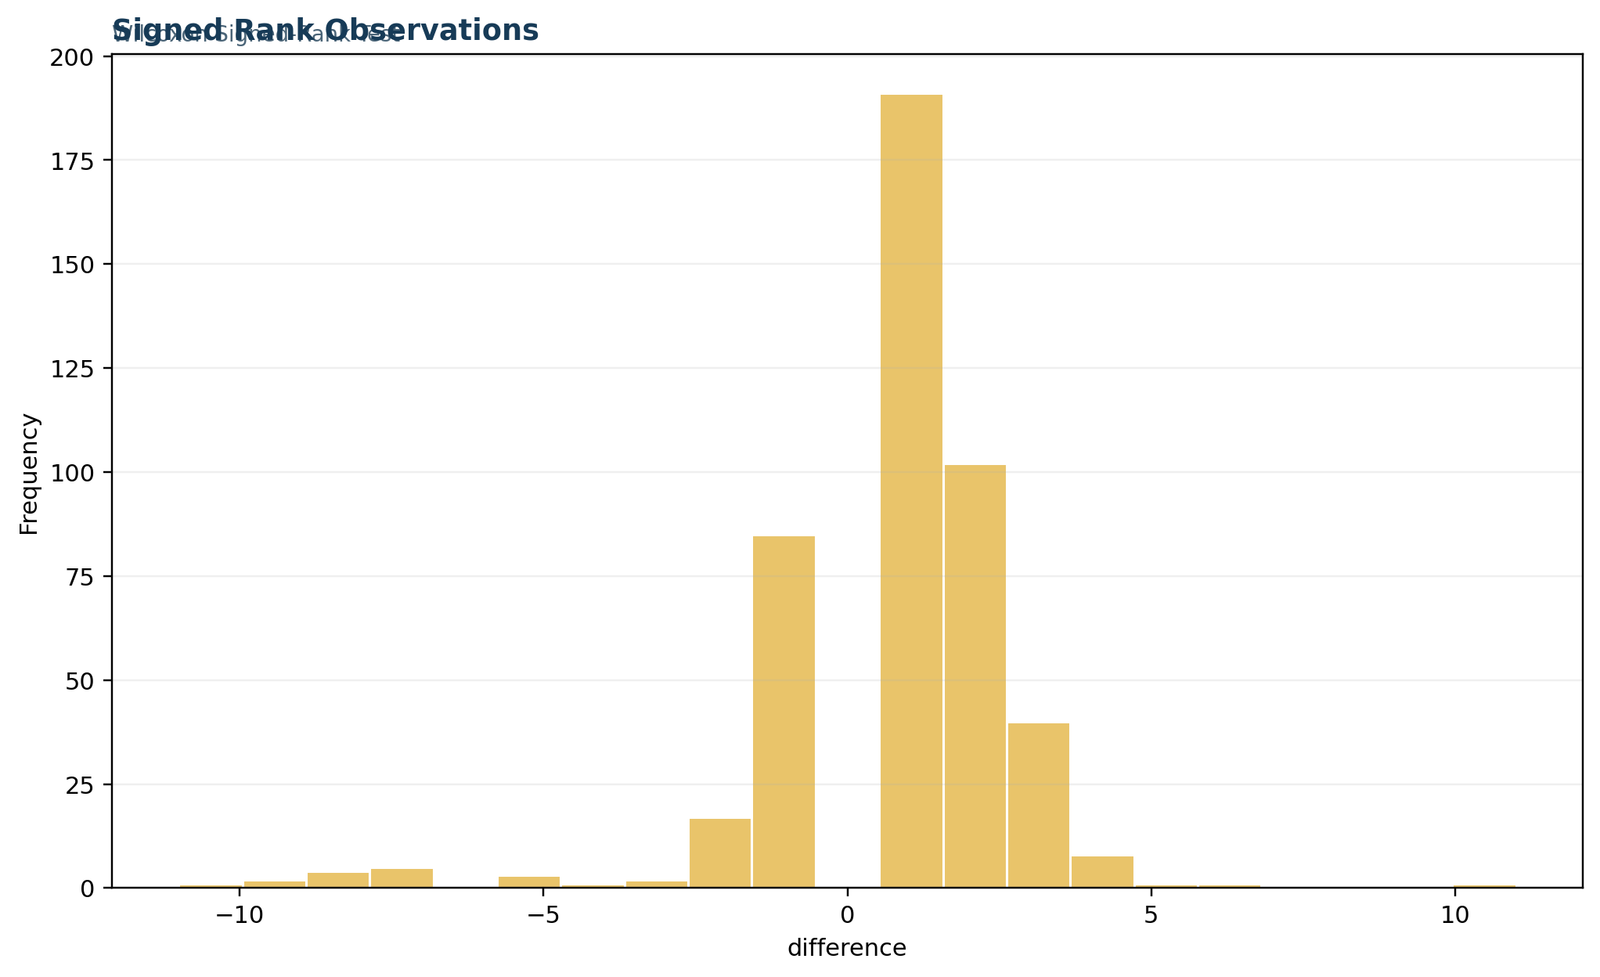
The signed-difference distribution is concentrated at 0, +1, and +2 grade points. There are 185 unchanged pairs, 344 positive differences, and 120 negative differences. The plot also reveals a small number of large positive and negative changes, which is why a magnitude-sensitive signed-rank analysis gives more information than a sign test based only on direction.
Python chart 3: Positive and negative rank sums
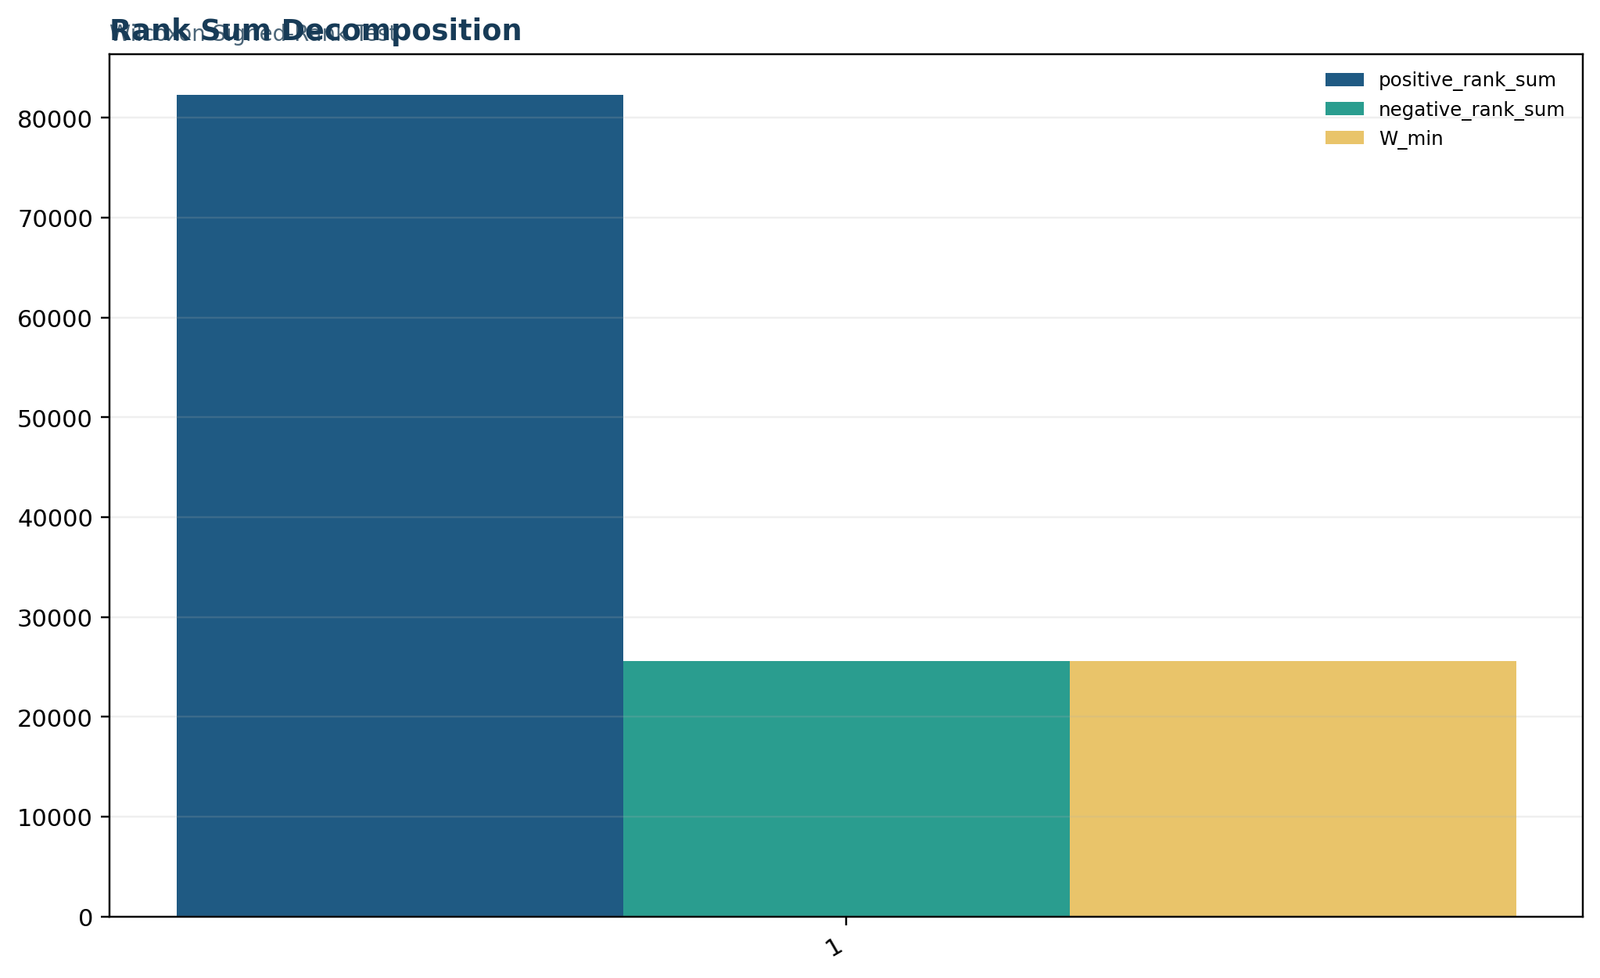
The decomposition verifies the central arithmetic identity. The nonzero absolute ranks sum to 107,880.0; 82,284.5 belongs to positive differences and 25,595.5 belongs to negative differences. The reported two-sided statistic is the smaller sum, W = 25,595.5, while some software instead prints the positive sum as V or W+.
Python chart 4: Difference-frequency audit
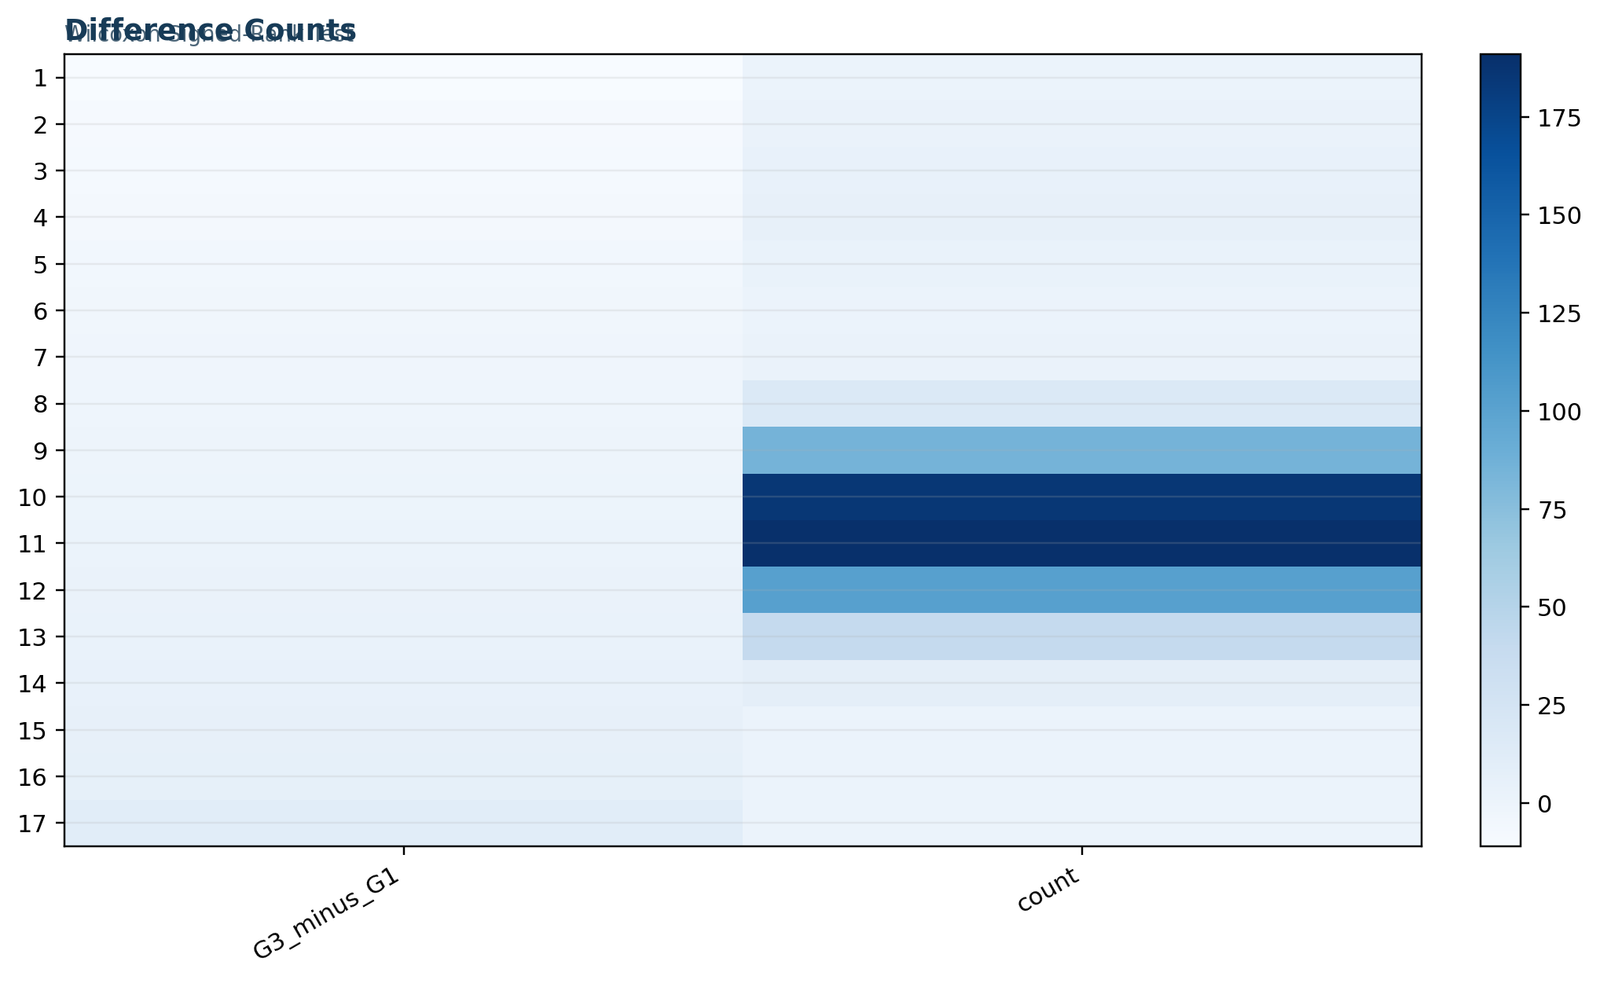
The frequency display tracks every observed value of G3 − G1. A +1 change occurred 191 times and a +2 change occurred 102 times, compared with 85 changes of −1 and 17 changes of −2. The tails include a few changes as large as ±11, so the assumptions section explains why symmetry and influential pairs must be checked rather than assumed.
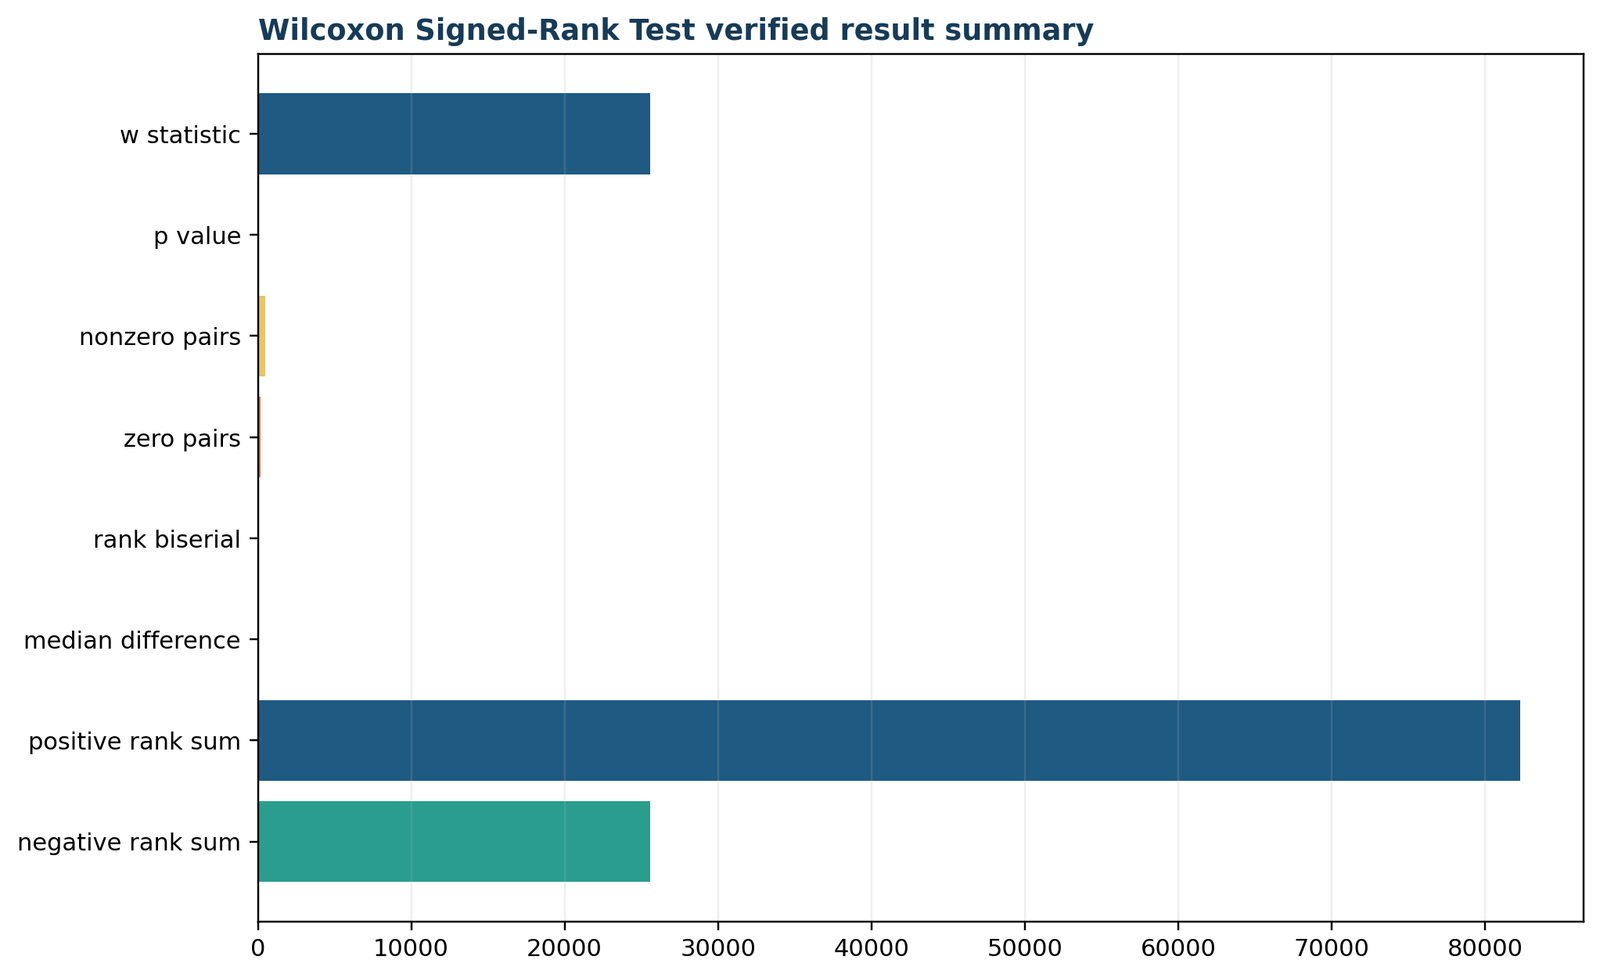
Python chart 5: Verified result summary
The final summary reconciles all reported quantities: W = 25,595.5, 464 nonzero pairs, 185 zero pairs, rank-biserial correlation = 0.5255, median paired change = 1 grade point, W+ = 82,284.5, and W− = 25,595.5. The normal approximation gives z = −10.099 and p = 5.57 × 10⁻²⁴, decisively rejecting symmetry around zero.
Wilcoxon signed rank test in R
Base R uses the same paired differences but labels its statistic differently.
The Wilcoxon signed rank test in R is performed with wilcox.test() and paired = TRUE. With ties and zeros, set exact = FALSE for the large-sample reference and state whether the continuity correction is used.
df <- read.csv("dataset.csv")d <- round(df$G3 - df$G1, 12)
fit <- wilcox.test(
d,
mu = 0,
alternative = "two.sided",
exact = FALSE,
correct = FALSE,
conf.int = TRUE
)
fit
# R commonly reports V = the positive rank sum = 82284.5
d_nz <- d[d != 0]

ranks <- rank(abs(d_nz), ties.method = "average")

W_plus  <- sum(ranks[d_nz > 0])

W_minus <- sum(ranks[d_nz < 0])

r_rank_biserial <- (W_plus - W_minus) / (W_plus + W_minus)c(W_plus = W_plus,

W_minus = W_minus,

rank_biserial = r_rank_biserial,

median_difference = median(d))
R chart 1: Primary metrics
The primary-metrics chart combines the minimum signed-rank statistic, p-value, nonzero and zero-pair counts, matched-pairs rank-biserial correlation, median paired difference, and the positive and negative rank sums. The very large positive-rank total—82,284.5 versus 25,595.5—shows that increases from G1 to G3 were not only more frequent but also carried substantially greater ranked magnitude.
R chart 2: Signed paired differences
The signed-difference distribution is concentrated at 0, +1, and +2 grade points. There are 185 unchanged pairs, 344 positive differences, and 120 negative differences. The plot also reveals a small number of large positive and negative changes, which is why a magnitude-sensitive signed-rank analysis gives more information than a sign test based only on direction.
R chart 3: Positive and negative rank sums
The decomposition verifies the central arithmetic identity. The nonzero absolute ranks sum to 107,880.0; 82,284.5 belongs to positive differences and 25,595.5 belongs to negative differences. The reported two-sided statistic is the smaller sum, W = 25,595.5, while some software instead prints the positive sum as V or W+.
R chart 4: Difference-frequency audit
The frequency display tracks every observed value of G3 − G1. A +1 change occurred 191 times and a +2 change occurred 102 times, compared with 85 changes of −1 and 17 changes of −2. The tails include a few changes as large as ±11, so the assumptions section explains why symmetry and influential pairs must be checked rather than assumed.
R chart 5: Verified result summary
The final summary reconciles all reported quantities: W = 25,595.5, 464 nonzero pairs, 185 zero pairs, rank-biserial correlation = 0.5255, median paired change = 1 grade point, W+ = 82,284.5, and W− = 25,595.5. The normal approximation gives z = −10.099 and p = 5.57 × 10⁻²⁴, decisively rejecting symmetry around zero.
Wilcoxon signed rank test in SPSS
Menu steps, syntax, ranks table and result interpretation.
The Wilcoxon signed rank test in SPSS is available through the related-samples nonparametric procedures. The output should be read from the ranks table outward: verify negative ranks, positive ranks and ties before interpreting the standardized statistic and asymptotic significance.
Legacy-dialog menu path
- Choose Analyze → Nonparametric Tests → Legacy Dialogs → 2 Related Samples.
- Move G3 and G1 into a paired test field.
- Select Wilcoxon.
- Run the analysis and verify the subtraction direction shown in the ranks labels.
The negative-ranks row identifies cases where the first named variable is below the second, so variable order changes the labels even though a two-sided p-value is unchanged.
Modern related-samples path
- Choose Analyze → Nonparametric Tests → Related Samples.
- Place G3 and G1 in the fields list.
- Customize the analysis and request the Wilcoxon matched-pairs signed-rank test.
- Review hypotheses, test summary and pair details.
Use exact or Monte Carlo settings only when appropriate and available. A large tied dataset generally relies on asymptotic inference.
NPAR TESTS

/WILCOXON = G3 WITH G1 (PAIRED)

/MISSING ANALYSIS.| SPSS output item | Expected worked-example value | Interpretation |
|---|---|---|
| Negative ranks | N = 120; sum = 25,595.5 | G3 below G1. |
| Positive ranks | N = 344; sum = 82,284.5 | G3 above G1. |
| Ties | N = 185 | G3 equals G1; no signed contribution. |
| Z | Approximately −10.099 | Standardized rank-sum departure; sign depends on software convention. |
| Asymp. Sig. (2-tailed) | < .001 | Reject the zero-centered paired null. |
How to do the Wilcoxon signed rank test in Excel
A formula-driven worksheet with correct zero exclusion and tied midranks.
Excel does not have a dedicated Wilcoxon signed rank test command. A correct worksheet must rank nonzero absolute paired differences, not the original observations, and must subtract the zero count from ascending ranks when a full-range RANK.AVG formula includes zeros.
| Column / cell | Purpose | Excel formula |
|---|---|---|
| A2:A650 | G1 values | Raw paired measurement. |
| B2:B650 | G3 values | Raw paired measurement. |
| C2 | Difference | =B2-A2 |
| D2 | Absolute difference | =ABS(C2) |
| E2 | Nonzero midrank | =IF(C2=0,"",RANK.AVG(D2,$D$2:$D$650,1)-COUNTIF($C$2:$C$650,0)) |
| F2 | Signed rank | =IF(C2=0,0,SIGN(C2)*E2) |
| H2 | Positive rank sum | =SUMIF($C$2:$C$650,">0",$E$2:$E$650) |
| H3 | Negative rank sum | =SUMIF($C$2:$C$650,"<0",$E$2:$E$650) |
| H4 | Minimum W | =MIN(H2,H3) |
| H5 | Nonzero n | =COUNTIF($C$2:$C$650,"<>0") |
| H6 | Null mean | =H5*(H5+1)/4 |
Tie-adjusted variance
Create a small helper table containing each distinct nonzero absolute difference and its frequency. If the frequencies are in K2:K11, use:
=H5*(H5+1)*(2*H5+1)/24

-SUMPRODUCT(K2:K11^3-K2:K11)/48
The result is 7,877,035.875. Then compute =(H4-H6)/SQRT(H7) for z and =2*NORM.S.DIST(-ABS(H8),TRUE) for the two-sided p-value.
Effect size and validation
Rank-biserial:

=(H2-H3)/(H2+H3)Rank-sum identity:

=H2+H3-H5*(H5+1)/2
The identity check must equal zero. The rank-biserial formula returns 0.525482. The supplied workbook separates raw inputs, row-level ranks, calculations, diagnostics and reporting for auditability.
2*(1-NORM.S.DIST(ABS(z),TRUE)) is used. Calculate the lower tail directly with 2*NORM.S.DIST(-ABS(z),TRUE). The exact sign-test p-value is about 4.17 × 10⁻²⁶, not literally zero.Wilcoxon signed rank test in MATLAB, SAS and Stata
Equivalent paired commands with statistic-definition cautions.
MATLAB
[p,h,stats] = signrank(G3,G1, ...

'tail','both', ...

'method','approximate');p

stats.signrank

stats.zval
MATLAB’s signrank tests the paired difference and returns a positive-rank statistic plus a z value for approximate inference. Check the variable order before interpreting a directional alternative.
SAS
data paired;

set student;

diff = G3 - G1;

run;proc univariate data=paired;

var diff;

run;
PROC UNIVARIATE provides signed-rank inference for a one-sample variable, so compute the paired difference first. Report the signed-rank statistic, p-value, zeros and original-unit summary.
Stata
signrank G3 = G1generate diff = G3 - G1

summarize diff, detail
Stata reports the positive, negative and zero ranks plus the standardized result. Pairing is row-based, so verify the data structure before running the command.
Wilcoxon signed rank test versus related methods
Choose by design, estimand, symmetry and measurement scale.
| Method | Design | Main target | Uses magnitude? | Key caution |
|---|---|---|---|---|
| Wilcoxon signed rank | One sample or two paired measurements | Zero-centered symmetric difference / paired location shift | Yes, through absolute ranks | Symmetry is needed for a simple median-shift interpretation. |
| Sign test | One sample or paired | Probability of positive versus negative differences | No | Less information and often less power, but weaker magnitude assumptions. |
| Paired t test | Paired | Population mean paired difference | Yes, raw values | Sensitive to outliers and relies on mean-based sampling behavior. |
| Wilcoxon rank sum | Two independent groups | Independent-sample stochastic/location comparison | Ranks pooled observations | Not valid for paired rows. |
| Friedman test | Three or more related conditions | Repeated-measures rank differences | Within-block ranks | Omnibus result usually needs adjusted follow-up comparisons. |
| Paired permutation test | Paired | User-defined statistic under exchangeability or sign-flip null | Depends on statistic | The permutation scheme and target statistic must match the hypothesis. |
Diagnostics, zeros, ties and sensitivity analysis
A defensible result includes checks beyond the p-value.
Difference-distribution diagnostics
For these data, the central distribution favors +1 and +2 changes, while both tails contain a small number of large differences. The conclusion remains extremely strong under direction-only and alternative zero-method analyses.
Method sensitivity results
| Analysis | p-value |
|---|---|
| Wilcox zeros removed | 5.5689 × 10⁻²⁴ |
| Wilcox + continuity correction | 5.5790 × 10⁻²⁴ |
| Pratt zero method | 8.4397 × 10⁻²⁶ |
| Zero ranks split | 2.2975 × 10⁻²⁵ |
| Exact sign test | 4.1673 × 10⁻²⁶ |
Every reasonable implementation rejects. The stability of the conclusion is more informative than selecting whichever method produces the smallest p-value.
Missing pairs
Use complete paired records for the primary analysis and report how many rows were excluded. Do not rank an observation whose partner is missing.
Rounding
Round computed differences to measurement precision before identifying zeros or ties. Tiny floating-point artifacts can incorrectly change the effective sample size.
Multiple outcomes
If many outcomes or time contrasts are tested, control familywise error or false discovery rate and distinguish planned from exploratory comparisons.
How to interpret and report the Wilcoxon signed rank test
APA-style wording, result table and common mistakes.
APA-style worked result
A Wilcoxon signed-rank test was used to compare paired final grades (G3) with first-period grades (G1) for 649 students. The paired difference was defined as G3 − G1. Of the 649 pairs, 344 were positive, 120 were negative and 185 were zero; the conventional Wilcox calculation therefore ranked 464 nonzero differences. Final grades were higher in ranked location, with a median paired increase of 1 grade point, W = 25,595.5, z = −10.10, p = 5.57 × 10⁻²⁴, matched-pairs rank-biserial correlation = .525. The zero-centered symmetric-difference null was rejected.
| Report element | Recommended value or wording | Reason |
|---|---|---|
| Pair definition | G3 paired with G1 within student | Establishes dependence structure. |
| Subtraction direction | G3 − G1 | Defines positive and negative ranks. |
| Total and effective n | 649 total; 464 nonzero | Zeros are excluded under the primary rule. |
| Original-unit summary | Median change = +1 | Communicates practical magnitude. |
| Rank counts | 344 positive, 120 negative, 185 ties | Shows the pattern underlying W. |
| Statistic convention | Minimum W = 25,595.5 | Prevents confusion with R’s V = 82,284.5. |
| Standardized result | z = −10.099 | Documents the approximation. |
| Probability | p = 5.5689 × 10⁻²⁴ | More informative than only p < .001. |
| Effect size | Rank-biserial = 0.5255 | Quantifies ranked direction and magnitude. |
Correct language
Language to avoid
Eight interpretation checkpoints before publishing a result
1. Name the design. A Wilcoxon signed rank test result begins with the pairing statement. Readers should know whether the same people were measured twice, whether units were deliberately matched, or whether one sample was compared with a benchmark. Without that information, the Wilcoxon signed rank test can be mistaken for the independent-samples rank sum procedure.
2. Define the direction. State whether the difference is later minus earlier, treatment minus control, or observed minus target. The sign of the ranks and any one-sided Wilcoxon signed rank test conclusion depend on this choice. Reversing the subtraction swaps positive and negative rank sums even though a two-sided Wilcoxon signed rank test p-value remains equivalent.
3. Separate total pairs from ranked pairs. The current analysis contains 649 complete pairs, but the conventional Wilcoxon signed rank test ranks only 464 nonzero differences. Reporting both values prevents readers from assuming that 185 unchanged observations disappeared because of missing data. A transparent Wilcoxon signed rank test table should list positive, negative and zero counts.
4. Identify the statistic convention. One program may label the positive rank sum V, another may label the smaller rank sum W, and a third may emphasize Z. A cross-software Wilcoxon signed rank test comparison is correct only after those conventions are reconciled. For this Wilcoxon signed rank test, 82,284.5 and 25,595.5 are complementary, not contradictory.
5. Report magnitude in two languages. The Wilcoxon signed rank test effect can be described on the original grade scale with a median change of +1 and on the ranked scale with rank-biserial correlation 0.5255. A strong Wilcoxon signed rank test report includes both so statistical evidence and practical meaning are visible together.
6. Document ties and zeros. This Wilcoxon signed rank test contains many tied absolute differences because grades are integers. Midranks and a tie-adjusted variance are therefore essential. The zero rule—Wilcox, Pratt or z-split—must also be named because a Wilcoxon signed rank test statistic is not fully reproducible without it.
7. Match the conclusion to the null. The Wilcoxon signed rank test rejects a zero-centered symmetric-difference model; it does not prove that every pair changed in the same direction. In the current Wilcoxon signed rank test, 120 students had lower G3 values and 185 had no change, even though the overall ranked evidence strongly favors improvement.
8. Preserve the audit trail. A publishable Wilcoxon signed rank test should allow another analyst to reconstruct differences, ranks, rank sums, variance, z, p and effect size. The downloadable workbook and software reports make this Wilcoxon signed rank test result verifiable rather than presenting an isolated p-value.
Wilcoxon signed rank test downloads
Reports and workbook for verification, teaching and reproducibility.
Python reportVerified signed-rank calculation, diagnostics and charts.Download PDF →
R reportBase R workflow and reconciled rank sums.Download PDF →
SPSS outputRelated-samples output with ranks and test statistics.Download PDF →
Excel workbookRaw data, row-level ranks, formulas, checks and reporting.Download XLSX →
Method documentation and related statistical guides
How the calculation was verified and where to continue learning.
Documentation checked
The method description and software guidance were reconciled with current documentation for SciPy’s wilcoxon, base R’s wilcox.test, IBM SPSS related-samples and NPAR TESTS procedures, and MATLAB’s signrank. These references agree that the paired difference is central, absolute differences are ranked, signs determine rank sums, and symmetry is needed for the standard location interpretation.
The public article avoids treating software defaults as universal. Exact versus approximate inference, continuity correction, zero handling and statistic labels differ across implementations.
Internal study path
Wilcoxon signed rank test FAQs
Answers to interpretation, calculation, software and reporting questions.
What is the Wilcoxon signed rank test?
Wilcoxon signed rank test: The Wilcoxon signed rank test is a nonparametric procedure for one sample of differences or two related measurements. It ranks the nonzero absolute differences, restores their signs, and tests whether the difference distribution is symmetric about zero. For paired data, it is often used when a paired t test is not suitable and the difference scale is at least ordinal with meaningful magnitudes.
When should the Wilcoxon signed rank test be used?
Wilcoxon signed rank test: Use it for two measurements from the same units, matched pairs, or a one-sample comparison with a specified value when the research question concerns a systematic location shift and the paired differences are reasonably symmetric. It is not appropriate for independent groups, nominal outcomes, or repeated designs with more than two conditions.
Is the Wilcoxon signed rank test a test of medians?
Wilcoxon signed rank test: Only under an appropriate symmetric difference distribution can the null be expressed as a zero median or zero pseudomedian shift. In general, the formal null concerns symmetry of the paired-difference distribution around zero. Calling it only a median test hides the symmetry requirement and the use of ranked magnitudes.
What is W in the Wilcoxon signed rank test?
Wilcoxon signed rank test: W may mean the smaller of the positive and negative rank sums in a two-sided calculation, the positive rank sum, or a software-specific signed-rank statistic. In this analysis W+ = 82,284.5, W− = 25,595.5, and the minimum statistic is W = 25,595.5. The report must name the convention instead of presenting an unlabeled W.
What is V in R wilcox.test output?
Wilcoxon signed rank test: For a paired or one-sample signed-rank test, R commonly labels the sum of positive ranks as V. With differences defined as G3 − G1, V is 82,284.5 here. That differs from SciPy’s two-sided statistic of 25,595.5 because SciPy reports the smaller rank sum, yet the p-values and substantive conclusion agree.
How are zero differences handled?
Wilcoxon signed rank test: The conventional Wilcox method removes zero differences before ranking. This analysis therefore ranks 464 nonzero pairs and reports 185 zeros separately. Pratt retains zeros in the ranking framework but excludes their signed contribution, while z-split divides zero ranks between signs. These choices can change the statistic and standard error, so the zero method must be stated.
How are tied absolute differences handled?
Wilcoxon signed rank test: Equal absolute differences receive midranks. Here many grade changes have absolute values of one or two, creating substantial ties. The normal-approximation variance is therefore tie-adjusted. Exact no-tie critical-value tables are not appropriate for this large tied dataset.
What are the assumptions of the Wilcoxon signed rank test?
Wilcoxon signed rank test: The pairs must be correctly matched and independent of other pairs; the response must be orderable; the paired differences must be meaningful; and a location-shift interpretation requires an approximately symmetric difference distribution. Random sampling or random assignment is also needed for broad population inference.
Does the Wilcoxon signed rank test require normality?
Wilcoxon signed rank test: No. It does not require normally distributed paired differences. It does require enough structure for the signed ranks to have a location interpretation, particularly symmetry for a simple median-shift statement. Severe asymmetry may make a sign test, permutation approach, robust model, or direct quantile analysis more suitable.
What is the difference between the signed rank and rank sum tests?
Wilcoxon signed rank test: The signed rank test analyzes paired observations or one sample of differences. The rank sum test analyzes two independent groups and is equivalent to the Mann–Whitney U framework. Confusing them changes both the data structure and the null hypothesis.
What is the difference between the signed rank test and the sign test?
Wilcoxon signed rank test: The sign test uses only whether each nonzero difference is positive or negative. The signed rank test also uses ranked absolute magnitudes, which can improve power when the symmetry assumption is reasonable. In this dataset, the sign test also rejects strongly, but it does not use the information contained in the sizes of the changes.
How is the Wilcoxon signed rank p-value calculated?
Wilcoxon signed rank test: After zeros are removed and tied absolute differences receive midranks, the positive and negative rank sums are compared with their null expectation. For a large tied sample, a tie-adjusted normal approximation is used. Here E(W+) = 53,940, SE = 2,806.606, z = −10.099 under the minimum-statistic convention, and the two-sided p-value is 5.57 × 10⁻²⁴.
Should a continuity correction be used?
Wilcoxon signed rank test: A continuity correction moves the observed rank sum by 0.5 toward its null expectation before standardization. It is optional and software defaults differ. In this example the uncorrected p-value is 5.5689 × 10⁻²⁴ and the corrected value is 5.5790 × 10⁻²⁴, so the conclusion is unchanged.
How is effect size reported for the Wilcoxon signed rank test?
Wilcoxon signed rank test: The matched-pairs rank-biserial correlation is especially interpretable because it compares positive and negative ranked evidence: (W+ − W−)/(W+ + W−). It equals 0.5255 here, indicating a substantial tendency toward higher G3 than G1. A standardized r based on |z|/√n_nonzero is 0.4688 and may be reported as a supplementary effect size.
How should the test be reported in APA style?
Wilcoxon signed rank test: Name the paired variables and direction of subtraction, give the number of pairs and zeros, describe the median change, identify the statistic convention, report z and the exact displayed p-value, and include an effect size. A concise example is provided in the reporting section.
Can the Wilcoxon signed rank test be done in Excel?
Wilcoxon signed rank test: Yes, but Excel has no dedicated built-in command. A transparent worksheet must calculate paired differences, exclude zeros, assign midranks to nonzero absolute differences, sum positive and negative ranks, apply the tie-adjusted variance, and calculate the normal-approximation p-value. The supplied workbook performs and audits these steps.
What should be done when the paired-difference distribution is strongly asymmetric?
Wilcoxon signed rank test: Do not automatically describe the Wilcoxon signed rank test result as a median comparison. Inspect the difference histogram, quantiles, and influential pairs. Depending on the research goal, use the paired sign test, a permutation test targeting a clearly defined statistic, a robust paired model, or a bootstrap interval for the median change.
What conclusion follows from this worked example?
Wilcoxon signed rank test: Final grades G3 tended to exceed first-period grades G1. The sample median change was +1, positive changes outnumbered negative changes 344 to 120, and positive ranked magnitude was much larger. The Wilcoxon signed rank test rejected the zero-centered null, W = 25,595.5, z = −10.099, p = 5.57 × 10⁻²⁴, with rank-biserial correlation 0.5255.