
.abx-article{–ink:#102238;–muted:#52657a;–line:#dce5ed;–paper:#fff;–soft:#f4f8fb;–navy:#092a45;–teal:#0d7774;–cyan:#dff7f6;–amber:#f4a340;–amber-soft:#fff4df;–red:#a83232;–red-soft:#fff0f0;–green:#176b47;–green-soft:#e9f8f0;–violet:#6654b8;–violet-soft:#f0edff;–shadow:0 16px 45px rgba(18,44,67,.10);font-family:Inter,ui-sans-serif,system-ui,-apple-system,BlinkMacSystemFont,”Segoe UI”,Arial,sans-serif;color:var(–ink);line-height:1.72;display:block;width:100%!important;max-width:100%!important;margin:0 auto!important;background:var(–paper);font-size:17px;overflow-x:clip}
.abx-article *{box-sizing:border-box}.abx-article a{color:#075f72;text-decoration-thickness:1px;text-underline-offset:3px}.abx-article a:hover{color:#043f4c}.abx-shell{width:100%;max-width:1480px;margin:0 auto;padding:clamp(18px,2.8vw,42px)}.abx-hero{position:relative;overflow:hidden;border-radius:28px;background:linear-gradient(132deg,#07263f 0%,#0b4b61 55%,#0a7770 100%);color:#fff;padding:clamp(28px,6vw,68px);box-shadow:var(–shadow)}.abx-hero:before{content:””;position:absolute;right:-90px;top:-120px;width:360px;height:360px;border-radius:50%;background:rgba(255,255,255,.07)}.abx-hero:after{content:””;position:absolute;left:-110px;bottom:-180px;width:390px;height:390px;border-radius:50%;background:rgba(244,163,64,.10)}.abx-hero>*{position:relative;z-index:1}.abx-kicker{display:inline-flex;align-items:center;gap:9px;padding:7px 12px;border:1px solid rgba(255,255,255,.25);border-radius:999px;background:rgba(255,255,255,.09);font-size:.78rem;font-weight:800;letter-spacing:.08em;text-transform:uppercase}.abx-kicker i{width:9px;height:9px;border-radius:50%;background:#ffbd62;box-shadow:0 0 0 5px rgba(255,189,98,.16)}.abx-hero h1{font-size:clamp(2.15rem,5.2vw,4.65rem);line-height:1.04;letter-spacing:-.045em;margin:22px 0 18px;max-width:1000px;color:#fff}.abx-hero .abx-lead{font-size:clamp(1.05rem,2vw,1.34rem);max-width:900px;color:#e9f7fb;margin:0}.abx-badges{display:flex;flex-wrap:wrap;gap:10px;margin-top:25px}.abx-badge{padding:8px 12px;border-radius:999px;background:rgba(255,255,255,.11);border:1px solid rgba(255,255,255,.19);font-size:.84rem;font-weight:750}.abx-hero-result{margin-top:28px;display:grid;grid-template-columns:repeat(4,minmax(0,1fr));gap:12px}.abx-hero-metric{background:rgba(255,255,255,.10);border:1px solid rgba(255,255,255,.16);border-radius:16px;padding:14px}.abx-hero-metric span{display:block;color:#cdeaf0;font-size:.78rem;text-transform:uppercase;letter-spacing:.05em;font-weight:800}.abx-hero-metric strong{display:block;margin-top:4px;font-size:1.28rem;color:#fff}.abx-ad{display:flex;align-items:center;justify-content:center;min-height:96px;margin:26px 0;border:1px dashed #b8c6d1;border-radius:18px;background:#f8fafc;color:#718096;font-size:.78rem;letter-spacing:.14em;text-transform:uppercase}.abx-quick{display:grid;grid-template-columns:1.35fr .65fr;gap:20px;margin:28px 0}.abx-card{min-width:0;max-width:100%;border:1px solid var(–line);border-radius:22px;background:#fff;box-shadow:0 10px 30px rgba(21,48,70,.06);padding:clamp(19px,3vw,30px)}.abx-card h2,.abx-card h3{margin-top:0}.abx-answer{background:linear-gradient(145deg,#f2fbfa,#fff);border-color:#bfe5e2}.abx-answer .abx-verdict{display:inline-flex;align-items:center;gap:9px;padding:8px 12px;border-radius:999px;background:var(–green-soft);color:var(–green);font-weight:850;font-size:.84rem}.abx-answer .abx-verdict:before{content:”✓”;display:grid;place-items:center;width:22px;height:22px;border-radius:50%;background:var(–green);color:#fff}.abx-answer h2{font-size:clamp(1.55rem,3vw,2.25rem);line-height:1.15;margin:15px 0 10px}.abx-mini-table{display:grid;gap:10px}.abx-mini-row{display:flex;justify-content:space-between;gap:20px;padding:11px 0;border-bottom:1px solid var(–line)}.abx-mini-row:last-child{border-bottom:0}.abx-mini-row span{color:var(–muted)}.abx-mini-row strong{text-align:right}.abx-toc{margin:26px 0;border-radius:22px;background:var(–navy);color:#fff;padding:24px}.abx-toc h2{color:#fff;margin:0 0 14px;font-size:1.2rem}.abx-toc-grid{display:grid;grid-template-columns:repeat(3,minmax(0,1fr));gap:8px 20px}.abx-toc a{color:#d9f6f5;text-decoration:none;padding:7px 0;display:block;border-bottom:1px solid rgba(255,255,255,.12)}.abx-toc a:hover{color:#fff}.abx-section{scroll-margin-top:24px;margin:54px 0}.abx-section-head{display:grid;grid-template-columns:auto 1fr;align-items:start;gap:14px;margin-bottom:20px}.abx-num{width:42px;height:42px;border-radius:13px;background:var(–navy);color:#fff;display:grid;place-items:center;font-weight:900}.abx-section-head h2{margin:0;font-size:clamp(1.65rem,3.4vw,2.65rem);line-height:1.15;letter-spacing:-.025em}.abx-section-head p{grid-column:2;margin:5px 0 0;color:var(–muted);max-width:920px}.abx-grid-2{display:grid;grid-template-columns:repeat(2,minmax(0,1fr));gap:20px}.abx-grid-2>*,.abx-grid-3>*,.abx-grid-4>*,.abx-chart-grid>*,.abx-downloads>*,.abx-related>*,.abx-quick>*{min-width:0}.abx-grid-3{display:grid;grid-template-columns:repeat(3,minmax(0,1fr));gap:18px}.abx-grid-4{display:grid;grid-template-columns:repeat(4,minmax(0,1fr));gap:14px}.abx-callout{border-radius:18px;padding:18px 20px;border-left:5px solid var(–teal);background:var(–cyan);margin:20px 0}.abx-callout strong{color:#084f4c}.abx-warning{border-left-color:var(–red);background:var(–red-soft)}.abx-warning strong{color:var(–red)}.abx-note{border-left-color:var(–amber);background:var(–amber-soft)}.abx-note strong{color:#875311}.abx-formula{border:1px solid #cbd8e3;background:linear-gradient(180deg,#fff,#f7fafc);border-radius:20px;padding:22px;margin:18px 0;text-align:center;overflow:visible}.abx-formula .eq{font-family:”Cambria Math”,”Times New Roman”,serif;font-size:clamp(1.08rem,2.2vw,1.5rem);white-space:normal;overflow-wrap:anywhere;word-break:normal;line-height:1.55}.abx-formula p{margin:8px auto 0;color:var(–muted);max-width:850px;text-align:left;font-size:.94rem}.abx-pill-list{display:flex;flex-wrap:wrap;gap:10px;margin:15px 0}.abx-pill{background:var(–soft);border:1px solid var(–line);border-radius:999px;padding:8px 12px;font-weight:750;font-size:.88rem}.abx-flow{display:grid;grid-template-columns:repeat(5,minmax(0,1fr));gap:10px;counter-reset:flow}.abx-step{position:relative;padding:18px 14px 16px;border:1px solid var(–line);border-radius:18px;background:#fff;min-height:148px}.abx-step:before{counter-increment:flow;content:counter(flow);display:grid;place-items:center;width:30px;height:30px;border-radius:10px;background:var(–teal);color:#fff;font-weight:900;margin-bottom:10px}.abx-step h3{font-size:1rem;margin:0 0 6px}.abx-step p{font-size:.9rem;color:var(–muted);margin:0}.abx-table-wrap{min-width:0;max-width:100%;overflow-x:auto;border:1px solid var(–line);border-radius:18px;background:#fff}.abx-table{width:100%;border-collapse:collapse;min-width:720px}.abx-table.abx-compact{min-width:0}.abx-table th{background:var(–navy);color:#fff;text-align:left;padding:13px 14px;font-size:.85rem;letter-spacing:.02em}.abx-table td{padding:13px 14px;border-bottom:1px solid var(–line);vertical-align:top}.abx-table tbody tr:nth-child(even){background:#f8fafc}.abx-table tbody tr:last-child td{border-bottom:0}.abx-stat-grid{display:grid;grid-template-columns:repeat(4,minmax(0,1fr));gap:12px;margin:16px 0}.abx-stat{border:1px solid var(–line);border-radius:16px;padding:16px;background:#fff}.abx-stat span{display:block;color:var(–muted);font-size:.78rem;font-weight:800;text-transform:uppercase;letter-spacing:.05em}.abx-stat strong{display:block;font-size:1.34rem;margin-top:4px}.abx-stat small{display:block;color:var(–muted);margin-top:4px}.abx-result-panel{border-radius:22px;background:linear-gradient(145deg,#082c47,#0b5966);color:#fff;padding:26px}.abx-result-panel h3{color:#fff;margin-top:0;font-size:1.45rem}.abx-result-panel p{color:#e5f6f7}.abx-result-panel .abx-result-big{font-size:clamp(2rem,5vw,3.7rem);line-height:1;font-weight:950;color:#fff;margin:10px 0}.abx-result-panel .abx-result-tag{display:inline-block;padding:8px 12px;border-radius:999px;background:rgba(255,255,255,.12);border:1px solid rgba(255,255,255,.18);font-weight:800}.abx-figure{min-width:0;max-width:100%;margin:0;border:1px solid var(–line);border-radius:22px;overflow:hidden;background:#fff;box-shadow:0 10px 30px rgba(21,48,70,.06)}.abx-figure img{display:block;width:100%;height:auto;background:#f3f6f8}.abx-figure figcaption{padding:18px 20px}.abx-figure h3{font-size:1.08rem;margin:0 0 6px}.abx-figure p{margin:0;color:var(–muted);font-size:.94rem}.abx-chart-grid{display:grid;grid-template-columns:repeat(2,minmax(0,1fr));gap:20px}.abx-chart-grid .abx-wide{grid-column:1/-1}.abx-code{min-width:0;max-width:100%;position:relative;background:#071d2d;color:#e6f2f7;border-radius:18px;overflow:auto;padding:20px;margin:16px 0;box-shadow:inset 0 0 0 1px rgba(255,255,255,.07)}.abx-code code{display:block;white-space:pre;min-width:max-content;font-family:”SFMono-Regular”,Consolas,”Liberation Mono”,monospace;font-size:.88rem;line-height:1.65}.abx-code-label{display:inline-block;margin-bottom:8px;color:#7ee7db;font-size:.76rem;font-weight:900;letter-spacing:.08em;text-transform:uppercase}.abx-downloads{display:grid;grid-template-columns:repeat(4,minmax(0,1fr));gap:14px}.abx-download{display:flex;flex-direction:column;min-height:190px;padding:20px;border-radius:20px;border:1px solid var(–line);background:#fff;text-decoration:none!important;color:var(–ink)!important;box-shadow:0 10px 30px rgba(21,48,70,.06);transition:.2s transform,.2s box-shadow}.abx-download:hover{transform:translateY(-3px);box-shadow:0 16px 38px rgba(21,48,70,.12)}.abx-file-icon{width:46px;height:46px;border-radius:14px;display:grid;place-items:center;background:var(–violet-soft);color:var(–violet);font-weight:950;margin-bottom:16px}.abx-download strong{font-size:1.05rem}.abx-download span{color:var(–muted);font-size:.88rem;margin-top:6px}.abx-download em{margin-top:auto;padding-top:16px;color:#075f72;font-style:normal;font-weight:850}.abx-checks{display:grid;gap:10px}.abx-check{position:relative;padding:13px 14px 13px 44px;border:1px solid var(–line);border-radius:15px;background:#fff}.abx-check:before{content:”✓”;position:absolute;left:14px;top:13px;width:22px;height:22px;border-radius:50%;display:grid;place-items:center;background:var(–green-soft);color:var(–green);font-weight:950}.abx-faq details{border:1px solid var(–line);border-radius:17px;background:#fff;margin:11px 0;overflow:hidden}.abx-faq summary{cursor:pointer;font-weight:850;padding:17px 20px;list-style:none}.abx-faq summary::-webkit-details-marker{display:none}.abx-faq summary:after{content:”+”;float:right;color:var(–teal);font-size:1.4rem;line-height:1}.abx-faq details[open] summary:after{content:”−”}.abx-faq .abx-faq-answer{padding:0 20px 18px;color:var(–muted)}.abx-related{display:grid;grid-template-columns:repeat(3,minmax(0,1fr));gap:12px}.abx-related a{display:block;border:1px solid var(–line);border-radius:15px;padding:14px 16px;background:#fff;text-decoration:none;font-weight:800}.abx-footer-note{border-radius:22px;background:var(–soft);border:1px solid var(–line);padding:22px;color:var(–muted)}.abx-back{display:inline-flex;align-items:center;gap:8px;border-radius:999px;background:var(–navy);color:#fff!important;text-decoration:none!important;padding:11px 16px;font-weight:850;margin-top:18px}.abx-sr{position:absolute!important;width:1px!important;height:1px!important;padding:0!important;margin:-1px!important;overflow:hidden!important;clip:rect(0,0,0,0)!important;white-space:nowrap!important;border:0!important}
@media(max-width:960px){.abx-hero-result,.abx-grid-4,.abx-stat-grid,.abx-downloads{grid-template-columns:repeat(2,minmax(0,1fr))}.abx-toc-grid,.abx-grid-3,.abx-related{grid-template-columns:repeat(2,minmax(0,1fr))}.abx-flow{grid-template-columns:repeat(2,minmax(0,1fr))}.abx-flow .abx-step:last-child{grid-column:1/-1}.abx-quick{grid-template-columns:1fr}}
@media(max-width:680px){.abx-article{font-size:16px;width:100%!important;max-width:100%!important;margin:0 auto!important}.abx-shell{padding:12px}.abx-hero{border-radius:20px;padding:26px 20px}.abx-hero h1{font-size:2.2rem}.abx-hero-result,.abx-grid-2,.abx-grid-3,.abx-grid-4,.abx-stat-grid,.abx-downloads,.abx-chart-grid,.abx-toc-grid,.abx-related,.abx-flow{grid-template-columns:1fr}.abx-chart-grid .abx-wide,.abx-flow .abx-step:last-child{grid-column:auto}.abx-card{border-radius:18px;padding:18px}.abx-section{margin:42px 0}.abx-section-head{grid-template-columns:36px 1fr;gap:11px}.abx-num{width:36px;height:36px}.abx-section-head p{grid-column:1/-1}.abx-table{min-width:650px}.abx-formula{padding:18px 12px;text-align:left}.abx-formula .eq{font-size:1.05rem}.abx-mini-row{align-items:flex-start;flex-direction:column;gap:2px}.abx-mini-row strong{text-align:left}}
.abx-seo-context{font-size:1.02rem;color:#31475d;margin:-5px 0 20px;max-width:1180px}
.abx-model{display:grid;grid-template-columns:1.05fr .95fr;gap:20px;align-items:stretch}
.abx-model .abx-card{height:100%}
.abx-hypothesis{border:1px solid var(–line);border-radius:18px;padding:20px;background:#fff}
.abx-hypothesis h3{margin:0 0 10px}
.abx-direction{display:grid;grid-template-columns:repeat(3,minmax(0,1fr));gap:12px;margin:16px 0}
.abx-direction>div{border:1px solid var(–line);border-radius:16px;padding:16px;background:var(–soft)}
.abx-keyword-box{border:1px solid #b9d8e2;border-radius:20px;background:linear-gradient(145deg,#eff9fc,#fff);padding:22px;margin:22px 0}
.abx-keyword-box h3{margin-top:0}
.abx-equation-lines{display:grid;gap:10px;text-align:left}
.abx-equation-line{display:grid;grid-template-columns:minmax(140px,.38fr) 1fr;gap:16px;align-items:start;padding:10px 0;border-bottom:1px solid var(–line)}
.abx-equation-line:last-child{border-bottom:0}
.abx-equation-line strong{color:var(–navy)}
@media(max-width:900px){.abx-model,.abx-direction{grid-template-columns:1fr}.abx-equation-line{grid-template-columns:1fr;gap:4px}}
body:has(.abx-article) .site-main>article>.entry-header,
body:has(.abx-article) main>article>.entry-header,
body:has(.abx-article) .single-post-header,
body:has(.abx-article) .single-entry-header,
body:has(.abx-article) .post-header:not(.abx-hero),
body:has(.abx-article) .post-hero:not(.abx-hero),
body:has(.abx-article) .page-header:has(.entry-title),
body:has(.abx-article) .page-header:has(.page-title),
body:has(.abx-article) .wp-block-post-title,
body:has(.abx-article) h1.entry-title,
body:has(.abx-article) h1.post-title,
body:has(.abx-article) h1.page-title,
body:has(.abx-article) .single-post-title{display:none!important}
body:has(.abx-article) .site-content,
body:has(.abx-article) .content-sidebar-wrap,
body:has(.abx-article) .site-grid,
body:has(.abx-article) .main-content-wrap{display:block!important;grid-template-columns:minmax(0,1fr)!important;width:100%!important;max-width:none!important;margin-left:auto!important;margin-right:auto!important}
body:has(.abx-article) #primary,
body:has(.abx-article) .content-area,
body:has(.abx-article) .site-main,
body:has(.abx-article) main.site-main,
body:has(.abx-article) .main-content,
body:has(.abx-article) .entry-content:has(.abx-article){float:none!important;flex:0 0 100%!important;width:100%!important;max-width:none!important;margin-left:auto!important;margin-right:auto!important;margin-top:0!important;padding-top:0!important}
body:has(.abx-article) #secondary,
body:has(.abx-article) .widget-area,
body:has(.abx-article) aside.sidebar,
body:has(.abx-article) .content-sidebar{display:none!important}
body:has(.abx-article) .abx-shell{width:min(1480px,100%)!important;max-width:1480px!important;margin-left:auto!important;margin-right:auto!important}
body:has(.abx-article) .abx-hero{width:100%!important;margin-left:auto!important;margin-right:auto!important}
Mann Whitney U Test: Formula, Interpretation, Python, R, SPSS and Excel Guide
The Mann Whitney U test is one of the most useful nonparametric procedures for comparing two independent groups. This complete guide explains what the Mann Whitney U test measures, when to use the Mann Whitney U test, how the U statistic is calculated, how probability superiority is interpreted, and how a full worked example in Python, R, SPSS, and Excel can be written up for public reporting.
Rank-based alternative to t test
Probability superiority
Python + R + SPSS + Excel
Full worked example
The Mann Whitney U test found a statistically significant difference in final-grade distributions between students without internet access and students with internet access.
In this worked Mann Whitney U test example, the outcome variable is G3 and the grouping variable is internet, coded as no and yes. The Mann Whitney U test compares 151 observations in the no-internet group with 498 observations in the yes-internet group. Using pooled midranks and a tie-corrected large-sample variance, the analysis produced U = 29,581.5, a continuity-corrected |z| = 3.9979, and a two-sided p-value = 0.0000639. The result is statistically significant, so the two groups do not share the same final-grade distribution.
What does the Mann Whitney U test measure?
The Mann Whitney U test compares two independent groups by analyzing their pooled rank positions rather than relying only on means.
The Mann Whitney U test, also called the Mann-Whitney U test or the Wilcoxon rank-sum test, is a two-group nonparametric method. Instead of comparing group means directly, the Mann Whitney U test pools all observations, ranks them from smallest to largest, and asks whether one group systematically tends to receive higher ranks than the other. This makes the Mann Whitney U test extremely useful when the outcome distribution is skewed, bounded, ordinal, or affected by outliers.
In applied work, people often search phrases such as what does Mann Whitney U test tell you or what is the Mann Whitney U test used for. The clearest answer is that the Mann Whitney U test evaluates whether two independent samples are distributed similarly, or whether one sample tends to produce larger observations than the other. When group distributions have a similar overall shape, the result is often interpreted as a difference in typical location or median tendency. When shapes differ substantially, the safer interpretation is that the full distributions differ.
Why the Mann Whitney U test is popular
The Mann Whitney U test is widely taught because it is both flexible and interpretable. It works with numeric outcomes that are not comfortable under a strict normal-distribution assumption, and it often provides a more public-friendly explanation than a purely model-based procedure. Rank-based reasoning also reduces the influence of extreme values, which is why the Mann Whitney U test appears so often in health, education, psychology, and social-science reporting.
The method is especially valuable when analysts want to compare two groups on a variable whose meaning is easier to understand through order than through raw scale alone. In educational data, for example, final grades can contain ties, floor effects, and ceiling effects. The Mann Whitney U test handles all of those features naturally through pooled ranks and tie-aware variance calculations.
What the Mann Whitney U test does not do by itself
Although the Mann Whitney U test is powerful and useful, it is not a universal answer to every two-group question. It does not directly estimate a mean difference in the same way a two-sample t test does. It is also not a repeated-measures procedure; if the same people are observed twice, a paired method would be more appropriate. Likewise, if a reader wants to compare the entire cumulative distributions of two groups in a different way, a method such as the Kolmogorov–Smirnov test answers a different question.
So the practical strength of the Mann Whitney U test is not that it replaces every other method, but that it offers a robust, widely understood, and highly teachable approach to the specific problem of comparing two independent groups on a rankable outcome.
The method also serves as a natural bridge between descriptive statistics and formal hypothesis testing. Analysts often begin with five-number summaries, box plots, and frequency distributions. The Mann Whitney U test then turns those preliminary impressions into a formal rank-based inference.
In public-facing statistics writing, that bridge matters a great deal. Many readers can recognize that one box plot appears higher than another or that one median exceeds another, but they are not always sure whether the difference is statistically meaningful. The Mann Whitney U test answers that question without demanding that the reader accept a strict normal model. It keeps the analysis accessible while still remaining mathematically disciplined.
Another strength of the Mann Whitney U test is that it invites good habits of interpretation. Because the method is based on pooled ranks, readers are less likely to overfocus on a single average and more likely to think about the overall ordering of the two groups. That broader view is often exactly what a public guide should encourage.
When should you use the Mann Whitney U test?
Use the Mann Whitney U test when the design contains two independent groups and the outcome can be meaningfully ranked.
A common query is when to use Mann Whitney U test. The decision rule is simple: use the Mann Whitney U test when you have one outcome variable, exactly two independent groups, and a reason to prefer a rank-based nonparametric analysis over a mean-based parametric alternative. This preference may arise because the data are ordinal, skewed, outlier-prone, or heavily tied.
Two independent groups
The test is built for designs like internet = no versus internet = yes, treatment versus control, or male versus female.
Rankable outcome
The response can be numeric or ordinal, so observations can be placed in a meaningful order.
Nonparametric preference
Use the Mann Whitney U test when a rank-based approach is preferred to a t-based assumption set.
Independent observations
Each observation belongs to one group only; there is no pairing or repetition across groups.
Two-group question
If there are more than two independent groups, an omnibus procedure like the Kruskal Wallis test is usually more appropriate.
Situations that fit the Mann Whitney U test well
Situations where another method may fit better
Another reason the Mann Whitney U test remains popular is that it is easy to communicate to broad audiences. A public reader does not need to understand every nuance of sampling theory to grasp the main idea that one group tends to rank higher or lower than another. This explanatory strength makes the Mann Whitney U test particularly attractive in educational content, student projects, and public statistical guides.
It is also a practical method for mixed data realities. Real applied datasets often include ceiling effects, floor effects, repeated values, and unequal group sizes. The current example has a much larger yes-internet group than no-internet group, yet the Mann Whitney U test still works cleanly because its logic is based on pooled ordering and a variance formula that accounts for sample sizes and ties.
Mann Whitney U test assumptions
The Mann Whitney U test is flexible, but it is not assumption-free.
The Mann Whitney U test assumptions are usually easier to satisfy than those of many parametric methods, but they still matter. The samples must be independent, the groups must be nonoverlapping, the outcome must be at least ordinal so that ranking is meaningful, and the interpretation should match what the data structure can support. The Mann Whitney U test does not require a normal distribution, which is why it is often introduced in nonparametric modules.
Independent samples
The no-internet and yes-internet groups do not overlap. Each student belongs to exactly one category, satisfying the independent-groups design requirement for the Mann Whitney U test.
Rankable outcome
The final-grade variable G3 is numeric and therefore supports a pooled ranking process. That makes it fully suitable for the Mann Whitney U test.
Pooled ranking across both groups
Every observation must be ranked together, not within each group separately. This shared-rank structure is the heart of the Mann Whitney U test.
Tie handling
Many final-grade values repeat, so ties are present. The workbook therefore uses pooled midranks and a tie-adjusted variance term.
Distributional interpretation
If the two groups have a similar shape, people often summarize the result as a difference in typical level or median tendency. If shapes differ greatly, the safer statement is that the distributions differ.
Appropriate inferential question
The Mann Whitney U test is best when the research question concerns comparative rank positions or stochastic dominance rather than a specific mean difference model.
In practical work, good analysts check assumptions before reading the p-value. They ask whether the two groups are truly independent, whether the outcome scale supports ranking, whether ties need attention, and whether the inferential question matches what the Mann Whitney U test actually answers. That discipline improves both correctness and clarity.
The current worked example satisfies the core assumptions well. The two internet-access groups are independent, the outcome variable is numeric, tied values are handled explicitly, and the research question genuinely concerns whether one group tends to score higher than the other. That makes the Mann Whitney U test a very natural choice here.
It is worth emphasizing that “natural choice” does not mean “automatic choice.” A careful analyst still reviews the measurement scale, the substantive meaning of the groups, and the audience that will read the result. In this case, the design and the reporting goal line up unusually well with the strengths of the Mann Whitney U test.
Null and alternative hypotheses
The Mann Whitney U test compares two independent distributions through a rank-based hypothesis structure.
Null hypothesis
H0: the two groups share the same population distribution. Equivalently, the probability that a randomly selected observation from one group exceeds a randomly selected observation from the other equals 0.5, after accounting for ties.
In this worked example, that means the no-internet and yes-internet groups would be equally likely to generate the larger G3 score under the null hypothesis.
Alternative hypothesis
H1: the two group distributions differ, so the probability that one group exceeds the other is not 0.5.
The present analysis is two-sided, so it tests for a difference in either direction rather than prespecifying a one-sided ordering.
G3 final grade
internet = no or yes
two independent samples
This hypothesis structure is useful because it links the Mann Whitney U test directly to the idea of probability superiority. Under the null, neither group should systematically dominate the other. Under the alternative, one group tends to generate larger values more often.
The distinction between two-sided and one-sided forms also matters. A two-sided Mann Whitney U test asks whether the groups differ at all, regardless of direction. A one-sided version would ask whether one group is specifically larger or smaller. In public reporting, the two-sided version is more common unless the research design required a directional hypothesis in advance.
For teaching purposes, the hypothesis section is often where the Mann Whitney U test becomes most intuitive. The null says that neither group has a systematic advantage in the pooled ordering. The alternative says that the pooled ordering is tilted in one direction. Once readers understand that simple contrast, the later appearance of U, z, and p becomes much easier to follow.
This hypothesis view also clarifies why probability superiority is so useful. A null probability of 0.5 means neither group has an ordering advantage. Values above or below 0.5 therefore summarize the same inferential idea in a highly readable way. In that sense, probability superiority is not an extra add-on to the Mann Whitney U test; it is a very natural interpretation of the same null and alternative structure.
Mann Whitney U test formula and calculation steps
The U statistic is built from pooled ranks, then standardized to form the large-sample z test.
Here, R1 is the rank sum for group 1, n1 is the sample size of group 1, and U1 counts the number of favorable pairwise orderings for group 1, with ties handled through the ranking process. In this workbook, group 1 is the no-internet category.
The continuity-corrected normal approximation uses the absolute departure of U from its mean, subtracts 0.5, and divides by the tie-adjusted standard deviation. This yields the large-sample z statistic used for the two-sided p-value.
This effect-style quantity can be interpreted as the probability that a randomly selected observation from group 1 exceeds a randomly selected observation from group 2, with ties split evenly. It gives the Mann Whitney U test a public-friendly interpretation beyond the p-value alone.
The formula is compact, but the logic of the Mann Whitney U test is rich. First, the analysis pools all observations from both groups into one shared ranking system. Second, tied values receive midranks so that equal scores are handled fairly. Third, the rank sum for one group is converted into the U statistic through the standard identity. Fourth, the observed U is compared with its null expectation and tie-corrected variance to obtain a z-based p-value. Finally, the result can be translated into probability superiority so that public readers can understand the direction and practical meaning of the difference.
Exact calculation components
What the numbers mean
The mean U under the null is 37,599, but the observed U = 29,581.5 is noticeably smaller. Because group 1 is the no-internet category, that smaller-than-expected U indicates that the no-internet group tends to occupy lower final-grade positions than would be expected under equal distributions. After continuity correction and tie-adjusted standardization, the resulting p-value is 0.0000639, which is far below 0.05.
The probability superiority value of 0.393381 clarifies the direction: a randomly selected no-internet student is less likely than not to outscore a randomly selected internet-access student. Reversing the comparison, the internet-access group has a 0.606619 probability of yielding the higher score.
The mathematical benefit of this presentation is that the Mann Whitney U test becomes auditable. Readers can trace the logic from raw data to ranks, from ranks to U, and from U to the final probability and p-value. That transparency is one reason the method is so effective in educational and public-facing statistics content.
It also makes the result easier to defend. If a reader asks why the p-value is so small, the explanation is not mysterious: the observed U is far from its null expectation, and that distance remains large even after continuity correction and tie adjustment. If a reader asks why the direction favors the yes-internet group, the answer comes from the mean ranks and from the probability-superiority calculation. Each piece of the story has a visible numerical anchor.
Variables used in the worked example
A clear data dictionary makes the Mann Whitney U test easier to read and easier to verify.
| Variable | Role | Description |
|---|---|---|
| G3 | Outcome variable | Final-grade score used as the ranked response in the Mann Whitney U test. |
| internet | Grouping variable | Binary group membership with categories no and yes. |
| no | Group 1 | 151 students without internet access. |
| yes | Group 2 | 498 students with internet access. |
| Probability superiority | Interpretive metric | The probability that a randomly chosen observation from one group exceeds one from the other. |
These descriptive statistics already hint at the eventual Mann Whitney U test result. The yes-internet group has both a higher mean and a higher median than the no-internet group, and the upper quartile is also slightly higher. The rank-based analysis turns that descriptive pattern into a formal inferential statement.
Public readers often understand a method better when descriptive and inferential layers appear together. That is why the present guide keeps the data dictionary, summary statistics, pooled-rank explanation, and formal Mann Whitney U test result close to each other instead of scattering them across separate sections.
The variable section also helps prevent a common reporting problem: statistical output is often technically correct but semantically vague. Naming the outcome and grouping variables explicitly makes the Mann Whitney U test easier to read, easier to verify, and easier to explain to someone who was not present during the original analysis.
Worked example: final grades by internet access
The worked example shows exactly how the Mann Whitney U test transforms raw values into pooled-rank evidence.
The worked Mann Whitney U test example compares student final grades between those without internet access and those with internet access. The workbook pools all 649 G3 scores, assigns midranks to tied values, and then totals the ranks for the no-internet group. That rank sum is 41,057.5. Using the standard identity U1 = R1 − n1(n1 + 1)/2, the analysis obtains U = 29,581.5.
Dividing the no-group rank sum by the group size produces the no-group mean rank of 271.90. The complementary rank sum for the yes group is 169,867.5, giving a mean rank of 341.10. This difference in mean ranks is a compact visual summary of the whole Mann Whitney U test result: the internet-access group tends to appear higher in the pooled ordering of final grades.
How the rank story reads in plain language
The Mann Whitney U test does not say that every student with internet access scored above every student without it. Instead, it says that once all 649 grades are sorted into one ranked list, the internet-access group tends to hold higher positions overall. The no-internet group still contains many competitive scores, but on average it occupies lower rank positions.
This distinction matters because public audiences sometimes overread rank-based findings. The result is real and statistically strong, but it is still a distributional tendency rather than a deterministic rule.
Observed two-group result
The large-sample tie-adjusted Mann Whitney result indicates a statistically significant difference.
At the 0.05 significance level, the null hypothesis of equal distributions is rejected. The yes-internet group tends to rank higher on final grade than the no-internet group.
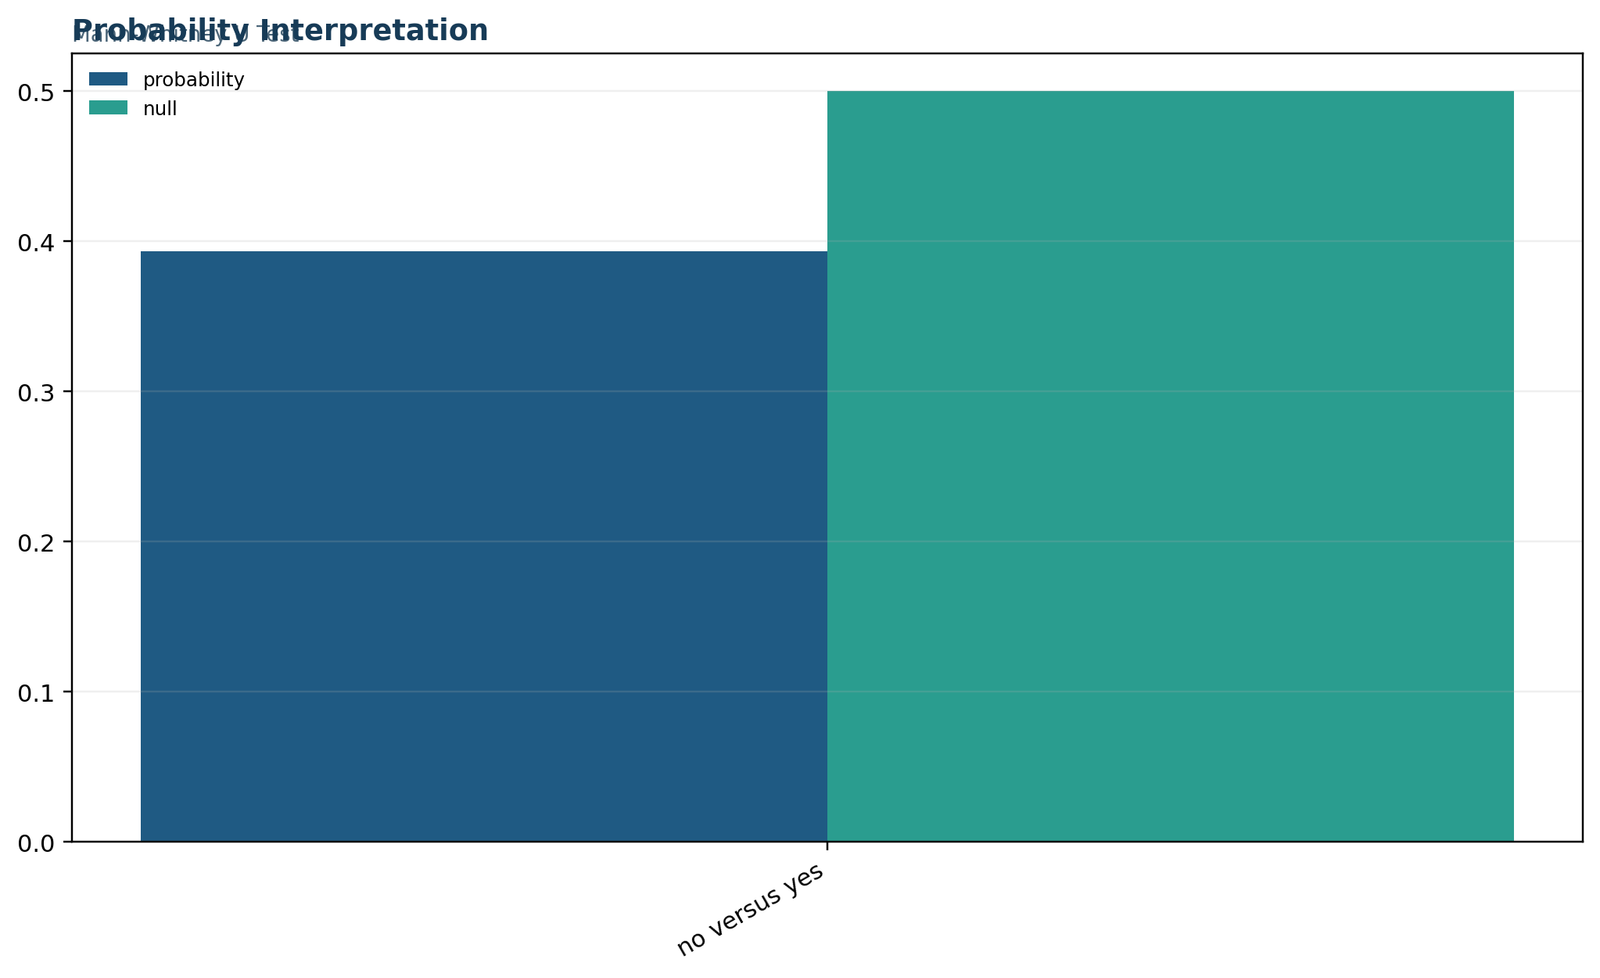
The workbook also reports a probability superiority of 0.393381 for the no-internet group. This means that if one no-internet student and one yes-internet student are sampled at random, the no-internet student would be expected to have the higher final grade only about 39.34% of the time. Reframing the same quantity in the more intuitive direction, the internet-access group wins the random pairwise comparison about 60.66% of the time.
This probability interpretation is one of the strongest public advantages of the Mann Whitney U test. Many readers grasp “60.66% chance of a higher score” more quickly than they grasp a p-value or even a z statistic, yet it is fully grounded in the same rank-based analysis.
The worked example therefore shows how a technical method can still speak in a readable public language. The U statistic, z value, and p-value satisfy formal reporting standards; the probability-superiority sentence gives non-specialists a practical meaning; and the median/mean-rank comparisons show the visible direction of the effect. That three-part combination is one of the most teachable features of the Mann Whitney U test.
In many real reporting situations, that combination is exactly what is needed. Some readers want the formal statistic, some want the applied conclusion, and some want the graphical evidence. A strong Mann Whitney U test article does not force readers to choose among those needs. It presents them together so that the result is both rigorous and understandable.
Exact Mann Whitney U test results table
The core numerical outputs are easiest to understand when placed in one complete summary table.
| Metric | Value | Interpretation |
|---|---|---|
| Group 1 | internet = no | Reference group for the reported U statistic. |
| Group 2 | internet = yes | Comparison group. |
| n1 | 151 | Sample size for the no-internet group. |
| n2 | 498 | Sample size for the yes-internet group. |
| Rank sum R1 | 41,057.5 | Total pooled ranks assigned to the no-internet group. |
| Mean rank (no) | 271.9040 | Average rank position for the no-internet group. |
| Mean rank (yes) | 341.0994 | Average rank position for the yes-internet group. |
| Mann Whitney U | 29,581.5 | Observed U statistic for group 1. |
| Mean U under H0 | 37,599 | Expected value of U under equal distributions. |
| Tie-adjusted variance | 4,021,165.3619 | Variance used for the large-sample standardized test. |
| Continuity-corrected |z| | 3.9979367328 | Magnitude of the standardized departure from the null expectation. |
| Two-sided p-value | 0.0000638970 | Strong evidence that the two distributions differ. |
| Probability superiority (no > yes) | 0.3933814729 | A no-internet student outscores a yes-internet student 39.34% of the time. |
| Probability superiority (yes > no) | 0.6066185271 | A yes-internet student outscores a no-internet student 60.66% of the time. |
What the result table means in plain language
The Mann Whitney U test table shows a statistically significant difference between the two internet-access groups. The no-internet group has a lower mean rank and a lower probability of outperforming the internet-access group in a random pairwise comparison. The evidence is not only statistically significant; it is also directionally clear.
One reason this table is useful is that it keeps three perspectives together: the classic U statistic, the hypothesis-test perspective through z and p, and the applied-interpretation perspective through probability superiority. When those perspectives align, the Mann Whitney U test becomes easier to explain both technically and publicly.
A result table like this also reduces ambiguity about which version of the test was reported. Readers can see the group coding, the group sizes, the rank structure, and the exact probability interpretation. That completeness is good practice for any public guide centered on the Mann Whitney U test.
How to interpret the Mann Whitney U test
Interpretation should combine significance, direction, and practical meaning.
Many readers ask how to interpret Mann Whitney U test results or what does a significant Mann Whitney U test mean. A complete interpretation should report the U statistic, the p-value, the direction of the rank difference, and an understandable effect-style statement such as probability superiority.
Statistical decision
Because the two-sided p-value is 0.0000639, the null hypothesis of equal distributions is rejected. The two groups do not appear to be drawn from the same final-grade distribution.
Direction of the difference
The internet-access group has a higher mean rank and higher probability superiority in the favorable direction, indicating that it tends to occupy stronger final-grade positions overall.
Practical meaning
The rank-based result suggests a meaningful tendency for students with internet access to score higher on final grade. The effect is not framed as an absolute guarantee, but as a strong tendency visible in the pooled ordering of scores.
The most useful public interpretation is therefore: a Mann Whitney U test showed that students with internet access tend to earn higher final-grade ranks than students without internet access. The result is statistically significant, and the probability-superiority view indicates that a randomly selected internet-access student is more likely than not to outscore a randomly selected no-internet student.
Good interpretation also avoids overclaiming. The Mann Whitney U test does not prove that internet access is the only reason for the observed difference, nor does it imply a causal effect by itself. It simply shows that the two observed groups differ in their grade distributions. Causal explanations would require design features and modeling choices beyond the scope of this two-group rank comparison.
This balance between evidence and restraint is especially important in public statistical writing. A statistically significant Mann Whitney U test is informative, but it should still be presented as a distributional comparison rather than as a complete explanation of why the difference exists.
It is equally important not to undersell the result. Because the p-value is far below conventional thresholds and the probability-superiority direction is coherent, the evidence that the two groups differ is strong. Responsible interpretation means recognizing both parts at once: the evidence is clear, but the method still addresses comparison rather than causation.
Mann Whitney U test in Python: chart-by-chart interpretation
The Python figures explain the rank-based result visually from summary metrics to probability interpretation.
People frequently search Mann Whitney U test in Python and want more than a one-line software output. The Python chart set below explains the same result visually while preserving the exact boxed-chart format used in the permanent post model.
Python is especially useful for teaching the Mann Whitney U test because every stage of the procedure can be scripted transparently. The raw data can be imported, pooled ranks can be checked, and the resulting probabilities can be calculated directly. That transparency makes the chart block below especially valuable for readers who want both the result and the reasoning behind it.
For readers learning applied statistics, the Python visuals also help separate descriptive evidence from inferential evidence. The descriptive charts show how the two groups look; the rank-based charts show why the pooled ordering matters; and the probability chart converts the final inference into an intuitive applied statement. Taken together, the four Python figures provide a compact but complete learning sequence for the Mann Whitney U test.
Python chart 1: primary metrics
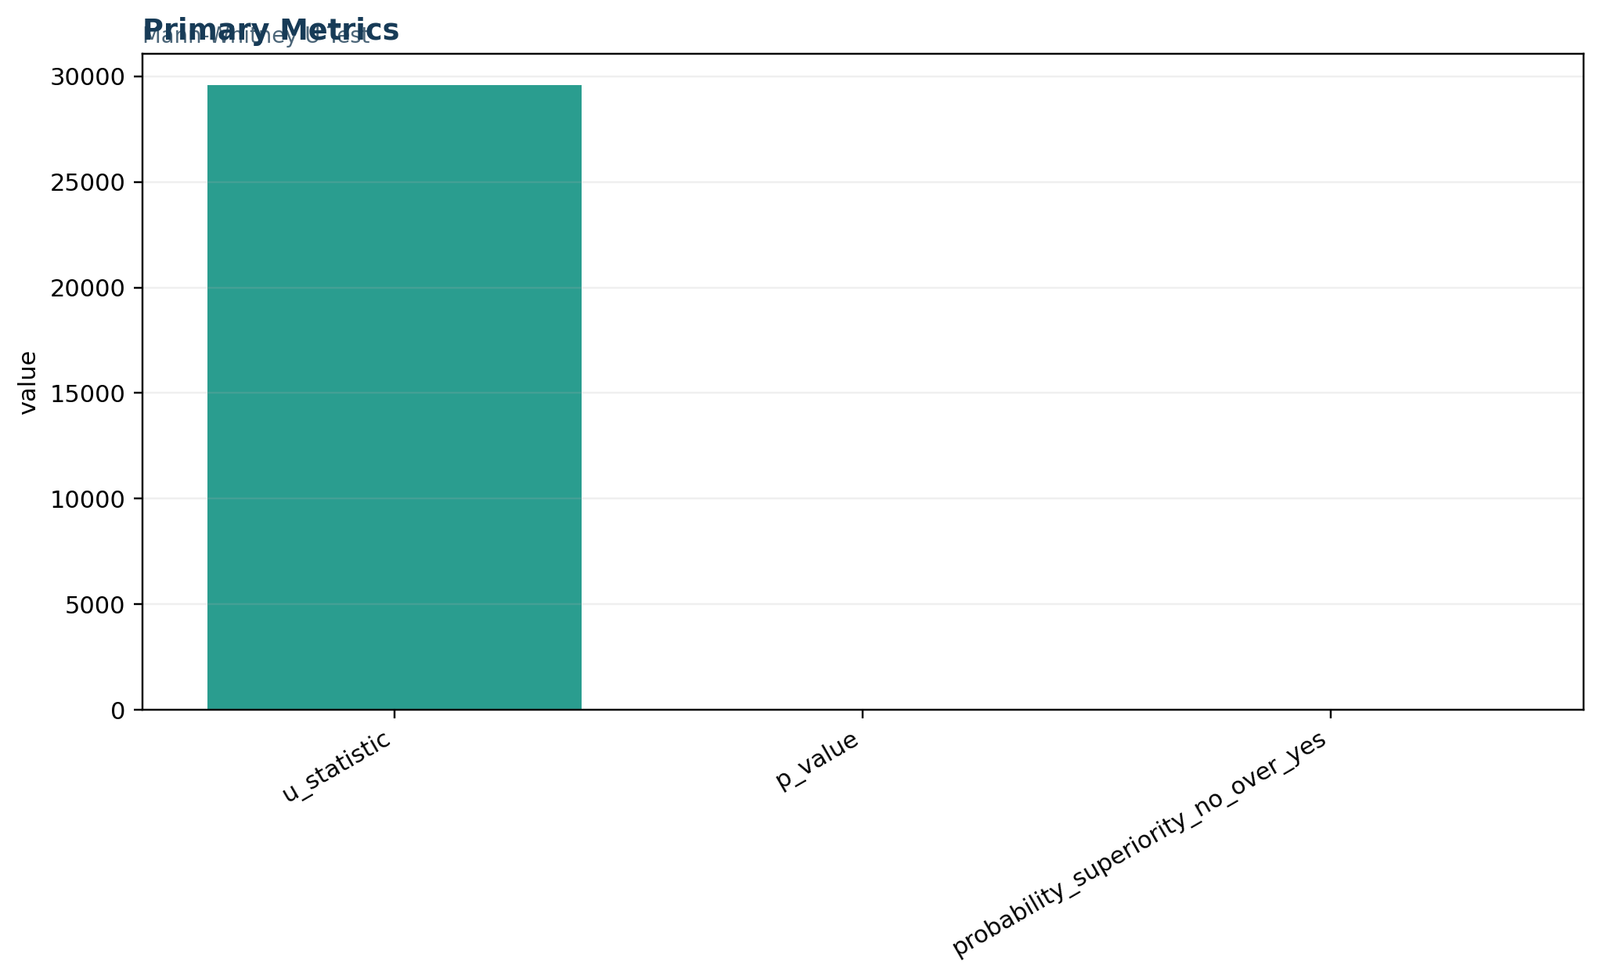
This opening figure acts as the dashboard for the entire Mann Whitney U test result. It highlights the key numerical outputs—U = 29,581.5, the continuity-corrected |z| = 3.9979, the two-sided p-value = 0.0000639, and the sample sizes 151 and 498. The chart tells the central story immediately: the two groups differ significantly, and the result is not marginal.
Python chart 2: internet-grade summary
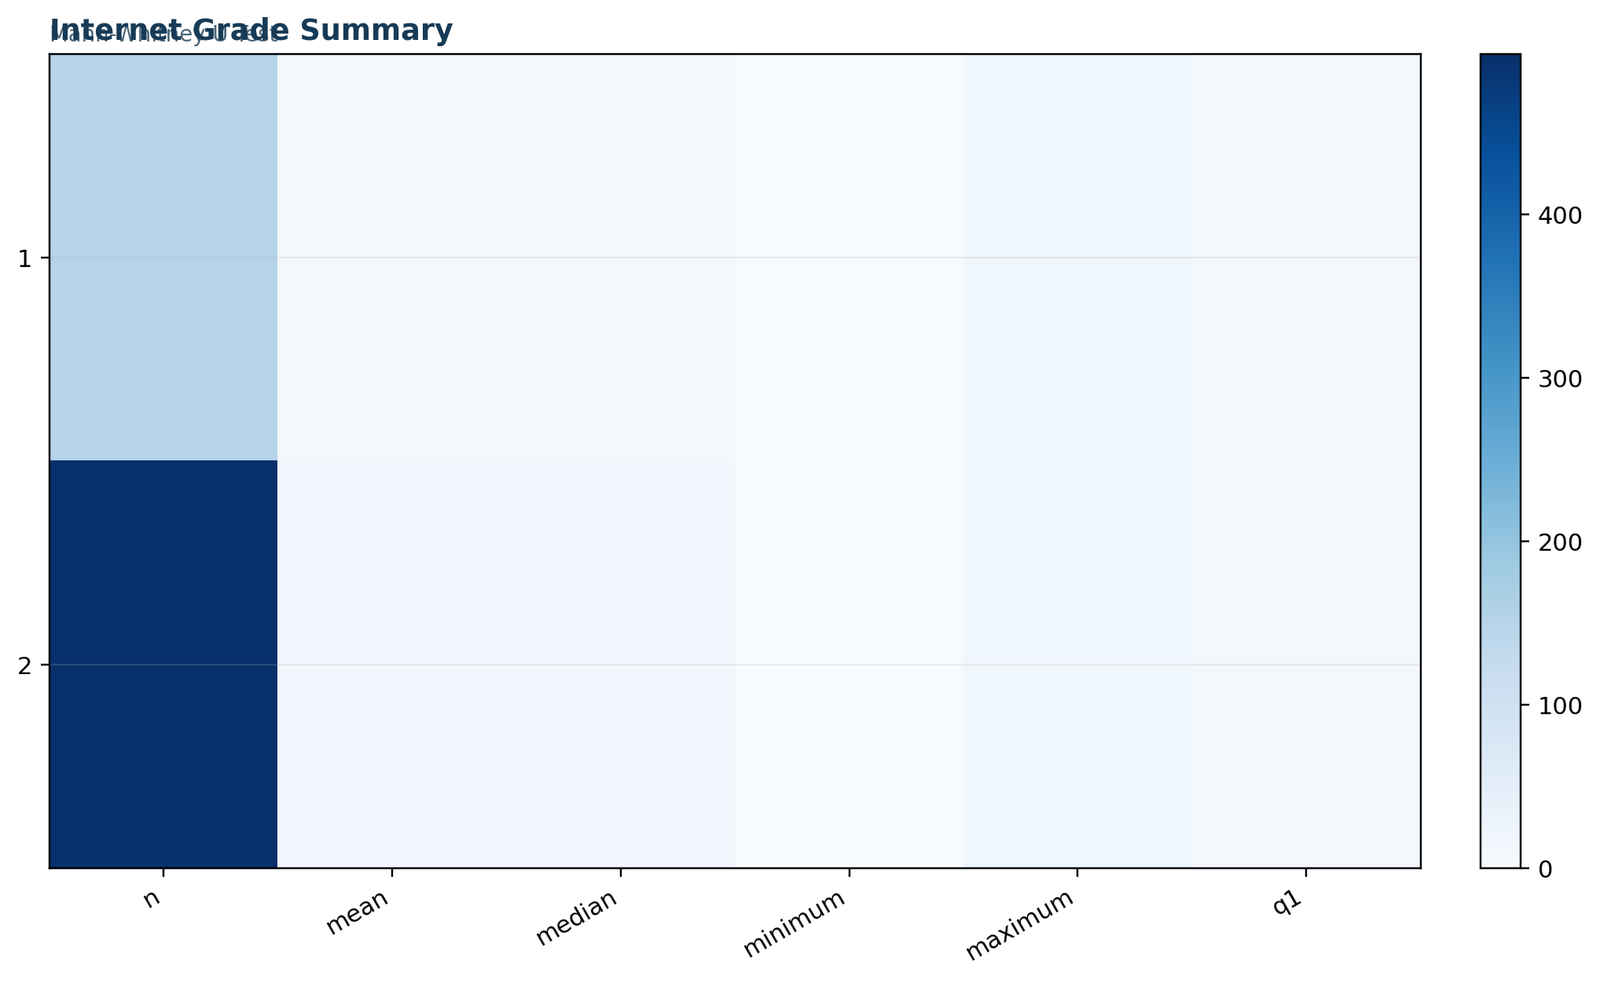
This chart places the group descriptives beside each other so that readers can see why the Mann Whitney U test was likely to detect a difference. The no-internet group has a median of 11, while the yes-internet group has a median of 12. The yes group also has a higher mean and a slightly higher upper quartile, so the descriptive picture already points toward better performance in the internet-access group.
Python chart 3: ranked observations
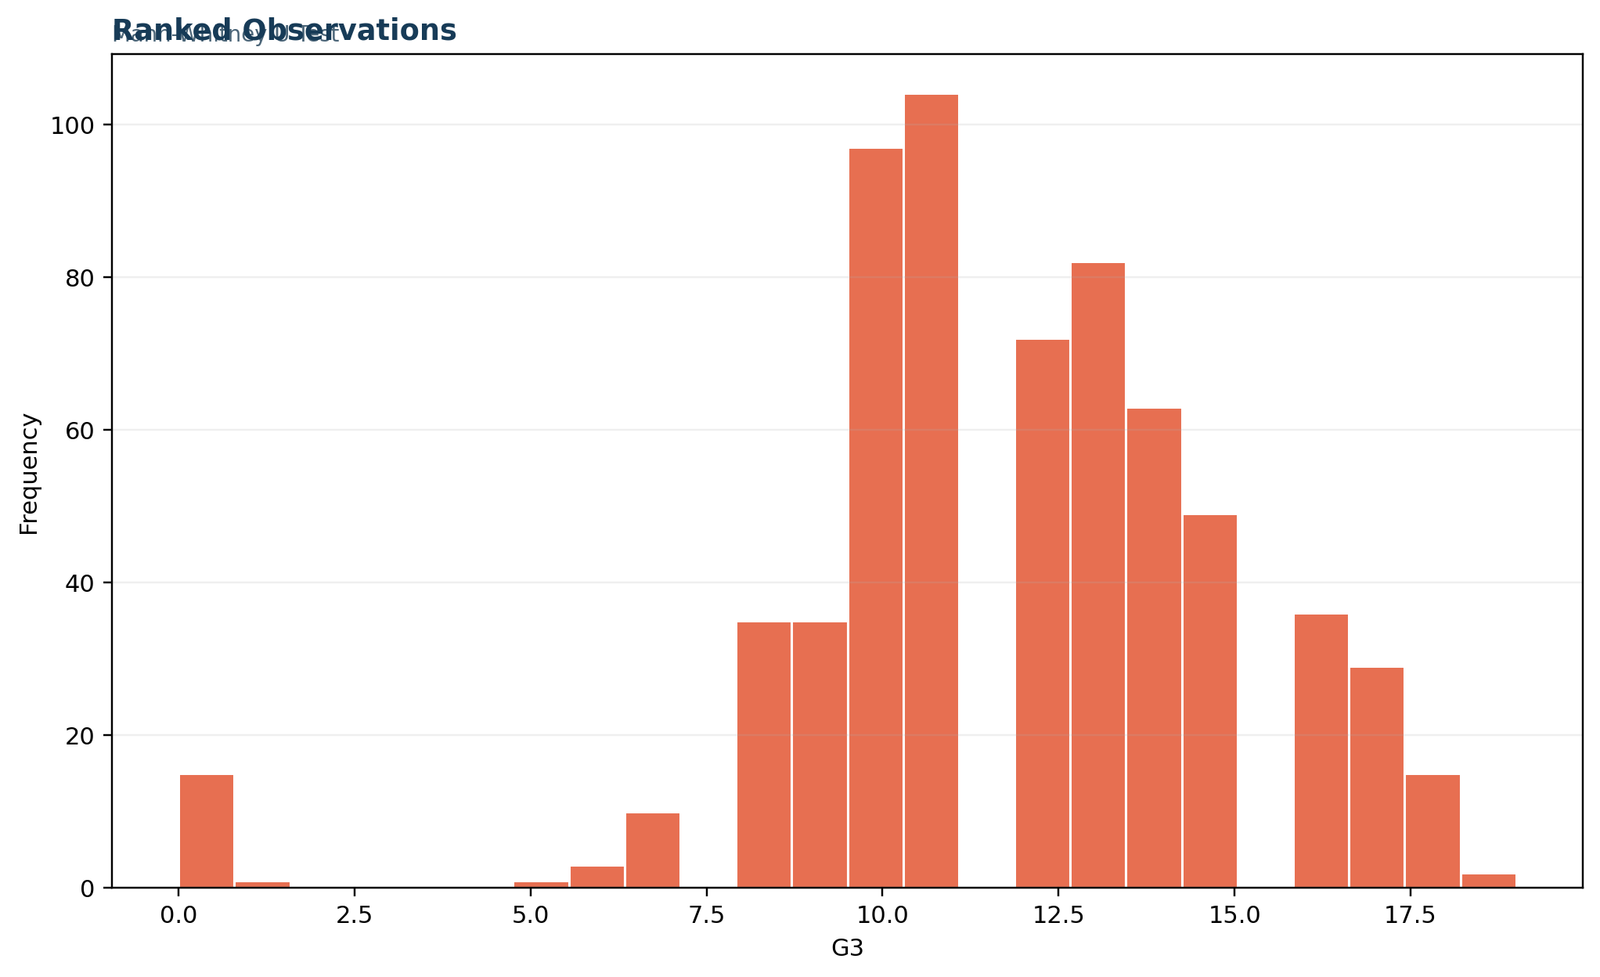
This figure shows the logic of the Mann Whitney U test more directly. Once the two groups are pooled and ranked together, the yes-internet group occupies more of the higher rank positions overall. That is the structural reason the observed U statistic falls far enough from its null expectation to become statistically significant.
Python chart 4: probability interpretation
The probability-interpretation chart translates the Mann Whitney U test into one of its most intuitive public explanations. It shows that the probability of a no-internet student outscoring a yes-internet student is 0.3934, while the reverse comparison is 0.6066. This helps readers understand not only that the result is significant, but also how the direction of the difference works in practice.
Mann Whitney U test in R: chart-by-chart interpretation
The R figures reproduce the same substantive message and strengthen reproducibility across software.
The Mann Whitney U test in R is widely used in research, teaching, and reporting. The R chart set below confirms that the result does not depend on one software environment alone. When Python and R converge on the same U statistic, direction, and probability interpretation, confidence in the analysis naturally increases.
R is also a strong platform for the Mann Whitney U test because it supports the full workflow: descriptive summaries, rank-based inference, graphics, and polished reporting. The boxed charts below therefore do more than repeat the Python figures—they reinforce the analytical reliability of the same conclusion.
That reproducibility matters in public-facing statistics. When the same Mann Whitney U test conclusion appears in both Python and R, readers gain confidence that the result is anchored in the data rather than in one interface or one package default. Cross-software agreement is therefore part of the explanation, not merely an extra technical detail.
R chart 1: primary metrics
The first R chart confirms the same core metrics as the Python analysis. The Mann Whitney U test remains significant, the p-value remains very small, and the two-group difference is stable across software implementations.
R chart 2: internet-grade summary
This chart brings the descriptive layer of the Mann Whitney U test back into view. The higher median and higher overall level of the internet-access group align cleanly with the inferential result.
R chart 3: ranked observations
The ranked-observations figure shows how the raw values are converted into the ordered material used by the Mann Whitney U test. It helps readers see that the final inference is driven by the full rank pattern, not by only one descriptive statistic.
R chart 4: probability interpretation
The probability chart restates the comparison in common-language form. The internet-access group is more likely to produce the higher final grade in a random pairwise comparison. That is exactly the kind of public explanation that makes the Mann Whitney U test so valuable.
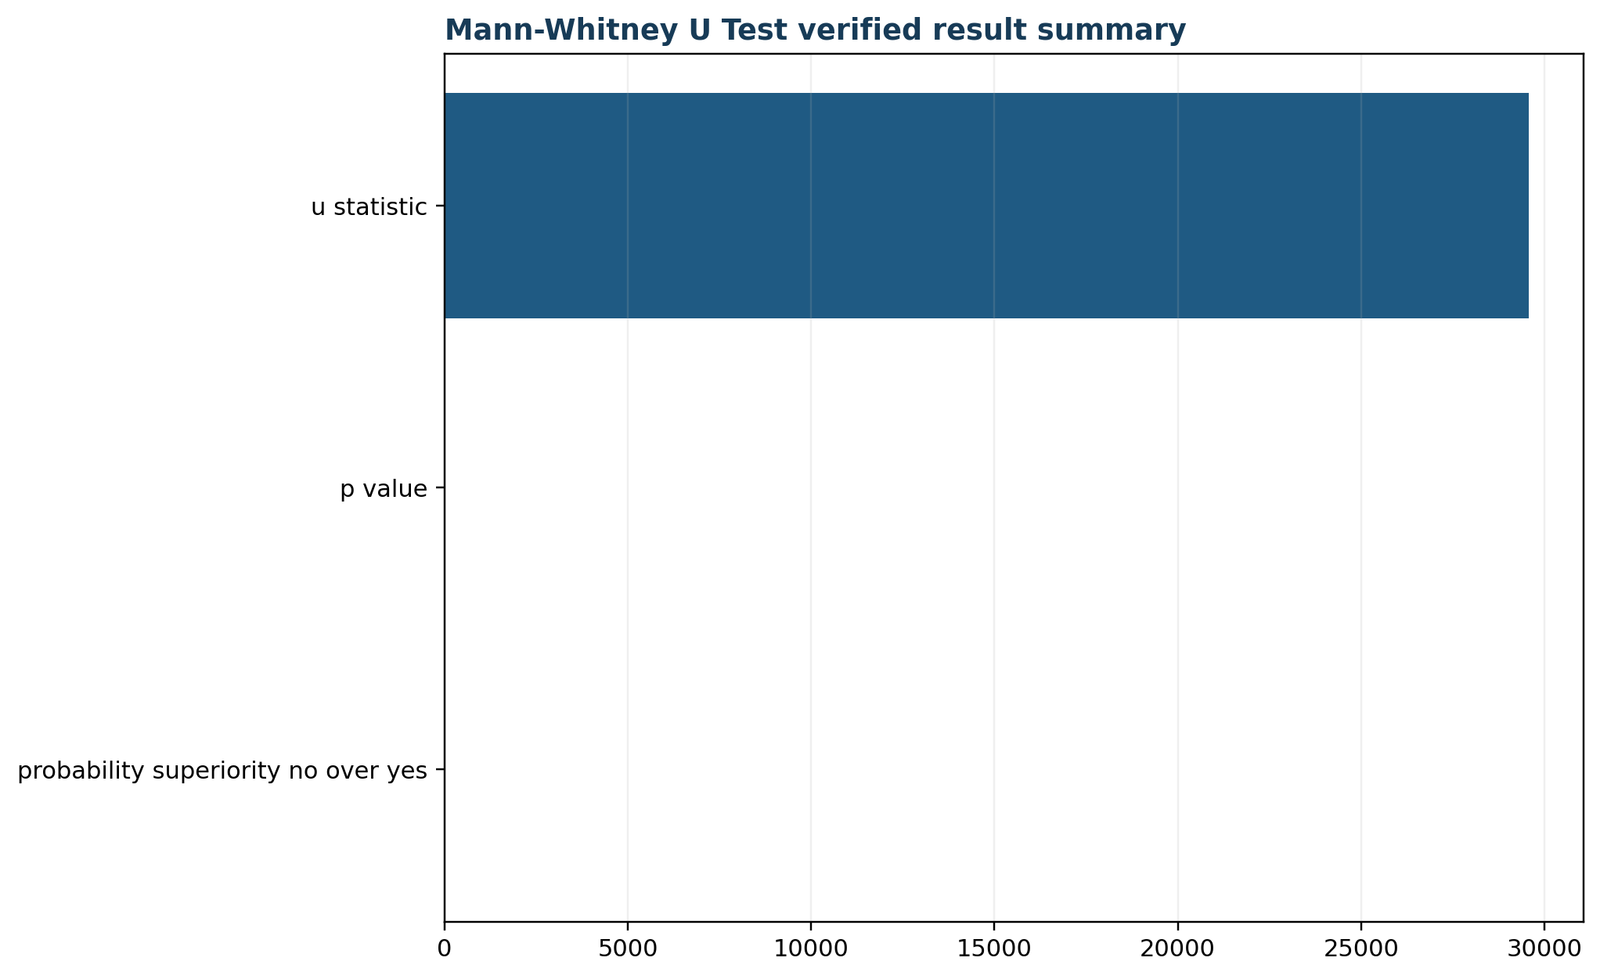
R chart 5: verified result summary
This final R figure compresses the whole Mann Whitney U test analysis into a compact public conclusion: the final-grade distributions differ significantly between the no and yes internet groups, with the yes group tending to rank higher overall.
Mann Whitney U test in SPSS
SPSS users reach the same inferential conclusion even though the output format looks different.
SPSS interpretation points
In SPSS, the Mann Whitney U test is still read through the same core quantities: the two group sizes, the U statistic, the standardized test statistic, and the significance level. A good SPSS interpretation should also mention direction—usually through mean ranks or medians—rather than stopping at significance alone.
Publicly, it helps to explain that the SPSS result compares pooled rank positions rather than merely comparing means. That keeps the interpretation aligned with what the Mann Whitney U test actually measures.
SPSS conclusion for this example
The SPSS output agrees with the workbook and the Python/R analyses: the no-internet and yes-internet groups differ significantly in final-grade distribution, and the internet-access group tends to occupy higher rank positions. The software interface changes, but the substantive meaning does not.
This cross-platform agreement is helpful for public trust. It shows that the result is not an artifact of one coding environment but a stable conclusion supported across the main analysis tools.
Mann Whitney U test in Excel
The workbook makes every ranking and variance step visible, which is extremely useful for teaching and auditability.
Searchers frequently ask how to do a Mann Whitney U test in Excel. The workbook used here answers that question transparently. Excel is especially useful because it exposes the raw data, the pooled midranks, the tie contributions, the U identity, the standardized z calculation, and the final reporting checks all in separate, auditable sheets.
| Workbook sheet | Purpose in the Mann Whitney U workflow |
|---|---|
| Guide | Documents the design, null hypothesis, variables, formula, and workbook scope. |
| Data_Input | Stores the unchanged G3 and internet variables. |
| Working | Shows pooled midranks and tie contributions row by row. |
| Calculations | Displays n1, n2, rank sum, U, mean U, tie term, variance, z, p-value, and probability superiority. |
| Diagnostics | Lists the method-specific assumption and correction notes. |
| Reporting | Cross-checks workbook outputs against verified reference values. |
This transparency also matters for SEO-style educational content. Many readers do not merely want the answer; they want to understand how the answer is produced. A workbook that shows pooled ranks, tie-aware variance, and reporting cross-checks makes the Mann Whitney U test much easier to learn and verify.
Excel is also helpful for classroom use because it slows the analysis down in a productive way. Instead of clicking one button and accepting a black-box output, the learner can inspect each intermediate component. That makes the Mann Whitney U test feel less like a mysterious software procedure and more like a logical rank-based argument.
How to report Mann Whitney U test results
Good reporting tells readers what was compared, how it was compared, and what the comparison means.
Many public posts stop after printing a p-value. A better Mann Whitney U test report names the groups, states the U statistic, gives the p-value, mentions the direction of the rank difference, and provides a practical interpretation such as probability superiority. This fuller approach is what turns software output into meaningful explanation.
APA-style example
A Mann Whitney U test was conducted to compare final grades between students without internet access and students with internet access. The result showed a statistically significant difference in grade distributions, U = 29,581.5, z = 3.998, p < .001. Students with internet access tended to have higher rank positions than students without internet access. The probability that a randomly selected no-internet student would outscore a randomly selected internet-access student was 0.393, indicating that the yes-internet group generally performed better.
What to include
- Name the Mann Whitney U test explicitly.
- Report U, z, and the p-value.
- State which group tends to rank higher.
- Include medians, mean ranks, or both.
- Add a practical interpretation such as probability superiority.
What to avoid
- Do not report only that the result is significant without direction.
- Do not describe the method as if it were automatically a mean-comparison test.
- Do not ignore ties when the dataset contains many repeated values.
- Do not overstate the result as causal when the analysis is purely comparative.
The best public explanation therefore combines the formal and the intuitive: the Mann Whitney U test was significant, the yes-internet group occupied higher ranks, and the random-pair comparison favors that group about 60.66% of the time. That is a technically sound statement that still reads clearly for general audiences.
Reporting quality is one of the most overlooked parts of applied statistics. A result can be computed perfectly and still communicated badly. By contrast, a well-written Mann Whitney U test report makes the method, the result, and the practical meaning all visible at once. That is the reporting standard this guide aims to model.
Mann Whitney U test versus related methods
Different two-group methods answer different questions, so the method should match the inferential target.
| Method | Main question | How it differs from the Mann Whitney U test |
|---|---|---|
| Mann Whitney U test | Do two independent groups differ in their rank distribution? | Uses pooled ranks and supports probability-superiority interpretation. |
| Two-sample t test | Do two independent groups differ in mean? | Targets mean differences under a parametric framework rather than pooled-rank ordering. |
| Wilcoxon signed-rank test | Do paired or matched observations differ? | Used for paired designs, unlike the independent-sample Mann Whitney U test. |
| Kolmogorov–Smirnov test | Do two distributions differ in their cumulative structure? | Compares empirical CDF separation rather than rank-sum behavior. |
| Kruskal Wallis test | Do three or more independent groups differ? | The Kruskal Wallis test is the multi-group extension of the same rank-based logic. |
The choice between these methods should be guided by the research question, the design, and the outcome type. The Mann Whitney U test earns its place when the problem is exactly a two-group independent comparison and the analyst wants a robust rank-based answer.
Readers also sometimes search Mann Whitney U test vs t test. The clean distinction is that the t test focuses on means, whereas the Mann Whitney U test focuses on ordered positions in a pooled distribution. Neither test is inherently “better” in all settings; each is appropriate when its inferential target matches the real question.
That is an important methodological lesson. Good analysis begins by asking what kind of difference matters most—mean difference, paired change, cumulative-distribution separation, or pooled-rank dominance. The Mann Whitney U test is excellent when pooled-rank dominance is the right language for the research question.
Downloads
These links provide the supporting materials for the worked example.
Python reportDetailed Python output and interpretation for the Mann Whitney U test.Open report
R reportR output for the same two-group rank-based analysis.Open report
SPSS outputSPSS companion output for the worked example.Open report
Excel workbookAuditable workbook with pooled ranks, tie handling, and reporting cross-checks.Open workbook
Frequently asked questions about the Mann Whitney U test
Short answers to common questions about the method, its assumptions, and its interpretation.
What is the Mann Whitney U test?
The Mann Whitney U test is a nonparametric method for comparing two independent groups using pooled ranks.
When should I use the Mann Whitney U test?
Use the Mann Whitney U test when you have two independent groups and want a rank-based alternative to a two-sample t test.
What does the Mann Whitney U test compare?
It compares whether one group tends to produce larger observations than the other when all values are placed into one common rank order.
What were the group sizes in this example?
The no-internet group had 151 students, and the yes-internet group had 498 students.
What was the U statistic?
The observed Mann Whitney U test statistic was 29,581.5.
What was the p-value?
The two-sided p-value was 0.0000638970.
Was the Mann Whitney U test significant?
Yes. The p-value is far below 0.05, so the difference between the two groups is statistically significant.
Which group ranked higher?
The yes-internet group ranked higher overall, with a mean rank of 341.10 compared with 271.90 for the no-internet group.
Does the Mann Whitney U test require normality?
No. The Mann Whitney U test is nonparametric and does not require the outcome to be normally distributed.
Can the Mann Whitney U test handle ties?
Yes. The workbook uses pooled midranks and a tie-adjusted variance to handle repeated values correctly.
What is probability superiority?
Probability superiority is the probability that a randomly chosen observation from one group exceeds a randomly chosen observation from the other, with ties split evenly.
What was the probability superiority for the no-internet group?
It was 0.393381, meaning the no-internet group was less likely than not to produce the higher score in a random pairwise comparison.
What was the favorable probability for the internet-access group?
The complementary probability was 0.606619, so the yes-internet group was more likely to produce the higher final grade.
Is the Mann Whitney U test the same as the Wilcoxon rank-sum test?
Yes. In independent-sample use, the labels Mann Whitney U test and Wilcoxon rank-sum test refer to the same underlying rank-based procedure.
Is the Mann Whitney U test the same as a paired Wilcoxon signed-rank test?
No. The signed-rank test is for paired data, whereas the Mann Whitney U test is for independent groups.
Can the Mann Whitney U test be done in Excel?
Yes. The workbook linked in this guide shows every step, from pooled ranks to the final p-value.
Can the Mann Whitney U test be done in Python and R?
Yes. This guide includes matched Python and R chart explanations along with downloadable reports.
What is the main conclusion of this worked example?
The Mann Whitney U test shows that students with internet access tend to have higher final-grade rank positions than students without internet access.
Why is the Mann Whitney U test considered robust?
The Mann Whitney U test is considered robust because it uses pooled ranks rather than depending heavily on normality, and it naturally limits the influence of extreme values.
Can unequal group sizes be used in the Mann Whitney U test?
Yes. Unequal group sizes are common, and the current example uses 151 observations in one group and 498 in the other.
Why are mean ranks reported alongside medians?
Mean ranks help show the direction of the pooled ordering, while medians help readers understand the raw-scale summary. Together they make the Mann Whitney U test easier to interpret.