Sampling Bias: Undercoverage, Nonresponse, and Response Bias
Learn how undercoverage, nonresponse, response bias, wording, and voluntary response can systematically distort a sample.

Free Statistical Analysis Online Calculators, Guides and Ethical Support
Resources
Practical guides for SPSS, R, Python, Excel, Power BI, statistical tests, calculators, dashboards and interpretation.
Learn how undercoverage, nonresponse, response bias, wording, and voluntary response can systematically distort a sample.
36 visible MCQs, 14 FRQ sets, formulas, worked answers, and direct links to the complete AP Statistics practice system.
Build probability distributions, calculate expected value and standard deviation, and interpret a random variable in context.
Study the geometric model as legacy AP Statistics enrichment while clearly separating it from the revised 2026–27 tested course.
Decide whether quantitative data require an independent two-sample t interval or a paired t interval, then interpret the difference correctly.
Understand what a confidence interval estimates, how its margin of error is formed, and how to interpret confidence correctly in context.
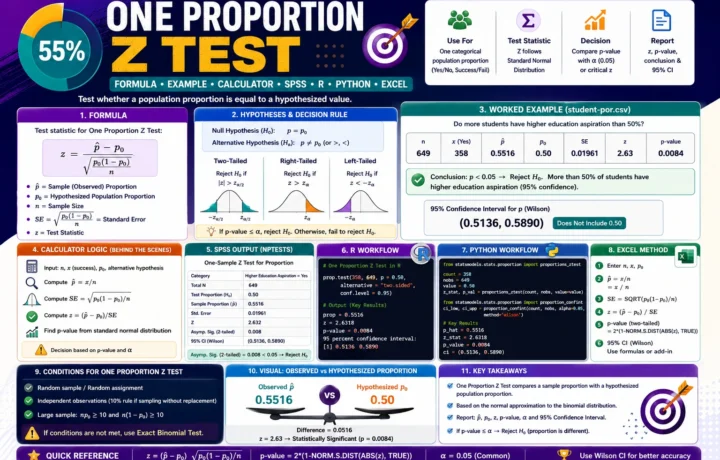
Learn One Proportion Z Test with formula, conditions, p-value, calculator logic, SPSS output, R workflow, Python validation, Excel method and a complete student-por.csv worked example.
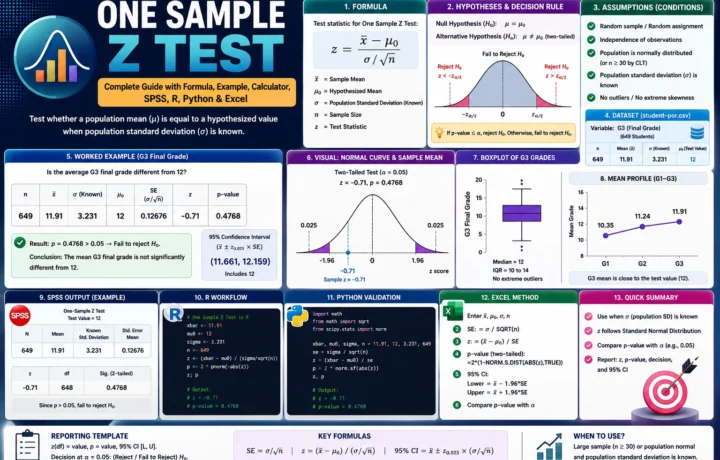
One-Sample Mean Hypothesis Test One Sample Z Test is used to test whether a sample mean is significantly different from, greater than, or less than a…
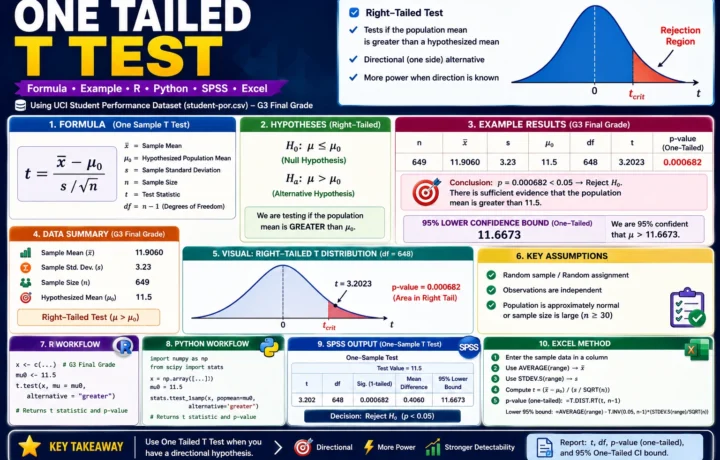
This One Tailed T Test guide explains the formula, hypotheses, right-tailed p-value, confidence bound, R, Python, SPSS and Excel methods using a real Student Performance dataset example.
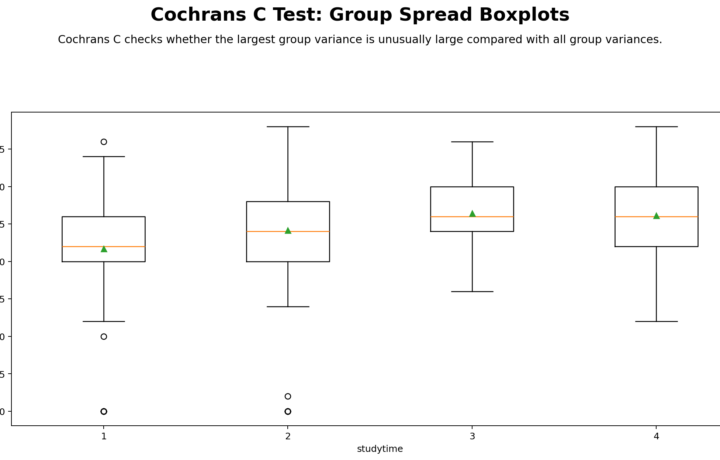
Learn Cochran’s C Test with verified SPSS output, Python charts, R charts, Excel workflow, interpretation guidance, APA reporting tips, and downloadable resources.