
Statistical Analysis Guide
Log Transformation: Assumption Fix, SPSS, Python, R and Excel Guide
This guide explains Log Transformation using the verified files in this folder: 7 Python chart(s), 7 R chart(s), and 1 SPSS PDF output file(s). It follows the same live Salar Cafe post structure used by the most recent published guides.
Quick Answer: Log Transformation
Log Transformation changes the measurement scale so that model assumptions can be easier to satisfy. The transformed result should be interpreted together with the original scale and the research question.
Main Log Transformation Result
The folder contains 14 uploaded chart image(s) plus the SPSS output resource. Use the SPSS PDF as the verification source and the Python/R charts as visual interpretation support.
| variable | version | transformed_variable | log_shift_added | n | mean | standard_deviation | minimum |
|---|---|---|---|---|---|---|---|
| G3 | Original | G3 | 0 | 649 | 11.9060092449923 | 3.2306562428048 | 0 |
| G3 | Log transformed | log_G3 | 1 | 649 | 2.49792619328073 | 0.440851580610796 | 0 |
| G2 | Original | G2 | 0 | 649 | 11.5701078582435 | 2.91363866430387 | 0 |
| G2 | Log transformed | log_G2 | 1 | 649 | 2.49163709804954 | 0.336685818193088 | 0 |
| G1 | Original | G1 | 0 | 649 | 11.3990755007704 | 2.74526512844637 | 0 |
| G1 | Log transformed | log_G1 | 1 | 649 | 2.49002164276012 | 0.24905835440786 | 0 |
Preview table: log_transformation_before_after_summary.csv
Table of Contents
- What Is Log Transformation?
- Formula and Decision Rule
- Dataset and Verified SPSS Results
- Python Chart-by-Chart Interpretation
- R Chart-by-Chart Interpretation
- SPSS, Python, R and Excel Workflows
- APA and Report Writing
- Downloads and Resources
- FAQs
What Is Log Transformation?
Log Transformation is used in statistical analysis to summarize evidence, check assumptions, or support a decision about a variable, model, or distribution. The safest interpretation combines the numerical result, chart pattern, sample context, and research question.
In this guide, the same topic is demonstrated through SPSS output, Python charts, R charts, and an Excel-friendly workflow so that the result can be checked across tools.
Log Transformation Formula and Decision Rule
Log Transformation changes the measurement scale so that model assumptions can be easier to satisfy. The transformed result should be interpreted together with the original scale and the research question.
For assumption tests, the usual reporting rule is to compare the p-value with alpha, commonly 0.05. For descriptive measures, the statistic should be interpreted with the scale of the original variable.
Dataset and Verified SPSS Results for Log Transformation
The SPSS PDF output is the verification file for this post. It should be used to confirm the reported statistic, decision, and interpretation before the result is used in a report or assignment.
Python Chart-by-Chart Interpretation for Log Transformation
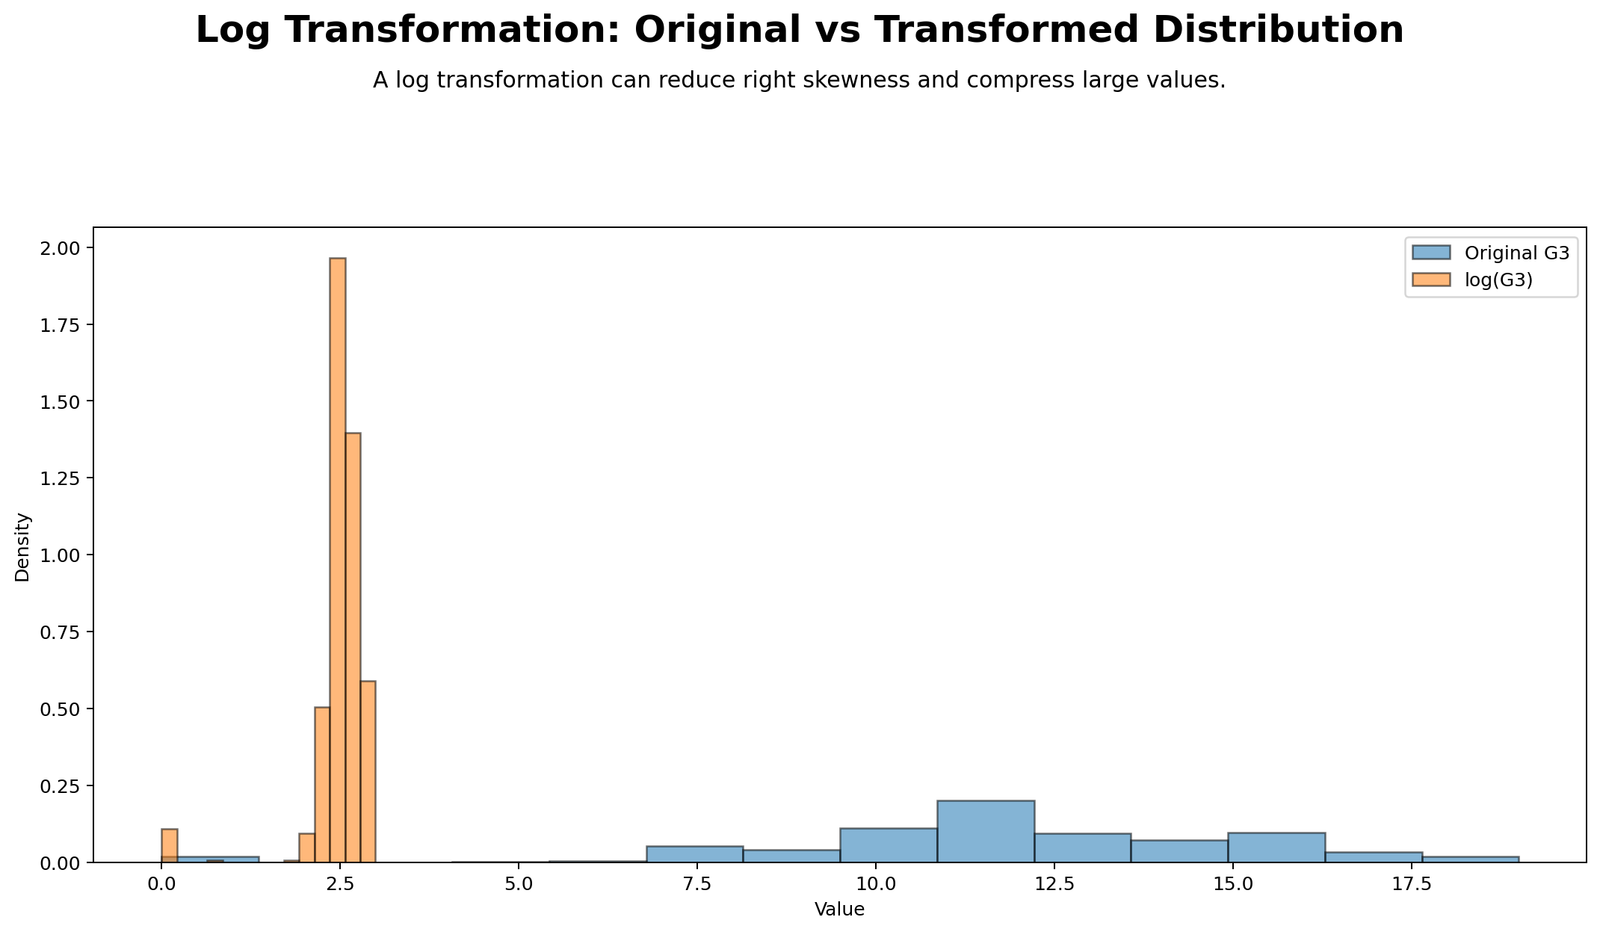
This chart supports the Log Transformation interpretation by showing the relevant distribution, comparison, diagnostic pattern, or decision evidence from the Python workflow.
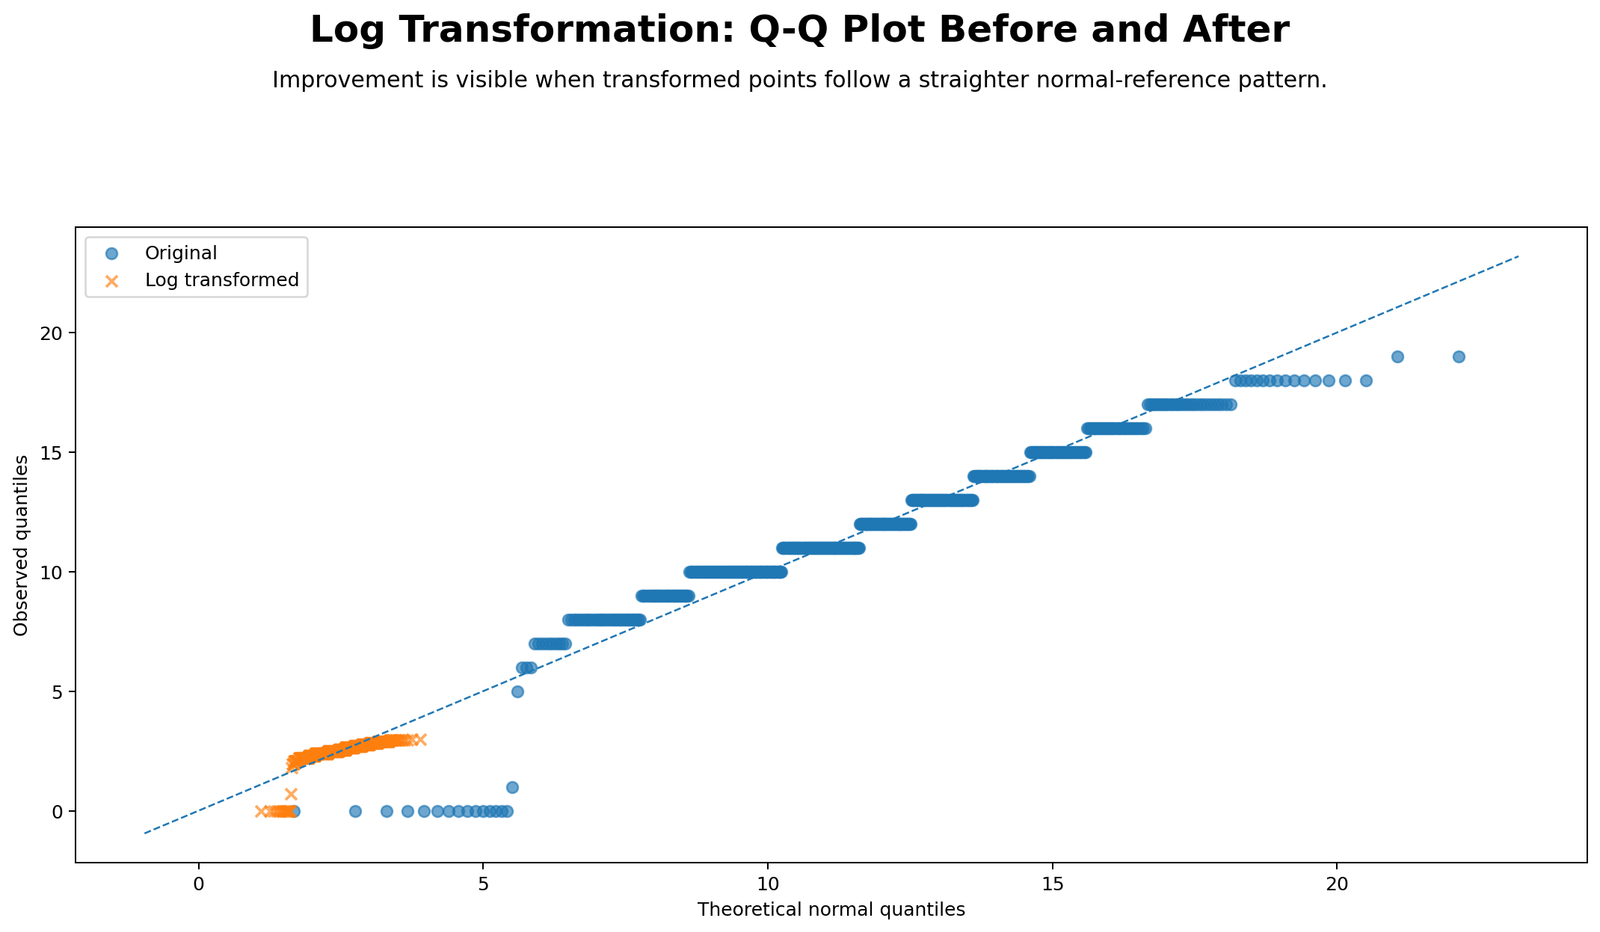
This chart supports the Log Transformation interpretation by showing the relevant distribution, comparison, diagnostic pattern, or decision evidence from the Python workflow.
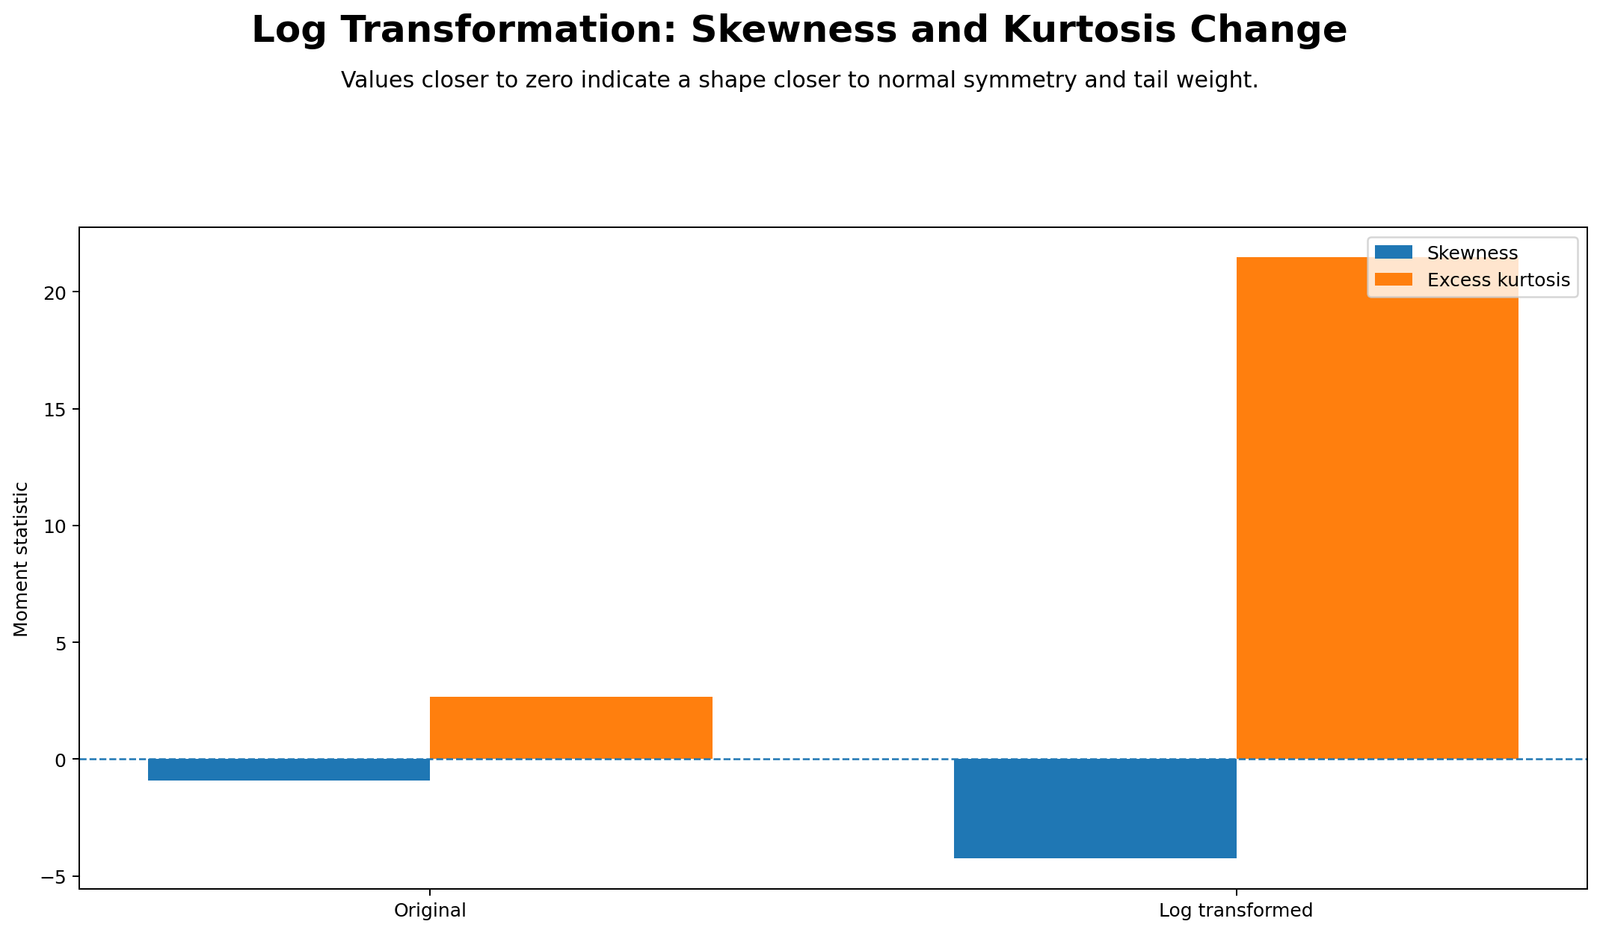
This chart supports the Log Transformation interpretation by showing the relevant distribution, comparison, diagnostic pattern, or decision evidence from the Python workflow.
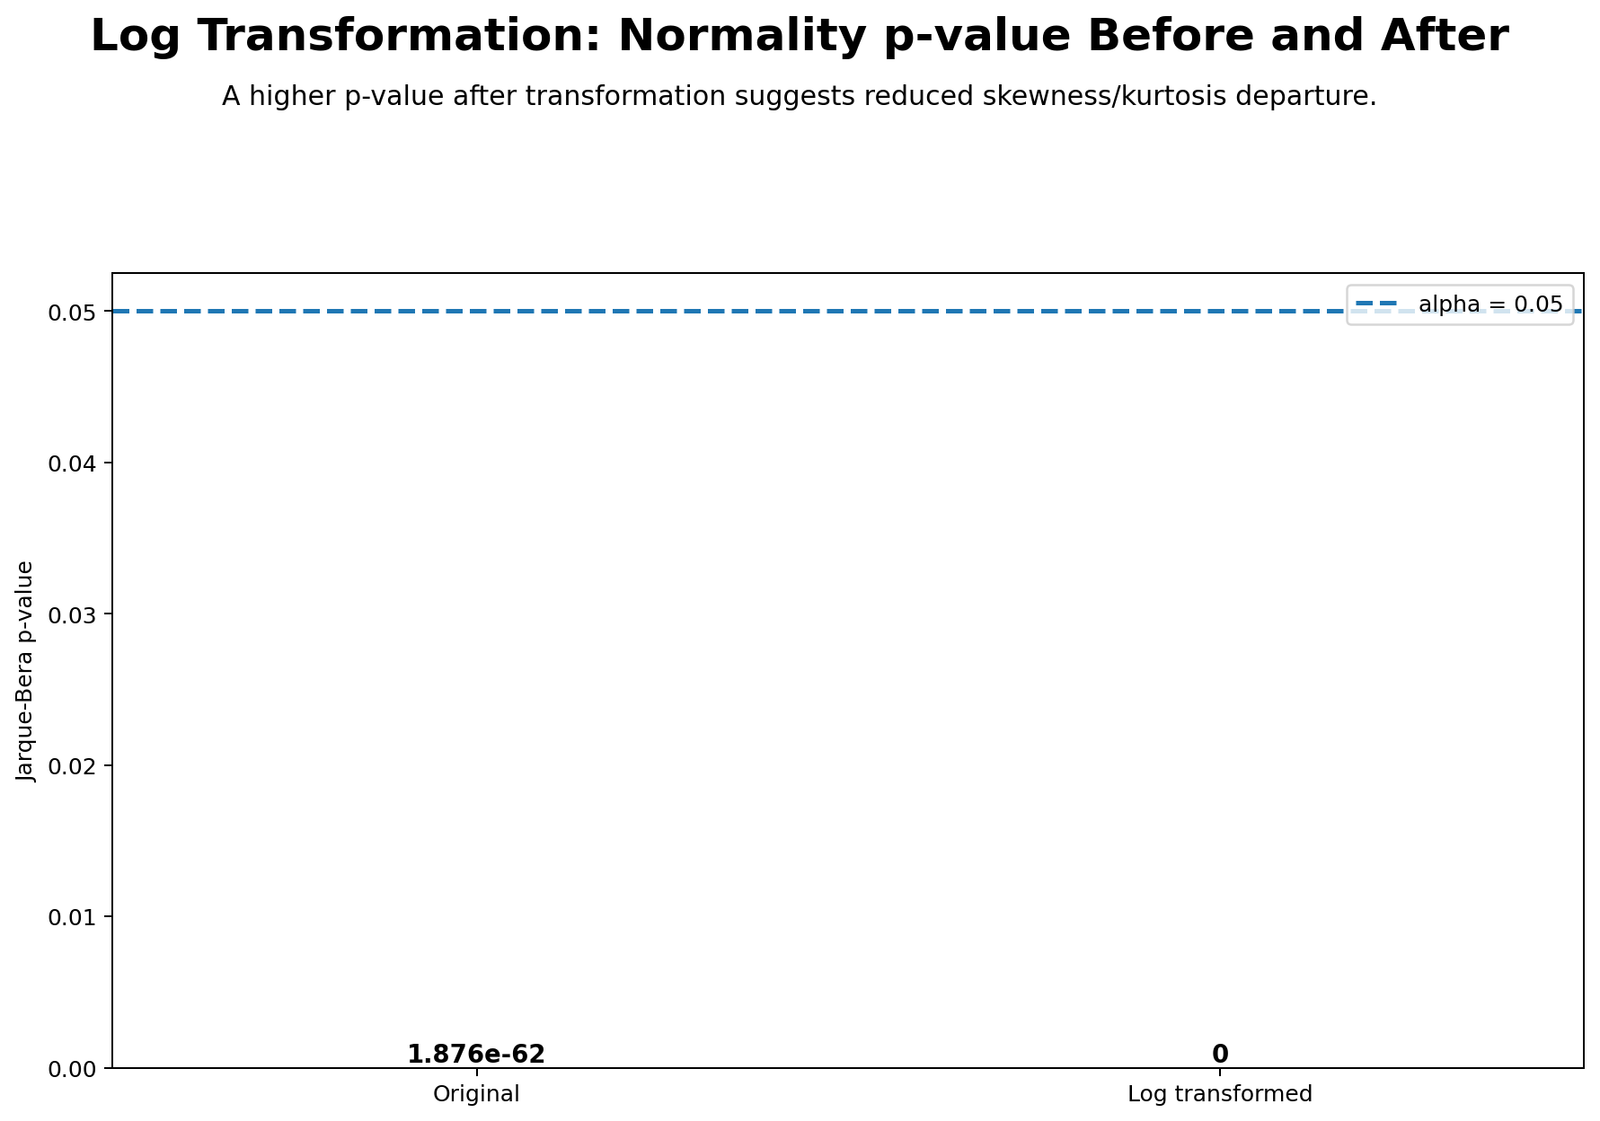
This chart supports the Log Transformation interpretation by showing the relevant distribution, comparison, diagnostic pattern, or decision evidence from the Python workflow.
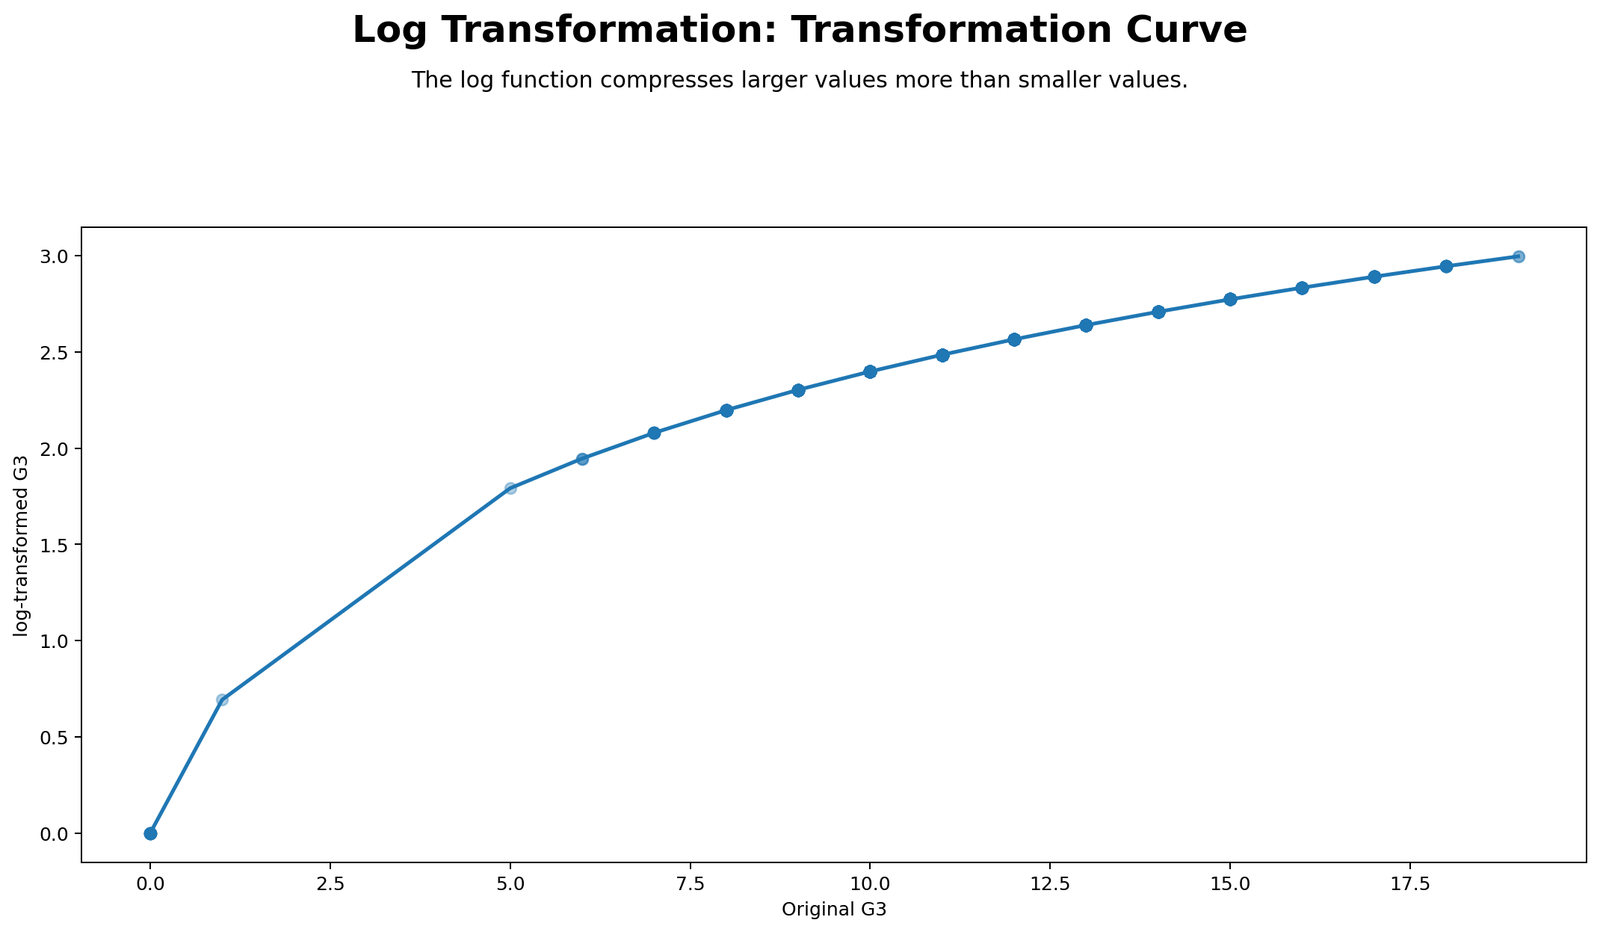
This chart supports the Log Transformation interpretation by showing the relevant distribution, comparison, diagnostic pattern, or decision evidence from the Python workflow.
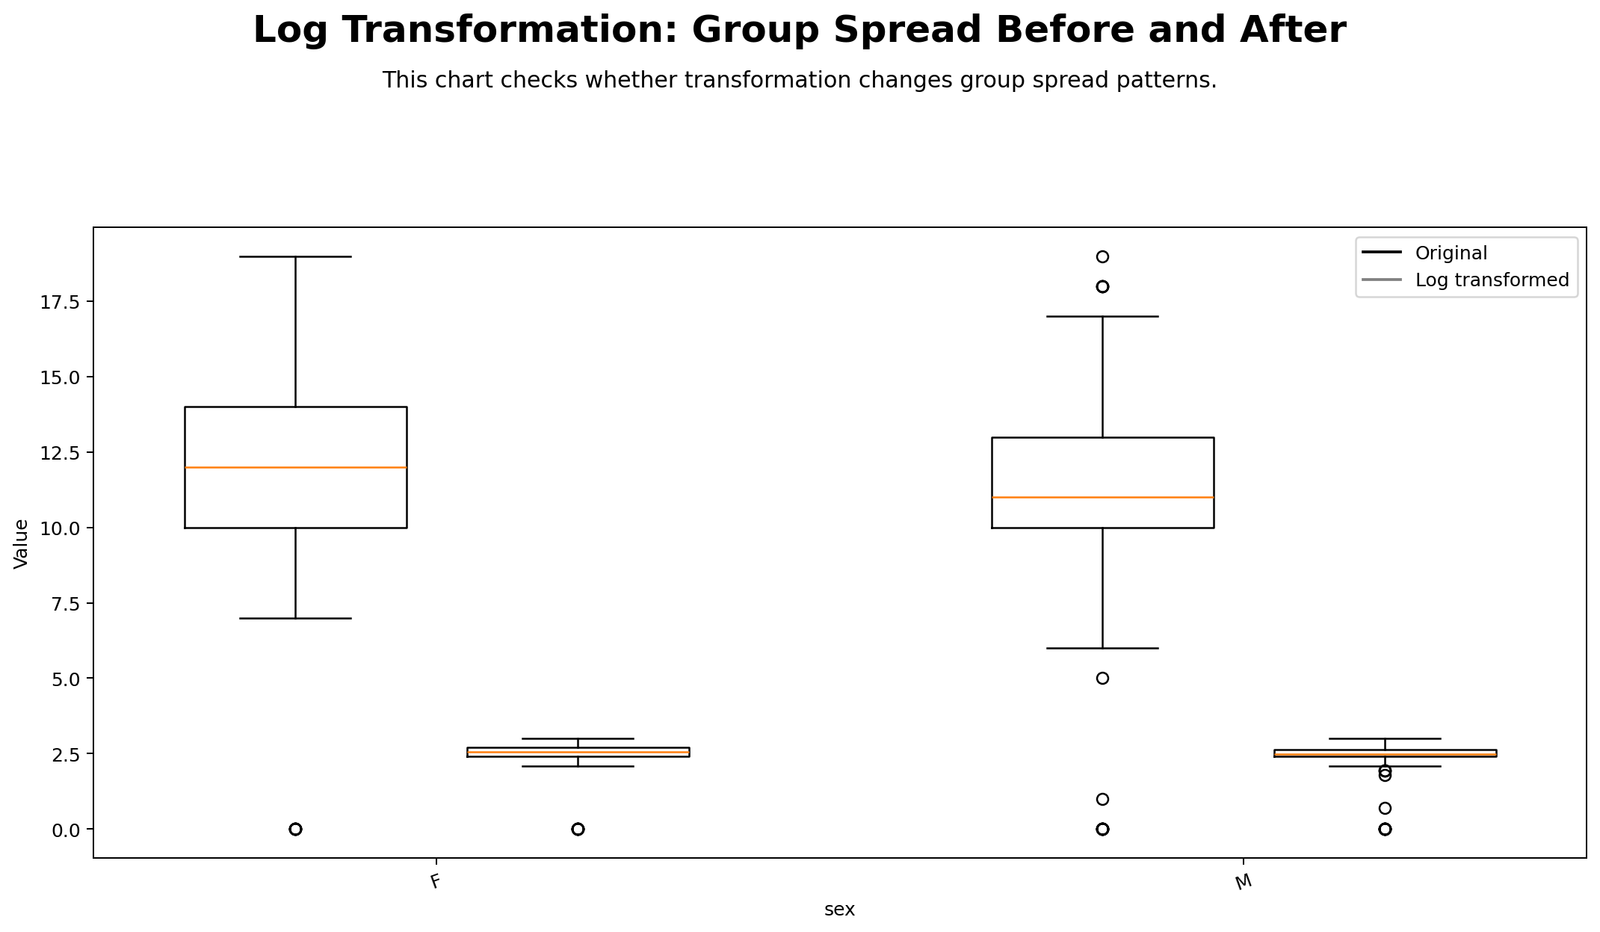
This chart supports the Log Transformation interpretation by showing the relevant distribution, comparison, diagnostic pattern, or decision evidence from the Python workflow.
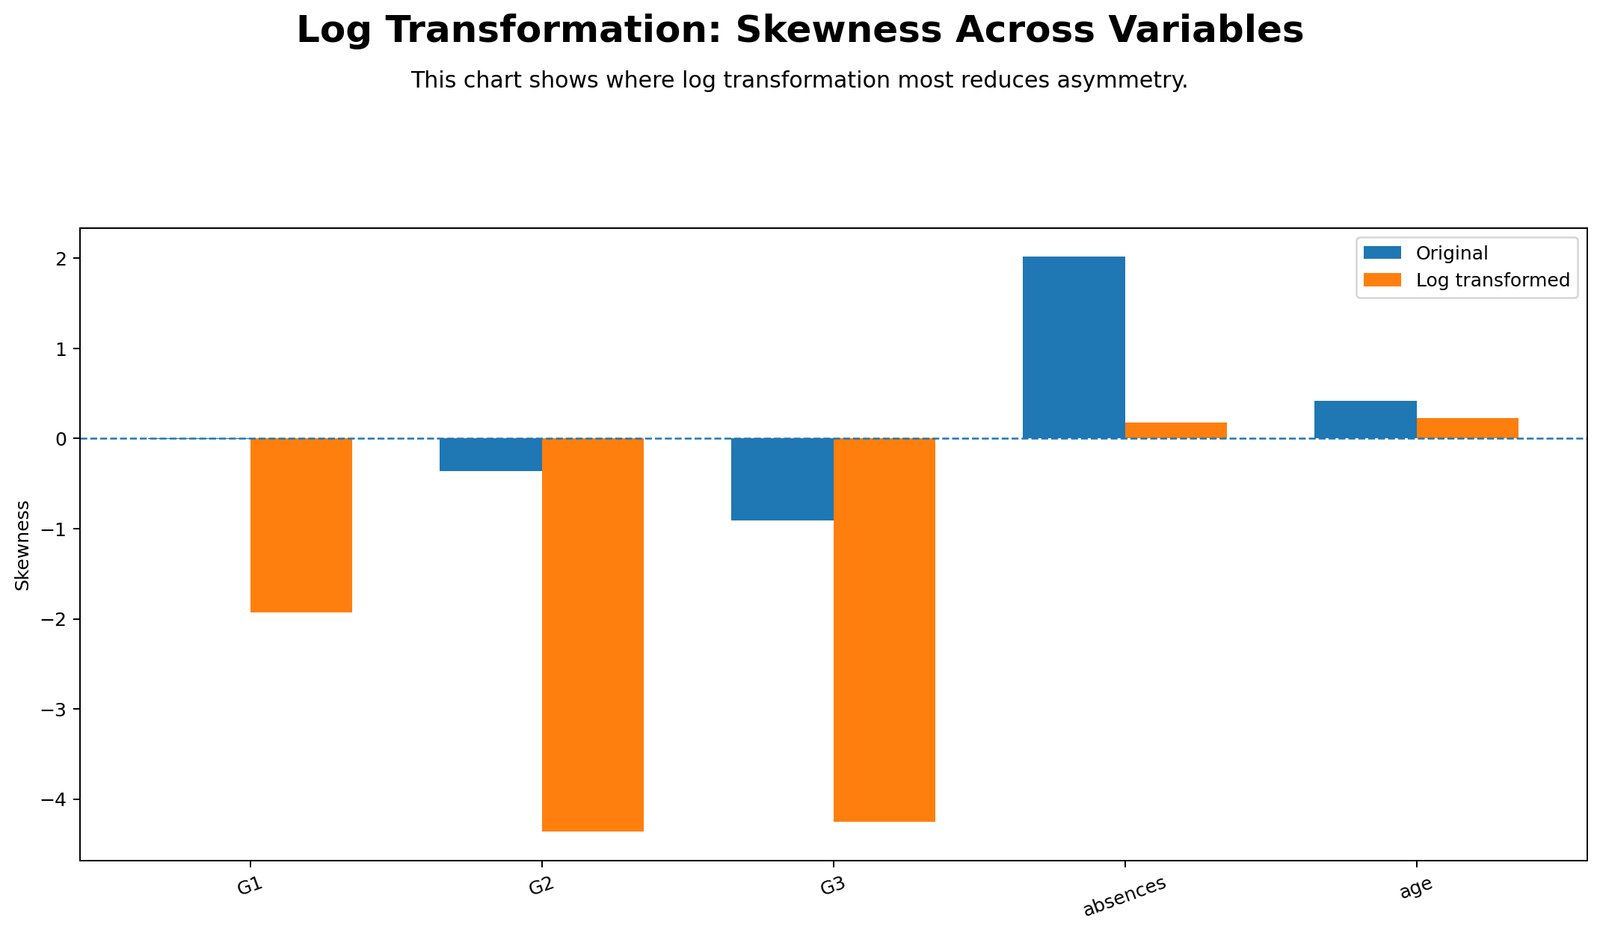
This chart supports the Log Transformation interpretation by showing the relevant distribution, comparison, diagnostic pattern, or decision evidence from the Python workflow.
R Chart-by-Chart Interpretation for Log Transformation
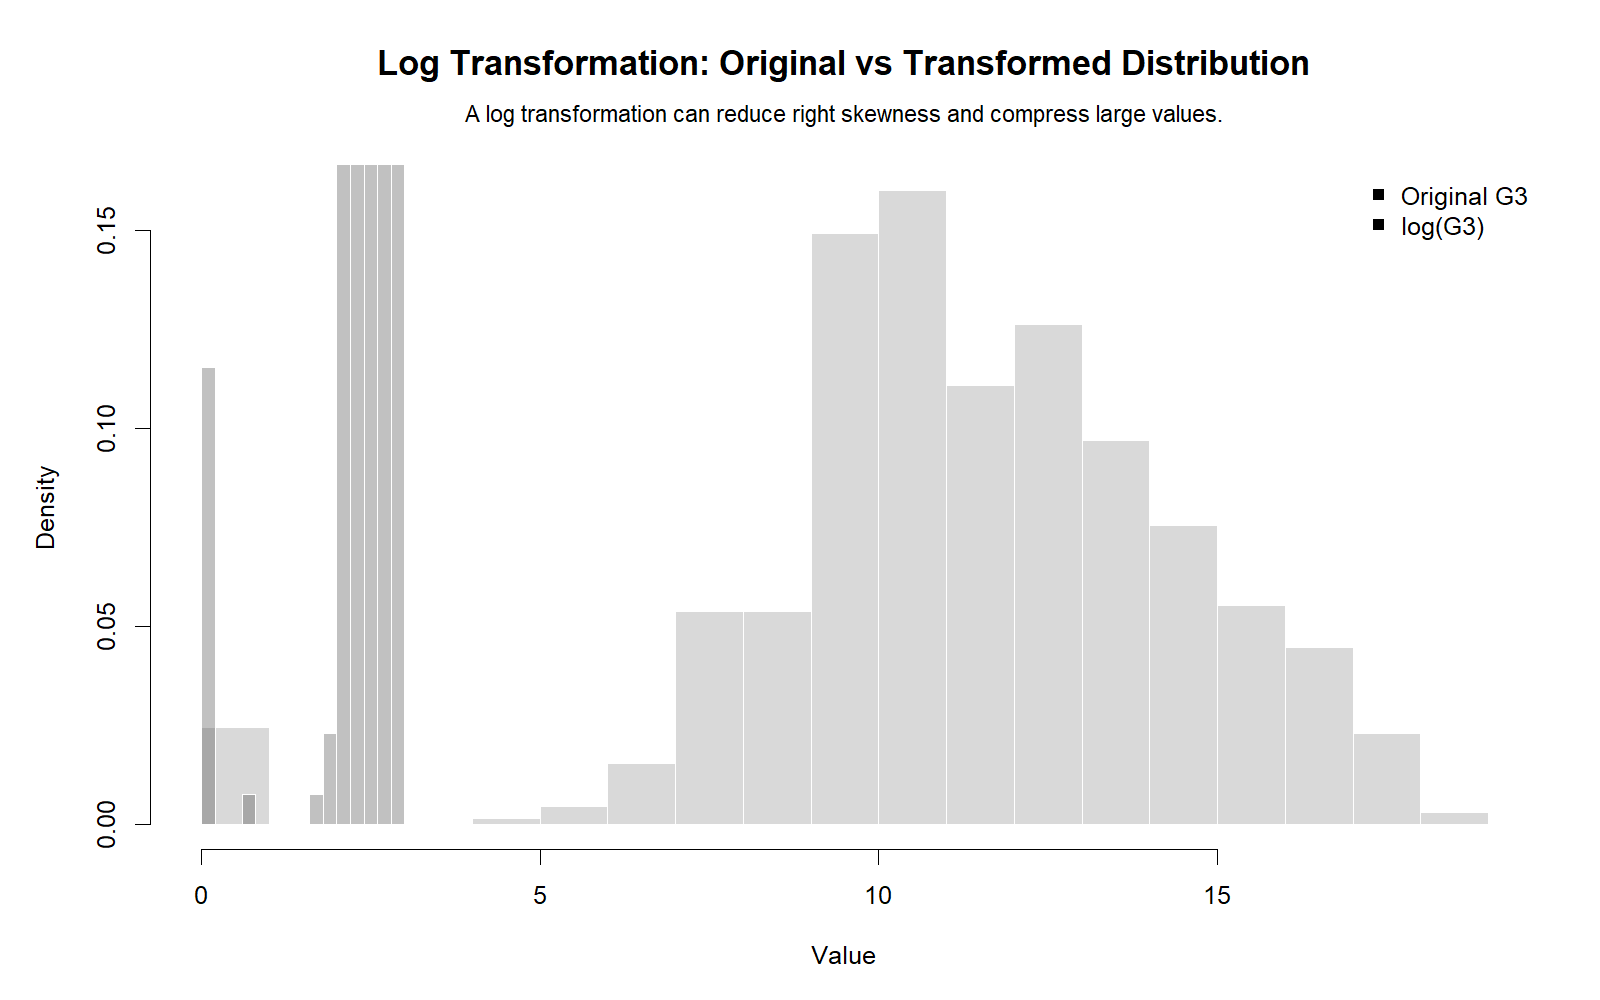
This chart supports the Log Transformation interpretation by showing the relevant distribution, comparison, diagnostic pattern, or decision evidence from the R workflow.
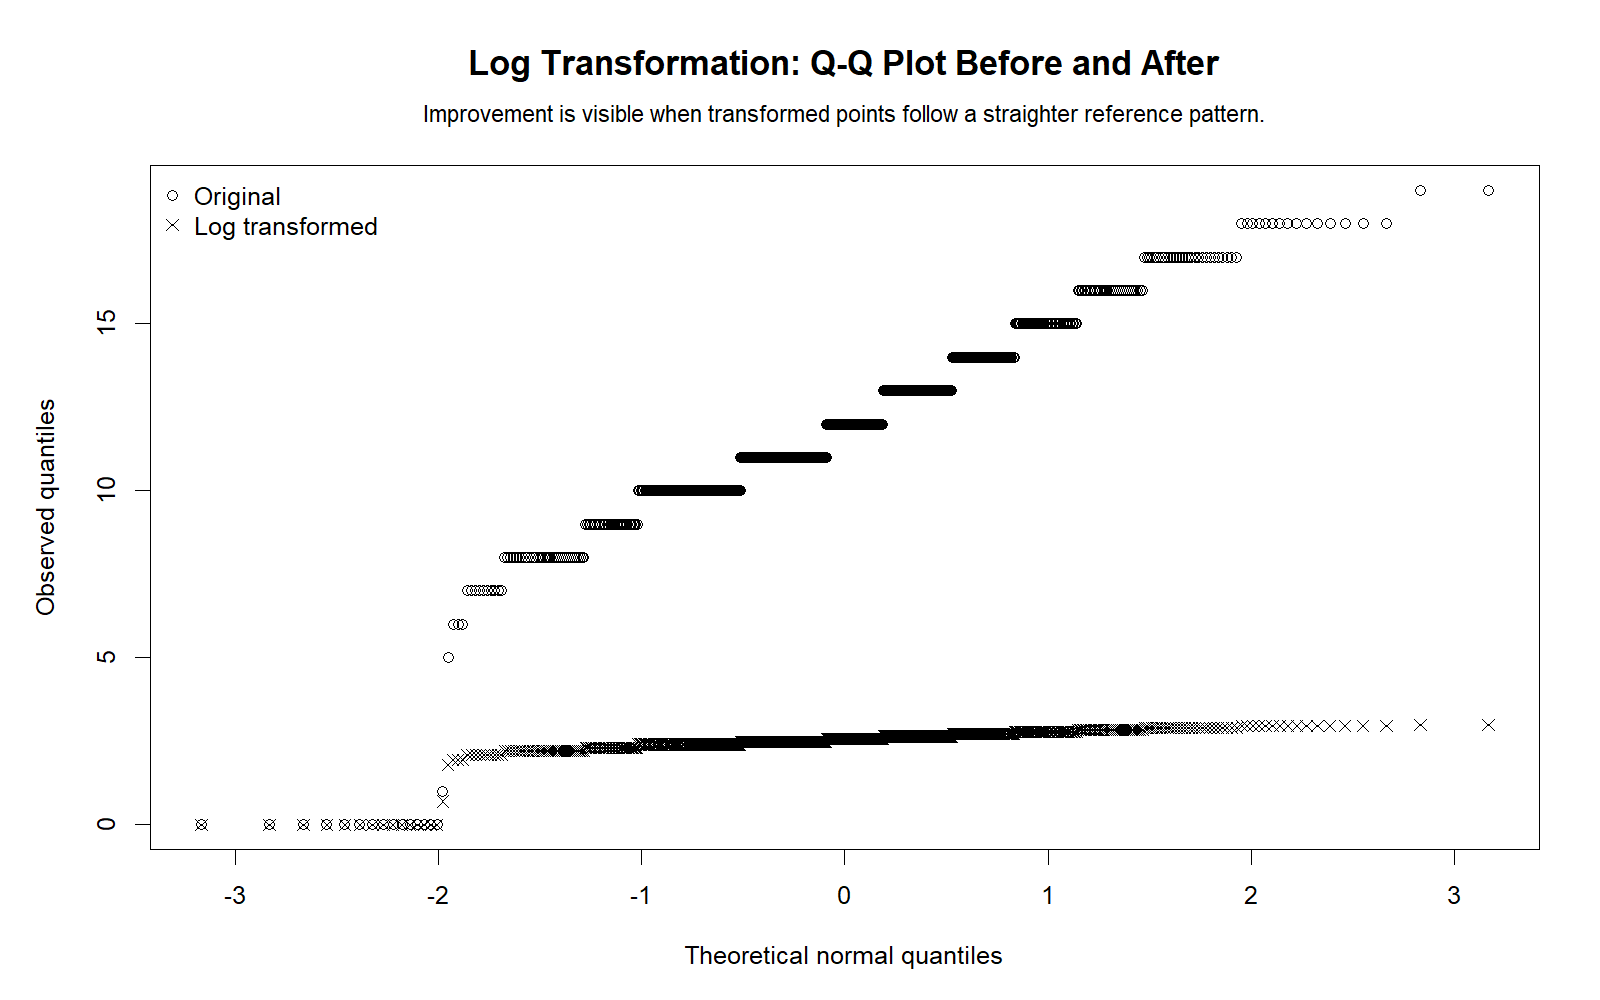
This chart supports the Log Transformation interpretation by showing the relevant distribution, comparison, diagnostic pattern, or decision evidence from the R workflow.
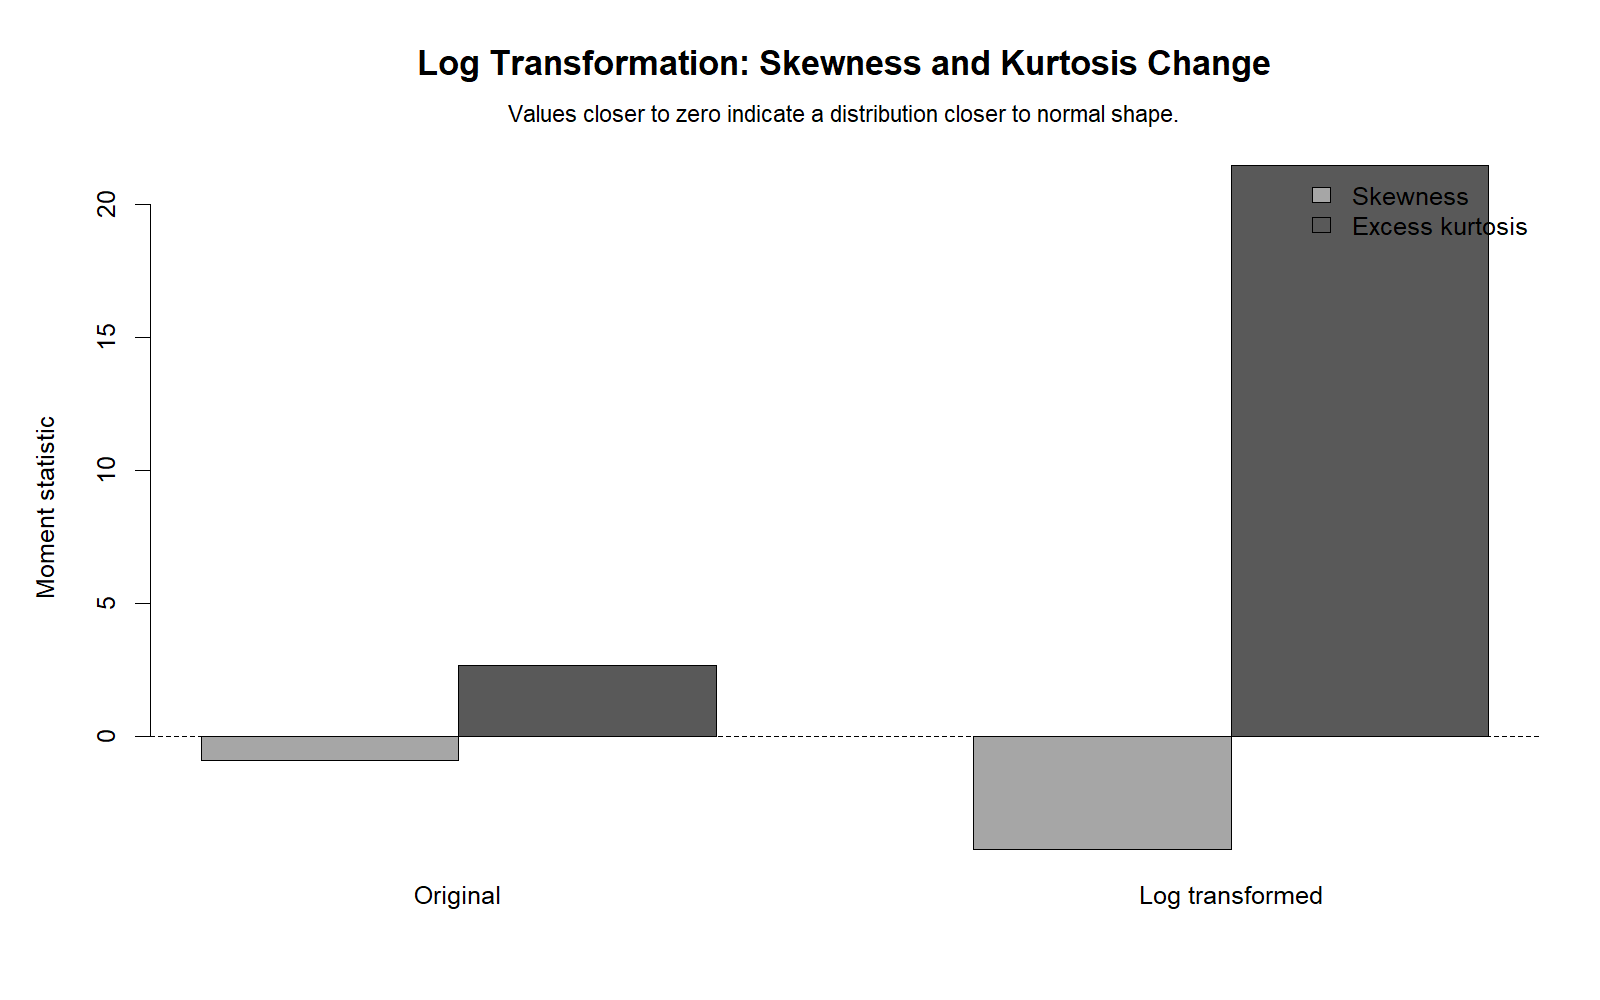
This chart supports the Log Transformation interpretation by showing the relevant distribution, comparison, diagnostic pattern, or decision evidence from the R workflow.
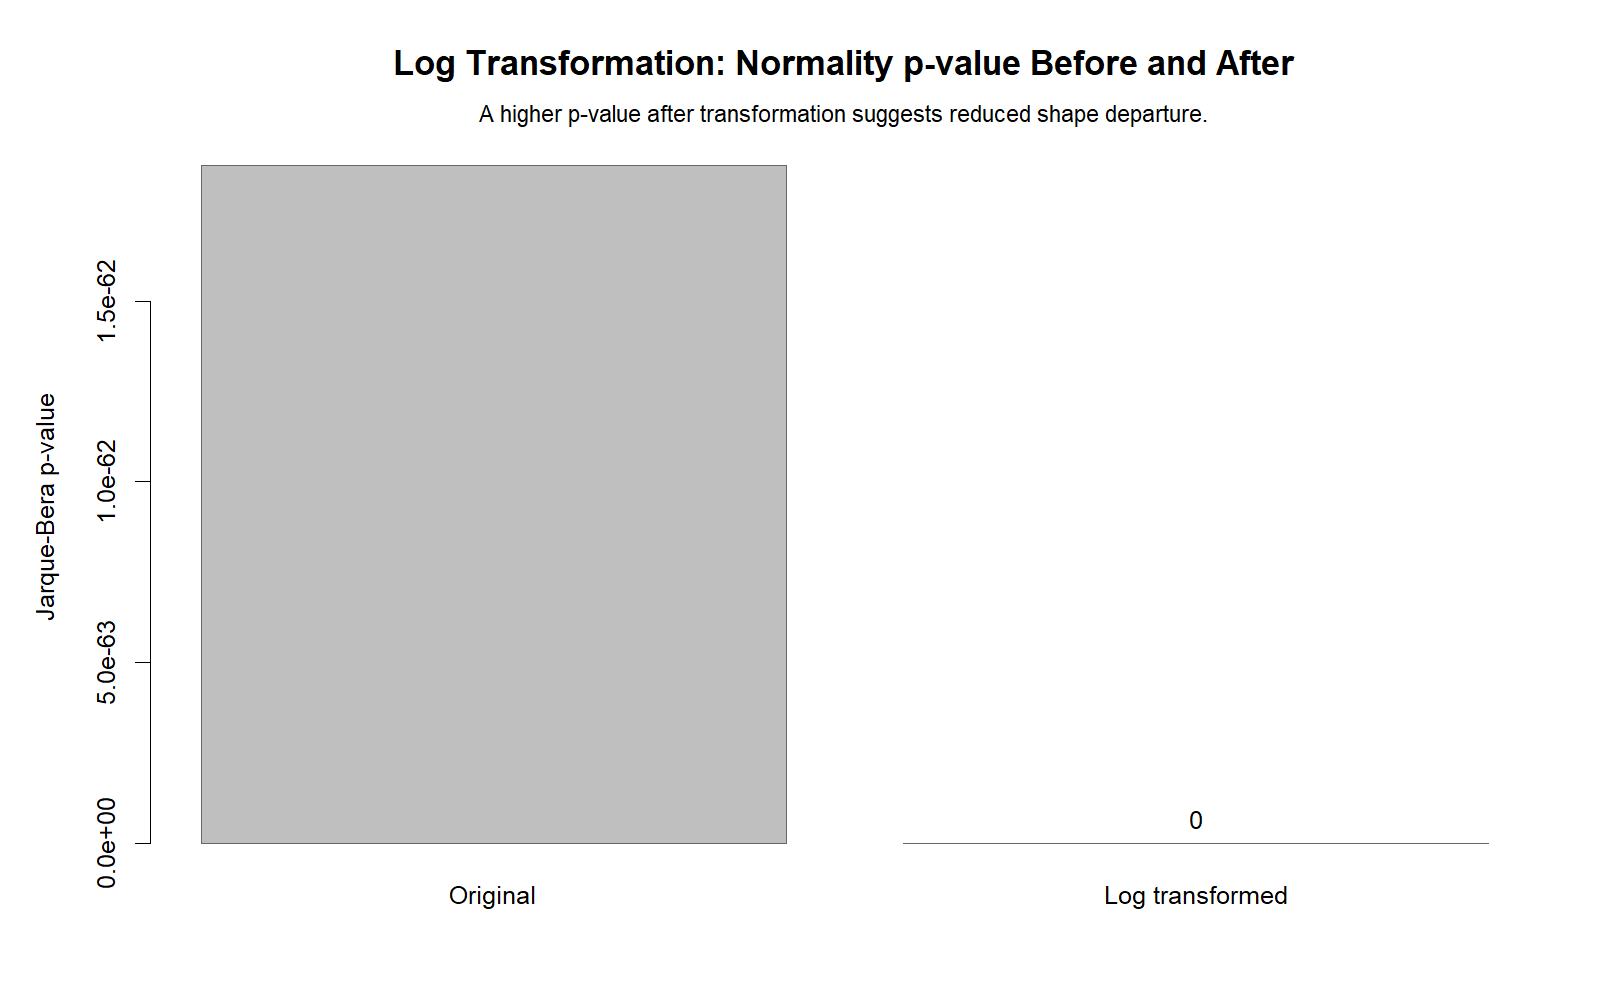
This chart supports the Log Transformation interpretation by showing the relevant distribution, comparison, diagnostic pattern, or decision evidence from the R workflow.
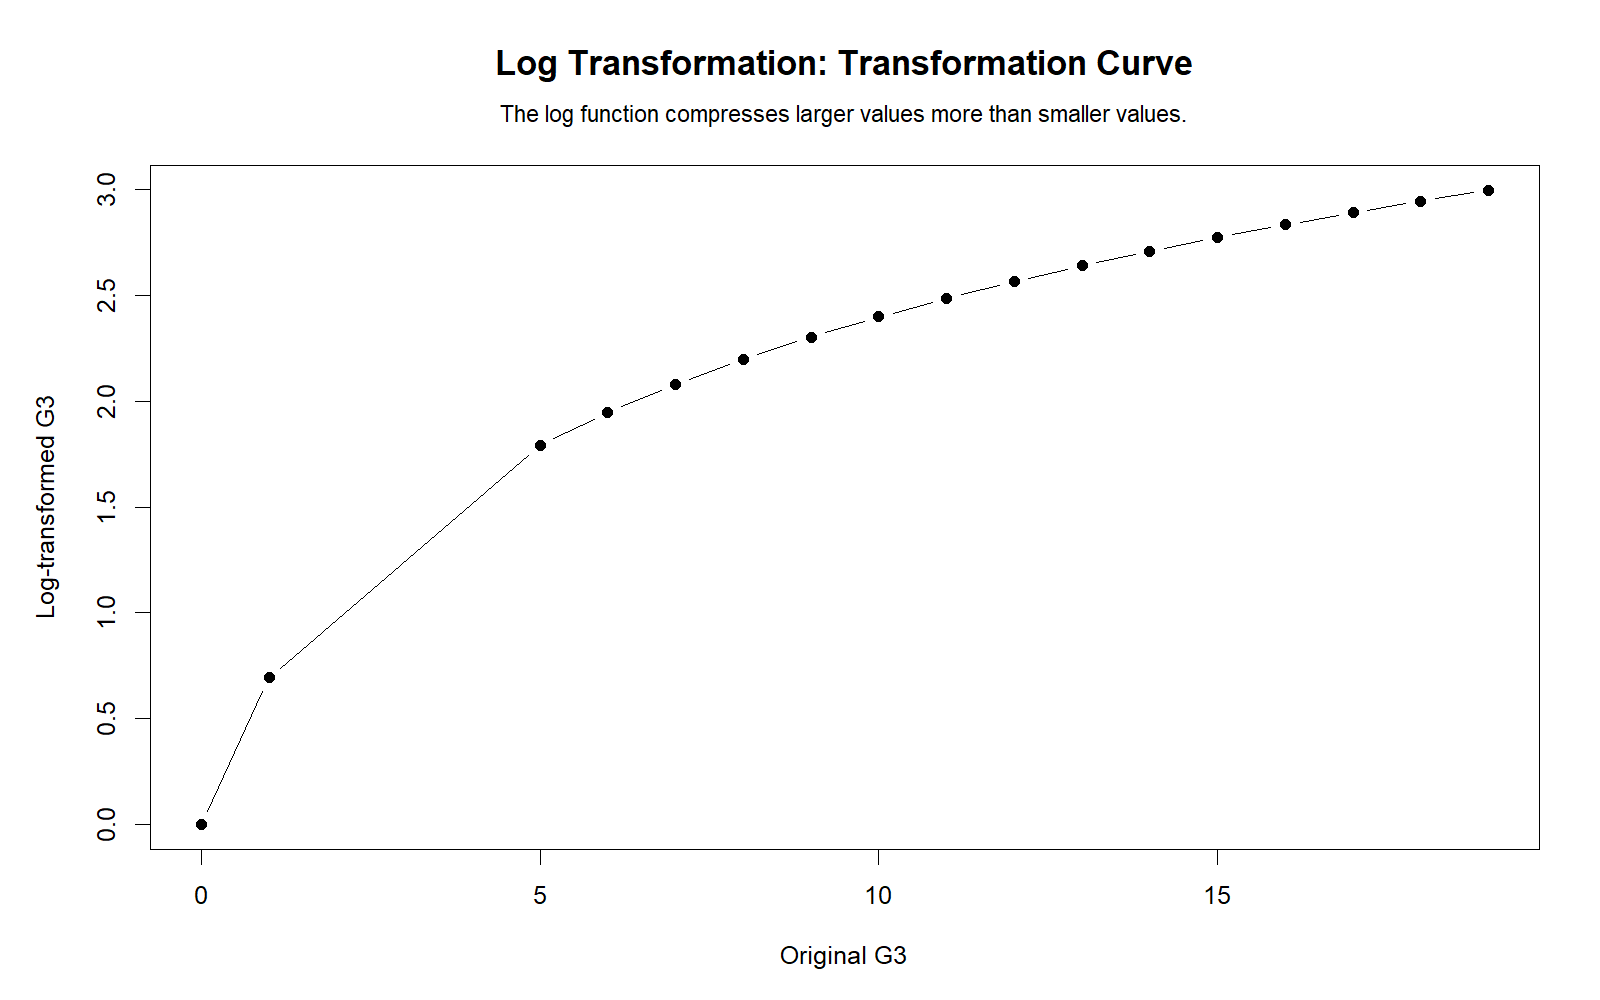
This chart supports the Log Transformation interpretation by showing the relevant distribution, comparison, diagnostic pattern, or decision evidence from the R workflow.
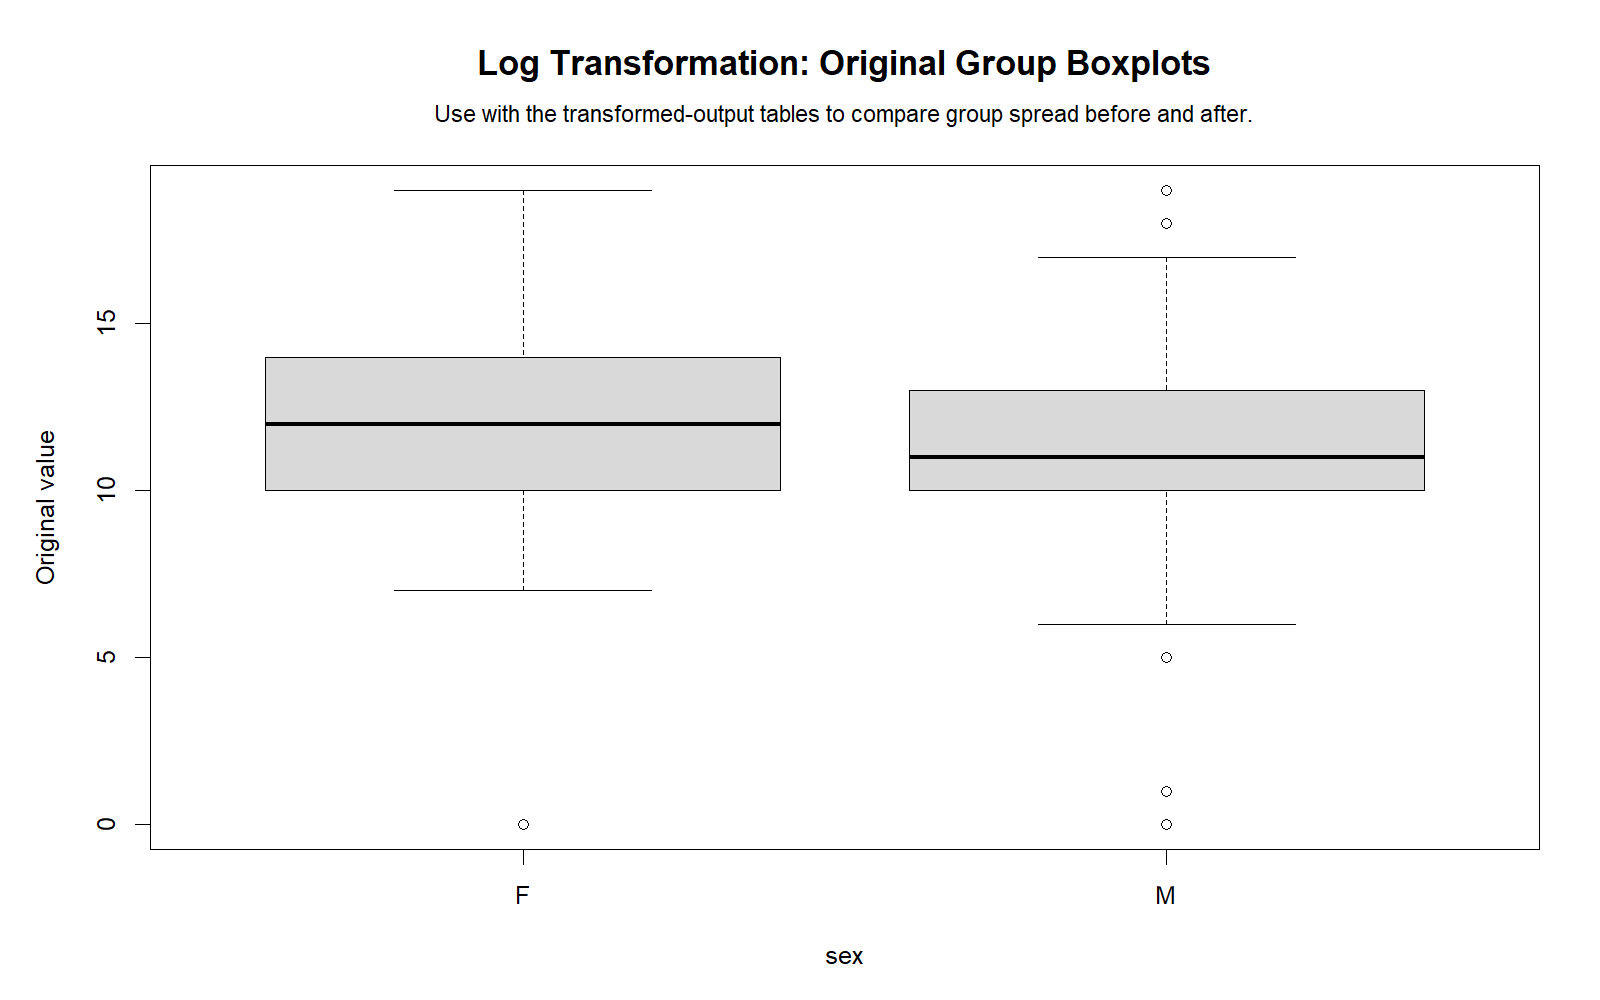
This chart supports the Log Transformation interpretation by showing the relevant distribution, comparison, diagnostic pattern, or decision evidence from the R workflow.
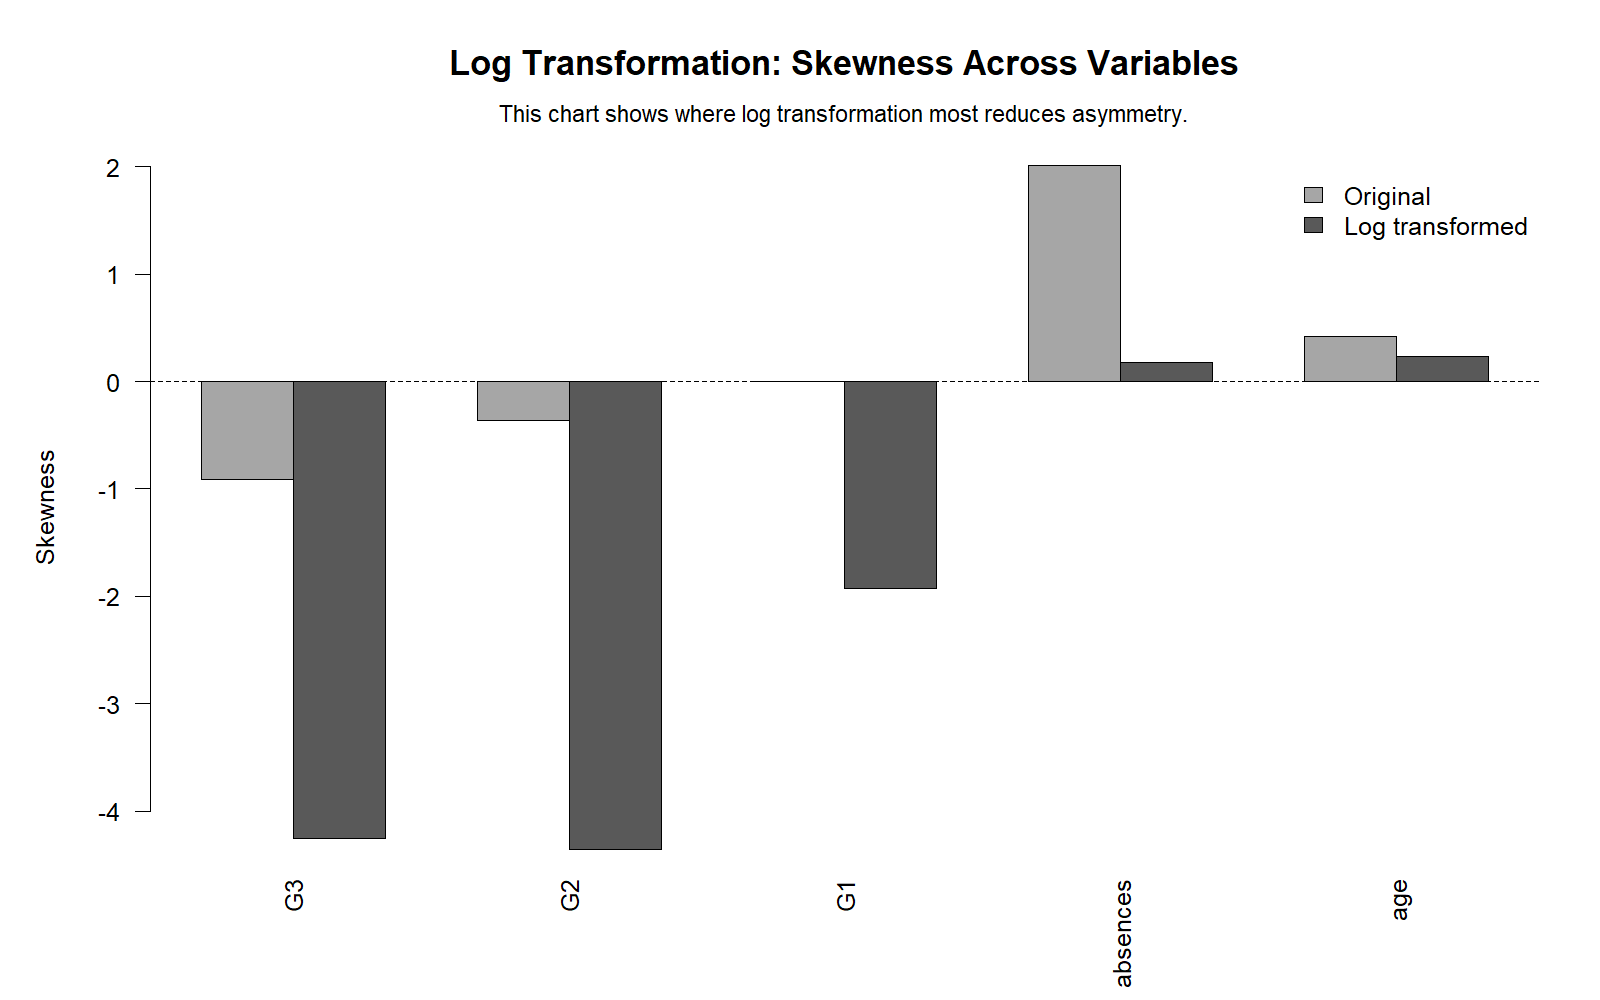
This chart supports the Log Transformation interpretation by showing the relevant distribution, comparison, diagnostic pattern, or decision evidence from the R workflow.
SPSS Workflow for Log Transformation
Open the dataset, run the relevant SPSS syntax or menu procedure, export the output to PDF, and compare the statistic, p-value, chart pattern, and written decision.
Python Workflow for Log Transformation
Use pandas for data handling, scipy or statsmodels for the statistic where needed, and matplotlib or seaborn for the diagnostic charts. The Python chart files above show the visual checks generated for this folder.
R Workflow for Log Transformation
Use base R, tidyverse, ggplot2, and the relevant statistical package for the method. The R chart files above provide an independent visual check against the Python output.
Excel Workflow for Log Transformation
Excel can support the same interpretation by organizing the dataset, applying formulas or add-ins, and checking chart patterns. For formal reports, verify Excel results against SPSS, Python, or R output.
APA and Report Writing for Log Transformation
Report the statistic, sample context, decision rule, and practical interpretation. When a p-value is involved, state whether the result is statistically significant at the chosen alpha level and avoid overstating the conclusion.
A concise reporting sentence is: The Log Transformation output was reviewed using SPSS and cross-checked with Python and R charts; the result was interpreted using the statistic, p-value or scale, and the observed chart pattern.
Downloads and Resources
SEO focus terms: log transformation, log transforming, log transformation statistics, transformation log, log-transform, transform log, log transformed data, log transformations
Related Guides
Use this guide with related Salar Cafe posts on descriptive statistics, normality tests, regression assumptions, p-values, and statistical reporting.
External References
- IBM SPSS documentation for output verification and workflow context.
- R project documentation for statistical functions and graphics.
- Python scipy, statsmodels, pandas, matplotlib, and seaborn documentation for reproducible analysis.
FAQs About Log Transformation
What does Log Transformation tell you?
It helps summarize evidence or check whether a statistical assumption, variable pattern, or model diagnostic needs attention.
Should I rely on one software package only?
No. Use the verified SPSS output as the reference and compare it with Python and R charts when available.
Can I download the output?
Yes. The resources section links the uploaded SPSS PDF and selected chart outputs for this topic.

