
KPSS Test: Formula, Illustrative Results, Charts and Interpretation
KPSS Test tests a stationarity null against a unit-root-type alternative, complementing unit-root tests with the opposite null hypothesis. This independently written guide explains the method, native MathML formula, illustrative 649-record G3 computation (not longitudinal data), assumptions, Python, R, SPSS and Excel workflows, matching charts and downloads, diagnostics, reporting, and contextual internal links.
Important: CSV row order is not a time index
These 649 observations are records of individual students, not repeated measurements over calendar time. The Student Performance dataset has no observation-date index, and original row order does not establish temporal or seasonal structure. Reported lag models, seasonal cycles, charts, holdout errors, and related tests based on that order are illustrations of computations only, not evidence of real chronological patterns, valid future forecasts, or causality.
For genuine time-series inference, obtain appropriately dated longitudinal observations, verify their frequency and missing periods, fit on earlier dates, and test on later dates. The published numeric outputs have not been independently recomputed in this editorial correction.
KPSS Test worked-example conclusion
The trend KPSS statistic was 0.333 with reported p=0.010; the ordered G3 sequence rejected trend stationarity at the reported bound.
What is KPSS Test?
The exact statistical or forecasting target.
KPSS Test tests a stationarity null against a unit-root-type alternative, complementing unit-root tests with the opposite null hypothesis. The correct interpretation begins with this target and not with a software label, attractive chart, or isolated p-value.
What the method answers
KPSS Test is used to turn a chronological research question into an explicit model, statistic, or evaluation rule. In this article the uploaded CSV contributes 649 ordered student records. Records 1–584 are used for fitting and records 585–649 form the 65-record holdout whenever forecasting is relevant.
The trend KPSS statistic was 0.333 with reported p=0.010; the ordered G3 sequence rejected trend stationarity at the reported bound.
What the method does not answer
KPSS Test does not remove the need to inspect data quality, time spacing, deterministic structure, missing periods, structural changes, residual behavior, and forecast horizon. It also does not turn predictive association into experimental causation or a nonsignificant test into proof of exact equality.
Use the method together with Augmented Dickey Fuller Test; Phillips Perron Test; ARIMA Model; SARIMA Model; Engle Granger Cointegration Test.
When should KPSS Test be used?
A research-question-first decision.
Define the target
State whether the goal is identification, estimation, diagnostics, stability, smoothing, causality, cointegration, or forecast evaluation.
Verify the index
Sort dates, resolve duplicates, and insert expected missing periods before constructing lags.
Declare frequency
The CSV has no date field. A 12-record period is used only where the supplied method assets require a repeatable computational cycle; it must not be described as calendar seasonality.
Choose specification
Fix deterministic terms, lag order, transformation, seasonal structure, and validation horizon.
Audit the output
Reconcile statistics, charts, residuals, software defaults, and matching downloads.
Uploaded student dataset for KPSS Test
A reproducible calculation from dataset(100).csv.
Data design
The source is dataset(100).csv, containing 649 student records and 33 columns. G3 final grade is the primary numeric sequence. G2 is the aligned secondary sequence for VAR, VECM, Granger-causality, and cointegration demonstrations. The original row order is preserved exactly; no synthetic dates, values, trends, or seasonal components are added.
Validation design
Records 1–584 form the training sequence. Records 585–649 form the untouched 65-record holdout. Parameter selection and transformations use training records only. The same uploaded row order is retained in Python, R, SPSS, and Excel so differences can be traced to software conventions rather than to different samples.
KPSS Test assumptions and data conditions
Non-negotiable checks before interpretation.
Condition 1
The deterministic specification—none, intercept, or trend—is chosen before interpreting the statistic.
Condition 2
Lag or bandwidth selection is documented.
Condition 3
Structural breaks are considered because they can distort unit-root conclusions.
Condition 4
The series frequency and missing periods are handled before testing.
Condition 5
The null hypothesis direction is stated explicitly.
Condition 6
Level and transformed-series conclusions are kept separate.
KPSS Test formula and notation
Rendered with browser-native MathML.
The symbols must be mapped to the actual series, time index, lag order, error, state, or system used in the analysis. Do not copy the notation without stating the frequency and parameter specification.
Formula interpretation
For KPSS Test, the equation operationalizes the purpose described above. Each lag, state, residual, difference, coefficient, or error term has a temporal meaning. The worked output is interpreted through the complete structure rather than through one coefficient in isolation.
Calculation control
Keep full precision in intermediate calculations, round only for display, and reconcile the software output with the formula. The matching Excel workbook is especially useful for checking range alignment, while Python and R support repeatable model estimation and diagnostics.
KPSS Test illustrative worked results
Exact values from the common example.
| Result field | Value | Audit note |
|---|---|---|
| KPSS statistic | 0.333 | Uploaded 649-record G3 example; retain full precision in calculations |
| p-value | 0.010 | Uploaded 649-record G3 example; retain full precision in calculations |
| Bandwidth | 12 | Uploaded 649-record G3 example; retain full precision in calculations |
| Decision | Reject trend stationarity | Uploaded 649-record G3 example; retain full precision in calculations |
KPSS Test in Python
Reproducible calculation and validation.
from statsmodels.tsa.stattools import kpss

stat, p, lags, critical = kpss(y, regression='ct', nlags='auto')
For real forecasting, first establish a meaningful date index and observation frequency, validate spacing and holdout periods, then perform chronological model fitting and residual diagnostics. This student-row example lacks those prerequisites and is illustrative only. The supplied Python charts and PDF belong only to this KPSS Test post.
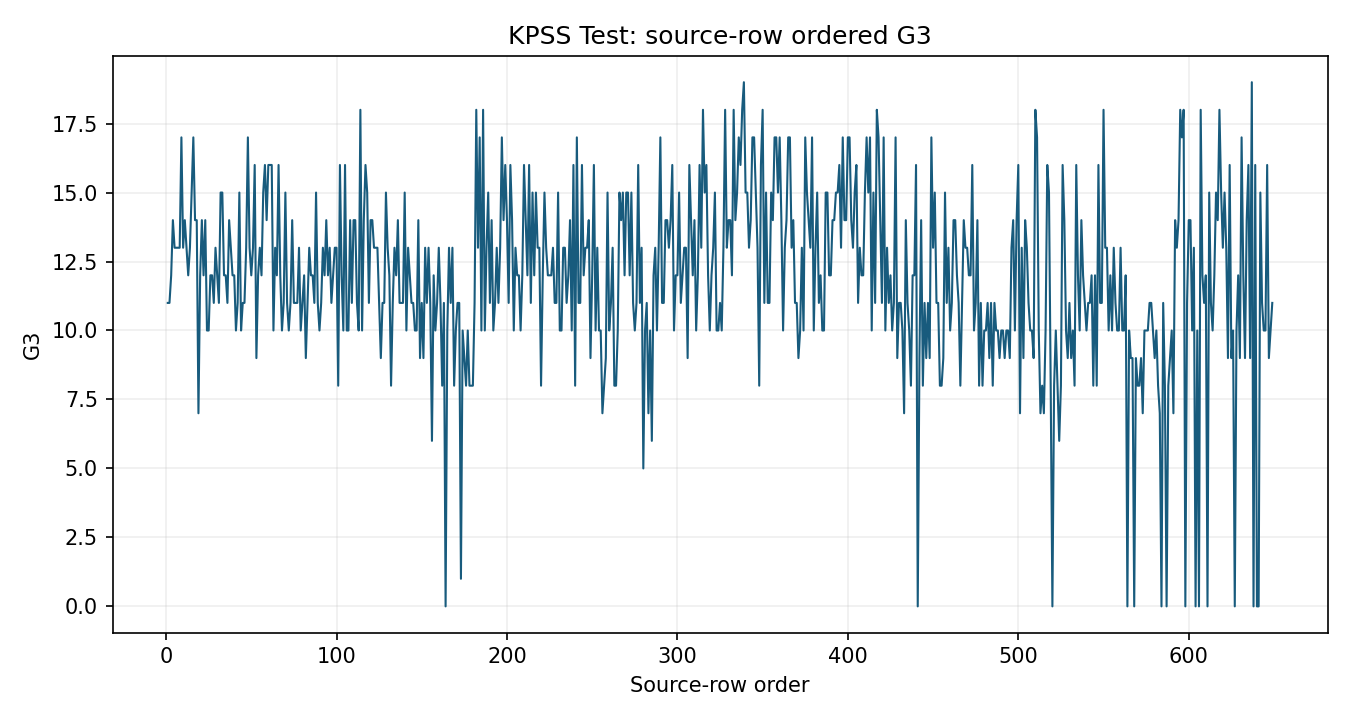
Python chart 1: KPSS Test
The Python figure for KPSS Test presents the source series and time ordering. Its file name is kpss test 01 source series. Interpret this chart with the worked statistics and the matching Python PDF; the image alone does not establish the final inference.
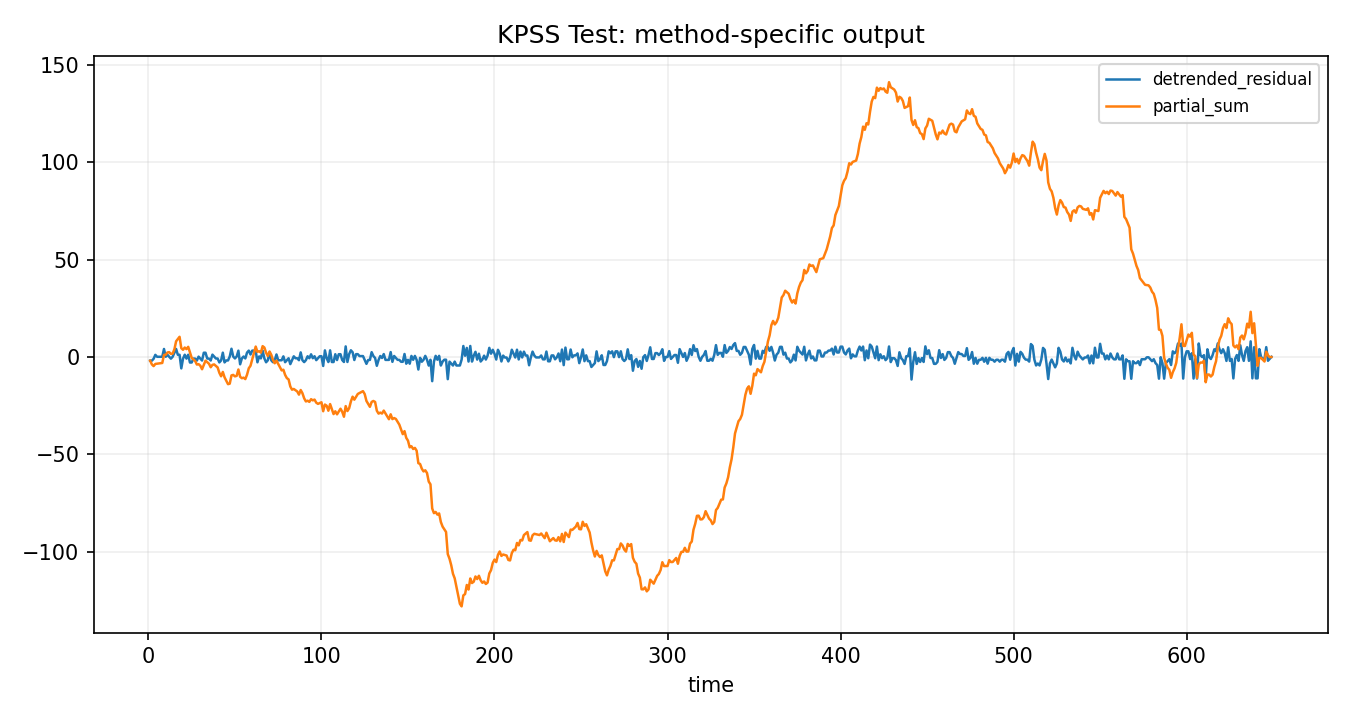
Python chart 2: KPSS Test
The Python figure for KPSS Test presents the method-specific fitted or transformed output. Its file name is kpss test 02 method output. Interpret this chart with the worked statistics and the matching Python PDF; the image alone does not establish the final inference.
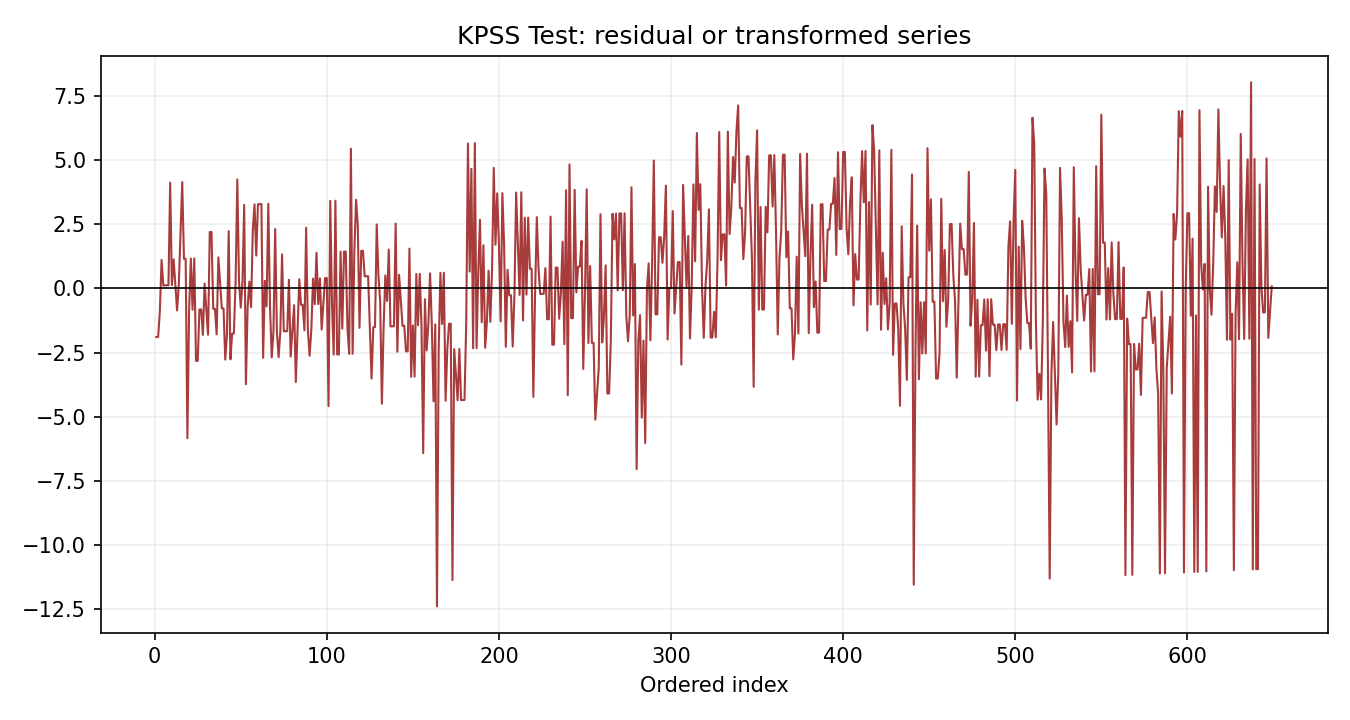
Python chart 3: KPSS Test
The Python figure for KPSS Test presents the residual path through time. Its file name is kpss test 03 residual path. Interpret this chart with the worked statistics and the matching Python PDF; the image alone does not establish the final inference.
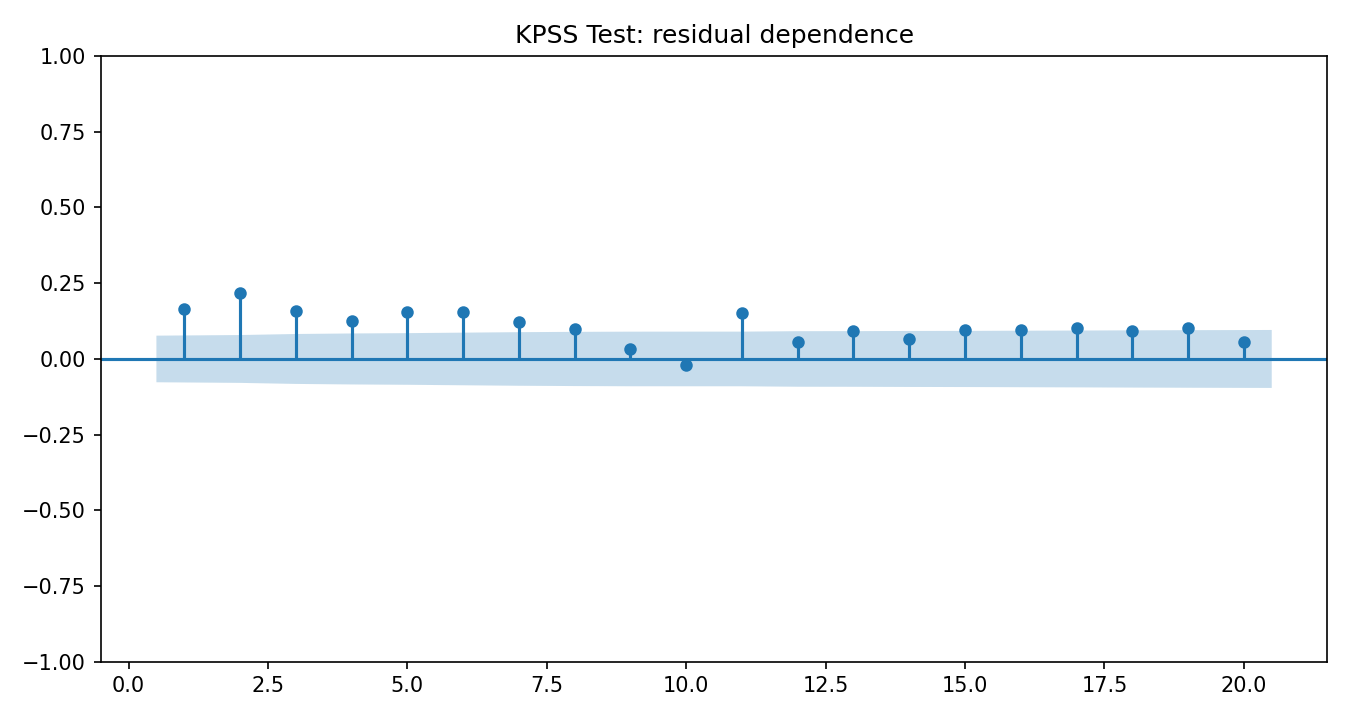
Python chart 4: KPSS Test
The Python figure for KPSS Test presents the residual autocorrelation diagnostics. Its file name is kpss test 04 residual acf. Interpret this chart with the worked statistics and the matching Python PDF; the image alone does not establish the final inference.
Python chart 5: KPSS Test
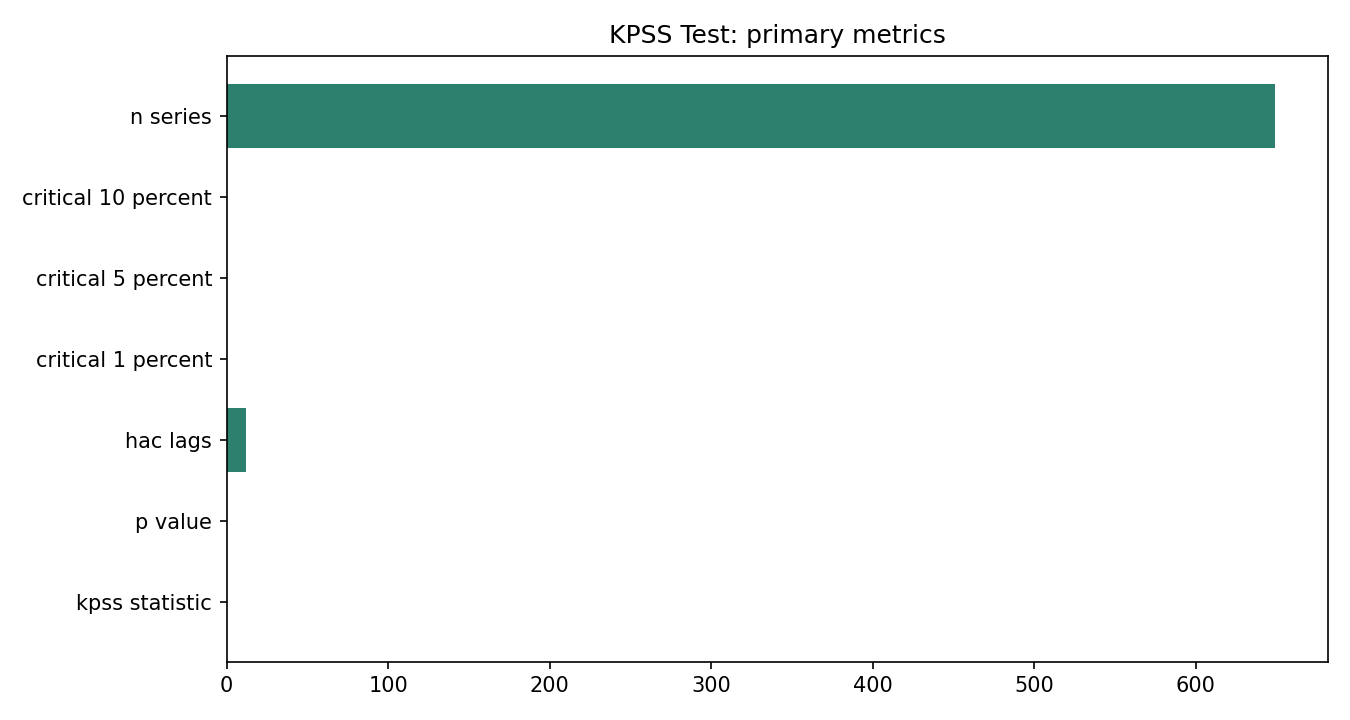
The Python figure for KPSS Test presents the primary statistics and validation metrics. Its file name is kpss test 05 primary metrics. Interpret this chart with the worked statistics and the matching Python PDF; the image alone does not establish the final inference.
KPSS Test in R
Equivalent specification with explicit frequency.
# Regress on intercept/trend, calculate cumulative residuals, and divide by a HAC variance estimate.The R workflow must use the same start date, frequency, training endpoint, lag order, deterministic structure, and forecast horizon. Reconcile default initialization, missing-value behavior, coefficient signs, and critical values before comparing numerical output with Python.
R chart 1: KPSS Test
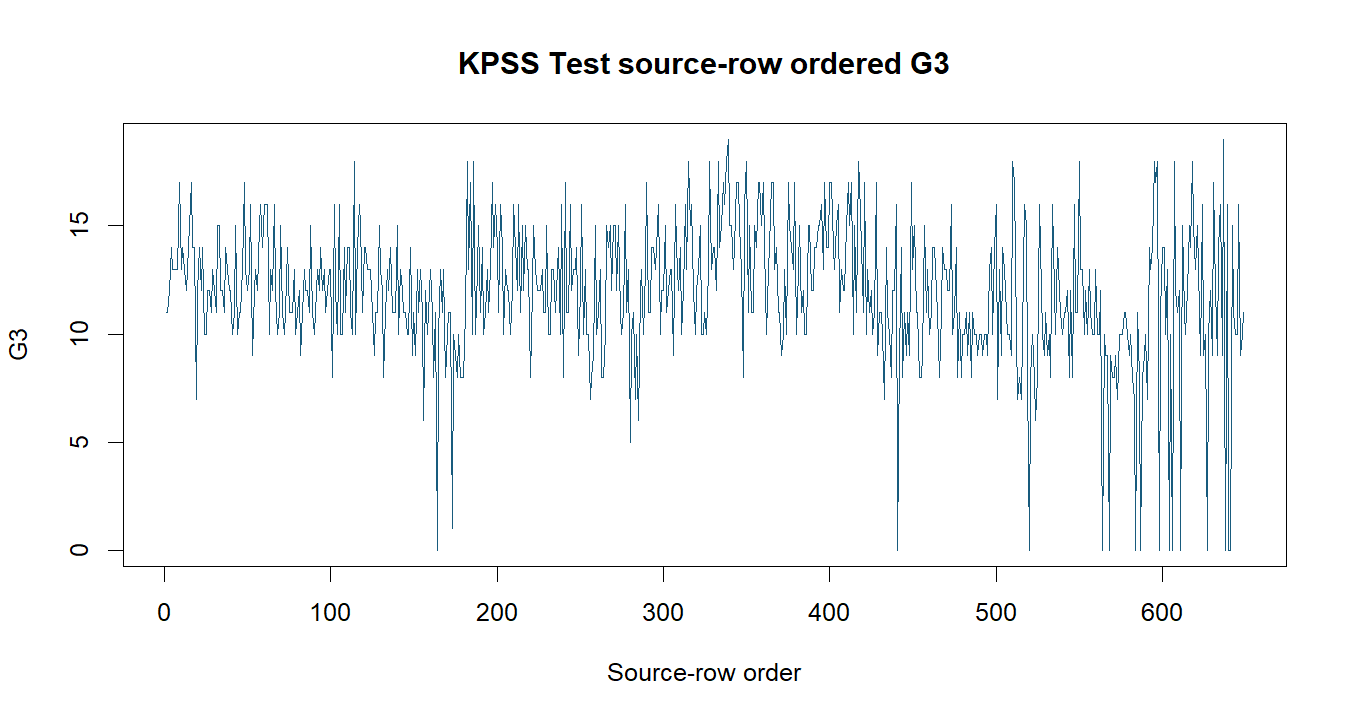
The R figure for KPSS Test presents the source series and time ordering. Its file name is kpss test 01. Interpret this chart with the worked statistics and the matching R PDF; the image alone does not establish the final inference.
R chart 2: KPSS Test
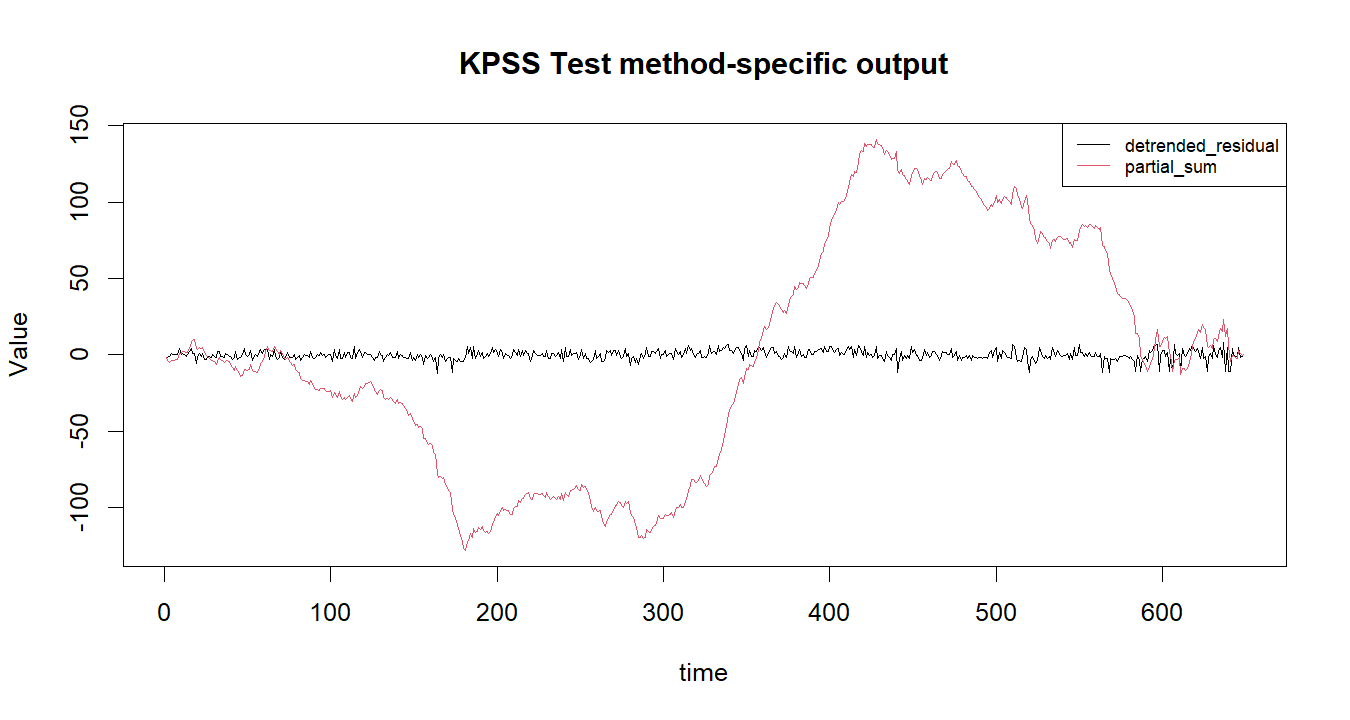
The R figure for KPSS Test presents the method-specific fitted or transformed output. Its file name is kpss test 02. Interpret this chart with the worked statistics and the matching R PDF; the image alone does not establish the final inference.
R chart 3: KPSS Test
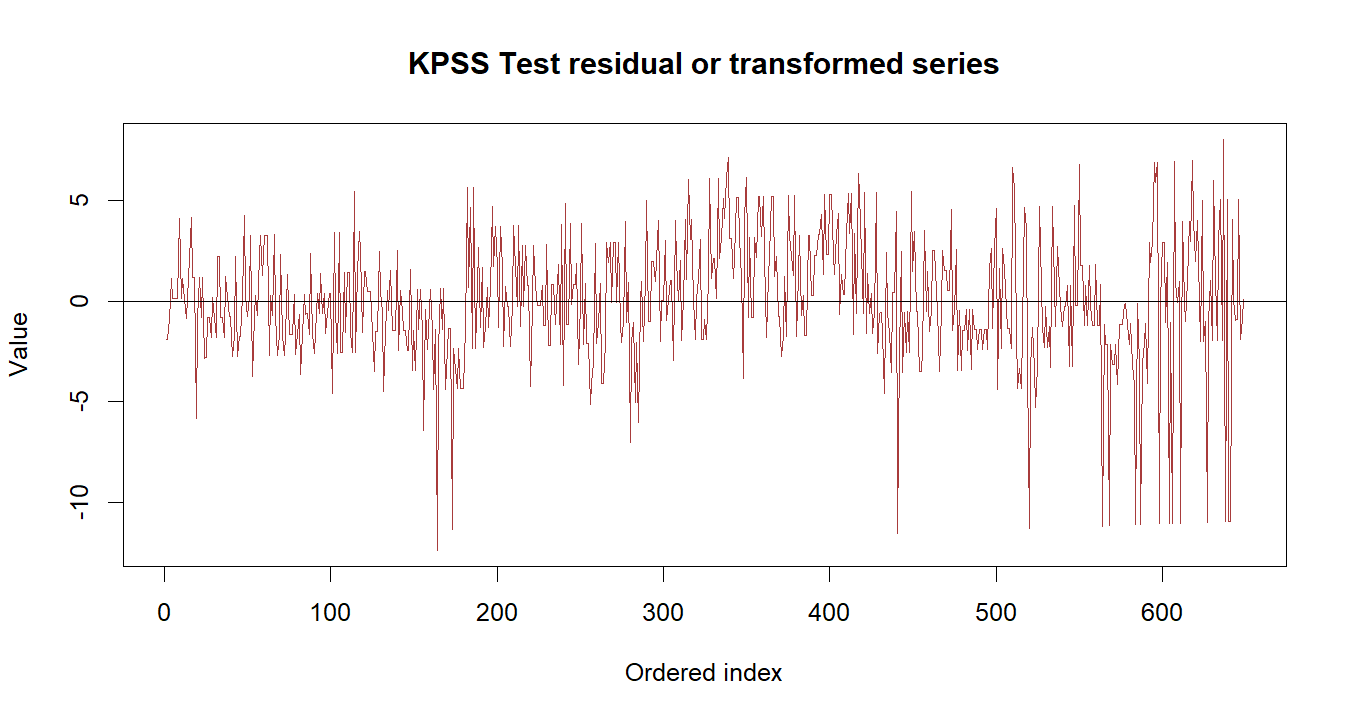
The R figure for KPSS Test presents the residual path through time. Its file name is kpss test 03. Interpret this chart with the worked statistics and the matching R PDF; the image alone does not establish the final inference.
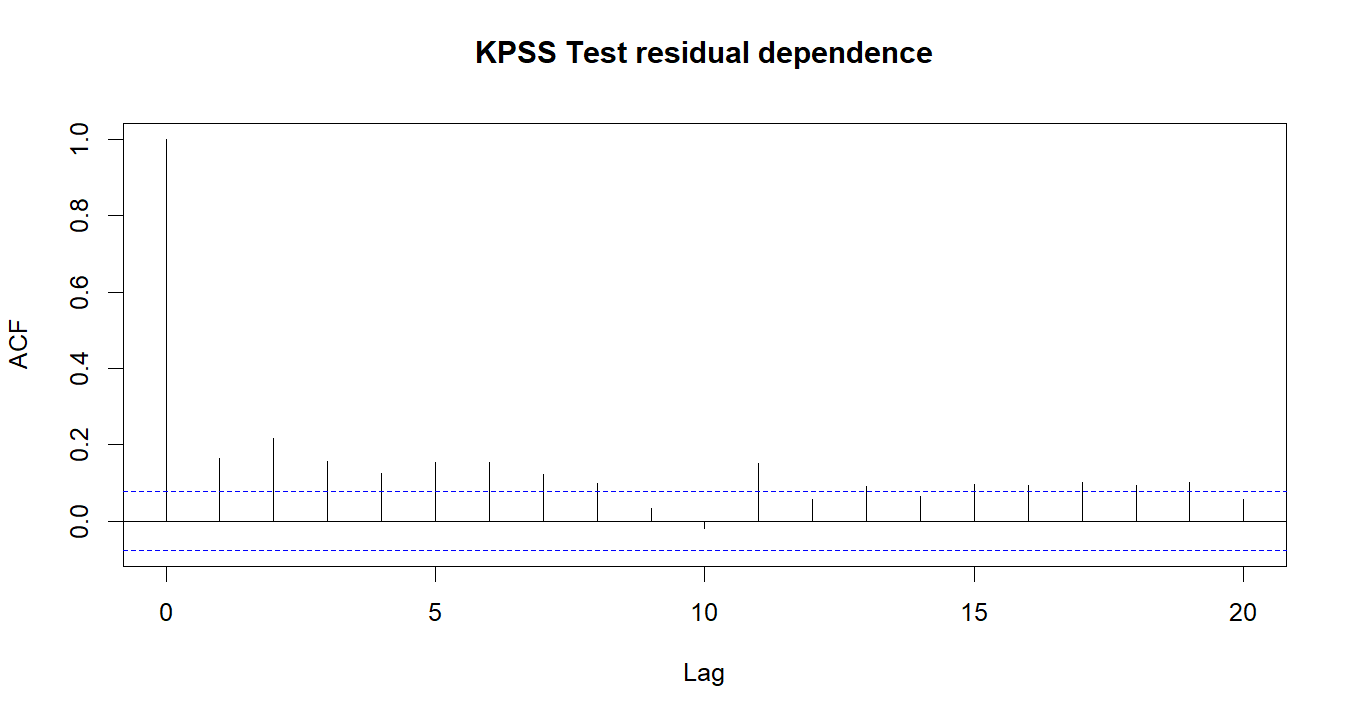
R chart 4: KPSS Test
The R figure for KPSS Test presents the residual autocorrelation diagnostics. Its file name is kpss test 04. Interpret this chart with the worked statistics and the matching R PDF; the image alone does not establish the final inference.
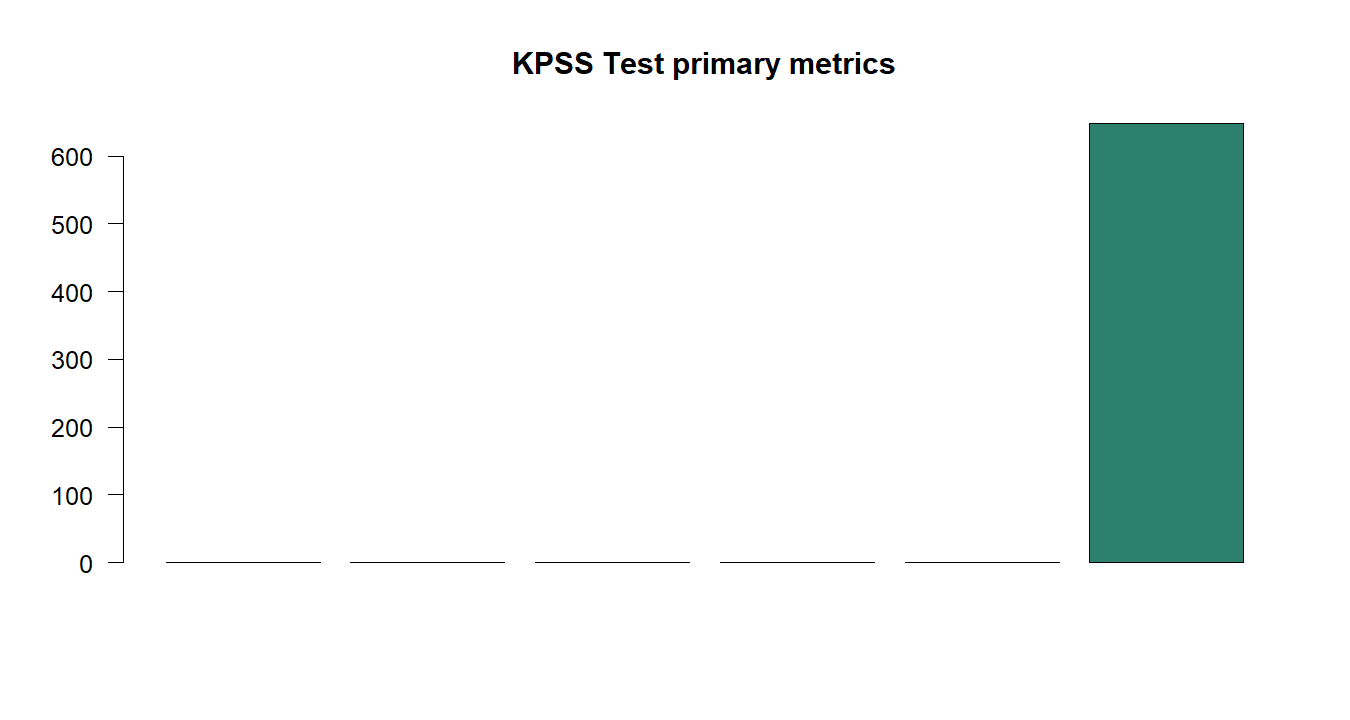
R chart 5: KPSS Test
The R figure for KPSS Test presents the primary statistics and validation metrics. Its file name is kpss test 05. Interpret this chart with the worked statistics and the matching R PDF; the image alone does not establish the final inference.
KPSS Test in SPSS
Use only procedures SPSS genuinely supports.
SPSS can prepare lags, differences, deterministic terms, and regression components, but a dedicated unit-root implementation may require validated extension syntax. Do not substitute an ordinary regression p-value for the nonstandard unit-root reference distribution.
KPSS Test in Excel
A transparent formula and range audit.
Select the null model: remove a constant for level stationarity or a constant plus a deterministic linear trend for trend stationarity. Compute its ordered residuals, cumulative residual sums, and a lag-window/HAC estimate of long-run residual variance. The KPSS statistic is the sum of squared cumulative residuals divided by the squared sample size and the long-run variance estimate. Compare it with KPSS-specific critical values; the KPSS null is stationarity, unlike the ADF/Phillips–Perron unit-root null. Ordinary regression t critical values and an ADF regression are not substitutes.
How to interpret KPSS Test charts
Each chart has a distinct technical role.
Source or input chart
Check order, missing periods, changing level, seasonality, outliers, and possible breaks before fitting. A visually attractive series is not automatically stationary or forecastable.
Method-output chart
Compare fitted and observed behavior or the method-specific transformation. Look for systematic misses, phase errors, and delayed responses rather than only visual closeness.
Residual and metric charts
Residual paths and autocorrelation show what predictable structure remains. Metric panels summarize holdout performance but must retain the horizon and units.
KPSS Test diagnostics and failure checks
Evidence that the result is usable.
Deep technical review of KPSS Test
Forty-eight topic-specific audit perspectives.
Temporal order. For KPSS Test, this review point concerns why the sequence must remain chronological and how random shuffling would leak future information. The method specifically tests a stationarity null against a unit-root-type alternative, complementing unit-root tests with the opposite null hypothesis; therefore the analyst should connect this issue to the deterministic component, nonstandard reference distribution, and opposite null directions of companion tests. In the worked example, The trend KPSS statistic was 0.333 with reported p=0.010; the ordered G3 sequence rejected trend stationarity at the reported bound. That numerical result is useful only when the date index, training endpoint, and declared frequency remain unchanged. A defensible audit records the choice before seeing the final forecast error or p-value, checks the matching chart and software output, and explains whether the conclusion would change under a reasonable alternative. Related guidance appears in Augmented Dickey Fuller Test, Phillips Perron Test, ARIMA Model, but those methods answer different parts of the identification, estimation, diagnostic, or validation problem.
Frequency declaration. For KPSS Test, this review point concerns how monthly, quarterly, daily, or irregular spacing changes lag meaning and seasonal interpretation. The method specifically tests a stationarity null against a unit-root-type alternative, complementing unit-root tests with the opposite null hypothesis; therefore the analyst should connect this issue to the deterministic component, nonstandard reference distribution, and opposite null directions of companion tests. In the worked example, The trend KPSS statistic was 0.333 with reported p=0.010; the ordered G3 sequence rejected trend stationarity at the reported bound. That numerical result is useful only when the date index, training endpoint, and declared frequency remain unchanged. A defensible audit records the choice before seeing the final forecast error or p-value, checks the matching chart and software output, and explains whether the conclusion would change under a reasonable alternative. Related guidance appears in Augmented Dickey Fuller Test, Phillips Perron Test, ARIMA Model, but those methods answer different parts of the identification, estimation, diagnostic, or validation problem.
Missing periods. For KPSS Test, this review point concerns how absent timestamps differ from observed zero values and how each should be represented. The method specifically tests a stationarity null against a unit-root-type alternative, complementing unit-root tests with the opposite null hypothesis; therefore the analyst should connect this issue to the deterministic component, nonstandard reference distribution, and opposite null directions of companion tests. In the worked example, The trend KPSS statistic was 0.333 with reported p=0.010; the ordered G3 sequence rejected trend stationarity at the reported bound. That numerical result is useful only when the date index, training endpoint, and declared frequency remain unchanged. A defensible audit records the choice before seeing the final forecast error or p-value, checks the matching chart and software output, and explains whether the conclusion would change under a reasonable alternative. Related guidance appears in Augmented Dickey Fuller Test, Phillips Perron Test, ARIMA Model, but those methods answer different parts of the identification, estimation, diagnostic, or validation problem.
Duplicate timestamps. For KPSS Test, this review point concerns how multiple records at one time point require an explicit aggregation or disaggregation rule. The method specifically tests a stationarity null against a unit-root-type alternative, complementing unit-root tests with the opposite null hypothesis; therefore the analyst should connect this issue to the deterministic component, nonstandard reference distribution, and opposite null directions of companion tests. In the worked example, The trend KPSS statistic was 0.333 with reported p=0.010; the ordered G3 sequence rejected trend stationarity at the reported bound. That numerical result is useful only when the date index, training endpoint, and declared frequency remain unchanged. A defensible audit records the choice before seeing the final forecast error or p-value, checks the matching chart and software output, and explains whether the conclusion would change under a reasonable alternative. Related guidance appears in Augmented Dickey Fuller Test, Phillips Perron Test, ARIMA Model, but those methods answer different parts of the identification, estimation, diagnostic, or validation problem.
Units and scaling. For KPSS Test, this review point concerns how coefficients and error summaries inherit the outcome scale and how transformations alter interpretation. The method specifically tests a stationarity null against a unit-root-type alternative, complementing unit-root tests with the opposite null hypothesis; therefore the analyst should connect this issue to the deterministic component, nonstandard reference distribution, and opposite null directions of companion tests. In the worked example, The trend KPSS statistic was 0.333 with reported p=0.010; the ordered G3 sequence rejected trend stationarity at the reported bound. That numerical result is useful only when the date index, training endpoint, and declared frequency remain unchanged. A defensible audit records the choice before seeing the final forecast error or p-value, checks the matching chart and software output, and explains whether the conclusion would change under a reasonable alternative. Related guidance appears in Augmented Dickey Fuller Test, Phillips Perron Test, ARIMA Model, but those methods answer different parts of the identification, estimation, diagnostic, or validation problem.
Log transformation. For KPSS Test, this review point concerns when multiplicative growth or variance stabilization supports a log scale and when zeros make it unsuitable. The method specifically tests a stationarity null against a unit-root-type alternative, complementing unit-root tests with the opposite null hypothesis; therefore the analyst should connect this issue to the deterministic component, nonstandard reference distribution, and opposite null directions of companion tests. In the worked example, The trend KPSS statistic was 0.333 with reported p=0.010; the ordered G3 sequence rejected trend stationarity at the reported bound. That numerical result is useful only when the date index, training endpoint, and declared frequency remain unchanged. A defensible audit records the choice before seeing the final forecast error or p-value, checks the matching chart and software output, and explains whether the conclusion would change under a reasonable alternative. Related guidance appears in Augmented Dickey Fuller Test, Phillips Perron Test, ARIMA Model, but those methods answer different parts of the identification, estimation, diagnostic, or validation problem.
Differencing. For KPSS Test, this review point concerns how regular and seasonal differences remove stochastic trends but also change the target being modeled. The method specifically tests a stationarity null against a unit-root-type alternative, complementing unit-root tests with the opposite null hypothesis; therefore the analyst should connect this issue to the deterministic component, nonstandard reference distribution, and opposite null directions of companion tests. In the worked example, The trend KPSS statistic was 0.333 with reported p=0.010; the ordered G3 sequence rejected trend stationarity at the reported bound. That numerical result is useful only when the date index, training endpoint, and declared frequency remain unchanged. A defensible audit records the choice before seeing the final forecast error or p-value, checks the matching chart and software output, and explains whether the conclusion would change under a reasonable alternative. Related guidance appears in Augmented Dickey Fuller Test, Phillips Perron Test, ARIMA Model, but those methods answer different parts of the identification, estimation, diagnostic, or validation problem.
Deterministic trend. For KPSS Test, this review point concerns why an intercept, time trend, or seasonal dummies must reflect the scientific specification. The method specifically tests a stationarity null against a unit-root-type alternative, complementing unit-root tests with the opposite null hypothesis; therefore the analyst should connect this issue to the deterministic component, nonstandard reference distribution, and opposite null directions of companion tests. In the worked example, The trend KPSS statistic was 0.333 with reported p=0.010; the ordered G3 sequence rejected trend stationarity at the reported bound. That numerical result is useful only when the date index, training endpoint, and declared frequency remain unchanged. A defensible audit records the choice before seeing the final forecast error or p-value, checks the matching chart and software output, and explains whether the conclusion would change under a reasonable alternative. Related guidance appears in Augmented Dickey Fuller Test, Phillips Perron Test, ARIMA Model, but those methods answer different parts of the identification, estimation, diagnostic, or validation problem.
Seasonal period. For KPSS Test, this review point concerns how a period of 12 for monthly data differs from a vague visual cycle and must be declared before estimation. The method specifically tests a stationarity null against a unit-root-type alternative, complementing unit-root tests with the opposite null hypothesis; therefore the analyst should connect this issue to the deterministic component, nonstandard reference distribution, and opposite null directions of companion tests. In the worked example, The trend KPSS statistic was 0.333 with reported p=0.010; the ordered G3 sequence rejected trend stationarity at the reported bound. That numerical result is useful only when the date index, training endpoint, and declared frequency remain unchanged. A defensible audit records the choice before seeing the final forecast error or p-value, checks the matching chart and software output, and explains whether the conclusion would change under a reasonable alternative. Related guidance appears in Augmented Dickey Fuller Test, Phillips Perron Test, ARIMA Model, but those methods answer different parts of the identification, estimation, diagnostic, or validation problem.
Lag order. For KPSS Test, this review point concerns how information criteria, domain timing, residual diagnostics, and sample size jointly constrain lag selection. The method specifically tests a stationarity null against a unit-root-type alternative, complementing unit-root tests with the opposite null hypothesis; therefore the analyst should connect this issue to the deterministic component, nonstandard reference distribution, and opposite null directions of companion tests. In the worked example, The trend KPSS statistic was 0.333 with reported p=0.010; the ordered G3 sequence rejected trend stationarity at the reported bound. That numerical result is useful only when the date index, training endpoint, and declared frequency remain unchanged. A defensible audit records the choice before seeing the final forecast error or p-value, checks the matching chart and software output, and explains whether the conclusion would change under a reasonable alternative. Related guidance appears in Augmented Dickey Fuller Test, Phillips Perron Test, ARIMA Model, but those methods answer different parts of the identification, estimation, diagnostic, or validation problem.
Parameter signs. For KPSS Test, this review point concerns how positive and negative coefficients affect persistence, correction, oscillation, or response direction. The method specifically tests a stationarity null against a unit-root-type alternative, complementing unit-root tests with the opposite null hypothesis; therefore the analyst should connect this issue to the deterministic component, nonstandard reference distribution, and opposite null directions of companion tests. In the worked example, The trend KPSS statistic was 0.333 with reported p=0.010; the ordered G3 sequence rejected trend stationarity at the reported bound. That numerical result is useful only when the date index, training endpoint, and declared frequency remain unchanged. A defensible audit records the choice before seeing the final forecast error or p-value, checks the matching chart and software output, and explains whether the conclusion would change under a reasonable alternative. Related guidance appears in Augmented Dickey Fuller Test, Phillips Perron Test, ARIMA Model, but those methods answer different parts of the identification, estimation, diagnostic, or validation problem.
Parameter magnitude. For KPSS Test, this review point concerns why a numerically large coefficient is not automatically important without considering the full dynamic polynomial. The method specifically tests a stationarity null against a unit-root-type alternative, complementing unit-root tests with the opposite null hypothesis; therefore the analyst should connect this issue to the deterministic component, nonstandard reference distribution, and opposite null directions of companion tests. In the worked example, The trend KPSS statistic was 0.333 with reported p=0.010; the ordered G3 sequence rejected trend stationarity at the reported bound. That numerical result is useful only when the date index, training endpoint, and declared frequency remain unchanged. A defensible audit records the choice before seeing the final forecast error or p-value, checks the matching chart and software output, and explains whether the conclusion would change under a reasonable alternative. Related guidance appears in Augmented Dickey Fuller Test, Phillips Perron Test, ARIMA Model, but those methods answer different parts of the identification, estimation, diagnostic, or validation problem.
Model admissibility. For KPSS Test, this review point concerns how stationarity, invertibility, positivity, or rank restrictions protect the mathematical process. The method specifically tests a stationarity null against a unit-root-type alternative, complementing unit-root tests with the opposite null hypothesis; therefore the analyst should connect this issue to the deterministic component, nonstandard reference distribution, and opposite null directions of companion tests. In the worked example, The trend KPSS statistic was 0.333 with reported p=0.010; the ordered G3 sequence rejected trend stationarity at the reported bound. That numerical result is useful only when the date index, training endpoint, and declared frequency remain unchanged. A defensible audit records the choice before seeing the final forecast error or p-value, checks the matching chart and software output, and explains whether the conclusion would change under a reasonable alternative. Related guidance appears in Augmented Dickey Fuller Test, Phillips Perron Test, ARIMA Model, but those methods answer different parts of the identification, estimation, diagnostic, or validation problem.
Initial conditions. For KPSS Test, this review point concerns how early state values or unavailable lags influence fitting and why software defaults should be recorded. The method specifically tests a stationarity null against a unit-root-type alternative, complementing unit-root tests with the opposite null hypothesis; therefore the analyst should connect this issue to the deterministic component, nonstandard reference distribution, and opposite null directions of companion tests. In the worked example, The trend KPSS statistic was 0.333 with reported p=0.010; the ordered G3 sequence rejected trend stationarity at the reported bound. That numerical result is useful only when the date index, training endpoint, and declared frequency remain unchanged. A defensible audit records the choice before seeing the final forecast error or p-value, checks the matching chart and software output, and explains whether the conclusion would change under a reasonable alternative. Related guidance appears in Augmented Dickey Fuller Test, Phillips Perron Test, ARIMA Model, but those methods answer different parts of the identification, estimation, diagnostic, or validation problem.
Optimization convergence. For KPSS Test, this review point concerns how a returned result can still be unreliable when the likelihood optimizer stops at a boundary or local solution. The method specifically tests a stationarity null against a unit-root-type alternative, complementing unit-root tests with the opposite null hypothesis; therefore the analyst should connect this issue to the deterministic component, nonstandard reference distribution, and opposite null directions of companion tests. In the worked example, The trend KPSS statistic was 0.333 with reported p=0.010; the ordered G3 sequence rejected trend stationarity at the reported bound. That numerical result is useful only when the date index, training endpoint, and declared frequency remain unchanged. A defensible audit records the choice before seeing the final forecast error or p-value, checks the matching chart and software output, and explains whether the conclusion would change under a reasonable alternative. Related guidance appears in Augmented Dickey Fuller Test, Phillips Perron Test, ARIMA Model, but those methods answer different parts of the identification, estimation, diagnostic, or validation problem.
Residual mean. For KPSS Test, this review point concerns why systematic residual bias indicates an omitted level, trend, transformation, or deterministic component. The method specifically tests a stationarity null against a unit-root-type alternative, complementing unit-root tests with the opposite null hypothesis; therefore the analyst should connect this issue to the deterministic component, nonstandard reference distribution, and opposite null directions of companion tests. In the worked example, The trend KPSS statistic was 0.333 with reported p=0.010; the ordered G3 sequence rejected trend stationarity at the reported bound. That numerical result is useful only when the date index, training endpoint, and declared frequency remain unchanged. A defensible audit records the choice before seeing the final forecast error or p-value, checks the matching chart and software output, and explains whether the conclusion would change under a reasonable alternative. Related guidance appears in Augmented Dickey Fuller Test, Phillips Perron Test, ARIMA Model, but those methods answer different parts of the identification, estimation, diagnostic, or validation problem.
Residual autocorrelation. For KPSS Test, this review point concerns why remaining serial structure means the model has not extracted all predictable timing information. The method specifically tests a stationarity null against a unit-root-type alternative, complementing unit-root tests with the opposite null hypothesis; therefore the analyst should connect this issue to the deterministic component, nonstandard reference distribution, and opposite null directions of companion tests. In the worked example, The trend KPSS statistic was 0.333 with reported p=0.010; the ordered G3 sequence rejected trend stationarity at the reported bound. That numerical result is useful only when the date index, training endpoint, and declared frequency remain unchanged. A defensible audit records the choice before seeing the final forecast error or p-value, checks the matching chart and software output, and explains whether the conclusion would change under a reasonable alternative. Related guidance appears in Augmented Dickey Fuller Test, Phillips Perron Test, ARIMA Model, but those methods answer different parts of the identification, estimation, diagnostic, or validation problem.
Residual variance. For KPSS Test, this review point concerns how changing error spread affects standard errors, intervals, and the relative value of volatility models. The method specifically tests a stationarity null against a unit-root-type alternative, complementing unit-root tests with the opposite null hypothesis; therefore the analyst should connect this issue to the deterministic component, nonstandard reference distribution, and opposite null directions of companion tests. In the worked example, The trend KPSS statistic was 0.333 with reported p=0.010; the ordered G3 sequence rejected trend stationarity at the reported bound. That numerical result is useful only when the date index, training endpoint, and declared frequency remain unchanged. A defensible audit records the choice before seeing the final forecast error or p-value, checks the matching chart and software output, and explains whether the conclusion would change under a reasonable alternative. Related guidance appears in Augmented Dickey Fuller Test, Phillips Perron Test, ARIMA Model, but those methods answer different parts of the identification, estimation, diagnostic, or validation problem.
Residual distribution. For KPSS Test, this review point concerns why heavy tails and outliers can make normal-based intervals too narrow even when point forecasts look reasonable. The method specifically tests a stationarity null against a unit-root-type alternative, complementing unit-root tests with the opposite null hypothesis; therefore the analyst should connect this issue to the deterministic component, nonstandard reference distribution, and opposite null directions of companion tests. In the worked example, The trend KPSS statistic was 0.333 with reported p=0.010; the ordered G3 sequence rejected trend stationarity at the reported bound. That numerical result is useful only when the date index, training endpoint, and declared frequency remain unchanged. A defensible audit records the choice before seeing the final forecast error or p-value, checks the matching chart and software output, and explains whether the conclusion would change under a reasonable alternative. Related guidance appears in Augmented Dickey Fuller Test, Phillips Perron Test, ARIMA Model, but those methods answer different parts of the identification, estimation, diagnostic, or validation problem.
Outlier timing. For KPSS Test, this review point concerns how isolated shocks, additive outliers, and level shifts require different interpretations and interventions. The method specifically tests a stationarity null against a unit-root-type alternative, complementing unit-root tests with the opposite null hypothesis; therefore the analyst should connect this issue to the deterministic component, nonstandard reference distribution, and opposite null directions of companion tests. In the worked example, The trend KPSS statistic was 0.333 with reported p=0.010; the ordered G3 sequence rejected trend stationarity at the reported bound. That numerical result is useful only when the date index, training endpoint, and declared frequency remain unchanged. A defensible audit records the choice before seeing the final forecast error or p-value, checks the matching chart and software output, and explains whether the conclusion would change under a reasonable alternative. Related guidance appears in Augmented Dickey Fuller Test, Phillips Perron Test, ARIMA Model, but those methods answer different parts of the identification, estimation, diagnostic, or validation problem.
Structural breaks. For KPSS Test, this review point concerns how policy, measurement, market, or operational changes can invalidate a single stable-parameter model. The method specifically tests a stationarity null against a unit-root-type alternative, complementing unit-root tests with the opposite null hypothesis; therefore the analyst should connect this issue to the deterministic component, nonstandard reference distribution, and opposite null directions of companion tests. In the worked example, The trend KPSS statistic was 0.333 with reported p=0.010; the ordered G3 sequence rejected trend stationarity at the reported bound. That numerical result is useful only when the date index, training endpoint, and declared frequency remain unchanged. A defensible audit records the choice before seeing the final forecast error or p-value, checks the matching chart and software output, and explains whether the conclusion would change under a reasonable alternative. Related guidance appears in Augmented Dickey Fuller Test, Phillips Perron Test, ARIMA Model, but those methods answer different parts of the identification, estimation, diagnostic, or validation problem.
Training endpoint. For KPSS Test, this review point concerns why every tuning choice must use observations available at or before the declared forecast origin. The method specifically tests a stationarity null against a unit-root-type alternative, complementing unit-root tests with the opposite null hypothesis; therefore the analyst should connect this issue to the deterministic component, nonstandard reference distribution, and opposite null directions of companion tests. In the worked example, The trend KPSS statistic was 0.333 with reported p=0.010; the ordered G3 sequence rejected trend stationarity at the reported bound. That numerical result is useful only when the date index, training endpoint, and declared frequency remain unchanged. A defensible audit records the choice before seeing the final forecast error or p-value, checks the matching chart and software output, and explains whether the conclusion would change under a reasonable alternative. Related guidance appears in Augmented Dickey Fuller Test, Phillips Perron Test, ARIMA Model, but those methods answer different parts of the identification, estimation, diagnostic, or validation problem.
Holdout horizon. For KPSS Test, this review point concerns how one-step and twelve-step performance answer different operational forecasting questions. The method specifically tests a stationarity null against a unit-root-type alternative, complementing unit-root tests with the opposite null hypothesis; therefore the analyst should connect this issue to the deterministic component, nonstandard reference distribution, and opposite null directions of companion tests. In the worked example, The trend KPSS statistic was 0.333 with reported p=0.010; the ordered G3 sequence rejected trend stationarity at the reported bound. That numerical result is useful only when the date index, training endpoint, and declared frequency remain unchanged. A defensible audit records the choice before seeing the final forecast error or p-value, checks the matching chart and software output, and explains whether the conclusion would change under a reasonable alternative. Related guidance appears in Augmented Dickey Fuller Test, Phillips Perron Test, ARIMA Model, but those methods answer different parts of the identification, estimation, diagnostic, or validation problem.
Rolling-origin validation. For KPSS Test, this review point concerns how repeated forecast origins reveal whether one favorable split is representative. The method specifically tests a stationarity null against a unit-root-type alternative, complementing unit-root tests with the opposite null hypothesis; therefore the analyst should connect this issue to the deterministic component, nonstandard reference distribution, and opposite null directions of companion tests. In the worked example, The trend KPSS statistic was 0.333 with reported p=0.010; the ordered G3 sequence rejected trend stationarity at the reported bound. That numerical result is useful only when the date index, training endpoint, and declared frequency remain unchanged. A defensible audit records the choice before seeing the final forecast error or p-value, checks the matching chart and software output, and explains whether the conclusion would change under a reasonable alternative. Related guidance appears in Augmented Dickey Fuller Test, Phillips Perron Test, ARIMA Model, but those methods answer different parts of the identification, estimation, diagnostic, or validation problem.
Baseline comparison. For KPSS Test, this review point concerns why a naive, seasonal-naive, or simple smoothing forecast is needed before claiming improvement. The method specifically tests a stationarity null against a unit-root-type alternative, complementing unit-root tests with the opposite null hypothesis; therefore the analyst should connect this issue to the deterministic component, nonstandard reference distribution, and opposite null directions of companion tests. In the worked example, The trend KPSS statistic was 0.333 with reported p=0.010; the ordered G3 sequence rejected trend stationarity at the reported bound. That numerical result is useful only when the date index, training endpoint, and declared frequency remain unchanged. A defensible audit records the choice before seeing the final forecast error or p-value, checks the matching chart and software output, and explains whether the conclusion would change under a reasonable alternative. Related guidance appears in Augmented Dickey Fuller Test, Phillips Perron Test, ARIMA Model, but those methods answer different parts of the identification, estimation, diagnostic, or validation problem.
Metric selection. For KPSS Test, this review point concerns how MAE, RMSE, MAPE, information criteria, and statistical tests answer different questions. The method specifically tests a stationarity null against a unit-root-type alternative, complementing unit-root tests with the opposite null hypothesis; therefore the analyst should connect this issue to the deterministic component, nonstandard reference distribution, and opposite null directions of companion tests. In the worked example, The trend KPSS statistic was 0.333 with reported p=0.010; the ordered G3 sequence rejected trend stationarity at the reported bound. That numerical result is useful only when the date index, training endpoint, and declared frequency remain unchanged. A defensible audit records the choice before seeing the final forecast error or p-value, checks the matching chart and software output, and explains whether the conclusion would change under a reasonable alternative. Related guidance appears in Augmented Dickey Fuller Test, Phillips Perron Test, ARIMA Model, but those methods answer different parts of the identification, estimation, diagnostic, or validation problem.
Forecast intervals. For KPSS Test, this review point concerns why uncertainty should widen with horizon and why point accuracy alone is incomplete. The method specifically tests a stationarity null against a unit-root-type alternative, complementing unit-root tests with the opposite null hypothesis; therefore the analyst should connect this issue to the deterministic component, nonstandard reference distribution, and opposite null directions of companion tests. In the worked example, The trend KPSS statistic was 0.333 with reported p=0.010; the ordered G3 sequence rejected trend stationarity at the reported bound. That numerical result is useful only when the date index, training endpoint, and declared frequency remain unchanged. A defensible audit records the choice before seeing the final forecast error or p-value, checks the matching chart and software output, and explains whether the conclusion would change under a reasonable alternative. Related guidance appears in Augmented Dickey Fuller Test, Phillips Perron Test, ARIMA Model, but those methods answer different parts of the identification, estimation, diagnostic, or validation problem.
Small samples. For KPSS Test, this review point concerns how parameter count, lag loss, and unstable asymptotics become especially important with short histories. The method specifically tests a stationarity null against a unit-root-type alternative, complementing unit-root tests with the opposite null hypothesis; therefore the analyst should connect this issue to the deterministic component, nonstandard reference distribution, and opposite null directions of companion tests. In the worked example, The trend KPSS statistic was 0.333 with reported p=0.010; the ordered G3 sequence rejected trend stationarity at the reported bound. That numerical result is useful only when the date index, training endpoint, and declared frequency remain unchanged. A defensible audit records the choice before seeing the final forecast error or p-value, checks the matching chart and software output, and explains whether the conclusion would change under a reasonable alternative. Related guidance appears in Augmented Dickey Fuller Test, Phillips Perron Test, ARIMA Model, but those methods answer different parts of the identification, estimation, diagnostic, or validation problem.
Large samples. For KPSS Test, this review point concerns why tiny p-values can coexist with operationally negligible effects and why diagnostics still matter. The method specifically tests a stationarity null against a unit-root-type alternative, complementing unit-root tests with the opposite null hypothesis; therefore the analyst should connect this issue to the deterministic component, nonstandard reference distribution, and opposite null directions of companion tests. In the worked example, The trend KPSS statistic was 0.333 with reported p=0.010; the ordered G3 sequence rejected trend stationarity at the reported bound. That numerical result is useful only when the date index, training endpoint, and declared frequency remain unchanged. A defensible audit records the choice before seeing the final forecast error or p-value, checks the matching chart and software output, and explains whether the conclusion would change under a reasonable alternative. Related guidance appears in Augmented Dickey Fuller Test, Phillips Perron Test, ARIMA Model, but those methods answer different parts of the identification, estimation, diagnostic, or validation problem.
Multiple series. For KPSS Test, this review point concerns how comparing or combining series requires aligned calendars and consistent transformations. The method specifically tests a stationarity null against a unit-root-type alternative, complementing unit-root tests with the opposite null hypothesis; therefore the analyst should connect this issue to the deterministic component, nonstandard reference distribution, and opposite null directions of companion tests. In the worked example, The trend KPSS statistic was 0.333 with reported p=0.010; the ordered G3 sequence rejected trend stationarity at the reported bound. That numerical result is useful only when the date index, training endpoint, and declared frequency remain unchanged. A defensible audit records the choice before seeing the final forecast error or p-value, checks the matching chart and software output, and explains whether the conclusion would change under a reasonable alternative. Related guidance appears in Augmented Dickey Fuller Test, Phillips Perron Test, ARIMA Model, but those methods answer different parts of the identification, estimation, diagnostic, or validation problem.
Exogenous variables. For KPSS Test, this review point concerns how external predictors must be known or forecast at future horizons to support genuine forecasts. The method specifically tests a stationarity null against a unit-root-type alternative, complementing unit-root tests with the opposite null hypothesis; therefore the analyst should connect this issue to the deterministic component, nonstandard reference distribution, and opposite null directions of companion tests. In the worked example, The trend KPSS statistic was 0.333 with reported p=0.010; the ordered G3 sequence rejected trend stationarity at the reported bound. That numerical result is useful only when the date index, training endpoint, and declared frequency remain unchanged. A defensible audit records the choice before seeing the final forecast error or p-value, checks the matching chart and software output, and explains whether the conclusion would change under a reasonable alternative. Related guidance appears in Augmented Dickey Fuller Test, Phillips Perron Test, ARIMA Model, but those methods answer different parts of the identification, estimation, diagnostic, or validation problem.
Data leakage. For KPSS Test, this review point concerns how centered moving averages, full-sample scaling, or future-informed imputation can contaminate validation. The method specifically tests a stationarity null against a unit-root-type alternative, complementing unit-root tests with the opposite null hypothesis; therefore the analyst should connect this issue to the deterministic component, nonstandard reference distribution, and opposite null directions of companion tests. In the worked example, The trend KPSS statistic was 0.333 with reported p=0.010; the ordered G3 sequence rejected trend stationarity at the reported bound. That numerical result is useful only when the date index, training endpoint, and declared frequency remain unchanged. A defensible audit records the choice before seeing the final forecast error or p-value, checks the matching chart and software output, and explains whether the conclusion would change under a reasonable alternative. Related guidance appears in Augmented Dickey Fuller Test, Phillips Perron Test, ARIMA Model, but those methods answer different parts of the identification, estimation, diagnostic, or validation problem.
Software defaults. For KPSS Test, this review point concerns why default trends, lag selection, missing-value handling, and parameter signs can differ across programs. The method specifically tests a stationarity null against a unit-root-type alternative, complementing unit-root tests with the opposite null hypothesis; therefore the analyst should connect this issue to the deterministic component, nonstandard reference distribution, and opposite null directions of companion tests. In the worked example, The trend KPSS statistic was 0.333 with reported p=0.010; the ordered G3 sequence rejected trend stationarity at the reported bound. That numerical result is useful only when the date index, training endpoint, and declared frequency remain unchanged. A defensible audit records the choice before seeing the final forecast error or p-value, checks the matching chart and software output, and explains whether the conclusion would change under a reasonable alternative. Related guidance appears in Augmented Dickey Fuller Test, Phillips Perron Test, ARIMA Model, but those methods answer different parts of the identification, estimation, diagnostic, or validation problem.
Numerical precision. For KPSS Test, this review point concerns why displayed rounding should not replace full-precision calculations or reconciliation tables. The method specifically tests a stationarity null against a unit-root-type alternative, complementing unit-root tests with the opposite null hypothesis; therefore the analyst should connect this issue to the deterministic component, nonstandard reference distribution, and opposite null directions of companion tests. In the worked example, The trend KPSS statistic was 0.333 with reported p=0.010; the ordered G3 sequence rejected trend stationarity at the reported bound. That numerical result is useful only when the date index, training endpoint, and declared frequency remain unchanged. A defensible audit records the choice before seeing the final forecast error or p-value, checks the matching chart and software output, and explains whether the conclusion would change under a reasonable alternative. Related guidance appears in Augmented Dickey Fuller Test, Phillips Perron Test, ARIMA Model, but those methods answer different parts of the identification, estimation, diagnostic, or validation problem.
Chart interpretation. For KPSS Test, this review point concerns how the source-series, fitted-output, residual-path, residual-ACF, and metric charts answer different questions. The method specifically tests a stationarity null against a unit-root-type alternative, complementing unit-root tests with the opposite null hypothesis; therefore the analyst should connect this issue to the deterministic component, nonstandard reference distribution, and opposite null directions of companion tests. In the worked example, The trend KPSS statistic was 0.333 with reported p=0.010; the ordered G3 sequence rejected trend stationarity at the reported bound. That numerical result is useful only when the date index, training endpoint, and declared frequency remain unchanged. A defensible audit records the choice before seeing the final forecast error or p-value, checks the matching chart and software output, and explains whether the conclusion would change under a reasonable alternative. Related guidance appears in Augmented Dickey Fuller Test, Phillips Perron Test, ARIMA Model, but those methods answer different parts of the identification, estimation, diagnostic, or validation problem.
Chart accessibility. For KPSS Test, this review point concerns why meaningful alt text should state the variable, method, comparison, and visible conclusion. The method specifically tests a stationarity null against a unit-root-type alternative, complementing unit-root tests with the opposite null hypothesis; therefore the analyst should connect this issue to the deterministic component, nonstandard reference distribution, and opposite null directions of companion tests. In the worked example, The trend KPSS statistic was 0.333 with reported p=0.010; the ordered G3 sequence rejected trend stationarity at the reported bound. That numerical result is useful only when the date index, training endpoint, and declared frequency remain unchanged. A defensible audit records the choice before seeing the final forecast error or p-value, checks the matching chart and software output, and explains whether the conclusion would change under a reasonable alternative. Related guidance appears in Augmented Dickey Fuller Test, Phillips Perron Test, ARIMA Model, but those methods answer different parts of the identification, estimation, diagnostic, or validation problem.
Download integrity. For KPSS Test, this review point concerns why each PDF and workbook must belong only to the matching topic and preserve the same sample and specification. The method specifically tests a stationarity null against a unit-root-type alternative, complementing unit-root tests with the opposite null hypothesis; therefore the analyst should connect this issue to the deterministic component, nonstandard reference distribution, and opposite null directions of companion tests. In the worked example, The trend KPSS statistic was 0.333 with reported p=0.010; the ordered G3 sequence rejected trend stationarity at the reported bound. That numerical result is useful only when the date index, training endpoint, and declared frequency remain unchanged. A defensible audit records the choice before seeing the final forecast error or p-value, checks the matching chart and software output, and explains whether the conclusion would change under a reasonable alternative. Related guidance appears in Augmented Dickey Fuller Test, Phillips Perron Test, ARIMA Model, but those methods answer different parts of the identification, estimation, diagnostic, or validation problem.
Reproducibility. For KPSS Test, this review point concerns how a complete audit trail records data version, code version, random seed, specification, and exported results. The method specifically tests a stationarity null against a unit-root-type alternative, complementing unit-root tests with the opposite null hypothesis; therefore the analyst should connect this issue to the deterministic component, nonstandard reference distribution, and opposite null directions of companion tests. In the worked example, The trend KPSS statistic was 0.333 with reported p=0.010; the ordered G3 sequence rejected trend stationarity at the reported bound. That numerical result is useful only when the date index, training endpoint, and declared frequency remain unchanged. A defensible audit records the choice before seeing the final forecast error or p-value, checks the matching chart and software output, and explains whether the conclusion would change under a reasonable alternative. Related guidance appears in Augmented Dickey Fuller Test, Phillips Perron Test, ARIMA Model, but those methods answer different parts of the identification, estimation, diagnostic, or validation problem.
Decision language. For KPSS Test, this review point concerns why fail-to-reject wording is different from proving a null model or exact equality. The method specifically tests a stationarity null against a unit-root-type alternative, complementing unit-root tests with the opposite null hypothesis; therefore the analyst should connect this issue to the deterministic component, nonstandard reference distribution, and opposite null directions of companion tests. In the worked example, The trend KPSS statistic was 0.333 with reported p=0.010; the ordered G3 sequence rejected trend stationarity at the reported bound. That numerical result is useful only when the date index, training endpoint, and declared frequency remain unchanged. A defensible audit records the choice before seeing the final forecast error or p-value, checks the matching chart and software output, and explains whether the conclusion would change under a reasonable alternative. Related guidance appears in Augmented Dickey Fuller Test, Phillips Perron Test, ARIMA Model, but those methods answer different parts of the identification, estimation, diagnostic, or validation problem.
Practical significance. For KPSS Test, this review point concerns how statistical evidence must be connected to the size and consequence of the dynamic effect. The method specifically tests a stationarity null against a unit-root-type alternative, complementing unit-root tests with the opposite null hypothesis; therefore the analyst should connect this issue to the deterministic component, nonstandard reference distribution, and opposite null directions of companion tests. In the worked example, The trend KPSS statistic was 0.333 with reported p=0.010; the ordered G3 sequence rejected trend stationarity at the reported bound. That numerical result is useful only when the date index, training endpoint, and declared frequency remain unchanged. A defensible audit records the choice before seeing the final forecast error or p-value, checks the matching chart and software output, and explains whether the conclusion would change under a reasonable alternative. Related guidance appears in Augmented Dickey Fuller Test, Phillips Perron Test, ARIMA Model, but those methods answer different parts of the identification, estimation, diagnostic, or validation problem.
Sensitivity analysis. For KPSS Test, this review point concerns how alternate lag orders, transformations, break dates, and seasonal periods test robustness. The method specifically tests a stationarity null against a unit-root-type alternative, complementing unit-root tests with the opposite null hypothesis; therefore the analyst should connect this issue to the deterministic component, nonstandard reference distribution, and opposite null directions of companion tests. In the worked example, The trend KPSS statistic was 0.333 with reported p=0.010; the ordered G3 sequence rejected trend stationarity at the reported bound. That numerical result is useful only when the date index, training endpoint, and declared frequency remain unchanged. A defensible audit records the choice before seeing the final forecast error or p-value, checks the matching chart and software output, and explains whether the conclusion would change under a reasonable alternative. Related guidance appears in Augmented Dickey Fuller Test, Phillips Perron Test, ARIMA Model, but those methods answer different parts of the identification, estimation, diagnostic, or validation problem.
Model parsimony. For KPSS Test, this review point concerns why unnecessary parameters increase variance, complicate interpretation, and can worsen future performance. The method specifically tests a stationarity null against a unit-root-type alternative, complementing unit-root tests with the opposite null hypothesis; therefore the analyst should connect this issue to the deterministic component, nonstandard reference distribution, and opposite null directions of companion tests. In the worked example, The trend KPSS statistic was 0.333 with reported p=0.010; the ordered G3 sequence rejected trend stationarity at the reported bound. That numerical result is useful only when the date index, training endpoint, and declared frequency remain unchanged. A defensible audit records the choice before seeing the final forecast error or p-value, checks the matching chart and software output, and explains whether the conclusion would change under a reasonable alternative. Related guidance appears in Augmented Dickey Fuller Test, Phillips Perron Test, ARIMA Model, but those methods answer different parts of the identification, estimation, diagnostic, or validation problem.
Model underfit. For KPSS Test, this review point concerns why a simple model can leave visible structure even when its in-sample error appears acceptable. The method specifically tests a stationarity null against a unit-root-type alternative, complementing unit-root tests with the opposite null hypothesis; therefore the analyst should connect this issue to the deterministic component, nonstandard reference distribution, and opposite null directions of companion tests. In the worked example, The trend KPSS statistic was 0.333 with reported p=0.010; the ordered G3 sequence rejected trend stationarity at the reported bound. That numerical result is useful only when the date index, training endpoint, and declared frequency remain unchanged. A defensible audit records the choice before seeing the final forecast error or p-value, checks the matching chart and software output, and explains whether the conclusion would change under a reasonable alternative. Related guidance appears in Augmented Dickey Fuller Test, Phillips Perron Test, ARIMA Model, but those methods answer different parts of the identification, estimation, diagnostic, or validation problem.
Model overfit. For KPSS Test, this review point concerns why an elaborate model can absorb historical noise and fail at later forecast origins. The method specifically tests a stationarity null against a unit-root-type alternative, complementing unit-root tests with the opposite null hypothesis; therefore the analyst should connect this issue to the deterministic component, nonstandard reference distribution, and opposite null directions of companion tests. In the worked example, The trend KPSS statistic was 0.333 with reported p=0.010; the ordered G3 sequence rejected trend stationarity at the reported bound. That numerical result is useful only when the date index, training endpoint, and declared frequency remain unchanged. A defensible audit records the choice before seeing the final forecast error or p-value, checks the matching chart and software output, and explains whether the conclusion would change under a reasonable alternative. Related guidance appears in Augmented Dickey Fuller Test, Phillips Perron Test, ARIMA Model, but those methods answer different parts of the identification, estimation, diagnostic, or validation problem.
Documentation. For KPSS Test, this review point concerns why the final report should state frequency, sample, transformations, lag orders, diagnostics, holdout design, and software. The method specifically tests a stationarity null against a unit-root-type alternative, complementing unit-root tests with the opposite null hypothesis; therefore the analyst should connect this issue to the deterministic component, nonstandard reference distribution, and opposite null directions of companion tests. In the worked example, The trend KPSS statistic was 0.333 with reported p=0.010; the ordered G3 sequence rejected trend stationarity at the reported bound. That numerical result is useful only when the date index, training endpoint, and declared frequency remain unchanged. A defensible audit records the choice before seeing the final forecast error or p-value, checks the matching chart and software output, and explains whether the conclusion would change under a reasonable alternative. Related guidance appears in Augmented Dickey Fuller Test, Phillips Perron Test, ARIMA Model, but those methods answer different parts of the identification, estimation, diagnostic, or validation problem.
Operational use. For KPSS Test, this review point concerns how update frequency, retraining rules, monitoring thresholds, and fallback forecasts turn analysis into a maintainable process. The method specifically tests a stationarity null against a unit-root-type alternative, complementing unit-root tests with the opposite null hypothesis; therefore the analyst should connect this issue to the deterministic component, nonstandard reference distribution, and opposite null directions of companion tests. In the worked example, The trend KPSS statistic was 0.333 with reported p=0.010; the ordered G3 sequence rejected trend stationarity at the reported bound. That numerical result is useful only when the date index, training endpoint, and declared frequency remain unchanged. A defensible audit records the choice before seeing the final forecast error or p-value, checks the matching chart and software output, and explains whether the conclusion would change under a reasonable alternative. Related guidance appears in Augmented Dickey Fuller Test, Phillips Perron Test, ARIMA Model, but those methods answer different parts of the identification, estimation, diagnostic, or validation problem.
Ethical interpretation. For KPSS Test, this review point concerns why forecasts and time-series tests should not be presented as certainty when decisions affect people or resources. The method specifically tests a stationarity null against a unit-root-type alternative, complementing unit-root tests with the opposite null hypothesis; therefore the analyst should connect this issue to the deterministic component, nonstandard reference distribution, and opposite null directions of companion tests. In the worked example, The trend KPSS statistic was 0.333 with reported p=0.010; the ordered G3 sequence rejected trend stationarity at the reported bound. That numerical result is useful only when the date index, training endpoint, and declared frequency remain unchanged. A defensible audit records the choice before seeing the final forecast error or p-value, checks the matching chart and software output, and explains whether the conclusion would change under a reasonable alternative. Related guidance appears in Augmented Dickey Fuller Test, Phillips Perron Test, ARIMA Model, but those methods answer different parts of the identification, estimation, diagnostic, or validation problem.
Internal navigation. For KPSS Test, this review point concerns how links to related methods help readers move from identification to estimation, diagnostics, and forecast evaluation. The method specifically tests a stationarity null against a unit-root-type alternative, complementing unit-root tests with the opposite null hypothesis; therefore the analyst should connect this issue to the deterministic component, nonstandard reference distribution, and opposite null directions of companion tests. In the worked example, The trend KPSS statistic was 0.333 with reported p=0.010; the ordered G3 sequence rejected trend stationarity at the reported bound. That numerical result is useful only when the date index, training endpoint, and declared frequency remain unchanged. A defensible audit records the choice before seeing the final forecast error or p-value, checks the matching chart and software output, and explains whether the conclusion would change under a reasonable alternative. Related guidance appears in Augmented Dickey Fuller Test, Phillips Perron Test, ARIMA Model, but those methods answer different parts of the identification, estimation, diagnostic, or validation problem.
What should KPSS Test be compared with?
Method choice and robustness checks.
| # | Comparison | Reason |
|---|---|---|
| 1 | Compare the unit-root null with the complementary KPSS stationarity null. | KPSS Test remains the focal method; the comparison prevents a mismatch between the research question and the software command. |
| 2 | Compare level, trend-adjusted, and differenced specifications. | KPSS Test remains the focal method; the comparison prevents a mismatch between the research question and the software command. |
| 3 | Compare conclusions before and after accounting for possible structural breaks. | KPSS Test remains the focal method; the comparison prevents a mismatch between the research question and the software command. |
How to report KPSS Test
A complete, restrained result statement.
Reporting template
“A KPSS Test analysis was completed on 649 records from dataset(100).csv. G3 was the primary ordered sequence, G2 was used where a second aligned variable was required, records 1–584 were used for estimation, and records 585–649 were used for validation where applicable. The trend KPSS statistic was 0.333 with reported p=0.010; the ordered G3 sequence rejected trend stationarity at the reported bound. The date frequency, transformation, deterministic terms, lag or seasonal specification, residual diagnostics, software, and matching files were recorded. The conclusion is limited to this specification and does not establish certainty beyond the analyzed period.”
Include
Dataset filename, row count, sequence definition, variable roles, transformation, lag order, computational cycle where used, formula, exact result, p-value or accuracy metric, diagnostics, validation horizon, software, and limitations.
Avoid
Claims of proof from nonsignificance, causal language from predictive precedence, arbitrary random train/test splits, unlabeled software defaults, hidden missing-value deletion, or charts without matching numerical evidence.
KPSS Test downloads
Only files assigned to this topic in the supplied workbook.
KPSS Test frequently asked questions
Method-specific answers for publication review.
What does KPSS Test measure?
KPSS Test tests a stationarity null against a unit-root-type alternative, complementing unit-root tests with the opposite null hypothesis. It should be interpreted through its exact formula, data frequency, lag or horizon choices, and the diagnostic evidence shown in this article.
When should KPSS Test be used?
Use KPSS Test when the research question directly matches that purpose and the chronological design can satisfy the listed assumptions. Do not choose it merely because the software menu contains a similarly named option.
What assumptions matter most for KPSS Test?
The most important conditions are correct time ordering, explicit frequency, defensible lag or seasonal structure, suitable deterministic terms, and a validation plan that never uses future observations during fitting.
How is the KPSS Test result interpreted?
The trend KPSS statistic was 0.333 with reported p=0.010; the ordered G3 sequence rejected trend stationarity at the reported bound. The result is conditional on the displayed specification and does not prove that every alternative model or data transformation would lead to the same conclusion.
Can KPSS Test be completed in Python?
Yes. The Python section gives a reproducible core calculation. Preserve the date index, software version, parameter choices, and holdout dates when comparing the output with the supplied PDF.
Can KPSS Test be completed in R?
Yes. The R section states the corresponding workflow. Differences in default initialization, signs, critical values, or missing-value handling must be reconciled before declaring the programs inconsistent.
How should SPSS be used for KPSS Test?
SPSS should be used only for procedures it genuinely supports. The workflow explains when standard dialogs are sufficient and when validated Python/R integration or a transparent auxiliary regression is required.
How can Excel support KPSS Test?
Excel is valuable for a visible audit trail. Named parameter cells, explicit lag ranges, separate training and holdout rows, and formula checks reduce hidden range errors.
What is the most common KPSS Test mistake?
The most common mistake is interpreting a statistic or forecast without verifying the underlying sequence, specification, residual diagnostics, and validation horizon.
How should charts be interpreted for KPSS Test?
Read the first chart as the data or method context, later charts as fitted behavior and residual evidence, and the metrics chart as a summary. No single image replaces the formal calculation.
How should KPSS Test be reported?
Report the dataset filename, row count, sequence definition, transformations, model or test specification, result values, diagnostics, software, holdout design, and a conclusion that matches the null hypothesis or forecast target.
Which internal guides are related to KPSS Test?
The most relevant internal guides are Augmented Dickey Fuller Test, Phillips Perron Test, ARIMA Model, SARIMA Model, Engle Granger Cointegration Test. Each is linked in the related-guides panel and used only because it supports the same time-series workflow.